1732
TRANSCRIPT

®
Fixed Orifice Double Regulating Valve
Flow Data Fig 1732

®
In this flow data manual we have endeavoured to make the information as accurate aspossible and we cannot accept any responsibility should it be found that in any respectthe information is inaccurate or incomplete or becomes so as a result of furtherdevelopments or otherwise.
© Crane Ltd 2005
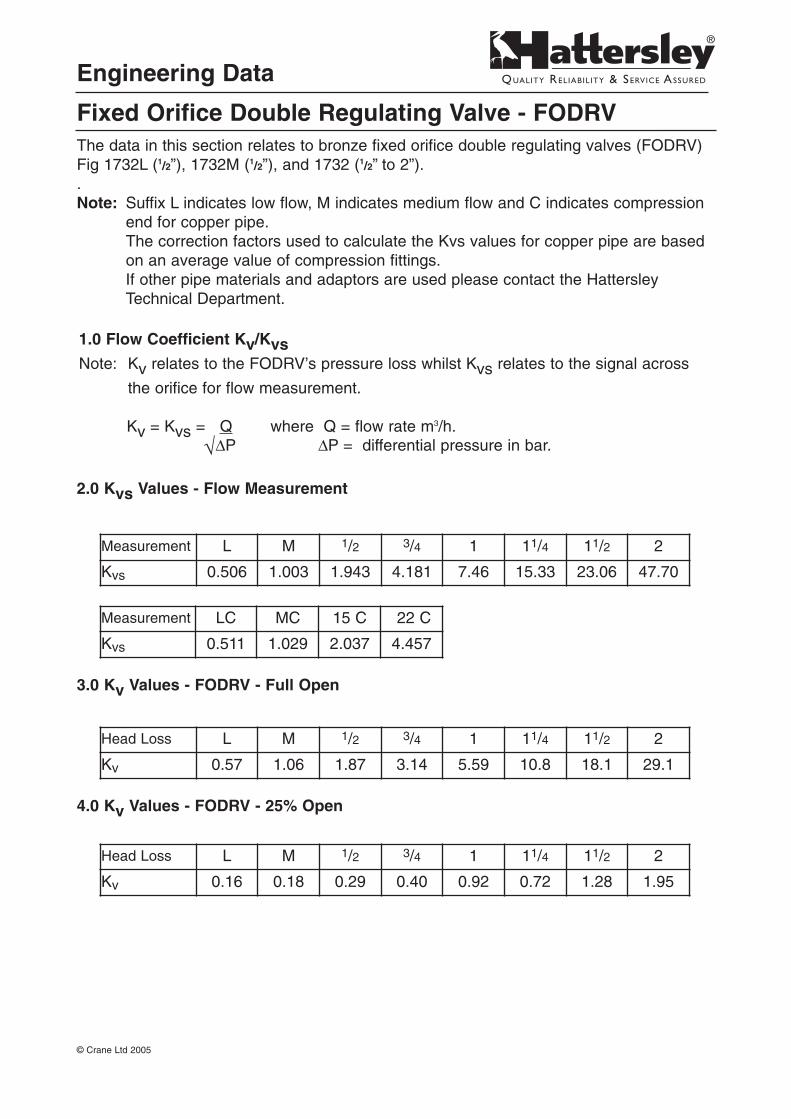
The data in this section relates to bronze fixed orifice double regulating valves (FODRV)Fig 1732L (1/2”), 1732M (1/2”), and 1732 (1/2” to 2”)..Note: Suffix L indicates low flow, M indicates medium flow and C indicates compression
end for copper pipe.The correction factors used to calculate the Kvs values for copper pipe are based on an average value of compression fittings.If other pipe materials and adaptors are used please contact the Hattersley Technical Department.
1.0 Flow Coefficient Kv/KvsNote: Kv relates to the FODRV’s pressure loss whilst Kvs relates to the signal across
the orifice for flow measurement.
Kv = Kvs = Q where Q = flow rate m3/h.√∆P ∆P = differential pressure in bar.
2.0 Kvs Values - Flow Measurement
3.0 Kv Values - FODRV - Full Open
4.0 Kv Values - FODRV - 25% Open
®
Engineering Data
Fixed Orifice Double Regulating Valve - FODRV
© Crane Ltd 2005
Measurement L M 1/2 3/4 1 11/4 11/2 2
Kvs 0.506 1.003 1.943 4.181 7.46 15.33 23.06 47.70
Measurement LC MC 15 C 22 C
Kvs 0.511 1.029 2.037 4.457
Head Loss L M 1/2 3/4 1 11/4 11/2 2
Kv 0.57 1.06 1.87 3.14 5.59 10.8 18.1 29.1
Head Loss L M 1/2 3/4 1 11/4 11/2 2
Kv 0.16 0.18 0.29 0.40 0.92 0.72 1.28 1.95

®
Engineering Data
Fixed Orifice Double Regulating Valve - FODRV
© Crane Ltd 2005
5.0 Valve Sizing
The design method for sizing components is to establish firstly, the mass flow rateneeded to carry the required amount of heat to a zone and secondly, to relate this to anappropriate flow velocity or pressure loss per unit length. A pipe size can then be selectedand all components are line size.
In the case of metering stations and DRV’s the same rule applies because their design isbased also on appropriate flow velocities and pipe pressure losses.
As the power of the pump is determined from the index circuit, it is of no consequencewhat the head loss is through the DRV’s other than fully open.Note that the delivery of the pump is based on the requirement of the complete system.
6.0 ß Ratio
The ß ratio is the ratio of the orifice diameter to pipe bore diameter and this has beencarefully selected for each metering station to minimise the effects of variations in internalbores or where an incorrect grade of pipe has been used and to cater for lower velocitiessometimes encountered in smaller pipe sizes.
7.0 Installation
Straight Pipe Lengths
It is important that there should be minimum of 5 diameters of straight pipe upstream and 2 diameters of straight pipe downstream, without intrusions, of the Fig 1732 for repeatable performance.
Less than these diameters will increase inaccuracy to an unacceptable level, the valueof which is unpredicable as it is not a stable value.

®
Fig
ure
1732
LC
,173
2L,1
732C
and
1732
Kv
Val
ues
Key
25%
Op
enP
osi
tio
n
No
teK
v=Q
whe
reQ
=flo
wra
tein
m3 /h
√ ∆P
and
∆P=
head
loss
for
Kv
inba
r
©C
rane
Ltd
2005
Val
veP
osi
tio
n4
0.57
1.06
1.87
3.14
5.59
10.8
18.1
29.1
3.5
0.5
4
0.93
1.64
2.80
4.82
10.1
16.8
26.6
30.
42
0.57
1.27
2.11
3.42
8.81
14.5
23.5
2.5
0.39
0.48
0.85
1.49
2.29
6.59
9.89
18.5
20.
33
0.40
0.63
0.80
1.77
3.52
5.00
12.0
1.5
0.27
0.30
0.46
0.59
1.34
1.17
2.20
5.55
10.
16
0.18
0.29
0.40
0.92
0.72
1.28
1.95
Val
veS
ize
15&
1 /2
Lo
w
15&
1 /2
Med
15&
1 /2
22&
3 /4
1 11/4
11/2 2
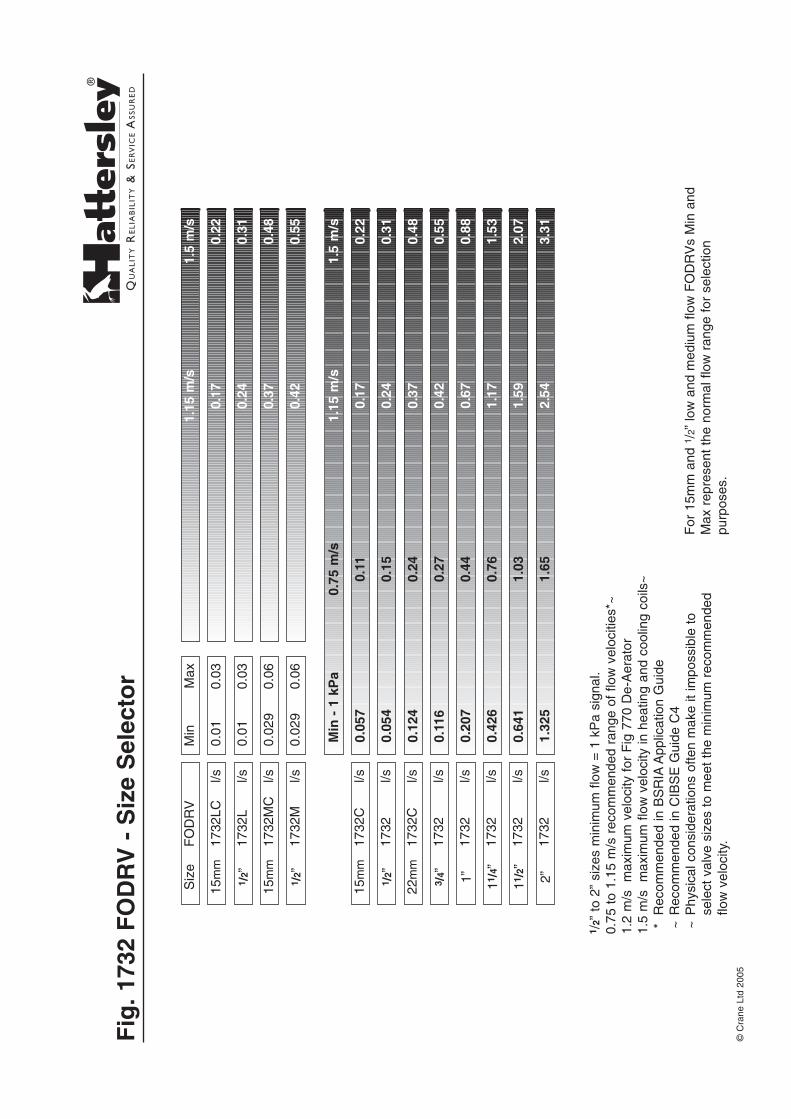
Fig
.173
2F
OD
RV
-S
ize
Sel
ecto
r
®
1 /2”
to2”
size
sm
inim
umflo
w=
1kP
asi
gnal
.0.
75to
1.15
m/s
reco
mm
ende
dra
nge
offlo
wve
loci
ties*
~1.
2m
/sm
axim
umve
loci
tyfo
rF
ig77
0D
e-A
erat
or1.
5m
/sm
axim
umflo
wve
loci
tyin
heat
ing
and
cool
ing
coils
~*
Rec
omm
ende
din
BS
RIA
App
licat
ion
Gui
de~
Rec
omm
ende
din
CIB
SE
Gui
deC
4~
Phy
sica
lcon
side
ratio
nsof
ten
mak
eit
impo
ssib
leto
sele
ctva
lve
size
sto
mee
tth
em
inim
umre
com
men
ded
flow
velo
city
.
For
15m
man
d1 /
2”lo
wan
dm
ediu
mflo
wF
OD
RV
sM
inan
dM
axre
pres
ent
the
norm
alflo
wra
nge
for
sele
ctio
npu
rpos
es.
©C
rane
Ltd
2005
0.01
0.03
0.02
90.
06
0.02
90.
06
Min
Max
0.01
0.03
15m
m17
32C
l/s
22m
m17
32C
l/s
1 /2 ”
1732
l/s
3 /4 ”
1732
l/s
1”17
32l/s
11/ 4
”17
32l/s
2”17
32l/s
11/ 2
”17
32l/s
Siz
eF
OD
RV
15m
m17
32LC
l/s
1 /2 ”
1732
Ll/s
15m
m17
32M
Cl/s
1 /2 ”
1732
Ml/s
1.32
51.
652.
543.
31
Min
-1
kPa
0.75
m/s
1.15
m/s
1.5
m/s
0.05
70.
110.
170.
22
0.05
40.
150.
240.
31
0.12
40.
240.
370.
48
0.11
60.
270.
420.
55
0.20
70.
440.
670.
88
0.42
60.
761.
171.
53
0.64
11.
031.
592.
07
1.15
m/s
1.5
m/s
0.17
0.22
0.24
0.31
0.37
0.48
0.42
0.55
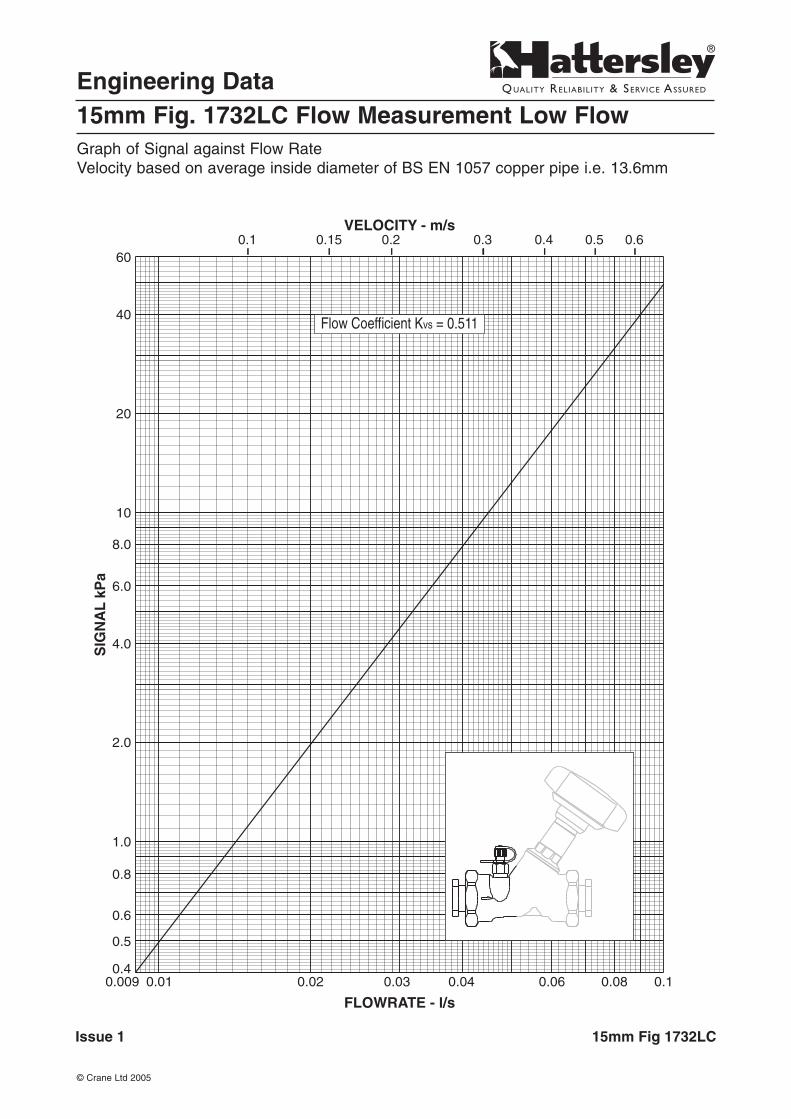
Engineering Data15mm Fig. 1732LC Flow Measurement Low FlowGraph of Signal against Flow RateVelocity based on average inside diameter of BS EN 1057 copper pipe i.e. 13.6mm
®
© Crane Ltd 2005
60
40
20
10
8.0
6.0
4.0
2.0
1.0
0.8
0.6
0.4
0.5
SIG
NA
LkP
a
0.009 0.01 0.02 0.03 0.04 0.06 0.08 0.1
FLOWRATE - l/s
0.1 0.15 0.2 0.3 0.4 0.5 0.6VELOCITY - m/s
Issue 1 15mm Fig 1732LC
Flow Coefficient Kvs = 0.511
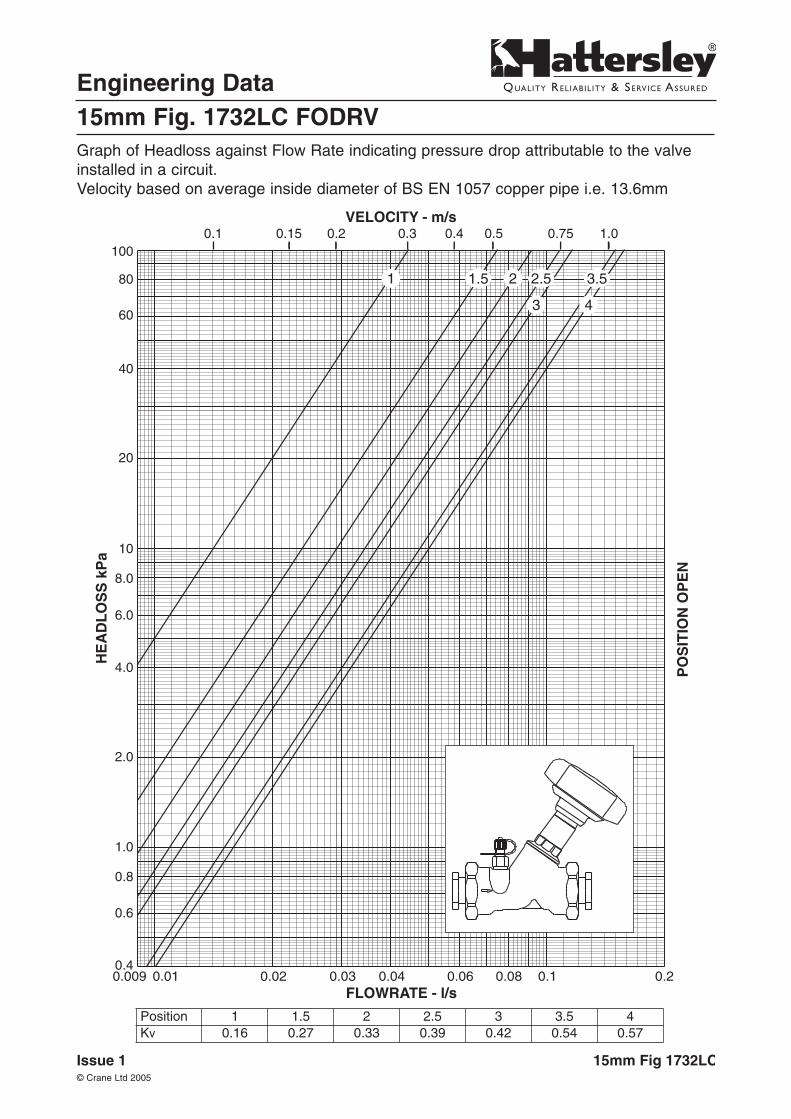
Engineering Data15mm Fig. 1732LC FODRVGraph of Headloss against Flow Rate indicating pressure drop attributable to the valveinstalled in a circuit.Velocity based on average inside diameter of BS EN 1057 copper pipe i.e. 13.6mm
®
© Crane Ltd 2005
100
80
60
40
20
10
8.0
6.0
4.0
2.0
1.0
0.8
0.6
0.4 0.009 0.01 0.02 0.03 0.04 0.06 0.08 0.1 0.2
FLOWRATE - l/s
0.1 0.15 0.2 0.3 0.4 0.5 0.75 1.0VELOCITY - m/s
HE
AD
LO
SS
kPa
15mm Fig 1732LCIssue 1
PO
SIT
ION
OP
EN
3
21.51 2.5
4
3.5
Position 1 1.5 2 2.5 3 3.5 4Kv 0.16 0.27 0.33 0.39 0.42 0.54 0.57

Engineering Data1/2” Fig. 1732L Flow Measurement Low FlowGraph of Signal against Flow RateVelocity based on average inside diameter of BS 1387 Medium Grade pipe.
®
© Crane Ltd 2005
60
40
20
10
8.0
6.0
4.0
2.0
1.0
0.8
0.6
0.4
0.5
SIG
NA
LkP
a
0.009 0.01 0.02 0.03 0.04 0.06 0.08 0.1
FLOWRATE - l/s
0.05 0.1 0.15 0.2 0.3 0.4 0.5VELOCITY - m/s
Issue 1 1/2" Fig 1732L
Flow Coefficient Kvs = 0.506

Engineering Data1/2” Fig. 1732L FODRVGraph of Headloss against Flow Rate indicating pressure drop attributable to the valveinstalled in a circuit.Velocity based on average inside diameter of BS 1387 Medium Grade pipe.
®
© Crane Ltd 2005
100
80
60
40
20
10
8.0
6.0
4.0
2.0
1.0
0.8
0.6
0.4 0.009 0.01 0.02 0.03 0.04 0.06 0.08 0.1 0.2
FLOWRATE - l/s
0.05 0.1 0.15 0.2 0.3 0.4 0.5 0.75VELOCITY - m/s
HE
AD
LO
SS
kPa
1/2" Fig 1732LIssue 1
PO
SIT
ION
OP
EN
3
21.51 2.5
4
3.5
Position 1 1.5 2 2.5 3 3.5 4Kv 0.16 0.27 0.33 0.39 0.42 0.54 0.57

Engineering Data15mm Fig. 1732MC Flow Measurement Medium FlowGraph of Signal against Flow RateVelocity based on average inside diameter of BS EN 1057 copper pipe i.e. 13.6mm
®
© Crane Ltd 2005
60
40
20
10
8.0
6.0
4.0
2.0
1.0
0.8
0.6
0.4
0.5
SIG
NA
LkP
a
0.01 0.02 0.03 0.04 0.06 0.08 0.1 0.2 FLOWRATE - l/s
0.1 0.15 0.2 0.3 0.4 0.5 0.75 1.0VELOCITY - m/s
Issue 1 15mm Fig 1732MC
Flow Coefficient Kvs = 1.029

Engineering Data15mm Fig. 1732MC FODRVGraph of Headloss against Flow Rate indicating pressure drop attributable to the valveinstalled in a circuit.Velocity based on average inside diameter of BS EN 1057 copper pipe i.e. 13.6mm
®
© Crane Ltd 2005
100
80
60
40
20
10
8.0
6.0
4.0
2.0
1.0
0.8
0.6
0.4 0.01 0.02 0.03 0.04 0.06 0.08 0.1 0.2
FLOWRATE - l/s
0.1 0.15 0.2 0.3 0.4 0.5 0.75 1.0VELOCITY - m/s
HE
AD
LO
SS
kPa
15mm Fig 1732MCIssue 1
PO
SIT
ION
OP
EN
321.51 2.5
4
3.5
Position 1 1.5 2 2.5 3 3.5 4Kv 0.18 0.30 0.400 0.48 0.57 0.93 1.06

Engineering Data1/2” Fig. 1732M Flow Measurement Medium Flow Graph of Signal against Flow RateVelocity based on average inside diameter of BS 1387 Medium Grade pipe.
®
© Crane Ltd 2005
60
40
20
10
8.0
6.0
4.0
2.0
1.0
0.8
0.6
0.4
0.5
SIG
NA
LkP
a
0.01 0.02 0.03 0.04 0.06 0.08 0.1 0.2 FLOWRATE - l/s
0.1 0.15 0.2 0.3 0.4 0.5 0.75 1.0VELOCITY - m/s
Issue 1 1/2" Fig 1732M
Flow Coefficient Kvs = 1.003
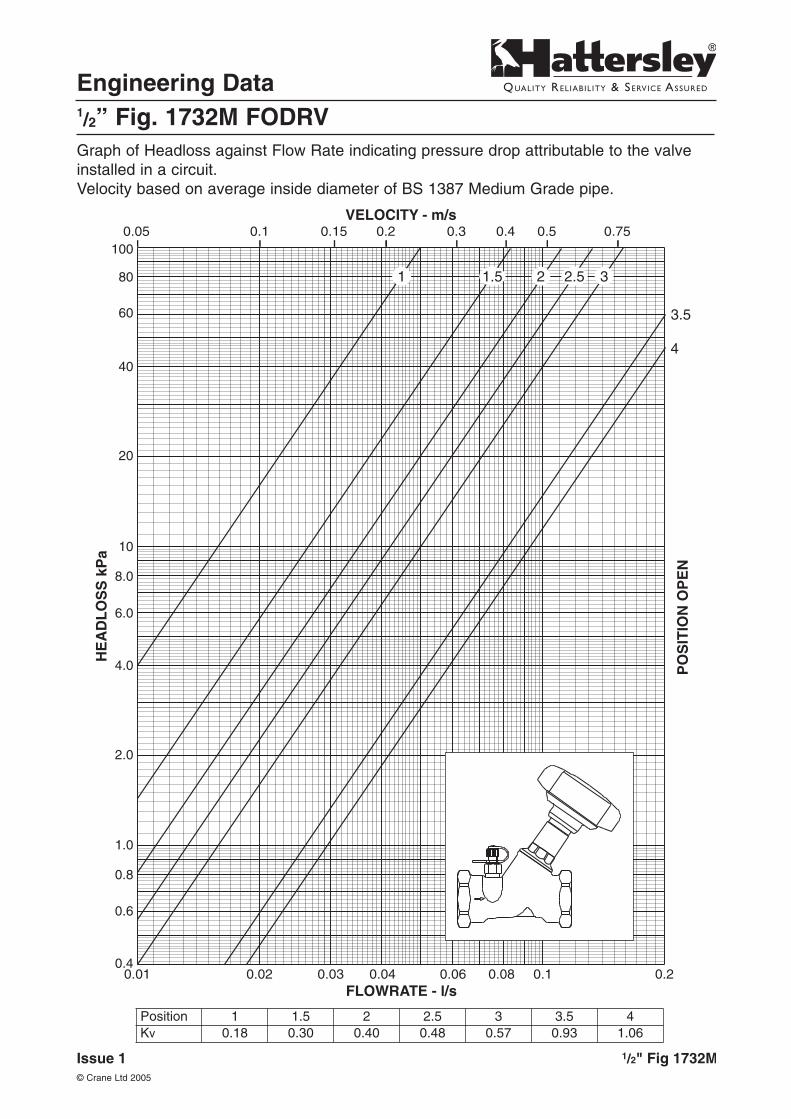
Engineering Data1/2” Fig. 1732M FODRVGraph of Headloss against Flow Rate indicating pressure drop attributable to the valveinstalled in a circuit.Velocity based on average inside diameter of BS 1387 Medium Grade pipe.
®
© Crane Ltd 2005
100
80
60
40
20
10
8.0
6.0
4.0
2.0
1.0
0.8
0.6
0.4 0.01 0.02 0.03 0.04 0.06 0.08 0.1 0.2
FLOWRATE - l/s
0.05 0.1 0.15 0.2 0.3 0.4 0.5 0.75VELOCITY - m/s
HE
AD
LO
SS
kPa
1/2" Fig 1732MIssue 1
PO
SIT
ION
OP
EN
321.51 2.5
4
3.5
Position 1 1.5 2 2.5 3 3.5 4Kv 0.18 0.30 0.40 0.48 0.57 0.93 1.06

Engineering Data15mm Fig. 1732C Flow MeasurementGraph of Signal against Flow RateVelocity based on average inside diameter of BS EN 1057 copper pipe i.e. 13.6mm
®
© Crane Ltd 2005
60
40
20
10
8.0
6.0
4.0
2.0
1.0
0.8
0.6
0.4
0.5
SIG
NA
LkP
a
0.03 0.04 0.05 0.06 0.08 0.1 0.2 0.3 0.4 FLOWRATE - l/s
0.2 0.3 0.4 0.5 0.75 1.0 1.5 2.0VELOCITY - m/s
Issue 1 15mm Fig 1732C
Flow Coefficient Kvs = 2.037

Engineering Data15mm Fig. 1732C FODRVGraph of Headloss against Flow Rate indicating pressure drop attributable to the valveinstalled in a circuit.Velocity based on average inside diameter of BS EN 1057 copper pipe i.e. 13.6mm
®
© Crane Ltd 2005
100
80
60
40
20
10
8.0
6.0
4.0
2.0
1.0
0.8
0.6
0.4 0.03 0.04 0.05 0.06 0.08 0.1 0.2 0.3 0.4
FLOWRATE - l/s
0.2 0.3 0.4 0.5 0.75 1.0 1.5 2.0 2.5VELOCITY - m/s
Issue 1 15mm Fig 1732C
HE
AD
LO
SS
kPa
4
3.5
PO
SIT
ION
OP
EN
321.51 2.5
Position 1 1.5 2 2.5 3 3.5 4Kv 0.29 0.46 0.63 0.85 1.27 1.64 1.87

Engineering Data1/2” Fig. 1732 Flow MeasurementGraph of Signal against Flow RateVelocity based on average inside diameter of BS 1387 Medium Grade pipe.
®
© Crane Ltd 2005
60
40
20
10
8.0
6.0
4.0
2.0
1.0
0.8
0.6
0.4
0.5
SIG
NA
LkP
a
0.03 0.04 0.05 0.06 0.08 0.1 0.2 0.3 0.4 FLOWRATE - l/s
0.2 0.3 0.4 0.5 0.75 1.0 1.5 2.0VELOCITY - m/s
Issue 1 1/2" Fig 1732
Flow Coefficient Kvs = 1.943

Engineering Data1/2” Fig. 1732 FODRVGraph of Headloss against Flow Rate indicating pressure drop attributable to the valveinstalled in a circuit.Velocity based on average inside diameter of BS 1387 Medium Grade pipe.
®
© Crane Ltd 2005
100
80
60
40
20
10
8.0
6.0
4.0
2.0
1.0
0.8
0.6
0.4 0.03 0.04 0.05 0.06 0.08 0.1 0.2 0.3 0.4
FLOWRATE - l/s
0.2 0.3 0.4 0.5 0.75 1.0 1.5 2.0VELOCITY - m/s
Issue 1 1/2" Fig 1732
HE
AD
LO
SS
kPa
4
3.5
PO
SIT
ION
OP
EN
321.51 2.5
Position 1 1.5 2 2.5 3 3.5 4Kv 0.29 0.46 0.63 0.85 1.27 1.64 1.87
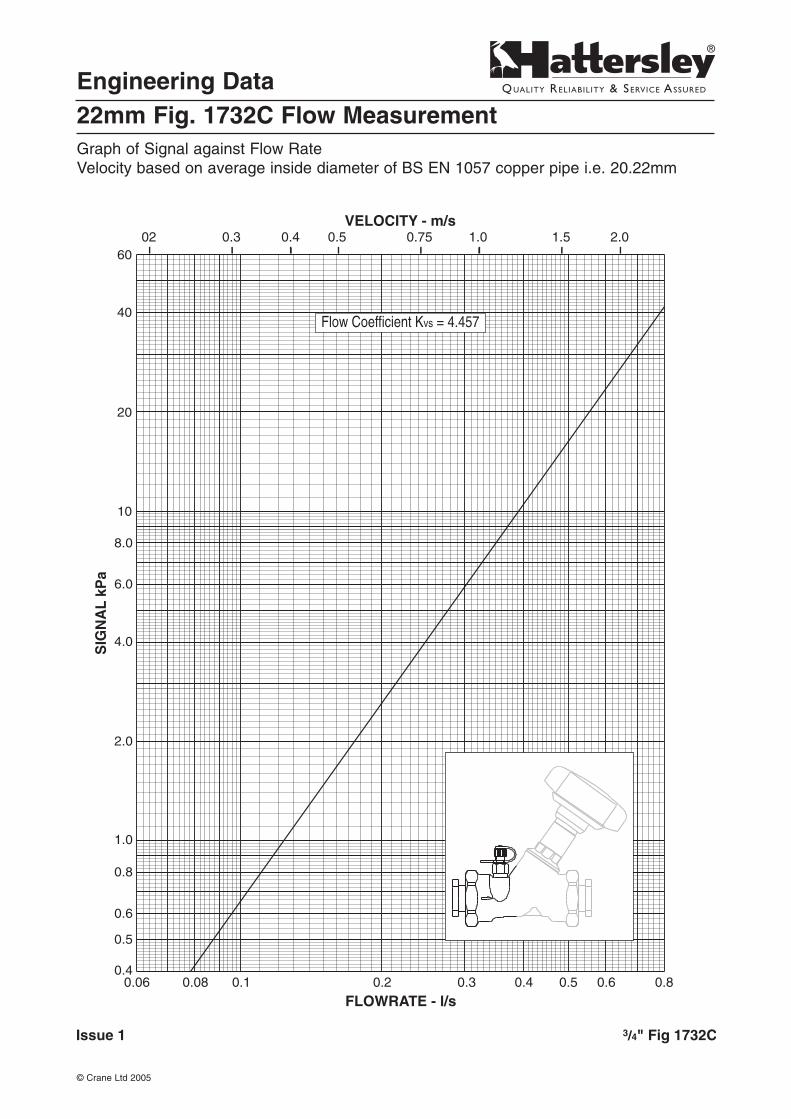
Engineering Data22mm Fig. 1732C Flow MeasurementGraph of Signal against Flow RateVelocity based on average inside diameter of BS EN 1057 copper pipe i.e. 20.22mm
®
© Crane Ltd 2005
60
40
20
10
8.0
6.0
4.0
2.0
1.0
0.8
0.6
0.4
0.5
SIG
NA
LkP
a
0.06 0.08 0.1 0.2 0.3 0.4 0.5 0.6 0.8
FLOWRATE - l/s
02 0.3 0.4 0.5 0.75 1.0 1.5 2.0 VELOCITY - m/s
Issue 1 3/4" Fig 1732C
Flow Coefficient Kvs = 4.457

Engineering Data22mm Fig. 1732C FODRVGraph of Headloss against Flow Rate indicating pressure drop attributable to the valveinstalled in a circuit.Velocity based on average inside diameter of BS EN 1057 copper pipe i.e. 20.22mm
®
© Crane Ltd 2005
100
80
60
40
20
10
8.0
6.0
4.0
2.0
1.0
0.8
0.6
0.4
HE
AD
LO
SS
kPa
0.06 0.08 0.1 0.2 0.3 0.4 0.5 0.6 0.8 FLOWRATE - l/s
0.2 0.3 0.4 0.5 0.75 1.0 1.5 2.0 2.5 VELOCITY - m/s
22mm Fig 1732CIssue 1
4
PO
SIT
ION
OP
EN
321.51 2.5 3.5
Position 1 1.5 2 2.5 3 3.5 4Kv 0.40 0.59 0.80 1.49 2.11 2.80 3.14

Engineering Data3/4” Fig. 1732 Flow MeasurementGraph of Signal against Flow RateVelocity based on average inside diameter of BS 1387 Medium Grade pipe.
®
© Crane Ltd 2005
60
40
20
10
8.0
6.0
4.0
2.0
1.0
0.8
0.6
0.4
0.5
SIG
NA
LkP
a
0.06 0.08 0.1 0.2 0.3 0.4 0.5 0.6 0.8
FLOWRATE - l/s
02 0.3 0.4 0.5 0.75 1.0 1.5 2.0 VELOCITY - m/s
Issue 1 3/4" Fig 1732
Flow Coefficient Kvs = 4.181

Engineering Data3/4” Fig. 1732 FODRVGraph of Headloss against Flow Rate indicating pressure drop attributable to the valveinstalled in a circuit.Velocity based on average inside diameter of BS 1387 Medium Grade pipe.
®
© Crane Ltd 2005
100
80
60
40
20
10
8.0
6.0
4.0
2.0
1.0
0.8
0.6
0.4
HE
AD
LO
SS
kPa
0.06 0.08 0.1 0.2 0.3 0.4 0.5 0.6 0.8 FLOWRATE - l/s
0.2 0.3 0.4 0.5 0.75 1.0 1.5 2.0 VELOCITY - m/s
3/4" Fig 1732Issue 1
4
PO
SIT
ION
OP
EN
321.51 2.5 3.5
Position 1 1.5 2 2.5 3 3.5 4Kv 0.40 0.59 0.80 1.49 2.11 2.80 3.14
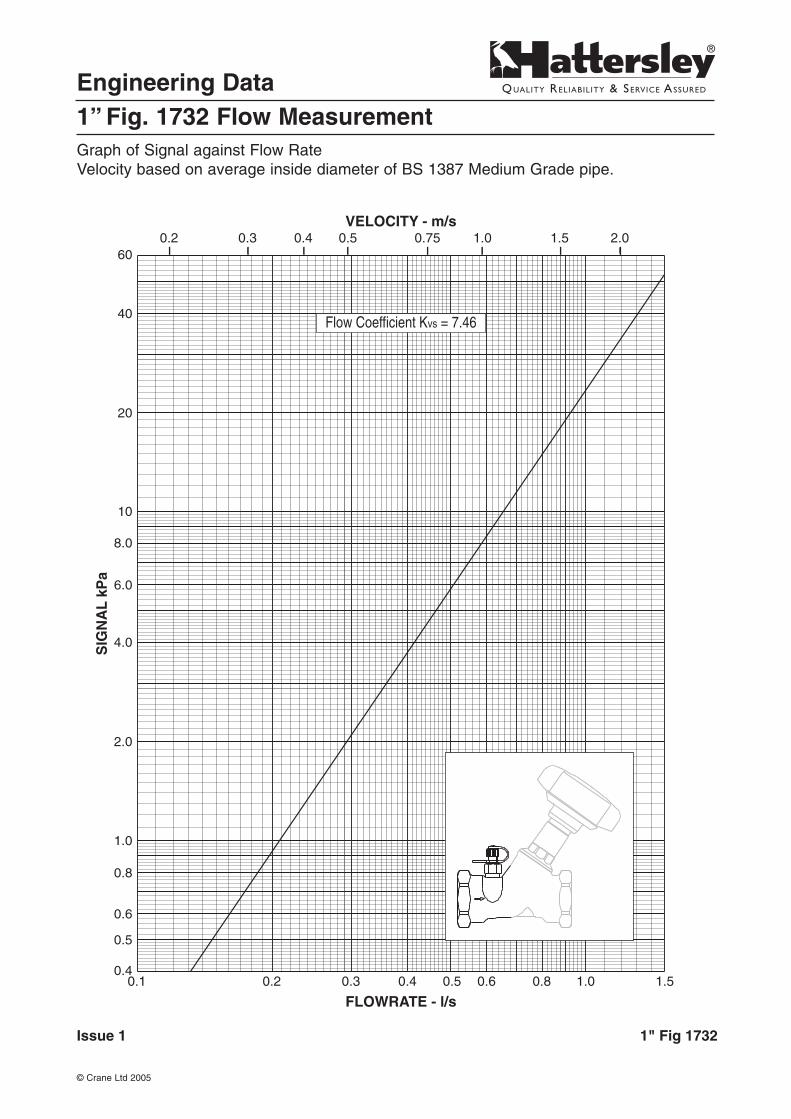
Engineering Data1” Fig. 1732 Flow MeasurementGraph of Signal against Flow RateVelocity based on average inside diameter of BS 1387 Medium Grade pipe.
®
© Crane Ltd 2005
60
40
20
10
8.0
6.0
4.0
2.0
1.0
0.8
0.6
0.4
0.5
SIG
NA
LkP
a
0.1 0.2 0.3 0.4 0.5 0.6 0.8 1.0 1.5
FLOWRATE - l/s
0.2 0.3 0.4 0.5 0.75 1.0 1.5 2.0 VELOCITY - m/s
Issue 1 1" Fig 1732
Flow Coefficient Kvs = 7.46

Engineering Data1” Fig. 1732 FODRVGraph of Headloss against Flow Rate indicating pressure drop attributable to the valveinstalled in a circuit.Velocity based on average inside diameter of BS 1387 Medium Grade pipe.
®
© Crane Ltd 2005
100
80
60
40
20
10
8.0
6.0
4.0
2.0
1.0
0.8
0.6
0.4 0.1 0.2 0.3 0.4 0.5 0.8 1.0 1.5
FLOWRATE - l/s
0.2 0.3 0.4 0.5 0.75 1.0 1.5 2.0 VELOCITY - m/s
0.5
HE
AD
LO
SS
kPa
1" Fig 1732Issue 1
PO
SIT
ION
OP
EN
321.51 2.5 3.5 4
Position 1 1.5 2 2.5 3 3.5 4Kv 0.92 1.34 1.77 2.29 3.42 4.82 5.59

Engineering Data11/4” Fig. 1732 Flow MeasurementGraph of Signal against Flow RateVelocity based on average inside diameter of BS 1387 Medium Grade pipe.
®
© Crane Ltd 2005
60
40
20
10
8.0
6.0
4.0
2.0
1.0
0.8
0.6
0.5
SIG
NA
LkP
a
0.4 0.2 0.3 0.4 0.5 0.6 0.8 1.0 2.0 2.5
FLOWRATE - l/s
0.2 0.3 0.4 0.5 0.75 1.0 1.5 2.0 2.5 VELOCITY - m/s
Issue 1 11/4" Fig 1732
Flow Coefficient Kvs = 15.33

Engineering Data11/4” Fig. 1732 FODRVGraph of Headloss against Flow Rate indicating pressure drop attributable to the valveinstalled in a circuit.Velocity based on average inside diameter of BS 1387 Medium Grade pipe.
®
© Crane Ltd 2005
100
80
60
40
20
10
8.0
6.0
4.0
2.0
1.0
0.8
0.6
0.4
HE
AD
LO
SS
kPa
0.2 0.3 0.4 0.5 0.6 0.8 1.0 2.0 2.5 FLOWRATE - l/s
0.2 0.3 0.4 0.5 0.75 1.0 1.5 2.0 VELOCITY - m/s
11/4" Fig 1732Issue 1
PO
SIT
ION
OP
EN
43.5321.5 2.5
Position 1 1.5 2 2.5 3 3.5 4Kv 0.72 1.17 3.52 6.59 8.81 10.1 10.8
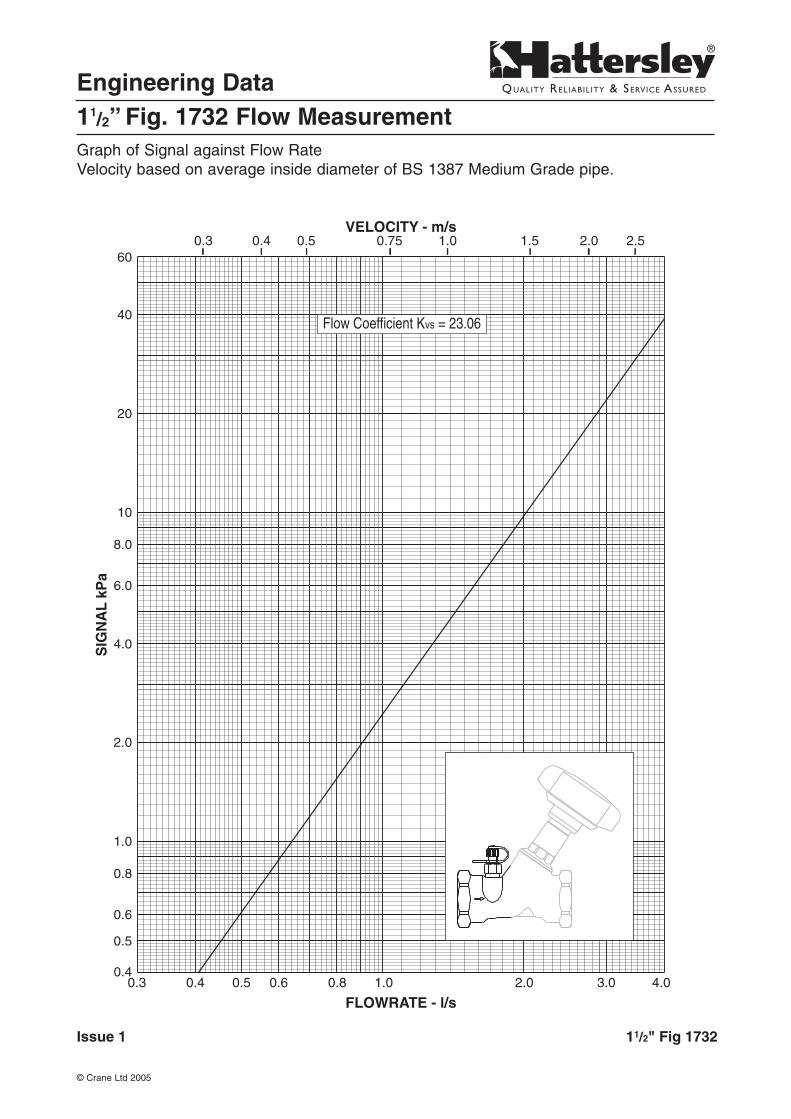
Engineering Data11/2” Fig. 1732 Flow MeasurementGraph of Signal against Flow RateVelocity based on average inside diameter of BS 1387 Medium Grade pipe.
®
© Crane Ltd 2005
60
40
20
10
8.0
6.0
4.0
2.0
1.0
0.8
0.6
0.4
0.5
SIG
NA
LkP
a
0.3 0.4 0.5 0.6 0.8 1.0 2.0 3.0 4.0
FLOWRATE - l/s
0.3 0.4 0.5 0.75 1.0 1.5 2.0 2.5 VELOCITY - m/s
Issue 1 11/2" Fig 1732
Flow Coefficient Kvs = 23.06

Engineering Data11/2” Fig. 1732 FODRVGraph of Headloss against Flow Rate indicating pressure drop attributable to the valveinstalled in a circuit.Velocity based on average inside diameter of BS 1387 Medium Grade pipe.
®
© Crane Ltd 2005
100
80
60
40
20
10
8.0
6.0
4.0
2.0
1.0
0.8
0.6
0.4 0.3 04 0.5 0.6 0.8 1.0 2.0 3.0
FLOWRATE - l/s
0.3 0.4 0.5 0.75 1.0 1.5 2.0 VELOCITY - m/s
HE
AD
LO
SS
kPa
Issue 1 11/2" Fig 1732
PO
SIT
ION
OP
EN
43.5
3
21.5 2.51
Position 1 1.5 2 2.5 3 3.5 4Kv 1.28 2.20 5.00 9.89 14.5 16.8 18.1
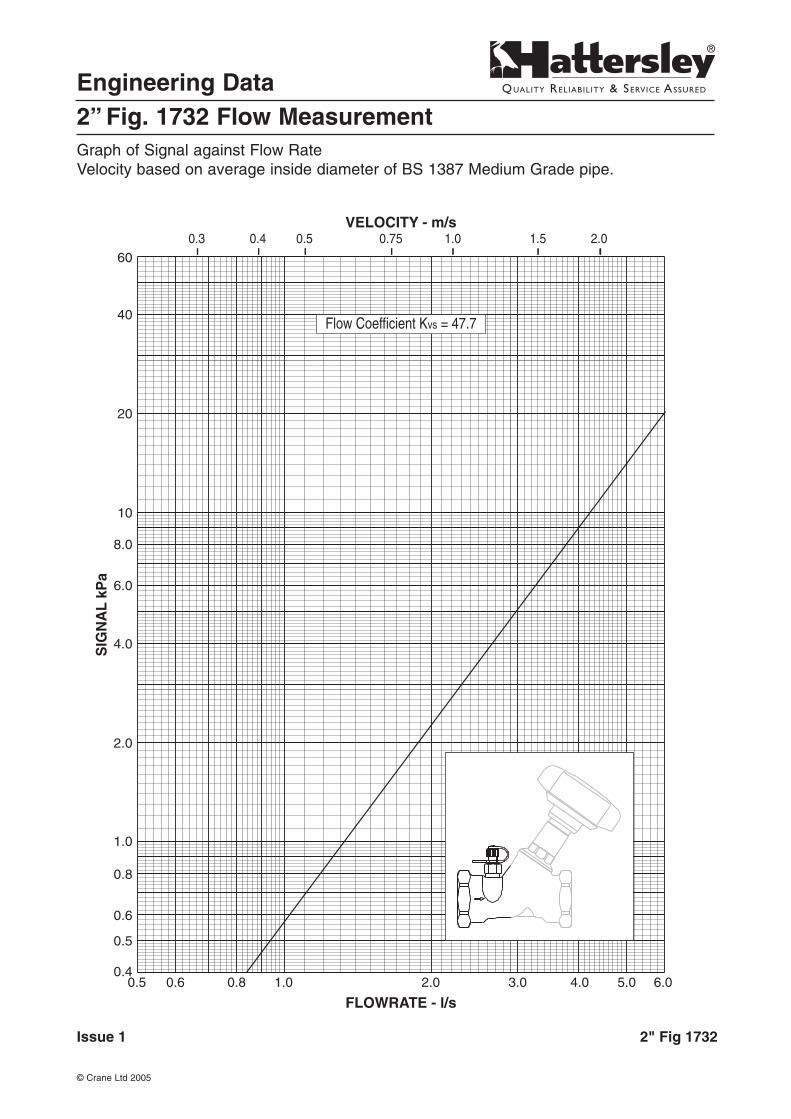
Engineering Data2” Fig. 1732 Flow MeasurementGraph of Signal against Flow RateVelocity based on average inside diameter of BS 1387 Medium Grade pipe.
®
© Crane Ltd 2005
60
40
20
10
8.0
6.0
4.0
2.0
1.0
0.8
0.6
0.4
SIG
NA
LkP
a
0.5 0.6 0.8 1.0 2.0 3.0 4.0 5.0 6.0
FLOWRATE - l/s
0.3 0.4 0.5 0.75 1.0 1.5 2.0 VELOCITY - m/s
0.5
Issue 1 2" Fig 1732
Flow Coefficient Kvs = 47.7

Engineering Data2” Fig. 1732 FODRVGraph of Headloss against Flow Rate indicating pressure drop attributable to the valveinstalled in a circuit.Velocity based on average inside diameter of BS 1387 Medium Grade pipe.
®
© Crane Ltd 2005
100
80
60
40
20
10
8.0
6.0
4.0
2.0
1.0
0.8
0.6
0.4 0.5 0.6 0.8 1.0 2.0 3.0 4.0 5.0
FLOWRATE - l/s
0.3 0.4 0.5 0.75 1.0 1.5 2.0 VELOCITY - m/s
HE
AD
LO
SS
kPa
2" Fig 1732Issue 1
PO
SIT
ION
OP
EN
4
3.5
3
21.51 2.5
Position 1 1.5 2 2.5 3 3.5 4Kv 1.95 5.55 12.0 18.5 23.5 26.6 29.1