168 dispatch of 2012 annual report & notice of meeting to
TRANSCRIPT

ThinkSmart Limited ABN 24 092 319 698 Head Office Level 1, 1260 Hay Street West Perth, 6005 WESTERN AUSTRALIA P +61 8 9463 7500 F +61 8 9463 7555 European Head Office 7th Floor, Oakland House Talbot Road, Old Trafford Manchester, M16 0PQ UNITED KINGDOM P +44 161 333 2400 F +44 161 333 2426 www.thinksmartworld.com
22 April 2013 Company Announcements Australian Securities Exchange 20 Bridge Street SYDNEY NSW 2000 Dear Sir / Madam 2012 Annual Report and Notice of Annual General Meeting ThinkSmart Limited (“the Company”) advises that the 2012 Annual Report and Notice of Annual General Meeting have been dispatched to the Company’s shareholders. The abovementioned documents are available on the Company’s website www.thinksmartworld.com Yours faithfully Alistair Stevens Company Secretary ThinkSmart Limited
For
per
sona
l use
onl
y

A N N U A L R E P O R T 2 0 1 2
For
per
sona
l use
onl
y

HIGHLIGHTS 2012 2
BUSINESS OVERVIEW 3
EXECUTIVE CHAIRMAN AND CEO REPORT 8
FINANCIAL REPORT 11
TABLE OF CONTENTS
ANNUAL GENERAL MEETING
The Annual General Meeting of ThinkSmart Limited will be held at Level 36, 250 St Georges Terrace, Perth, Western Australia on Thursday 23 May 2013 at 2.30pm (WST).F
or p
erso
nal u
se o
nly

ThinkSmart Limited is a leading provider of point
of sale financing solutions in Australia and the UK.
ThinkSmart offers innovative and
diversified financial products to consumers and
businesses in partnership with leading retailers in
Australia and the UK.
ThinkSmart processes high volumes of finance
transactions quickly and efficiently through
patented QuickSmart technology. This enables
online credit approval in just a few minutes, whether
customers are online or in store.
For
per
sona
l use
onl
y

• Statutory net loss after tax of $1.4m for the 2012 year – with a return to profit in the second half of 2012.
• Strong results from the UK operation with record levels of new business volumes and a 26% growth in profit.
• Transformational year for the Australian business impacted by tough trading conditions – solid foundations for future growth have been established.
• Product diversification achieved in Australia with the launch of Fido, a payment plan product.
• Improved operational efficiency with enhanced asset quality and lower fixed costs following a restructure.
• Total cash assets of $18.6m, with $6.0m of available cash at 31 December 2012 and no corporate debt.
• ThinkSmart is well-positioned for future growth with double digit growth in new business volume expected to return the Group to profitability in 2013.
2
HIGHLIGHTS 2012
Transformational year with foundations for growth now in place
For
per
sona
l use
onl
y

33
ThinkSmart is a diversified financial services group providing finance products through its partners to consumers
and businesses in Australia and the UK.
ThinkSmart offers five core products, including rental products in both Australia and the UK and a payment plan in
Australia. The rental products in both territories include business to consumer and business to business offerings.
ThinkSmart’s products are offered through a wide array of retail stores with partners including JB Hi-Fi, Dick
Smith, Angus & Coote and True Value Solar in Australia and Dixons Retail (operating under the Currys and PC
World high street brands) in the UK.
More than 100,000 current customers use a ThinkSmart product, up 31% from 2011.
A year of diversification2012 was a transformational year for ThinkSmart. The foundations for growth have been established through a
strategy of diversification:
Product: New product launches in Australia and the UK represent important steps to broaden the addressable
markets and customers of the Group.
In particular, Fido, the Group’s new payment plan product in Australia opens up new and diverse retail sectors
and customer types – Fido is already available in sectors such as jewellery and home improvement and appeals
to a wider demographic than rental.
BUSINESS OVERVIEWF
or p
erso
nal u
se o
nly

4
Funding: ThinkSmart has in place significant funding
facilities which will be sufficient to meet volume
expectations in 2013. In Australia, a securitisation
based funding model is now in place which has two
funding partners. The Group carries no refinancing
risk on its product financing facilities in either the UK
or Australia. The Group continues to explore options
to diversify funding sources in the UK.
The UK business achieved strong growth rates across
all key metrics during 2012: in comparison with
2011, new originations increased by 58% (by funded
value) and profit before tax increased by 26%
to $7.7m.
Good operating leverage contributed to the strong
financial performance. Operating expenses increased
by 4% compared to an increase of 28% in net
operating income.
UK Profit Contribution ($m)
H111 H211 H112 H212
4
Record result from the UK business
Retail partners: ThinkSmart has an established track record of building long-term and mutually beneficial
relationships with retail partners, such as Dixons in the UK and JB Hi-Fi in Australia. During 2012, especially in
Australia, a number of new partnerships have been established in
a range of new sectors, including Angus & Coote (jewellery) and
True Value Solar (home improvement).
Product Funding Capacity ($m)
FY2011 FY2012
Drawn Undrawn
5
4
3
2
1
0
250
200
150
100
50
0
For
per
sona
l use
onl
y

5
The excellent performance of Infinity (a business to
consumer rental product) was the key driver of the
growth in new volumes. Infinity was jointly designed
with the Group’s key UK retail partner, Dixons, in 2011
and provides a winning combination of a compelling
customer proposition and relevance to Dixon’s strategic
priority of building levels of repeat business.
The product is also well supported by Dixon’s in-store promotional power and ThinkSmart’s strong
operational capability.
2012 proved to be a difficult year for the Australian business as the Group completed a challenging
transformation agenda amidst tough trading conditions. The most important strategic changes concluded during
2012 include the finalisation of the securitisation funding model, which required the implementation of lease
accounting, and the launch of Fido.
The Australian business recorded a loss before tax of $4.3m, included within this result were the impacts of:
Want to know more? Just ask.
a new COMPUTERevery 2 yearsWe’ll securely back up your fi les, photos and music online.
Peace of mind and protection with Norton 360.
We’ll fi x or replace your computer if it goes wrong.
*Plus, trade in your old device and get up to £200 cashback.
KD_055_05TG_KHNEW_297X420_A3L
INFINITY
£17PER MONTH25% CASHBACK WHEN YOU UPGRADE*Terms and conditions apply.
FROM
PLUS
£200CASHBACK*
UP TO
Profit Contribution ($m)
H111 H211
H112 H212
5
• Change to lease accounting. The Australian
business now spreads the margin from a
contract over the term of the contract. This was
a change to the upfront margin recognition used
until 2012 and the impact is to delay the
recognition of profit.
• Lower levels of new originations from
rental products.
• Cost of launching the new payment plan
product, Fido.
Challenging trading environment in Australia
6
5
4
3
2
1
0
-1
-2
-3
For
per
sona
l use
onl
y

6
Volumes of new business sales from the Australian rental product, RentSmart, declined during 2012 by 29%.
This was primarily due to retail sales from electronic retailers being adversely impacted by price deflation (linked
to high levels of discounting) and changes in consumer behaviour. The strong movement towards tablets
adversely impacted new sales volumes as tablets have a lower rental attachment rate in Australia. Attachment
rates to tablets are higher in the UK and the Group is working to deploy the UK experience in Australia.
In February 2013, ThinkSmart extended its contractual
relationship with JB Hi-Fi to the second half of 2015.
JB Hi-Fi has been a valued partner since 2007, offering
ThinkSmart’s rental products to its customers. As part of
the new agreement, JB Hi-Fi intends to offer both Fido and RentSmart to its customers.
Significant growth potential of Fido
ThinkSmart launched Fido, a “no interest ever” payment plan in February 2012. Fido offers customers and an
array of national retailers a winning combination of a “no interest ever” financing product and a quick online
application process. Customers are able to apply and be pre-approved for credit online in minutes.
The focus in the launch year was to build a substantial distribution network and ensure the approval process met
both ThinkSmart’s exacting internal standards and the requirements of our retail partners.
6
For
per
sona
l use
onl
y

7
Managing risk and increasing the Group’s risk management competency have been important priorities during
2012. The positive results are evident in the improving level of credit performance: over the last two years the
rate of customer arrears has reduced by over 40%.
Prospects for 2013At the end of 2012, ThinkSmart has transformed into a diversified business with multiple products in two
significant territories and with a lower risk profile and expanded funding competencies. With good momentum in
the UK business and with strong growth prospects in Australia, ThinkSmart is well positioned for future growth.
The early performance of Fido has been encouraging across a range of important metrics:
• Retail partners derived from a broad and expanding range of categories.
• Customer quality is high with good initial loss experience.
• Potential for repeat business is high.
Improving asset quality
7
60+ Days Past Due Delinquency %Ja
n-11
Mar
-11
May
-11
Jul-1
1
Sep
-11
Nov
-11
Jan-
12
Mar
-12
May
-12
Jul-1
2
Sep
-12
Nov
-12
3%
2%
1%
0%
ThinkSmart continues to prioritise investments which
enhance in-house underwriting capability. The positive
trend in customer arrears is expected to continue for
at least a further 12 months as the benefits of this
on-going investment programme fully materialise.
For
per
sona
l use
onl
y

8 8
EXECUTIVE CHAIRMAN AND CEO REPORT
Dear Shareholder
2012 WAS A CHALLENGING BUT TRANSFORMATIONAL YEAR
2012 was a challenging year for shareholders, Directors and staff. ThinkSmart concluded an ambitious
transformation programme during the year and this has established strong foundations for future growth. At
the same time, the Australian business, in particular, was operating in a challenging trading environment. The
demands on all stakeholders during this period were significant.
While the financial result for the 2012 year was disappointing, ThinkSmart turned the corner by reporting a small
profit in the second half of 2012. The stand out performance was the record result form the UK business.
The Group has started 2013 with good momentum in the UK and with the Australian business focussed to
exploit a number of opportunities for significant growth.
GOOD PROGRESS ON DIVERSIFICATION STRATEGY
As many shareholders are aware, ThinkSmart has evolved materially from its initial public offering six years ago.
What was then a business operating a single product across multiple territories has expanded into a diversified
financial services group with five major products operating across two significant territories.
Commencing in 2011, ThinkSmart embarked on a strategy to diversify both its products and funders while, at
the same time, consolidating focus on its two major territories, Australia and the UK. Significant progress on the
execution of this strategy has been achieved during 2012 – new products have been launched in both Australia
and the UK and a new funding platform was finalised in Australia. Your Directors believe that this diversification
will protect and enhance the value of the Group for its shareholders and employees by broadening our sources of
revenue and funding and expanding our customer base beyond our traditional electronic retail sector.
The potential of our markets, our business model and our management team is evident in what has been
achieved in the UK during 2012. The strong growth of the Infinity product has contributed to a record result from
our UK business with originations up 58% on 2011 and profit up 26%. 2012 is the second consecutive year of
record profits from the UK business.
To support this strategy and, in particular, to launch our new products in Australia and the UK, ThinkSmart
completed a fully underwritten non-renounceable entitlement offer in March 2012.
For
per
sona
l use
onl
y
9
As a result of this transformation programme ThinkSmart has greater diversification in product and funding than
at any point in its history and is well positioned to deliver growth in 2013 and beyond.
STRONG GROWTH POTENTIAL IN 2013
The goals of the Group are unchanged: to build a leading international financial services business which provides
innovative products at point-of-sale, in partnership with multi-channel retailers. To further our progress towards
these goals, management has a clear set of priorities for 2013 – to further diversify and expand our products
and customer base.
In particular, our expectations for the new Fido product are high. The results during 2012, Fido’s launch
year, were promising and the number of retailers offering Fido to their customers is expected to grow strongly
through 2013. Fido operates in a sweet spot where the product is compelling to our business, the retailer and
the customer: the returns are attractive to ThinkSmart, the retailer craves the additional volumes likely to be
generated by the “no interest ever” offering and the low cost and transparency appeal to consumers.
A combination of growth in Fido and good momentum in the UK business is expected to lead to significant
double digit growth in new business volumes in 2013 and for a return to full year profit.
Finally, on behalf of the Board of Directors, I would like to thank all of ThinkSmart’s customers, partners, funders
and shareholders for their continuing support. I especially want to thank the entire team at ThinkSmart for their
on-going commitment and enthusiasm.
NED MONTARELLO
Executive Chairman & CEO
For
per
sona
l use
onl
y

10
For
per
sona
l use
onl
y

ANNUAL REPORT 2012 11
Directors’ Report 12
Auditor’s Independence Declaration 35
Directors’ Declaration 36
Consolidated Income Statement 37
Consolidated Statement of Comprehensive Income 38
Consolidated Statement of Financial Position 39
Consolidated Statements of Changes in Equity 40
Consolidated Statement of Cash Flow 41
Notes to the Financial Statements 42
Independent Auditor’s Report 102
Shareholder Information 104
Corporate Information 106
FINANCIAL REPORT
For
per
sona
l use
onl
y

12
DIRECTORS’ REPORT
Your Directors present their report on the consolidated
entity (referred to hereafter as the “Group”) consisting of
ThinkSmart Limited (“the Company” or “ThinkSmart”) and
the entities it controlled at the end of, or during, the financial
year ended 31 December 2012.
DIRECTORS
The following persons were Directors of the Company during
the financial year and until the date of this report.
Names, qualifications, experience and special
responsibilities
Ned Montarello
Executive Chairman and Chief Executive Officer
Ned was appointed Executive Chairman on 22 May 2010.
Ned has over 28 years experience in the finance industry. He
founded ThinkSmart in 1996 and through this vehicle has
been credited with elevating the Nano-Ticket rental market
sector in Australia, receiving the Telstra and Australian
Government’s Entrepreneur of the Year Award in 1998. Ned
led the development of the Group’s Australian distribution
network by building partnerships with key retailers, including
JB Hi-Fi and Dick Smith. Ned also steered the expansion of
the business into Europe, establishing agreements with DSG
International to launch in the UK.
David Griffiths
B. Ec (Hons), M. Ec, D. Ec (Hon), FAICD
Non-Executive Director, Deputy Chairman
David joined the Board on 28 November 2000 and was
appointed Deputy Chairman on 22 May 2010. David has
over 14 years experience in investment banking, most
recently as Division Director of Macquarie Bank Limited and
previously as Executive Chairman of Porter Western Limited.
He holds an Honours Degree in Economics and an honorary
Doctor of Economics from The University of Western
Australia, a Masters Degree in Economics from Australian
National University and is a Fellow of the Australian Institute
of Company Directors. David sits on the Board of the
Perth International Arts Festival and is currently Chairman
of Automotive Holdings Group Limited and Northern Iron
Limited. David is currently Chair of the Audit and Risk
Committee of ThinkSmart.
Steven Penglis
B. Juris and B. Law
Non-Executive Director
Steven joined the Board on 1 July 2000 and stepped down
as Chairman on 6 May 2007. Until 30 September 2012,
Steven was a partner of Freehills, having been appointed
to the partnership on 1 July 1987. Steven now practises
solely as a barrister, specialising in the area of corporate and
Corporations Law litigation. He is a part time Senior Member
of the Commonwealth Administrative Appeals Tribunal, a
former elected member and Chairman of the Legal Practice
Board of Western Australia and a former elected member of
the Council of the Law Society of Western Australia (having
served from 1 January 2002 to 31 December 2012). Steven
is currently Chairman of the Nomination & Remuneration
Committee of ThinkSmart.
Fernando de Vicente
B. Econ, MBA Bus
Non-Executive Director
Fernando is a citizen of Spain who joined the Board on
7 April 2010. Fernando has a Degree in Economics
(International Development) from the University Complutense
in Madrid, and an Executive MBA from IESE Business School
in Madrid. Fernando spent nine years at DSG International,
one of Europe’s largest electrical retailers, where he most
recently held the role of International Managing Director,
with responsibility for DSG’s Central & Southern European
operations, a A$3 billion business with 350 stores across six
countries.
Fernando started his career with DSG as Finance Director for
PC City Spain, and became the MD for Spain in 2003. In
2006 he was promoted to Regional Managing Director for
South-East Europe based in Greece, before assuming the
role of International Managing Director in 2008. In March
2010, Fernando left DSG to become the Executive Chairman
of BodyBell Group, one of Spain’s largest speciality retailers.
On 15 February 2012, Fernando was appointed Non-
Executive Director of Levantina, a multinational company
dealing in natural stone products.
For
per
sona
l use
onl
y

ANNUAL REPORT 2012 13
Nancy Fox
BA, JD (Law), FAICD
Non-Executive Director
Nancy joined the Board on 10 October 2011 and the Audit
and Risk Committee on 25 November 2011. Nancy is
currently Chairman of Adelaide Managed Funds Limited, a
subsidiary of Bendigo & Adelaide Bank and is also a board
member of APA Ethane Limited, the responsible entity of the
Ethane Pipeline Income Fund (EPX), HCF Life, the Taronga
Conservation Society of Australia and the Australian Theatre
for Young People. Nancy is also a council member of the
Energy Security Council.
Nancy was previously the Managing Director of Ambac
Assurance Corporation with responsibility for the Asia Pacific
Region. Prior to joining Ambac, Nancy was an investment
banker for over 15 years and has held a number of senior
positions as head of securitisation and structured finance at
ABN AMRO, AIDC and Citibank. Before moving to investment
banking, she was an attorney in New York. Nancy was a
National Committee member of the Australian Securitisation
Forum for 9 years and received the Australian Securitisation
Forum's inaugural Distinguished Service Award in 2005.
COMPANY SECRETARY
Alistair Stevens
BA (Hons), ACA
Company Secretary and Chief Financial Officer
Alistair was appointed Company Secretary on 28 March
2012. Alistair is a Chartered Accountant who previously
served as Deputy Chief Financial Officer of BSkyB plc, one
of the top 30 companies in the UK. Alistair held a number of
senior roles at BSkyB plc, including Director of Commercial
Finance. Alistair has extensive Board and listed company
experience, including in the role of Chairman of the Living
TV Group and as Director of companies such as National
Geographic (Europe) Limited and The History Channel
Limited.
PRINCIPAL ACTIVITIES
The Group’s principal activity during the year was the
provision of lease and rental financing services in Australia
and the UK and the supply of interest free payment plans in
Australia.
OPERATING AND FINANCIAL REVIEW
The Group recorded a loss after tax for the year ended 31
December 2012 of $1.441m (2011: profit after tax of
$6.798m). The performance of the Australian business
adversely impacted the Group result due to the adoption
of lease accounting for the majority of new business sales
during the year and challenging trading conditions in the
electronic retailer sector which reduced business volumes.
In contrast, the UK business achieved a record profit
contribution before tax, up 26% on 2011.
The UK business generated a profit contribution before tax
of $7.738m (2011: $6.135m). New business volumes
from the Group’s consumer rental product, Infinity, more
than doubled with the value of rental equipment financed
reaching $17.811m (2011: $7.909m). These record sales
levels were due to a combination of a compelling consumer
proposition and strong in-store promotion by Dixons, the UK
business’s key retail partner.
In Australia, difficult trading conditions for electronic retailers
contributed to a reduction in the value of rental equipment
financed of 29% to $18.358m (2011: $25.852m). Deep
discounting by retailers contributed to a reduction in both
the volume of rental transactions and the average value of
each transaction.
During 2012, the Australian business completed the
transition of its funding from a brokerage model to a
securitisation model, which provides a more profitable
funding platform with greater access to funding. As a
consequence of this change in model, the business
commenced lease accounting for rental contracts; lease
accounting utilises the effective interest method to spread
the profit of a rental contract over its term rather than
booking the profit on origination as was the case with the
brokerage model. Principally as a result of these factors
the Australian business contributed a loss before tax of
$4.327m (2011: profit before tax contribution of $8.689m).
DIRECTORS’ REPORTF
or p
erso
nal u
se o
nly

14
In the first half of 2012, the Australian business launched
a new payment plan product, Fido. This product is designed
to complement the existing rental product, RentSmart, and
to build market share in the fast growing “interest free”
sector of consumer finance. Fido appeals to a wide range
of retailers across multiple sectors as the “no interest ever”
offering can be attached to a wide range of consumer
products. During 2012, the Group has created a number
of new retail partnerships for Fido in categories including
jewellery, solar and home improvement. Sales volumes
increased steadily through the second half of 2012 with the
financed value of Fido sales totalling $4.024m (2011: nil)
for the year.
In March 2012, the Group completed a fully underwritten
non-renounceable entitlement offer. This share issue raised
$9.100m (before transaction costs) of capital which was
principally used to fund the launch of new products in
Australia and the UK.
At 31 December 2012, the Group’s total cash and cash
equivalents was $18.568m (2011: $4.610m), including
$6.008m of available cash (2011: $2.582m). Restricted
cash invested in the Group’s funding structures was
$12.560m (2011: $2.028m).
SIGNIFICANT CHANGES IN STATE OF AFFAIRS
During the financial year, the Group’s Australian operations
significantly transformed its funding arrangements as
described in the Operating and Financial Review and the
financial statements and the notes thereto. There were
no other significant changes in the state of affairs of
the Company other than that referred to in the financial
statements or notes thereto.
DIVIDENDS
There were no dividends declared and paid by the Company
since the end of the previous financial year.
SIGNIFICANT EVENTS AFTER THE BALANCE DATE
On 4 February 2013, ThinkSmart announced that it had
extended its contractual relationship with JB Hi-Fi Limited
to the second half of 2015. As part of the agreement,
ThinkSmart and JB Hi-Fi agreed to offer ThinkSmart's
payment plan product, Fido, to JB Hi-Fi's customers
throughout the term of the new agreement.
LIKELY DEVELOPMENTS AND EXPECTED RESULTS
Information on likely developments in the operations of the
consolidated entity and the expected results of operations
have not been included in this report because the Directors
believe it would be likely to result in unreasonable prejudice
to the consolidated entity.
DIRECTORS’ MEETINGS
The following table sets out the number of Directors’
meetings held during the financial year.
Director
Board
Meetings
Audit
and Risk
Committee
Meetings
Nomination
and
Remuneration
Committee
Meeting
A B A B A B
N Montarello 15 15 2* 2 - -
D Griffiths 15 15 2 2 1 1
S Penglis 15 15 2 2 1 1
F de Vicente 14 15 1* 2 1 1
N Fox 15 15 2 2 1* 1
A – Number of meetings attended
B – Number of meetings held during the time the Director held office
during the year
* – Attendance by invitation from the Committee
DIRECTORS’ REPORTF
or p
erso
nal u
se o
nly

ANNUAL REPORT 2012 15
DIRECTORS’ INTERESTS
The relevant interests of each Director in ThinkSmart Limited
shares and options at the date of this report are as follows:
Number of
ordinary shares
Options granted
over ordinary
shares
N Montarello 29,559,356 3,000,000
D Griffiths 2,592,001 -
S Penglis 1,272,600 -
F de Vicente 356,500 -
N Fox 81,600 -
Unissued Shares under Options
At the date of this report there were 6,366,667 unissued
ordinary shares of the Company subject to option or
performance rights, comprising:
Number of
shares under
option
Exercise price
of options
Expiry date of
options
2,166,667 $0.62 31 December 2013
1,833,334 $1.11 31 December 2014
1,966,666 $0.84 31 December 2015
400,000 $0.19 09 August 2017
All options expire on the earlier of their expiry date or the
termination of the option holder’s employment. Further
details are included in the remuneration report on pages 16
to 28. These options do not entitle the holder to participate
in any share issue of the Company or any other body
corporate.
DIRECTORS’ REPORTF
or p
erso
nal u
se o
nly

16
REMUNERATION REPORT - AUDITED
This Report details the remuneration arrangements for Key Management Personnel. Key Management Personnel encompass
all Directors and those Executives that have specific responsibility for planning, directing and controlling material activities of
the Group. In this report, “Executives” refers to the Key Management Personnel excluding the Non-Executive Directors. The
information provided in this Remuneration Report has been audited as required by Section 308(3C) of the Corporations Act
2001. This Report contains the following sections:
A: Principles of remuneration
B: Key Management Personnel remuneration
C: Service agreements
D: Share-based compensation (loan-funded shares and options)
E: Share-based compensation
F: Bonus remuneration
A. Principles of Remuneration
Key Management Personnel have authority and responsibility for planning, directing and controlling the activities of the
Company and the Group and comprise:
Executive Director
N Montarello (Executive Chairman and Chief Executive Officer)
Non-Executive Directors
D Griffiths (Deputy Chairman)
S Penglis (Non-Executive Director)
F de Vicente (Non-Executive Director)
N Fox (Non-Executive Director)
Executives
A Baum (Group Chief Operating Officer)
G Halton (Managing Director (acting) – UK) – appointed to role on 1 October 2012, previously European Chief Financial Officer
A Stevens (Group Chief Financial Officer) – appointed 28 March 2012
G Varma (Group Chief Information Officer)
A Deller (Managing Director – Europe) – from 23 January 2012 to 30 September 2012
J Ferreira (Group Chief Financial Officer (acting)) – until 28 March 2012
S McDonagh (Head of Product & Marketing) – until 30 November 2012
G Parry (Managing Director – UK) – until 30 April 2012
The Board recognises that the Company’s performance depends upon the quality of its staff. To achieve its financial and
operating objectives, the Company must attract, motivate and retain highly skilled Directors and Executives. To this end, the
remuneration structure seeks to:
• Provide competitive rewards to attract, retain and motivate talented Directors and Executives;
DIRECTORS’ REPORTF
or p
erso
nal u
se o
nly

ANNUAL REPORT 2012 17
• Align incentive rewards with the Company’s short term and long term objectives by including a significant portion of
Executive remuneration “at risk” as short term and long term incentives;
• Set demanding performance hurdles which are clearly linked to an Executive’s remuneration; and
• Structure remuneration at a level that reflects the Executive’s duties and responsibilities and is competitive
within the sector.
The remuneration structures take into account:
• the capability and experience of the individual;
• the individual’s ability to control the relevant segment’s performance; and
• the performance of the Group.
The Nomination and Remuneration Committee obtains independent advice on the appropriateness of remuneration packages
trends in comparative companies and markets, both locally and internationally, and the objectives of the Company’s
remuneration strategy.
Remuneration packages include a mix of fixed and variable remuneration with a blend of short-term and long-term
performance-based incentives. The variable remuneration components are directly linked to both the performance of the
Group and the performance of the Company’s share price. This ensures close alignment of remuneration of Key Management
Personnel and the creation of shareholder value.
Non-Executive Directors
Fees and payments to Non-Executive Directors reflect the demands which are made on and the responsibilities of the Non-
Executive Directors. Non-Executive Directors’ fees and payments are reviewed annually by the Board. Non-Executive Directors
do not receive share options or loan-funded shares.
Non-Executive Directors’ Fees
Non-Executive Directors’ fees are determined within an aggregate Directors’ fee pool of $600,000 and was approved by
shareholders at a previous general meeting. The total fees paid in the 2012 financial year were $253,217. In addition to
these fees, Directors also receive superannuation contributions as required under government legislation. The Company also
pays all reasonable expenses incurred by Directors attending meetings and carrying out their duties.
Executive Pay
The Group’s executive remuneration structure has four components which comprise the Executive’s total remuneration:
• base pay and benefits;
• short-term performance incentives (STIs);
• long-term incentives through participation in the ThinkSmart Long Term Incentive Plan (LTIs); and
• other remuneration such as superannuation.
Base Pay – Fixed Compensation
Executives are offered a competitive salary that comprises the components of base pay and benefits. Base pay for Executives
is reviewed annually by the Nomination and Remuneration Committee or the Executive Chairman to ensure the Executive’s
pay is competitive with the market and appropriate to the Executive’s experience, responsibilities and contribution. An
Executive’s pay is also reviewed on promotion. Base pay for the Executive Chairman is reviewed annually by the Nomination
and Remuneration Committee.
DIRECTORS’ REPORTF
or p
erso
nal u
se o
nly

18
Short-Term Performance Incentive
Short-term performance incentives (STIs) vary according to individual contracts, however, for Executives they are broadly
based as follows:
• a component of the STI is linked to the individual performance of the Executive (this is based on a number of
factors, including performance against budgets, achievement of key performance indicators (KPIs) and other
personal objectives); and
• a component of the STI is linked to the financial performance of the Group determined at the beginning of each
financial year.
Using various performance targets and personal performance objectives the Group ensures variable reward is only paid when
value has been created for shareholders. The performance measures include financial, such as Profit Before Tax and the
value of new originations, and non-financial, including KPIs targeting high levels of customer service and new retail partner
acquisition. The STI bonus is delivered in the form of cash.
The short-term bonus payments may be adjusted up or down in line with under or over achievement against the target
performance levels. This is at the discretion of the Nomination and Remuneration Committee or the Executive Chairman. The
STI targets are reviewed annually. Information on the STI is detailed in section F of the Remuneration Report.
Long-Term Performance Incentive
Long-term performance incentives are awarded to Key Management Personnel and other Executives. Prior to 2012,
incentives were awarded under the Company’s Executive Share Option Plan. In May 2012, shareholders approved a Long
Term Incentive Plan designed to increase the motivation of staff and to create a stronger link between increasing shareholder
value and employee award. The details of these schemes are set out on pages 19 to 21.
Consequences of Performance on Shareholder Wealth
In considering the Group’s performance and benefits for shareholder wealth, the remuneration committee have regard to the
following indices in respect of the current financial year and the previous four financial years.
2012 2011 2010 2009 2008
(Loss)/profit attributable to owners of
the company ($000s) ($1,441) $6,798 $6,773 $5,172 $3,211
Basic EPS (0.95) cents 5.23 cents 6.52 cents 5.35 cents 3.34 cents
Dividends paid - $4,545,779 $1,937,788 $2,900,682 $1,933,788
Dividend paid per share - 3.5 cents 2 cents 3 cents 2 cents
Share price at year end $0.19 $0.41 $0.73 $0.90 $0.17
Change in share price ($0.22) ($0.32) ($0.17) $0.73 ($1.75)
Return on capital employed (5%) 18% 36% 34% 22%
DIRECTORS’ REPORTF
or p
erso
nal u
se o
nly

ANNUAL REPORT 2012 19
The table below sets out the details of the performance options issued to Executives in 2009, 2010 and 2011:
Instrument Each option represents an entitlement to one ordinary share.
Exercise price Performance Options Tranche 1 - $0.62
Performance Options Tranche 2 - $1.11
Performance Options Tranche 3 - $0.84
Vesting conditions Performance options will vest on, and become exercisable on or after, the Vesting
Date to the extent that certain performance conditions that are based on the
achievement of pre-determined financial performance of the Group over the
performance measurement period, as follows:
- 50% of performance options are subject to achievement of Earnings Per
Share (EPS) performance condition; and
- 50% of performance options are subject to achievement of Total
Shareholder Return (TSR) performance condition.
Subject to the Executive remaining an employee of the Group. If the Executive
ceases to be an employee of the Group before the option is exercised, all
options held by the Executive will automatically lapse one month after the date of
cessation of employment.
EPS performance target The Group’s EPS growth will be measured relative to a target of more than 7.5%
per annum compound growth.
EPS performance period Performance Options Tranche 1: 3 year period commencing 1 January 2009 with
the base year being the period ended 31 December 2008.
Performance Options Tranche 2: 3 year period commencing 1 January 2010 with
the base year being the period ended 31 December 2009.
Performance Options Tranche 3: 3 year period commencing 1 January 2011 with
the base year being the period ended 31 December 2010.
TSR performance target The Group will be given a percentile ranking having regards to its performance
relative to a comparator group consisting of the S&P/ASX Small Ordinaries Index
(ASX code: ASO). The percentage of the TSR reward that vests will be determined
by the Group’s ranking as follows:
- TSR rank less than 50th percentile: 0%
- TSR ranks 50th percentile: 50%
- TSR rank between 50th and 75th percentile: 50% plus an additional 2%
of this award for each additional percentile ranking above 50th percentile
- TSR rank at or above 75th percentile: 100%
TSR performance period Performance Options Tranche 1: As at 1 January 2009
Performance Options Tranche 2: As at 1 January 2010
Performance Options Tranche 3: As at 1 January 2011
Why vesting conditions are chosen The vesting conditions (EPS and TSR) were chosen as performance conditions as
they are aligned to earnings growth and the creation of shareholder value.
Vesting date Performance Options Tranche 1: 1 January 2012
Performance Options Tranche 2: 31 December 2012
Performance Options Tranche 3: 31 December 2013
DIRECTORS’ REPORTF
or p
erso
nal u
se o
nly

20
Exercise period Performance Options Tranche 1: From vesting date to expiry date
Performance Options Tranche 2: From vesting date to expiry date
Performance Options Tranche 3: From vesting date to expiry date
Expiry date Performance Options Tranche 1: 31 December 2013
Performance Options Tranche 2: 31 December 2014
Performance Options Tranche 3: 31 December 2015
Disposal restriction No disposal restriction imposed at the time of this grant.
During 2012, the Board implemented a new loan-funded share plan for Executives located in Australia, following shareholder
approval in May 2012. The limited recourse loans to acquire shares are issued to Executives and the ability to exercise the
shares is conditional on the Group achieving the pre-determined performance criteria. The table below sets out the details of
the loan-funded share plan:
Instrument Each loan-funded share represents an entitlement to one ordinary share.
Limited recourse loan The company is providing interest-free, limited recourse loans to Executives to
acquire shares. The limited recourse loan means that if the shares do not vest
for any reason or the value of the shares is less than the outstanding loan value
when it is required to be repaid, the participant’s liability is limited to the value of
the shares.
Exercise price Tranche 1 - $0.1923
Tranche 2 - $0.1923
Tranche 3 - $0.1923
Vesting conditions Shares will vest at the end of the three years from the issue date if at any time
during this period the volume-weighted average price of the Company’s shares
on ASX over any consecutive 30 trading days is, or is in excess of, the following
performance conditions:
Performance conditions for Tranche 1: $0.35
Performance conditions for Tranche 2: $0.55
Performance conditions for Tranche 3: $0.75
The number of shares that will vest if the above performance conditions are met
are:
Tranche 1: 25% of total shares
Tranche 2: 25% of total shares
Tranche 3: 50% of total shares
Vesting is subject to the Executive remaining an employee of the Group.
Why vesting conditions are chosen The vesting conditions were chosen to align the financial interests of participants
with those of shareholders.
Vesting date 10 August 2015
Performance period 10 August 2012 to 10 August 2015
Exercise period From vesting date until expiry date
Expiry date 09 August 2017
DIRECTORS’ REPORTF
or p
erso
nal u
se o
nly

ANNUAL REPORT 2012 21
For Executives located in the UK, the Group issued share options under a similar structure to the employee share option plan
outlined on page 20. The table below sets out the details of the 2012 employee share option plan:
Instrument Each option represents an entitlement to one ordinary share.
Exercise price Tranche 1 - $0.1923
Tranche 2 - $0.1923
Tranche 3 - $0.1923
Vesting conditions Options will vest at the end of the three years from the issue date if at any time
during this period the volume-weighted average price of the Company’s shares
on ASX over any consecutive 30 trading days is, or is in excess of, the following
performance conditions:
Performance conditions for Tranche 1: $0.35
Performance conditions for Tranche 2: $0.55
Performance conditions for Tranche 3: $0.75
The number of options that will vest if the above performance conditions are met
are:
Tranche 1: 25% of total option
Tranche 2: 25% of total option
Tranche 3: 50% of total option
Vesting is subject to the Executive remaining an employee of the Group.
Why vesting conditions are chosen The vesting conditions were chosen to align the financial interests of participants
with those of shareholders.
Vesting date 10 August 2015
Performance period 10 August 2012 to 10 August 2015
Exercise period From vesting date until expiry date
Expiry date 09 August 2017
DIRECTORS’ REPORTF
or p
erso
nal u
se o
nly
22
B. Key Management Personnel Remuneration
Services from Remuneration Consultants
The Nomination and Remuneration Committee engaged Deloitte Touche Tohmatsu as remuneration consultant to the Board
to provide recommendations on the loan-funded share plan and conduct a review of the remuneration of the Executive
Chairman. This work was ultimately completed by Towers Watson after Deloitte Touche Tohmatsu Australia exited the board
and executive remuneration advisory business during the course of the work.
Deloitte Touche Tohmatsu was paid $16,000 for the remuneration recommendations in respect of reviewing the Executive
Chairman’s remuneration and the loan-funded share plan. Towers Watson was paid $29,000 for the remuneration
recommendations in respect of reviewing Executive Chairman remuneration and the loan-funded share plan.
The consultant was chosen by the Remuneration Committee. No member of the Committee was a person to whom the
advice and recommendations sought applied. The Communications between the Committee and the consultant were
principally conducted on behalf of the Committee by the Chairperson of the Committee. There were no communications
passing between the consultant and the executives on the subject of the recommendation concerning the substance of the
advice and recommendations sought.
Amount of Remuneration
Details of the remuneration of the Directors and the Key Management Personnel (as defined in AASB 124 Related Party
Disclosures) of the Group are set out in the following tables.
DIRECTORS’ REPORTF
or p
erso
nal u
se o
nly

ANNUAL REPORT 2012 23
Short Term Post employmentOther
long termShare-based
payments
Total
Proportion of remu-neration perfor-mance related
Value of options as proportion of remu-neration
Salary & fees
STI cash bonus
Non-monetary benefits
TotalSuperan-nuation benefits
Termi-nation
benefits
Long service entitle-ment
Options & rights #
Shares
$ $ $ $ $ $ $ $ $ $ % %
Directors
Non-Executive Directors
D Griffiths 2012 66,375 - - 66,375 5,974 - - - - 72,349 - -
2011 67,500 - - 67,500 6,075 - - - - 73,575 - -
S Penglis 2012 62,442 - - 62,442 5,620 - - - - 68,062 - -
2011 63,500 - - 63,500 5,714 - - - - 69,214 - -
F de Vicente 2012 65,400 - - 65,400 - - - - - 65,400 - -
2011 54,895 - - 54,895 9,255 - - - - 64,150 - -
N Fox 2012 59,000 - - 59,000 5,310 - - - - 64,310 - -
2011 13,452 - - 13,452 1,211 - - - - 14,663 - -
Executive Director
N Montarello 2012 675,264 - 1,368 676,632 37,500 - 56,460 254,895 - 1,025,487 25% 25%
2011 652,639 149,753 2,206 804,598 54,167 - (36,094) 232,491 - 1,055,162 36% 22%
Executives
A Baum 2012 412,157 - 1,368 413,525 25,000 - - 5,556 96,333 540,414 1% 1%
2011 436,410 - 2,206 438,616 27,500 - - 68,351 81,889 616,356 11% 11%
G Halton* 2012 176,355 - 382 176,737 4,447 - - 26,878 - 208,062 13% 13%
2011 - - - - - - - - - - - -
A Stevens* 2012 240,766 - 1,026 241,792 18,351 - - 8,333 - 268,476 3% 3%
2011 - - - - - - - - - - - -
G Varma 2012 276,601 - 1,368 277,969 24,750 - 12,604 28,545 - 343,868 8% 8%
2011 266,994 31,687 2,206 300,887 26,789 - (641) 23,597 - 350,632 16% 7%
N Barker† 2012 - - - - - - - - - - - -
2011 160,647 113,000 1,103 274,750 28,716 29,092 - 38,973 - 371,531 41% 10%
A Deller* 2012 230,773 - 1,039 231,812 4,160 93,388 - - - 329,360 0% 0%
2011 - - - - - - - - - - - -
J Ferreira* 2012 124,439 - 456 124,895 6,750 - - (39,595) - 92,050 (43%) (43%)
2011 215,406 31,228 2,206 248,840 21,728 - - 28,957 - 299,525 20% 10%
S McDonagh* 2012 221,257 25,000 1,254 247,511 20,971 - - (19,253) - 249,229 2% (8%)
2011 80,775 - 552 81,327 7,476 - - 13,457 - 102,260 13% 13%
G Parry* 2012 90,412 - 616 91,028 - 60,435 - (73,749) - 77,714 (95%) (95%)
2011 154,567 28,329 6,244 189,140 100,210 - - 47,193 - 336,543 22% 14%
Total 2012 2,701,241 25,000 8,877 2,735,118 158,833 153,823 69,064 191,610 96,333 3,404,781 6% 6%
Total 2011 2,166,785 353,997 16,723 2,537,505 288,841 29,092 (36,735) 453,019 81,889 3,353,611 24% 14%
The fair value of the options and loan-funded shares is calculated at the date of grant using the Binomial Tree and Monte-Carlo Simulation
option and pricing models and allocated to each reporting period evenly over the period from grant date to vesting date. The value disclosed
is the portion of the fair value of the options recognised in this reporting period.
* - During the year, the Key Management Personnel has either resigned or been appointed.
† - This information is provided for comparative purposes.
# - Includes loan-funded share rights.
DIRECTORS’ REPORTF
or p
erso
nal u
se o
nly

24
C. Service Agreements
A service agreement can be used for the provision of short-term performance incentives, eligibility for the ThinkSmart LTI and
other benefits, including the use of a Company motor vehicle, tax advisory fees, payment of benefits forgone at a previous
employer and relocation expenses.
Only remuneration and other terms of employment for the Chief Executive Officer are formalised in a service agreement. The
Chief Executive Officer’s employment agreement, signed on 21 August 2012, is a rolling agreement which is unlimited in
term but capable of termination with six months notice by either party. All other employment agreements are unlimited in
term but capable of termination with one to three months’ notice by either the Company or the Executive. The Company can
make a payment in lieu of notice.
In the event of retrenchment, the Executives listed in the table on page 23 are entitled to the payment provided for in the
service agreement, where applicable. The employment of the Executives may be terminated by the Company without notice
by payment in lieu of notice. The service agreements also contain confidentiality and restraint of trade clauses.
D. Share-Based Compensation (loan-funded shares and options)
Loan-Funded Shares and Options
Details of ordinary shares in the Company that were granted as part of the loan-funded share plan to Key Management
Personnel in August 2012, and the options over ordinary shares in the Company that were granted to Key Management
Personnel in August 2012 and details on options that vested during the reporting period are as follows:
No of options/
shares
granted
during 2012 Grant date
Fair value per
share at grant
date $
Exercise price
per share
$ Expiry date
No of shares
vested during
2012
Directors
N Montarello 1,000,000 10/08/2012 0.02 – 0.06 0.19 09/08/2017 -
Executives
A Baum 333,333 10/08/2012 0.02 – 0.06 0.19 09/08/2017 -
A Stevens 500,000 10/08/2012 0.02 – 0.06 0.19 09/08/2017 -
G Halton 100,000 10/08/2012 0.02 – 0.06 0.19 09/08/2017 -
G Varma 200,000 10/08/2012 0.02 – 0.06 0.19 09/08/2017 -
S McDonagh 200,000 10/08/2012 0.02 – 0.06 0.19 09/08/2017 -
All shares and options were granted during the financial year. The shares and options are subject to Performance Conditions
as set out on pages 20 and 21. The options are provided at no cost to the recipients. No shares have been granted since
the end of the financial year.
During the financial year, no shares were issued as a result of the exercise of options.
DIRECTORS’ REPORTF
or p
erso
nal u
se o
nly

ANNUAL REPORT 2012 25
Details of vesting profiles of the options and loan-funded shares granted as remuneration to each Director of the Company
and other Key Management Personnel are detailed below:
Options and loan-funded
shares granted
% vested in year
% forfeited in
year (a)
Financial year
in which grant
vestsNumber granted Grant Date
Director
N Montarello 1,000,000 30/06/2009 100% -% 2012
1,000,000 05/05/2010 -% -% 2013
1,000,000 11/04/2011 -% -% 2014
1,000,000 10/08/2012 -% -% 2015
Executives
A Baum 333,333 01/09/2010 -% -% 2013
333,333 11/04/2011 -% -% 2014
333,333 10/08/2012 -% -% 2015
G Halton 150,000 30/06/2009 100% -% 2012
100,000 05/05/2010 -% -% 2013
100,000 11/04/2011 -% -% 2014
100,000 10/08/2012 -% -% 2015
A Stevens 500,000 10/08/2012 -% -% 2015
G Varma 150,000 30/06/2009 100% -% 2012
100,000 05/05/2010 -% -% 2013
100,000 11/04/2011 -% -% 2014
200,000 10/08/2012 -% -% 2015
J Ferreira 150,000 30/06/2009 100% -% 2012
100,000 05/05/2010 -% 100% 2013
150,000 11/04/2011 -% 100% 2014
S McDonagh 250,000 25/07/2011 -% -% 2014
200,000 10/08/2012 -% 100% 2015
G Parry 300,000 30/06/2009 100% -% 2012
200,000 05/05/2010 -% 100% 2013
200,000 11/04/2011 -% 100% 2014
(a) The % forfeited in the year represents the reduction from the maximum number of options available to vest due to
either the performance conditions attached to the options not being met or the departure of the Executive from the
Group.
DIRECTORS’ REPORTF
or p
erso
nal u
se o
nly

26
Analysis of Movement of Options and Loan-Funded Shares
The movement during the reporting period, by value, of options and loan-funded shares over ordinary shares in the Company
held by Directors and Key Management Personnel is detailed below:
Granted in year (a)
$
Exercised in year (b)
$
Lapsed in year (c)
$
Directors
N Montarello 35,000 - -
Executives
A Baum 11,667 - -
G Halton 3,500 - -
A Stevens 17,500 - -
G Varma 7,000 - -
J Ferreira - - 98,305
S McDonagh 7,000 - 7,000
G Parry - - 156,210
81,667 - 261,515
(a) The value of loan-funded shares granted in the year is the fair value of the loan-funded shares calculated at grant
date using a monte-carlo option-pricing model. This total amount is allocated to remuneration over the
vesting period.
(b) The value of options exercised during the year is calculated as the market price of shares of the Company on the
Australian Securities Exchange as at close of trading on the date the options were exercised after deducting the
price paid to exercise the option.
(c) The value of the options that lapsed during the year represents the benefit forgone and is calculated at the date the
option lapsed/was forfeited using original fair value.
DIRECTORS’ REPORTF
or p
erso
nal u
se o
nly

ANNUAL REPORT 2012 27
E. Share-Based Compensation (shares)
Details of shares of the Company that were granted as remuneration to each Key Management Personnel and details on
shares vested during the reporting period are as follows:
Number of shares
granted during 2012 Grant date
Fair value at
grant date ($) Vesting period
Number of shares
vested during
2012
Executives
A Baum 125,000 03/10/2012 0.18 3 years -
No shares were granted since the end of the financial year. The shares are provided at no cost to the recipient.
Analysis of Shares Granted as Remuneration
Details of vesting profiles of the shares granted as remuneration to the Director and Key Management Personnel of the
Company are detailed below.
Shares granted
% vested in year
% forfeited in year
(a)
Financial year in
which grant vestNumber of shares Grant Date
Executives
A Baum 350,000 01/09/2010 -% -% 2013
A Baum 125,000 01/09/2011 -% -% 2014
A Baum 125,000 03/10/2012 -% -% 2015
(a) The % forfeited in the year represents the reduction from the maximum number of shares available to vest due to
the highest level service criteria not being achieved.
Analysis of Movement of Shares
The movement during the reporting period, by value of shares in the Company held by the Directors and Key Management
Personnel is detailed below.
Granted in year (a)
$
Vested in year (b)
$
Lapsed in year (c)
$
Executives
A Baum 22,500 - -
(a) The value of shares granted in the year is the fair value of the shares as determined in reference to the prevailing
market price of the Company’s shares on the ASX.
(b) The value of shares vested during the year is calculated as the market price of shares of the Company on the ASX
as at close of trading on the date the shares vested.
(c) The value of the shares that lapsed during the year represents the benefit forgone and is determined in reference
to the prevailing market price of the Company’s shares on the ASX at the date the shares lapsed, with no
adjustments for whether the service criteria had been achieved.
DIRECTORS’ REPORTF
or p
erso
nal u
se o
nly

28
F. Bonus Remuneration
Details of the vesting profile of the short-term incentive cash bonuses awarded as remuneration to the Director and Key
Management Personnel of the Company are detailed below:
Short term incentive bonus
Included in
remuneration (a)
$
Maximum
entitlement
$ % vested in year
% forfeited in year
(b)
Directors
N Montarello - 258,324 0.00% 100.00%
Executives
A Baum - 170,000 0.00% 100.00%
G Varma - 53,400 0.00% 100.00%
J Ferreira - 60,000 0.00% 100.00%
S McDonagh 25,000 50,000 50.00% 50.00%
G Parry - 69,904 0.00% 100.00%
(a) Amounts included in remuneration for the financial year represent the amount that vested in the financial year
based on achievement of personal goals and satisfaction of specified performance criteria pertaining to the 2011
financial year. No amounts vest in future financial years.
(b) The amounts forfeited are due to the performance or service criteria not being met in relation to the current
financial year.
No bonuses were awarded to Key Management Personnel with respect to the 2012 financial year.
CORPORATE GOVERNANCE STATEMENT
The Board of Directors of ThinkSmart Limited is responsible for and committed to ensuring that the Company complies with
the ASX Corporate Governance Council’s Guide “Corporate Governance Principles and Recommendations”.
Board of Directors
Composition of the Board
At the date of this statement, the Board comprises four Non-Executive Directors, all of whom are independent, and
one Executive Chairman and Chief Executive Officer. The names of the Directors, including details of their qualifications
and experience, at the date of this report are set out on page 12 and 13 of this report. The composition of the Board is
determined using the following principles:
• The Board should comprise a majority of independent Non-Executive Directors and comprise Directors with a broad
range of skills, expertise and experience from a diverse range of backgrounds.
• The Board considers the diversity of existing and potential Directors. The Board’s policy is to seek a diverse range of
Directors who have a range of ages, genders and ethnicity which mirrors the environment in which ThinkSmart operates.
DIRECTORS’ REPORTF
or p
erso
nal u
se o
nly

ANNUAL REPORT 2012 29
• The Board does not believe that it should establish a limit on the tenure of the Director. While tenure limits can help
to ensure that fresh ideas and viewpoints are available to the Board, they hold the disadvantage of losing the
contribution of Directors who have been able to develop, over a period of time, increasing insight in the Company
and its operation.
• The Board regularly reviews the independence of each Director in light of the interests disclosed to the Board.
• A minimum of three Directors and a maximum of twelve.
The Board is conscious of the ASX Corporate Governance Guide which recommends that the roles of Chairman and
Chief Executive Officer should not be exercised by the same individual. Given the breadth of the Group’s operations and
the Executive Chairman’s extensive business experience, the Board considers it appropriate at this stage in the Group’s
development that the Executive Chairman be considered the most senior Executive overseeing and supervising the Group as
well as managing the Group’s Executive team.
Role of the Board
The Board’s primary role is the protection and enhancement of long-term shareholder value.
To fulfil this role, the Board has adopted a charter which establishes the relationship between the Board and management
and describes their functions and responsibilities. The Board’s charter can be viewed on the Company’s website (www.
thinksmartworld.com). The Board’s responsibilities, as set out in the Board Charter, include:
• working with management to establish ThinkSmart’s strategic direction;
• monitoring management and financial performance;
• monitoring compliance and risk management;
• reviewing procedures in place for appointment of senior management and monitoring of its performance and for
succession planning; and
• ensuring effective disclosure policies and procedures.
Matters which are specifically reserved for the Board or its Committees under the Board Charter include:
• appointment of the Chairman and Directors;
• appointment and removal of the Chief Executive Officer;
• development and review of corporate governance principles and policies; and
• approval of operational budgets, major capital expenditure, acquisitions and divestitures in excess of authority levels
delegated to management.
The Board has delegated responsibility for operations and administration of the Company to the Chief Executive Officer and
executive management. Responsibilities are delineated by formal authority delegations.
Board Committees
To assist in the execution of its responsibilities, the Board may delegate responsibility to committees to consider certain
issues in further detail and then report back to and advise the Board. Committees established by the Board have adopted
charters setting out the authority, responsibilities, membership and operation of the committee. There are currently two
committees the Audit and Risk Committee and Nomination and Remuneration Committee. Each committee has a charter
which can be viewed on the Company’s website.
DIRECTORS’ REPORTF
or p
erso
nal u
se o
nly

30
Audit and Risk Committee
The Committee’s primary role is to assist the Board in carrying out its accounting, auditing and financial reporting
responsibilities, including oversight of:
• the integrity of the Company’s external financial reporting and financial statements;
• the Company’s ongoing risk management program which is designed to effectively identify all areas of potential risk;
• policies and procedures designed and implemented to manage identified risks;
• the effectiveness of the internal control framework within the Company; and
• the appointment, independence and remuneration of the external auditor.
The Audit and Risk Committee has a documented charter, approved by the Board, which is available on the website (www.
thinksmartworld.com). The Committee must comprise at least three Directors, all of whom must be Non-Executive Directors.
The Chairman of the Committee may not be the Chairman of the Board. The members of the Audit and Risk Committee
during the year were Non-Executive Directors, and are D Griffiths (Chairman), S Penglis and N Fox.
The Company maintains a risk management policy which can be found on the Company’s website (www.thinksmartworld.com).
The Committee meets as often as the Committee members deem necessary in order to fulfil their role. The external auditors,
Chief Executive Officer and Chief Financial Officer, are invited to the Audit Committee meetings at the discretion of the
Committee. The external auditor met with the Audit Committee and the Board of Directors twice during the year without
management being present.
Nomination and Remuneration Committee
The Nomination and Remuneration Committee assists and advises the Board on the effective composition, size and
capabilities to ensure the Board is prepared to discharge its responsibilities and duties expediently and in the best interests of
the Company as a whole. The current members of the Committee are S Penglis (Chairman), D Griffiths, and F De Vicente.
The Nomination and Remuneration Committee reviews and makes recommendations to the Board on remuneration packages
and policies applicable to the Directors and Executives of the Company.
The Committee meets as often as the Committee members deem necessary in order to fulfil their role. The Committee
consists of a minimum of three members, with the majority being Non-Executive Directors and with an independent Director
as Chairman. The Nomination and Remuneration Committee has a documented charter, approved by the Board, which is
available on the website (www.thinksmartworld.com).
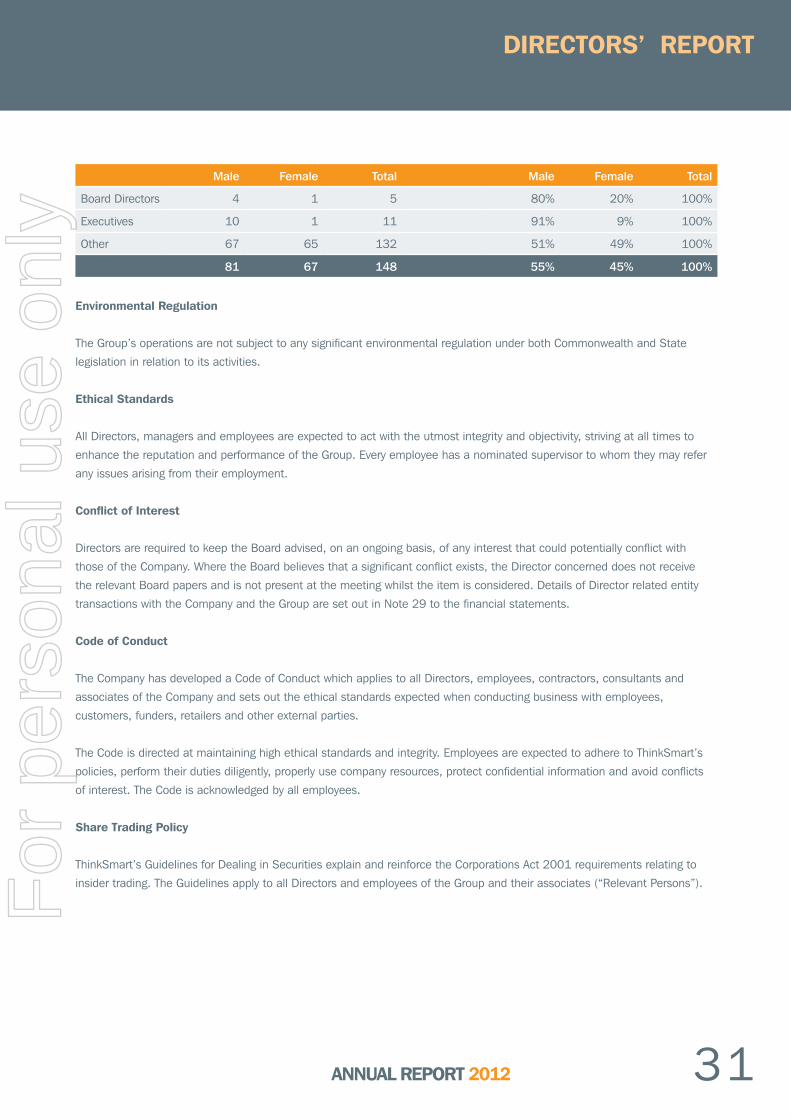
Diversity
The Board is committed to having an appropriate blend of diversity on the Board and in the Group’s senior executive
positions. The Board is developing a policy on diversity, to complement and enhance the Anti-Discrimination and Equal
Employment Opportunity Policy it displays on its intranet site. The following represents the gender diversity in the Group as at
31 December 2012:
DIRECTORS’ REPORTF
or p
erso
nal u
se o
nly
ANNUAL REPORT 2012 31
Male Female Total Male Female Total
Board Directors 4 1 5 80% 20% 100%
Executives 10 1 11 91% 9% 100%
Other 67 65 132 51% 49% 100%
81 67 148 55% 45% 100%
Environmental Regulation
The Group’s operations are not subject to any significant environmental regulation under both Commonwealth and State
legislation in relation to its activities.
Ethical Standards
All Directors, managers and employees are expected to act with the utmost integrity and objectivity, striving at all times to
enhance the reputation and performance of the Group. Every employee has a nominated supervisor to whom they may refer
any issues arising from their employment.
Conflict of Interest
Directors are required to keep the Board advised, on an ongoing basis, of any interest that could potentially conflict with
those of the Company. Where the Board believes that a significant conflict exists, the Director concerned does not receive
the relevant Board papers and is not present at the meeting whilst the item is considered. Details of Director related entity
transactions with the Company and the Group are set out in Note 29 to the financial statements.
Code of Conduct
The Company has developed a Code of Conduct which applies to all Directors, employees, contractors, consultants and
associates of the Company and sets out the ethical standards expected when conducting business with employees,
customers, funders, retailers and other external parties.
The Code is directed at maintaining high ethical standards and integrity. Employees are expected to adhere to ThinkSmart’s
policies, perform their duties diligently, properly use company resources, protect confidential information and avoid conflicts
of interest. The Code is acknowledged by all employees.
Share Trading Policy
ThinkSmart’s Guidelines for Dealing in Securities explain and reinforce the Corporations Act 2001 requirements relating to
insider trading. The Guidelines apply to all Directors and employees of the Group and their associates (“Relevant Persons”).
DIRECTORS’ REPORTF
or p
erso
nal u
se o
nly

32
The Guidelines expressly prohibit Relevant Persons buying or selling ThinkSmart securities where the Relevant Person or
ThinkSmart is in possession of price sensitive or ‘inside’ information. The Guidelines establish windows where Relevant
Persons (provided they are not in possession of inside information) may buy or sell the Company’s shares in the period from
31 days following:
• the announcement of half-year results;
• the announcement of annual results; or
• the holding of the annual general meeting.
Outside the window period, Relevant Persons must receive clearance for any proposed dealing in ThinkSmart’s securities on
ASX as follows:
• a Director must receive approval from the Chairman;
• the Chairman must receive approval from the Board or the Deputy Chairman;
• executives and senior management must receive approval from the Chief Executive Officer; and
• all other Relevant Persons must receive approval from the Company Secretary.
The Guidelines for Dealing in Securities are available to view on the Company’s website.
Continuous Disclosure
The Company Secretary has been nominated as the person responsible for communication with the Australian Securities
Exchange (“ASX”). This role includes responsibility for ensuring compliance with the continuous disclosure requirements in
the ASX Listing Rules and overseeing and co-ordinating information disclosure to the ASX, analysts, brokers, shareholders,
the media and the public. When analysts are briefed following half-year and full-year results announcements, the material
used in the presentations is released to the ASX prior to the commencement of the briefing. The Company ensures that if
any price sensitive information is inadvertently disclosed, this information is also immediately released to the market. The
Company is committed to ensuring that all stakeholders and the market are provided with relevant and accurate information
regarding its activities in a timely manner.
Communication with Shareholders
The Board provides shareholders with information following the Company’s Disclosure Policy which ensures compliance with
the continuous disclosure requirements of the ASX Listing Rules and overseeing and co-ordinating information disclosure to
shareholders, the market, media and the public.
The Disclosure Policy includes the following guidelines:
• Information is communicated to shareholders through ASX announcements, the annual report, annual general
meeting and half-year and full-year results announcements.
• Shareholders are able to access information, including media releases, key policies and the terms of reference of
the Board Committees through the Company’s website. All relevant ASX announcements will be posted on the
website as soon as they have been released to ASX.
• The Company encourages participation of shareholders at its annual general meeting. The external auditor will
attend the annual general meeting and be available to answer shareholder questions about the conduct of the audit
and the preparation and content of the auditor’s report.
DIRECTORS’ REPORTF
or p
erso
nal u
se o
nly

ANNUAL REPORT 2012 33
Financial Reporting
The Chief Executive Officer and Chief Financial Officer have certified to the Board that the Company’s financial statements are
complete and present a true and fair view, in all material respects, of the financial condition and operational results of the
Company and are in accordance with relevant accounting standards. The Board receives monthly reports from management
on the financial and operational performance of the Group.
Performance Assessment
The Board undertakes an annual self assessment of its collective performance, the performance of the Chairman, the
Directors and of its Committees.
Independent Professional Advice
Following consultation with the Deputy Chairman, Directors may seek independent professional advice at the Company’s
expense. Generally, this advice will be available to all Directors.
Indemnification and Insurance
During the year ended 31 December 2012, the Company paid insurance premiums in respect of a Directors’ and Officers’
Liability insurance contract. Disclosure of the total amount of the premium and the nature of the liabilities in respect of such
insurance is prohibited by the policy.
The Company has not otherwise, during or since the financial year, indemnified or agreed to indemnify an officer or auditor of
the Company or of any related body corporate against a liability incurred by such an officer or Director.
DIRECTORS’ REPORTF
or p
erso
nal u
se o
nly

34
NON-AUDIT SERVICES
During the year KPMG, the Company auditor, has performed certain other services in addition to their statutory duties.
The Board has considered the non-audit services provided during the year by the auditor and in accordance with written
advice provided by resolution of the Audit Committee, is satisfied that the provision of those non-audit services during the
year is compatible with, and did not compromise, the auditor independence requirements of the Corporations Act 2001 for
the following reasons:
• All non-audit services are subject to the corporate governance procedures adopted by the Company and have been
reviewed by the Audit Committee to ensure they do not impact the integrity and objectivity of the auditor; and
• The non-audit services provided do not undermine the general principles relating to auditor independence as set
out in APES 110 Code of Ethics for Professional Accountants, as they did not involve reviewing or auditing the
auditor’s own work, acting in a management or decision making capacity for the Company, acting as an advocate
for the Company or jointly sharing risks and rewards.
Details of the amounts paid to the auditor of the Group, KPMG, and its related practices for audit and non-audit services
provided during the year are set out in Note 25.
AUDITOR’S INDEPENDENCE DECLARATION
The auditor’s independence declaration which forms part of this report is included in page 35 of the financial report.
ROUNDING
ThinkSmart is a Group of the kind referred to in ASIC Class Order 98/100 dated 10 July 1998, as varied by Class Order
05/641 dated 28 July 2005 and Class Order 06/51 dated 31 January 2006. In accordance with those class orders, amounts
in the financial statements and the directors’ report have been rounded off to the nearest thousand dollars, unless otherwise
indicated.
Signed in accordance with a resolution of the Directors made pursuant to s.298 (2) of the Corporations Act 2001.
On behalf of the Directors
______________________________
N Montarello
Chairman
Perth, 19 February 2013
DIRECTORS’ REPORTF
or p
erso
nal u
se o
nly

ANNUAL REPORT 2012 35
Lead Auditor’s Independence Declaration under Section 307C of the Corporations Act 2001
To: the Directors of ThinkSmart Limited
I declare that, to the best of my knowledge and belief, in relation to the audit for the financial year ended 31 December 2012
there have been:
(i) no contraventions of the auditor independence requirements as set out in the Corporations Act 2001 in
relation to the audit; and
(ii) no contraventions of any applicable code of professional conduct in relation to the audit.
KPMG
Matthew Beevers
Partner
Perth
19 February 2013
AUDITOR’S INDEPENDENCE DECLARATION
KPMG
Matthew Beevers
KPMG
Matthew Beevers
For
per
sona
l use
onl
y

36
1. In the opinion of the Directors of ThinkSmart Limited:
(a) The consolidated financial statements, notes and additional disclosures in the Remuneration Report in the
Directors’ report, are in accordance with the Corporations Act 2001, including:
i. Giving a true and fair view of the Group’s financial position as at 31 December 2012 and of its
performance for the financial year ended on that date; and
ii. Complying with Australian Accounting Standards (including the Australian Accounting
Interpretations) and the Corporations Regulations 2001;
(b) The financial report also complies with International Financial Reporting Standards as disclosed in
Note 2(a); and
(c) There are reasonable grounds to believe that the Company will be able to pay its debts as and when they
become due and payable.
2. The Directors have been given the declarations required by Section 295A of the Corporations Act 2001 from the
Chief Executive Officer and Chief Financial Officer for the financial year ended 31 December 2012.
Signed in accordance with a resolution of the Directors:
______________________________
N Montarello
Chairman
Perth, 19 February 2013
DIRECTORS’ DECLARATIONF
or p
erso
nal u
se o
nly

ANNUAL REPORT 2012 37
Notes
2012
$000
2011
$000
Portfolio income 6(a) 24,098 19,509
Interest expense 6(c) (4,240) (1,292)
Net portfolio income 19,858 18,217
Commission income 12,037 21,860
Other revenue 6(b) 3,588 4,985
Net operating income 35,483 45,062
Indirect customer acquisition cost (8,139) (9,753)
Other operating expenses 6(d) (21,734) (21,044)
Depreciation and amortisation 6(e) (3,236) (2,261)
Impairment losses 6(f) (4,280) (1,591)
Restructuring costs - (402)
(Loss)/profit before tax (1,906) 10,011
Income tax benefit/(expense) 7 465 (3,213)
(Loss)/profit after tax (1,441) 6,798
(Loss)/earnings per share
Basic (cents per share) 31 (0.95) 5.23
Diluted (cents per share) 31 (0.95) 5.23
The attached notes form an integral part of these consolidated financial statements.
CONSOLIDATED INCOME STATEMENTFOR THE FINANCIAL YEAR ENDED 31 DECEMBER 2012
For
per
sona
l use
onl
y

38
2012
$000
2011
$000
(Loss)/profit for the year (1,441) 6,798
Other comprehensive income
Foreign currency translation differences for foreign operations 366 (65)
Effective portion of changes in fair value of cash flow hedges, net
of tax 118 (208)
Other comprehensive income for the period, net of income tax 484 (273)
Total comprehensive income for the period attributable to
owners of the Company (957) 6,525
The attached notes form an integral part of these consolidated financial statements.
CONSOLIDATED STATEMENT OF COMPREHENSIVE INCOMEFOR THE FINANCIAL YEAR ENDED 31 DECEMBER 2012
For
per
sona
l use
onl
y

ANNUAL REPORT 2012 39
Notes
2012
$000
2011
$000
Current assets
Cash and cash equivalents 22(a) 18,568 4,610
Trade receivables 2,803 9,930
Loan and lease receivables 9 39,164 38,419
Other current assets 8 3,571 5,337
Total current assets 64,106 58,296
Non-current assets
Loan and lease receivables 9 23,250 28,006
Plant and equipment 11 886 874
Intangible assets 12 14,080 10,689
Goodwill 14 3,627 3,539
Deferred tax assets 7 2,352 -
Other non-current assets 10 6,644 6,777
Total non-current assets 50,839 49,885
Total assets 114,945 108,181
Current liabilities
Trade and other payables 16 6,641 6,903
Deferred service income 17 2,977 1,380
Borrowings 18 - 2,427
Other interest bearing liabilities 19 34,300 36,731
Tax payable 516 1,607
Provisions 16 606 511
Total current liabilities 45,040 49,559
Non-current liabilities
Deferred service income 17 1,821 1,192
Other interest bearing liabilities 19 20,063 16,991
Deferred tax liability 7 - 173
Total non-current liabilities 21,884 18,356
Total liabilities 66,924 67,915
Net assets 48,021 40,266
Equity
Issued capital 20(a) 48,073 39,664
Reserves 21 (3,083) (3,870)
Accumulated profits 3,031 4,472
Total equity 48,021 40,266
The attached notes form an integral part of these consolidated financial statements.
CONSOLIDATED STATEMENT OF FINANCIAL POSITIONAS AT 31 DECEMBER 2012
For
per
sona
l use
onl
y

40
CONSOLIDATED STATEMENT OF CHANGES IN EQUITYFOR THE FINANCIAL YEAR ENDED 31 DECEMBER 2012
Consolidated
Fully paid
ordinary
shares
$000
Equity
settled
employee
benefits
reserve
$000
Foreign
currency
translation
reserve
$000
Hedging
reserve
$000
Accumulated
Profit
$000
Attributable
to equity
holders of
the parent
$000
Balance at 1 January 2011 39,615 231 (4,367) - 2,220 37,699
Profit for the period - - - - 6,798 6,798
Exchange differences arising on translation
of foreign operations, net of tax - - (65) - - (65)
Effective portion of changes in fair value of
cash flow hedges, net of tax - - - (208) - (208)
Total other comprehensive income - - (65) (208) 6,798 6,525
Total comprehensive income for the period - - (65) (208) 6,798 6,525
Transactions with owners of the Company, recognised directly in equity
Contributions by and distributions to owners of the Company
Capital raising costs (16) - - - - (16)
Dividends paid - - - - (4,546) (4,546)
Share-based payments held in escrow 65 (65) - - - -
Recognition of share-based payments - 604 - - - 604
Balance at 31 December 2011 39,664 770 (4,432) (208) 4,472 40,266
Balance at 1 January 2012 39,664 770 (4,432) (208) 4,472 40,266
Loss for the period - - - - (1,441) (1,441)
Exchange differences arising on translation
of foreign operations, net of tax - - 366 - - 366
Effective portion of changes in fair value of
cash flow hedges, net of tax - - - 118 - 118
Total other comprehensive income - - 366 118 (1,441) (957)
Total comprehensive income for the period - - 366 118 (1,441) (957)
Transactions with owners of the Company, recognised directly in equity
Contributions by and distributions to owners of the Company
Issue of ordinary shares, net of after tax
capital raising costs 9,100 - - - - 9,100
Capital raising costs (714) - - - - (714)
Share-based payments held in escrow 23 (23) - - - -
Recognition of share-based payments - 326 - - - 326
Balance at 31 December 2012 48,073 1,073 (4,066) (90) 3,031 48,021
The attached notes form an integral part of these consolidated financial statements.
For
per
sona
l use
onl
y

ANNUAL REPORT 2012 41
Notes
2012
$000
2011
$000
Cash Flows from Operating Activities
Receipts from customers 54,026 45,961
Payments to suppliers and employees (44,127) (27,908)
Interest received 1,271 944
Interest paid on corporate borrowings (686) (155)
Interest paid on other interest bearing liabilities (3,998) (1,130)
Payments for security guarantee (2,542) (1,635)
Finance charges (51) (1,594)
Income tax paid (3,203) (2,071)
Net cash from operating activities 22(b) 690 12,412
Cash Flows from Investing Activities
Payments for plant and equipment (418) (341)
Payment for intangible assets – Software (919) (1,574)
Payment for intangible assets – Contract rights (965) (2,973)
Payment for leased assets - (36,861)
Net cash used in investing activities (2,302) (41,749)
Cash Flows from Financing Activities
Proceeds from share issue 9,100 -
Payment of capital raising costs (1,020) -
Payment for establishing financing facilities - (80)
Proceeds from other interest bearing liabilities 25,570 26,490
Repayment of other interest bearing liabilities (15,596) (9,260)
Proceeds of borrowings 2,500 2,500
Repayment of borrowings (5,004) (2,500)
Dividend paid - (4,546)
Net cash from financing activities 15,550 12,604
Net increase/(decrease) in cash and cash equivalents 13,938 (16,733)
Effect of exchange rate fluctuations on cash held 20 157
Cash and cash equivalents at beginning of the financial year 4,610 21,186
Total cash and cash equivalents at the end of the financial year 22(a) 18,568 4,610
Restricted cash and cash equivalents at the end of the financial year (12,560) (2,028)
Net available cash and cash equivalents at the end of the financial year 6,008 2,582
The attached notes form an integral part of these consolidated financial statements.
CONSOLIDATED STATEMENT OF CASH FLOWFOR THE FINANCIAL YEAR ENDED 31 DECEMBER 2012
For
per
sona
l use
onl
y

NOTES TO THE FINANCIAL STATEMENTS
42
1. GENERAL INFORMATION
ThinkSmart Limited (the “Company”) is a publicly listed company, incorporated and domiciled in Australia. The consolidated
financial statements of the Company as at and for the year ended 31 December 2012 comprise of the Company and its
subsidiaries (the “Group”). The Group is a for profit entity and its principal activity during the year was the provision of lease
and rental financing services in Australia and the UK and the supply of interest free payment plans in Australia. The address
of the Company’s registered office is Level 1, The West Centre, 1260 Hay Street, West Perth, WA 6005.
2. BASIS OF PREPARATION
(a) Statement of compliance
The consolidated financial statements are general purpose financial statements which have been prepared in accordance
with the Australian Accounting Standards (AASBs) adopted by the Australian Accounting Standards Board (AASB) and the
Corporations Act 2001. The consolidated financial statements comply with International Financial Reporting Standards
(IFRSs) and interpretations adopted by the International Accounting Standards Board (IASB).
The consolidated financial statements were authorised for issue by the Board of Directors on 19 February 2013.
(b) Basis of measurement
The financial report has been prepared on the basis of historical cost, except for the derivative financial instruments
measured at fair value. Cost is based on the fair values of the consideration given in exchange for assets. All amounts are
presented in Australian Dollars unless otherwise noted.
(c) Functional and presentation currency
These consolidated financial statements are presented in Australian dollars, which is the Company’s functional currency.
(d) Changes in accounting policies
There have been no changes in accounting policies during the year.
The Group has presented a separate Consolidated Income Statement and Consolidated Statement of Comprehensive Income
and certain comparative amounts in the Consolidated Income Statement have been reclassified to conform with the current
year’s presentation.
(e) Accounting policies available for early adoption not yet adopted
A number of new standards and interpretations are effective for annual periods beginning after 1 January 2013 and have
not been applied in preparing this financial report. Where an assessment has been completed, none of these are expected
to have a significant effect on the consolidated financial statements of the Group, except for IFRS 9 Financial Instruments,
which becomes mandatory for the Group’s 2015 consolidated financial statements and could change the classification and
measurement of financial assets. The Group does not plan to adopt this standard early and the extent of the impact has not
been determined.
For
per
sona
l use
onl
y

NOTES TO THE FINANCIAL STATEMENTS
ANNUAL REPORT 2012 43
Reference Title Summary Application
date of
standard
Impact on Group
financial report
Application
date for
Group
AASB 9
AASB
2009-11
AASB
2010-7
Financial Instruments
Amendments to
Australian Accounting
Standards arising from
AASB 9
Amendments to
Australian Accounting
Standards arising from
changes to AASB 9
AASB 9 includes requirements for the
classification and measurement of
financial assets resulting from the first
part of Phase 1 of the IASB’s project to
replace IAS 39 Financial Instruments:
Recognition and Measurement (AASB
139 Financial Instruments: Recognition
and Measurement). These requirements
improve and simplify the approach for
classification, measurement and
de-recognition of financial assets
compared with the requirements of
AASB 139.
(a) These amendments arise from
the issuance of AASB 9 Financial
Instruments that set out requirements
for the classification and measurement
of financial assets.
(b) This Standard shall be applied when
AASB 9 is applied.
The requirements for classifying
and measuring financial liabilities
were added to AASB 9. The existing
requirements for the classification of
financial liabilities and the ability to use
the fair value option have been retained.
However, where the fair value option is
used for financial liabilities the change
in fair value is accounted for as follows:
(a) The change attributable to changes
in credit risk are presented in other
comprehensive income (OCI).
(b) The remaining change is presented
in profit or loss if this approach creates
or enlarges an accounting mismatch
in the profit or loss, the effect of the
changes in credit risk are also presented
in profit or loss.
1-Jan-2015 The Group
has not yet
determined the
extent of the
impacts of the
amendments, if
any.
1-Jan-2015
For
per
sona
l use
onl
y

NOTES TO THE FINANCIAL STATEMENTS
44
Reference Title Summary Application
date of
standard
Impact on Group
financial report
Application
date for
Group
AASB
1053
AASB
2010-2
Application of Tiers of
Australian Accounting
Standards
Amendments to
Australian Accounting
Standards arising from
reduced disclosure
requirements
This Standard establishes a differential
financial reporting framework consisting
of two Tiers of reporting requirements
for preparing general purpose financial
statements.
This Standard makes amendments to
many Australian Accounting Standards,
reducing the disclosure requirements for
Tier 2 entities, identified in accordance
with AASB 1053, preparing general
purpose financial statements.
1-Jul-2013 The Group has
determined there
is no material
impact on the
Group Financial
Statements.
1-Jan-2014
AASB
2011-4
Amendments to
Australian Accounting
Standards to remove
individual key
management personnel
disclosure requirements
The amendment removes the
requirement to include individual key
management personnel disclosures in
the notes to the financial statement.
These disclosures will still need to be
provided in the Remuneration Report
under s.300A of the Corporations Act
2001. Early adoption is not permitted.
1-Jul-2013 The Group’s
financial
statements will
exclude these
disclosures in
the notes to
the financial
statements but
still disclose
these in the
Directors Report
– remuneration
report.
1-Jan-2014
AASB 10 Consolidated Financial
Statements
Consolidated Financial Statements
introduces control as the single basis for
consolidation for all entities, regardless
of the nature of the investee. AASB
10 replaces those parts of AASB 127
‘Consolidated and Separate Financial
Statements’ that address when and how
an investor should prepare consolidated
financial statements and replaces SIC-
12 ‘Consolidation – Special Purpose
Entities’ in its entirety.
1-Jan-2013 The Group
has not yet
determined the
extent of the
impacts of the
amendments, if
any.
1-Jan-2013
For
per
sona
l use
onl
y

NOTES TO THE FINANCIAL STATEMENTS
ANNUAL REPORT 2012 45
Reference Title Summary Application
date of
standard
Impact on Group
financial report
Application
date for
Group
AASB 11
AASB 12
AASB 127
AASB 128
Joint Arrangements
Disclosure of Interest in
Other Entities
Separate Financial
Statements
Investments in Associates
Amendments to these standards are
concurrent with the issue of AASB 10.
Key changes include:
Using control as the single basis for
consolidation, irrespective of the nature
of the investee, eliminating the risks and
rewards approach included in SIC-12.
The definition of control includes three
elements: power over an investee,
exposure or rights to variable returns of
the investee, and ability to use power
over the investee to affect the investor’s
return.
An investor would reassess whether it
controls an investee if there is a change
in facts and circumstances.
AASB 12 ‘Disclosure of Interests
in Other Entities’ applies to entities
that have an interest in subsidiaries,
joint arrangements, associates or
unconsolidated structured entities.
It serves to integrate the disclosure
requirements of interests in other
entities, currently included in several
standards, and also adds additional
requirements in a number of areas.
1-Jan-2013 The Group
has not yet
determined the
extent of the
impacts of the
amendments, if
any.
1-Jan-2013
AASB 119
AASB
2011-10
Employee Benefits
Amendments to
Australian Accounting
Standards arising from
changes to AASB 119
Amendments will result in changes
to the recognition and measurement
of defined benefit pension expense
and termination benefits, and to the
disclosures for all employee benefits.
1-Jan-2013 Amendments
are not expected
to have any
significant
impact on the
Group’s financial
statements.
1-Jan-2013
For
per
sona
l use
onl
y

NOTES TO THE FINANCIAL STATEMENTS
46
Reference Title Summary Application
date of
standard
Impact on Group
financial report
Application
date for
Group
AASB 101 Presentation of Financial
Statements
The amendment changes the disclosure
of items presented in OCI in the
Statement of Comprehensive Income.
The key changes include:
Items are presented separately, in two
groups in OCI, based on whether or not
they may be recycled to profit or loss in
the future; and
Where OCI items have been presented
before tax, the amount of tax related to
the two groups will need to be shown.
1-Jul-2012 Amendments
are not expected
to have any
significant
impact on the
Group’s financial
statements.
1-Jan-2013
AASB 13
AASB
2011-8
Fair value measurement
Amendments to
Australian Accounting
Standards arising from
changes to AASB 13
AASB 13 explains how to measure fair
value when required to by other AASBs.
It does not introduce new fair value
measurements, nor does it eliminate
the practicability exceptions to fair value
that currently exist in certain standards.
1-Jan-2013 Amendments
are not expected
to have any
significant
impact on the
Group’s financial
statements.
1-Jan-2013
AASB
2012-3
Amendments to
Australian Accounting
Standards arising from
changes to AASB 132
The amendments to AASB 132 clarify
when an entity has a legally enforceable
right to set-off financial assets and
financial liabilities permitting entities to
present balances net on the balance
sheet.
1-Jan-2014 The Group
has not yet
determined the
extent of the
impacts of the
amendments, if
any.
1-Jan 2014
AASB
2012-2
Amendments to
Australian Accounting
Standards arising from
changes to AASB 7
AASB 7 is amended to increase the
disclosures about offset positions,
including the gross position and the
nature of the arrangements.
1-Jan 2013 The Group
has not yet
determined the
extent of the
impacts of the
amendments, if
any.
1-Jan-2013
For
per
sona
l use
onl
y

NOTES TO THE FINANCIAL STATEMENTS
ANNUAL REPORT 2012 47
3. SIGNIFICANT ACCOUNTING POLICIES
The accounting policies set out below have been applied consistently to all periods presented in these consolidated financial
statements, and have been applied consistently by Group entities.
(a) Basis of consolidation
(i) Subsidiaries
The consolidated financial statements incorporate the financial statements of the company and entities controlled
by the company (its subsidiaries). Control is achieved when the company has the power to govern the financial and
operating policies of an entity so as to obtain the benefits from its activities. The results of subsidiaries acquired or
disposed of during the year are included in the consolidated income statement from the effective date of acquisition
or up to the effective date of disposal, as appropriate. The accounting policies of subsidiaries have been changed
when necessary to align them with the policies adopted by the Group.
(ii) Special purpose entities
The Group has established a special purpose entity (SPE), ThinkSmart Trust, for the purpose of securitising finance
lease receivables acquired and other receivables it intends to originate. The SPE entity is wholly owned by the
Group and included in the consolidated financial statements of the Group, based on the evaluation of the substance
of its relationship with the Group and the SPE’s risks and rewards. The following circumstances indicate a
relationship in which the Group controls and subsequently consolidates the SPE:
• The activities of the SPE are being conducted on behalf of the Group according to its specific business needs so
that the Group obtains benefits from the SPE’s operation.
• The Group has the decision making powers to obtain the majority of the benefits of the activities of the SPE or, by
setting up an ‘autopilot mechanism’, the Group has delegated these decision making powers.
• The Group has rights to obtain the majority of the benefits of the SPE and therefore may be exposed to risks
incident to the activity of the SPE.
• The Group retains the majority of the residual of ownership risks of the SPE or its asset in order to obtain benefits
from its activities.
(iii) Transactions eliminated on consolidation
Where necessary, adjustments are made to the financial statements of subsidiaries to bring their accounting
policies in line with those by other members of the Group. All intra-group balances, transactions, income and
expenses are eliminated in full on consolidation.
(b) Business combinations
For every business combination, the Group identifies the acquirer, which is the combining entity that obtains control
of the other combining entities or businesses. Control is the power to govern the financial and operating policies
of an entity so as to obtain benefits from its activities. In assessing control, the Group takes into consideration
potential voting rights that currently are exercisable. The acquisition date is the date on which control is transferred
to the acquirer. Judgement is applied in determining the acquisition date and determining whether control is
transferred from one party to another.
For
per
sona
l use
onl
y

NOTES TO THE FINANCIAL STATEMENTS
48
Measuring goodwill
The Group measures goodwill as the fair value of consideration transferred including the recognised amount of any non-
controlling interest in the acquiree, less the net recognised amount (generally fair value) of the identifiable assets acquired
and liabilities assumed, all measured as of the acquisition date.
Consideration transferred includes the fair values of the asset transferred, liabilities incurred by the Group to the previous
owners of the acquiree, and equity interests issued by the Group. Consideration transferred also includes the fair value of
any contingent consideration and share-based payment awards of the acquiree that are replaced mandatorily in the business
combination.
(c) Cash and cash equivalents
Cash comprises cash on hand and demand deposits. Cash equivalents are short-term, highly liquid investments that are
readily converted to known amounts of cash and which are subject to an insignificant risk of change in value.
Bank overdrafts are shown within borrowings in current liabilities in the balance sheet.
(d) Plant and equipment
Recognition and measurement
Items of property, plant and equipment are measured at cost less accumulated depreciation and accumulated impairment
losses. Cost includes expenditure that is directly attributable to the acquisition of the asset. Purchased software that is
integral to the functionality of the related equipment is capitalised as part of that equipment.
When parts of an item of property, plant and equipment have different useful lives they are accounted for as separate items
(major components) of property, plant and equipment.
The gain or loss on disposal of an item of property, plant and equipment is determined by comparing the proceeds from
disposal with the carrying amount of the property, plant and equipment, and is recognised net within other income/other
expenses in profit or loss.
Depreciation
Depreciation is based on the cost of an asset less its residual value. Significant component of individual assets are assessed
and if a component has a useful life that is different from the remainder of the asset, that component is depreciated
separately.
Depreciation recognised in profit or loss on a straight-line basis over the estimated useful lives of each component of an item
of property, plant and equipment.
The following estimated useful lives are used in the calculation of depreciation:
- Office furniture, fittings, equipment and computers 2.5 to 5 years
- Leasehold improvements the lease term
- Self-funded rental assets 2.5 to 5 years
- Motor vehicles 5 years
- Leased computer equipment and software 2.5 to 5 years
Depreciation methods, useful lives and residual values are reviewed at each reporting date.
For
per
sona
l use
onl
y

NOTES TO THE FINANCIAL STATEMENTS
ANNUAL REPORT 2012 49
(e) Trade and other payables
Trade payables are recognised when the consolidated entity becomes obliged to make future payments resulting from the
purchase of goods and services.
(f) Investments
Investments in controlled entities are recorded at the lower of cost and recoverable amount.
(g) Financial instruments
(i) Non-derivative financial assets
The group initially recognises loans and receivables and deposits on the date that they are originated. All other
financial assets (including assets designated at fair value through profit or loss) are recognised initially on the trade
date at which the Group becomes a party to the contractual provisions of the instrument.
The group derecognises a financial asset when the contractual rights to the cash flows from the asset expire, or
it transfers the right to receive the contractual cash flows on the financial asset in a transaction in which
substantially all the risks and rewards of ownership of the financial asset are transferred. Any interest in transferred
financial assets that is created or retained by the group is recognised as a separate asset or liability.
Financial assets and liabilities are offset and the net amount presented in the statement of financial position when,
and only when, the group has a legal right to offset the amounts and intends either to settle on a net basis or to
realise the asset and settle the liability simultaneously.
Investments
Investments are recognised and derecognised on trade date where purchase or sale of an investment is under a contract
whose terms require delivery of the investment within the timeframe established by the market concerned, and are initially
measured at fair value net of transaction costs. Subsequent to initial recognition, investments in subsidiaries are measured
at cost in the company financial statements. Subsequent to initial recognition, investments in associates are accounted for
under the equity method in the consolidated financial statements and the cost method in the company. Other financial assets
are classified into the following specified categories: financial assets at ‘fair value through profit and loss’, ‘held-to-maturity’
investments, ‘available-for-sale’ financial assets and ‘loans and receivables’. The classification depends on the nature and
purpose of the financial assets and is determined at the time of initial recognition.
Lease receivables
The Group has entered into financing transactions with customers and has classified its leases as finance leases for
accounting purposes. Under a finance lease, substantially all the risks and benefits incidental to the ownership of the leased
asset are transferred by the lessor to the lessee. The Group recognises at the beginning of the lease term an asset at an
amount equal to the aggregate of the present value (discounted at the interest rate implicit in the lease) of the minimum
lease payments and an estimate of the value of any unguaranteed residual value expected to accrue to the benefit of the
Group at the end of the lease term. This asset represents the Group’s net investment in the lease. Finance leases acquired
from other parties are recognised at fair value including direct and incremental costs and subsequently remeasured at
amortised cost using the effective interest rate method and are presented net of provisions for impairment.
Unearned interest
Unearned interest on leases and other receivables is brought to account over the life of the lease contract based on
the interest rate implicit in the lease using the effective interest rate method.
For
per
sona
l use
onl
y

NOTES TO THE FINANCIAL STATEMENTS
50
Initial direct transaction costs
Initial direct costs or directly attributable, incremental transaction costs incurred in the origination of leases are
included as part of receivables in the balance sheet and are amortised in the calculation of lease income and
interest income.
Allowance for losses
The collectability of lease receivables is assessed on an ongoing basis. A provision is made for losses based on
historical rates of arrears and the current delinquency position of the portfolio.
Effective interest method
The effective interest method is a method of calculating the amortised cost of a financial asset and allocating interest income
over the relevant period. The effective interest rate is the rate that exactly discounts estimated future cash receipts through
the expected life of the financial asset or, where appropriate, a shorter period.
Loan receivables
Loan receivables are financial assets with fixed or determinable payments that are not quoted in an active market. Such
assets are recognised initially at fair value plus any directly attributable transaction costs. Subsequent to initial recognition
loans and receivables are measured at amortised cost using the effective interest method, less any impairment losses.
Insurance prepayment
In respect to the UK operations, when an equipment insurance policy is issued by Allianz to RentSmart Limited’s customers,
RentSmart Limited pays the customer’s insurance premium to Allianz. RentSmart Limited subsequently collects the insurance
premium from the customer on a monthly basis over the life of the rental agreement. Where a policy is cancelled, the
unexpired premiums are refunded to RentSmart Limited.
(ii) Non-derivative financial liabilities
The Group initially recognises debt securities issued and subordinated liabilities on the date that they are originated. The
Group derecognises a financial liability when its contractual obligations are discharged or cancelled or expire.
Financial liabilities are recognised initially at fair value plus any directly attributable transaction costs. Subsequent to initial
recognition, these financial liabilities are measured at amortised cost using the effective interest rate method.
Capitalised borrowing costs consist of legal and other costs that are incurred in connection with the borrowing of funds. These
costs are capitalised and then amortised over the life of the loan.
Financial guarantee contracts
Financial guarantees issued by the Group are recognised as financial liabilities at the date the guarantee is issued. Liabilities
arising from financial guarantee contracts, including where applicable, guarantees of subsidiaries through deeds of cross
guarantee, are initially recognised at fair value and subsequently at the higher of the amount of projected future losses and
the amount initially recognised less cumulative amortisation.
The fair value of the financial guarantee is determined by way of calculating the present value of the difference in net cash
flows between the contractual payments under the debt instrument and the payments that would be required without the
guarantee, or the estimated amount that would be payable to a third party for assuming the obligation.
For
per
sona
l use
onl
y

NOTES TO THE FINANCIAL STATEMENTS
ANNUAL REPORT 2012 51
Any increase in the liability relating to financial guarantees is recognised in profit and loss. Any liability remaining is
derecognised in profit and loss when the guarantee is discharged, cancelled or expires.
(iii) Impairment of assets
Financial assets, including finance lease receivables and loan receivables
A financial asset is assessed at each reporting date to determine whether there is any objective evidence that it is impaired. A
financial asset is considered to be impaired if objective evidence indicates that one or more events have had a negative effect
on the estimated future cash flows of that asset.
In assessing collective impairment, the Group uses modelling of historical trends of the probability of defaults, timing of
recoveries and the amount of loss incurred. Impairment losses on assets carried at amortised cost are measured as the
difference between the carrying amount of the financial assets and the present value of the estimated future cash flows
discounted at the assets original effective interest rate.
An impairment loss in respect of a financial asset measured at amortised cost is calculated as the difference between its
carrying amount, and the present value of the estimated future cash flows discounted at the original effective interest rate.
Individually significant financial assets are tested for impairment on an individual basis. The remaining financial assets are
assessed collectively in groups that share similar credit risk characteristics.
All impairment losses are recognised in profit and loss.
An impairment loss is reversed if the reversal can be related objectively to an event occurring after the impairment loss was
recognised. For financial assets measured at amortised cost, the reversal is recognised in profit and loss.
Non-financial assets
The carrying amounts of the Group’s non-financial assets, other than inventories and deferred tax assets, are reviewed at
each reporting date to determine whether there is any indication of impairment. If any such indication exists then the asset’s
recoverable amount is estimated. For goodwill and intangible assets that have indefinite lives or that are not yet available for
use, the recoverable amount is estimated at each reporting date.
The recoverable amount of an asset or cash-generating unit is the greater of its value in use and its fair value less costs to
sell. In assessing value in use, the estimated future cash flows are discounted to their present value using a pre-tax discount
rate that reflects current market assessments of the time value of money and the risks specific to the asset. For the purpose
of impairment testing, assets are grouped together into the smallest group of assets that generates cash inflows from
continuing use that are largely independent of the cash inflows of other assets or groups of assets (the “cash-generating
unit”). The goodwill acquired in a business combination, for the purpose of impairment testing, is allocated to cash-
generating units that are expected to benefit from the synergies of the combination.
An impairment loss is recognised if the carrying amount of an asset or its cash-generating unit exceeds its recoverable
amount. Impairment losses are recognised in profit or loss. Impairment losses recognised in respect of cash-generating units
are allocated first to reduce the carrying amount of the other assets in the unit (groups of units) on a pro rata basis.
An impairment loss in respect of goodwill is not reversed. In respect of other assets, impairment losses recognised in the
prior periods are assessed at each reporting date for any indications that the loss has decreased or no longer exists. An
For
per
sona
l use
onl
y

NOTES TO THE FINANCIAL STATEMENTS
52
impairment loss is reversed if there has been a change in the estimates used to determine the recoverable amount. An
impairment loss is reversed only to the extent that the asset’s carrying amount does not exceed the carrying amount that
would have been determined, net of depreciation or amortisation, if no impairment loss had been recognised.
(h) Intangible assets
Intellectual property
Intellectual property is recorded at the cost of acquisition over the fair value of the identifiable net assets acquired, and is
amortised on a straight line basis over 20 years.
Inertia Contracts
The Group recognises an intangible asset arising if it has an unconditional contractual right to receive income arising from
equipment and rights to the hiring agreement at the end of term. This inertia contract is measured at fair value at the
inception of the hiring agreement, and is based on discounted cash flows expected to be derived from the sale or hire of the
assets at the end of the term. Subsequent to initial recognition the intangible asset is measured at cost. Amortisation is
based on cost less estimated residual value.
At the end of the hiring term the intangible asset is derecognised and the Group recognises the equipment as inventory at the
corresponding value.
Contract Rights
The contractual rights obtained by the Group under financing agreements entered into with its funding partners and operating
agreements with its retail partners constitute intangible assets with finite useful lives. These contract rights are recognised
initially at cost and amortised over their expected useful lives. In relation to funder contact rights, the expected useful life
is the earlier of the initial contract term or expected period until facility limit is reached. At each reporting date a review for
indicators of impairment is conducted.
Software development
Software development relates to the development of the Group’s proprietary SmartCheck credit application processing
software system. Software development costs are capitalised only up to the point when the software has been tested and is
ready for use in the manner intended by management.
Software development expenditure is capitalised only if the development costs can be measured reliably, the product process
is technically and commercially feasible, future economic benefits are probable, and the Group intends to and has sufficient
resources to complete development and to use or sell the asset. The expenditure capitalised includes the cost of direct
labour and overhead costs that are directly attributable to preparing the asset for its intended use.
The intangible asset is amortised on a straight line basis over its estimated useful life, which is 4 years. Capitalised software
development expenditure is measured at cost less accumulated amortisation and accumulated impairment losses.
For
per
sona
l use
onl
y

NOTES TO THE FINANCIAL STATEMENTS
ANNUAL REPORT 2012 53
(i) Goodwill
Goodwill acquired in a business combination is initially measured at its cost, being the excess of the cost of the business
combination over the acquirer’s interest in the net fair value of the identifiable assets, liabilities and contingent liabilities
recognised. Goodwill is subsequently measured at its cost less any impairment losses.
For the purpose of impairment testing, goodwill is allocated to each of the Group’s cash generating units (CGUs) or groups of
CGUs, expected to benefit from the synergies of the business combination. CGUs (or groups of CGUs) to which goodwill has
been allocated are tested for impairment annually, or more frequently if events or changes in circumstances indicate that
goodwill might be impaired.
If the recoverable amount of the CGU (or group of CGUs) is less than the carrying amount of the CGU (or group of CGUs), the
impairment loss is allocated first to reduce the carrying amount of any goodwill allocated to the CGU (or group of CGUs) and
then to the other assets of the CGU (or group of CGUs) pro-rata on the basis of the carrying amount of each asset in the CGU
(or CGUs). The impairment loss recognised for goodwill is recognised immediately in the profit or loss and is not reversed in
the subsequent period.
On disposal of an operation within a CGU, the attributable goodwill is included in the determination of the profit or loss of
disposal on the operation.
(j) Employee benefits
A liability is recognised for benefits accruing to employees in respect of wages and salaries and annual leave when it is
probable that settlement will be required and they are capable of being measured reliably.
The group’s net obligation in respect of long service leave is the amount of future benefit that employees earned in return for
their service in the current and prior periods plus related on-costs; that benefit is discounted to determine its present value,
and the fair value of any related assets is deducted.
Liabilities recognised in respect of employee benefits, which are expected to be settled within 12 months, are measured at
their nominal values, using the remuneration rate expected to apply at the time of settlement.
Liabilities recognised in respect of employee benefits, which are not expected to be settled within 12 months, are measured
at their present value of the estimated future cash flows to be made by the group.
The Group pays defined contributions for post-employment benefit into a separate entity. Obligations for contributions to
defined contribution pension plans are recognised as an employee benefit expense in profit or loss in the period during which
services are rendered by employees.
Termination benefits are recognised as an expense when the Group is committed, it is probable that settlement will be
required, and they are capable of being reliably measured. If benefits are payable more than 12 months after the reporting
date, then they are discounted to their present value.
Share-based payments
The grant date fair value of share-based payment awards granted to employees is recognised as an employee expense,
with a corresponding increase in equity, over the period that the employees unconditionally become entitled to the awards.
The amount recognised as an expense is adjusted to reflect the number of awards for which the related service and non-
For
per
sona
l use
onl
y

NOTES TO THE FINANCIAL STATEMENTS
54
market vesting conditions are expected to be met, such that the amount ultimately recognised as an expense is based on
the number of awards that do not meet the related service and non-market performance conditions at the vesting date. For
share-based payment awards with non-vesting conditions, the grant date fair value of the share-based payment is measured
to reflect such conditions and there is no true-up for differences between expected and actual outcomes.
(k) Inventories
Inventories are valued at the lower of cost and net realisable value. Net realisable value represents the estimated selling price
less all estimated costs of completion and costs necessary to make use for sale.
(l) Revenue recognition
Revenue is measured at the fair value of the consideration received or receivable and is recognised to the extent that it is
probable that the economic benefits will flow to the entity and the revenue can be reliably measured. The following specific
recognition criteria must also be met before revenue is recognised:
Finance lease income
Finance lease income is recognised on those leases originated or acquired by the Group where the Group, rather than a third
party financier, is the lessor. Finance lease income is recognised on the effective interest rate method at the constant rate of
return which amortises over its economic life, the lease asset down to the estimate of any unguaranteed residual value that is
expected to be accrued to the Group at the end of the lease.
Commission income
Commission receivable from funders is recognised at the time finance approval is given to the customer, adjusted for an
allowance for loans not expected to proceed to a contract by the funder.
Residual interest in equipment (inertia income)
• Secondary rental income
Rental income from extended rental assets is recognised when receivable usually on a monthly basis. No ongoing
rental income is brought to account in respect of the unexpired rental contracts.
• Income earned from sale of equipment
Proceeds from the sale of rental assets are brought to account at the time of the sale to the extent not already
recognised through Finance lease income.
Insurance income
Insurance income includes commissions received on insurance policies issued by third party insurers to cover theft and
damage of rental equipment. In the UK, insurance income is recognised at fair value of the future payments receivable as
substantially all of the services to earn that revenue are completed upfront. The revenue recognition policy for the Australian
insurance income is consistent with the treatment of commission income from funders.
Interest income and expense
Interest income and expense for all interest bearing financial instruments is recognised in the profit and loss account using
the effective interest rates of the financial assets or liabilities to which they relate.
The effective interest rate is the rate that exactly discounts the estimated future cash payments or receipts through the
expected life of the financial asset or financial liability. When calculating the effective interest rate the Group includes all
amounts paid or received by the Group which are considered to be an integral part of the effective interest rate, including
merchant fees received and rebates paid.
For
per
sona
l use
onl
y

NOTES TO THE FINANCIAL STATEMENTS
ANNUAL REPORT 2012 55
Deferred service income
Income arising on recognition of any intangible inertia asset at the commencement of the lease is deferred and recognised
over the lease term on a straight line basis as the services are rendered.
(m) Derivative financial instruments, including hedge accounting
The Group holds derivative financial instruments to hedge its interest rate risk exposures, predominately in the ThinkSmart
Trust.
On initial designation of the derivative as the hedging instrument, the Group formally documents the relationship between the
hedging instrument and the hedged item, including the risk management objectives and strategy in undertaking the hedge
transaction and the hedged risk, together with the methods that will be used to assess the effectiveness of the hedging
relationship.
The Group makes an assessment, both at the inception of the hedge relationship as well as on an ongoing basis, whether
the hedging instruments are expected to be “highly effective” in offsetting the changes in cash flows of the respective hedged
items attributable to hedged risk, and whether the actual results of each hedge are within a range of 80 – 125 percent. For a
cash flow hedge of a forecast transaction, the transaction should be highly probable to occur and should present an exposure
to variations in cash flows that could ultimately affect reported profit or loss.
Derivatives are recognised initially at fair value; attributable transaction costs are recognised in profit or loss as incurred.
Subsequent to initial recognition, derivatives are measured at fair value and changes therein are accounted for as described
below. The fair values of derivates used for hedging purposes are disclosed in Note 28(b). Movements in the hedging reserve
in shareholder equity are shown in the Statement of Changes in Equity.
Cash flow hedges
When a derivative is designated as the hedging instrument in a hedge of the variability in cash flows attributable to a
particular risk associated with a recognised asset or liability or a highly probable forecast transaction that could affect profit
or loss, the effective portion of changes in the fair value of the derivative is recognised in other comprehensive income and
presented in the hedging reserve in equity. Any ineffective portion of changes in the fair value of the derivative is recognised
immediately in profit or loss.
When the hedged item is a non-financial asset, the amount recognised in equity is included in the carrying amount of the
asset when the asset is recognised. In other cases the amount accumulated in equity is reclassified to profit or loss in the
same period that the hedged item affects profit or loss. If the hedging instrument no longer meets the criteria for hedge
accounting, expires or is sold, terminated or exercised, or the designation is revoked, then hedge accounting is discontinued
prospectively. If the forecast transaction is no longer expected to occur, then the balance in equity is reclassified in profit or
loss.
Share capital
Ordinary shares are classified as equity. Incremental costs directly attributable to issue of ordinary shares and share options
are recognised as a deduction from equity, net of any tax effects.For
per
sona
l use
onl
y

NOTES TO THE FINANCIAL STATEMENTS
56
(n) Income tax
Current tax
Current tax is calculated by reference to the amount of income taxes payable or recoverable in respect of the taxable profit
or tax loss for the period. It is calculated using tax rates and tax laws that have been enacted or substantively enacted by
reporting date. Current tax payable for current and prior periods is recognised as a liability to the extent that it is unpaid.
Carried forward tax recoverable on tax losses is recognised as a deferred tax asset where it is probably that future taxable
profit will be available to offset in future periods.
Deferred tax
Deferred tax is accounted for using the comprehensive balance sheet liability method in respect of temporary differences
arising from differences between the carrying amount of assets and liabilities in the financial statements and the
corresponding tax base of those items.
In principle, deferred tax liabilities are recognised for all taxable temporary differences. Deferred tax assets are recognised to
the extent that it is probable that sufficient taxable amounts will be available against which deductible temporary differences
or unused tax losses and tax offsets can be utilised. However, deferred tax assets and liabilities are not recognised if the
temporary differences giving rise to them arise from the initial recognition of assets and liabilities (other than as a result of a
business combination) which affects neither taxable income nor accounting profit. Furthermore, a deferred tax liability is not
recognised in relation to taxable temporary differences arising from goodwill.
Deferred tax liabilities are recognised for taxable temporary differences arising on investments in subsidiaries and joint
ventures except where the Group is able to control the reversal of the temporary differences and it is probable that the
temporary differences will not reverse in the foreseeable future.
Deferred tax assets arising from deductible temporary differences associated with these investments and interests are only
recognised to the extent that it is probable that there will be sufficient taxable profits against which to utilise the benefits of
the temporary differences and they are expected to reverse in the foreseeable future.
Deferred tax assets and liabilities are measured at the tax rates that are expected to apply to the period(s) when the
asset and liability giving rise to them are realised or settled, based on tax rates (and tax laws) that have been enacted or
substantively enacted by reporting date. The measurement of deferred tax liabilities and assets reflects the tax consequences
that would follow from the manner in which the Consolidated Entity expects, at the reporting date, to recover or settle the
carrying amount of its assets and liabilities.
Deferred tax assets and liabilities are offset when they relate to income taxes levied by the same taxation authority and the
Company/Group intends to settle its current tax assets and liabilities on a net basis.
Current and deferred tax for the period
Current and deferred tax is recognised as an expense or income in the income statement, except when it relates to items
credited or debited directly to equity, in which case the deferred tax is also recognised directly in equity, or where it arises
from the initial accounting for a business combination, in which case it is taken into account in the determination of goodwill
or excess purchase consideration.
For
per
sona
l use
onl
y

NOTES TO THE FINANCIAL STATEMENTS
ANNUAL REPORT 2012 57
Tax consolidation
The Company and its wholly owned Australian resident entities formed a tax-consolidated group during 2009. As a
consequence, all members of the tax-consolidated group are taxed as a single entity from 1 January 2009. The head entity
within the tax-consolidated group is ThinkSmart Ltd.
(o) Goods and services tax
Revenues, expenses and assets are recognised net of the amount of goods and services tax (GST) except:
(i) where the amount of GST incurred is not recoverable from the taxation authority, it is recognised as part of the cost
of acquisition of an asset or as part of an item of expense; and
(ii) receivables and payables which are recognised inclusive of GST.
The net amount of GST recoverable from, or payable to, the taxation authority is included as part of receivables or payables.
Cash flows are included in the statement of cash flows on a gross basis. The GST component of cash flows arising from
investing and financing activities which is recoverable from, or payable to, the taxation authority is classified as operating cash
flows.
(p) Foreign currency transactions
Functional and presentation currency
Foreign currency gains and losses are reported on a net basis.
Foreign currency transactions
Transactions in foreign currencies are translated to the respective functional currencies of Group entities at exchange rates
prevailing at the dates of the transactions. Monetary assets and liabilities denominated in foreign currencies at the reporting
date are retranslated to the functional currency at the exchange rate at that date. The foreign currency gain or loss on
monetary items is the difference between amortised cost in the functional currency at the beginning of the period, adjusted
for effective interest and payments during the period, and the amortised cost in foreign currency translated at the exchange
rate at the end of the year.
Non-monetary assets and liabilities denominated in foreign currencies that are measured at fair value are retranslated to the
functional currency at the exchange rate at the date that the fair value was determined. Non-monetary items in a foreign
currency that are measured in terms of historical cost are translated using the exchange rate at the date of the transaction.
Foreign currency differences arising on retranslation are presented in profit or loss on a net basis, except for differences
arising on the retranslation of a financial liability designated as a hedge of the net investment in a foreign operation that is
effective, which are recognised in other comprehensive income.
Foreign operations
The assets and liabilities of foreign operations, including goodwill and fair value adjustments arising on acquisition, are
translated to the functional currency at exchange rates at the reporting date. The income and expenses of foreign operations,
excluding foreign operations in hyperinflationary economies, are translated to Australian dollars at exchange rates at the dates
of the transactions.
The income and expenses of foreign operations in hyperinflationary economies are translated to the functional currency at the
reporting date. Prior to translating the financial statements of foreign operations in hyperinflationary economies, their financial
For
per
sona
l use
onl
y

NOTES TO THE FINANCIAL STATEMENTS
58
statements for the current period are restated to account for changes in the general purchasing power of the local currency.
The restatement is based on relevant price indices at the reporting date.
Foreign currency differences are recognised in other comprehensive income, and presented in the foreign currency translation
reserve in equity. However, if the operation is not a wholly-owned subsidiary, then the relevant proportionate share of the
translation difference is allocated to the non-controlling interests. When a foreign operation is disposed of such that control,
significant influence or joint control is lost, the cumulative amount in the translation reserve related to that foreign operation
is reclassified to the profit or loss as part of the gain or loss on disposal. When the Group disposes of only part of its interest
in a subsidiary that includes a foreign operation while retaining control, the relevant proportion of the cumulative amount
is reattributed to non-controlling interests. When the Group disposes of only part of its investment in an associate or joint
venture that includes a foreign operation while retaining significant influence or joint control, the relevant proportion of the
cumulative amount is classified to profit or loss.
(q) Earnings per share
Basic earnings per share
Basic earnings per share is calculated by dividing the profit attributable to equity holders of the Company, excluding any costs
of servicing equity other than ordinary shares, by the weighted average number of ordinary shares outstanding during the year,
adjusted for bonus elements in ordinary shares issued during the year.
Diluted earnings per share
Diluted earnings per share adjusts the figures used in the determination of basic earnings per share to take into account
the after income tax effect of interest and other financing costs associated with dilutive potential ordinary shares and the
weighted average number of shares assumed to have been issued for no consideration in relation to dilutive potential ordinary
shares.
(r) Provisions
A provision is recognised if, as a result of a past event, the Group has a present legal or constructive obligation that can be
estimated reliably, and it is probable that an outflow of economic benefits will be required to settle the obligations. Provisions
are determined by discounting the expected future cash flows at a pre-tax rate that reflects current market assessments of
the time value of money and the risks specific to the liability.
(s) Lease payments
Payments made under operating leases are recognised in profit or loss on a straight line basis over the term of the lease.
Lease incentives received are recognised as an integral part of the total lease expense, over the term of the lease.
Minimum lease payments made under finance leases are apportioned between the finance expense and the reduction of the
outstanding liability. The finance expense is allocated to each period during the lease term so as to produce a constant period
rate of interest on the remaining balance of the liability.
Contingent lease payments are accounted for by revising the minimum lease payments over the remaining term of the lease
when the contingency no longer exists and the lease adjustments are known.
(t) Segment reporting
An operating segment is a component of the Group that engages in business activities from which it may earn revenues
and incur expenses, including revenues and expenses that relate to transactions with any of the Group’s other components.
For
per
sona
l use
onl
y

NOTES TO THE FINANCIAL STATEMENTS
ANNUAL REPORT 2012 59
All operating segments’ operating results are regularly reviewed by the Group’s Chief Executive Officer to make decisions
about resources to be allocated to the segment and assess its performance, and for which discrete financial information is
available.
Segment results, assets and liabilities include items attributable to a segment as well as those that can be allocated on
a reasonable basis. Unallocated items compromise mainly loans and borrowings and related expenses, and head office
expenses, and income tax assets and liabilities.
Segment capital expenditure is the total cost incurred during the period to acquire property, plant and equipment, and
intangible assets other than goodwill.
(u) Determination of fair value
A number of the Group’s accounting policies and disclosures require the determination of fair value, for both financial and
non-financial assets and liabilities. Fair values have been determined for measurement and/or disclosure purposes based
on the following methods. When applicable, further information about the assumptions made in determining fair values is
disclosed in the notes specific to that asset and liability.
Intangible assets
The fair value of intangible assets is based on the discounted cash flows expected to be derived from the use and eventual
sale of the assets (refer to Note 3(h)).
Intangible inertia asset
The fair value of inertia asset is measured at inception of the hiring agreement and is based on discounted cash flows
expected to be derived from the sale or hire of the assets at the end of the hire term.
Trade and other and loan receivables
The fair value of trade and other and loan receivables is estimated as the present value of future cash flows, discounted at
the market rate of interest at the reporting date.
Non-derivative financial liabilities
Fair value, which is determined for disclosure purposes, is calculated based on the present value of future principal and
interest cash flows, discounted at the market rate of interest at the reporting date. For finance leases, the market rate of
interest is determined by reference to similar lease agreements.
Share-based payment transactions
The fair value of employee share options is measured using a binomial model and loan-funded shares are measured using
a monte-carlo simulation model. Measurement inputs include share price on measurement date, exercise price of the
instrument, expected volatility (based on weighted average historic volatility adjusted for changes expected due to publicly
available information), weighted average expected life of the instruments (based on historical experience and general option
holder behaviour), expected dividends, and the risk-free interest rate (based on government bonds). Service and non-market
performance conditions attached to the transactions are not taken into account in determining fair value.
The fair value of employee shares provided as remuneration is measured using the closing share price on the date the shares
are granted.
For
per
sona
l use
onl
y

NOTES TO THE FINANCIAL STATEMENTS
60
Cash flow hedges
The fair value of the interest rate swap is based on broker quotes. Those quotes are tested for reasonableness by discounting
estimated future cash flows based on the terms and maturity of the contract and using market interest rates for a similar
instrument at the measurement date. Fair values reflect the credit risk of the instrument and included adjustments to take
account of the credit risk of the Group entity and counterparty when appropriate.
4. CRITICAL ACCOUNTING ESTIMATES
Estimates and judgements are continually evaluated and are based on historical experience and other factors, including
expectations of future events that may have a financial impact on the entity and that are believed to be reasonable under the
circumstances.
Critical accounting estimates and assumptions
The Group makes estimates and assumptions concerning the future. The resulting accounting estimates will, by definition,
seldom equal the related actual results. The estimates and assumptions that have a significant risk of causing a material
adjustment to the carrying amount of assets and liabilities within the next financial year are discussed below.
• Note 7 - measurement and recognition of tax losses
• Note 9 - loans and lease receivables, including estimation of unguaranteed residual value and
credit losses
• Note 12 - fair value at inception of inertia intangible assets and recoverable amount
• Note 14 - measurement of the recoverable amount of cash generating units containing goodwill
• Note 17 - measurement of deferred services income
• Note 20 - measurement of share-based payments
5. FINANCIAL RISK MANAGEMENT
Overview
The Group has exposure to the following risks from the use of financial instruments:
• Credit risk
• Liquidity risk
• Market risk
• Operational risk
This note presents information about the Group’s exposure to each of the above risks, the objectives, policies and processes
for measuring and managing risks, and the management of capital. Further quantitative disclosures are included throughout
this financial report.
The Board of Directors has overall responsibility for the establishment and oversight of the risk management framework. The
Board has established the Audit and Risk Management Committee, which is responsible for developing and monitoring risk
management policies. The Committee reports to the Board of Directors on its activities.
For
per
sona
l use
onl
y

NOTES TO THE FINANCIAL STATEMENTS
ANNUAL REPORT 2012 61
Risk management policies are established to identify and analyse the risks faced by the Group, to set appropriate limits
and controls, and to monitor risks and adherence to limits. Risk management policies and systems are reviewed regularly
to reflect the changes in market conditions and the Group’s activities. The Audit and Risk Committee oversees how
management monitors compliance with the Group’s risk management policies and procedures and reviews the adequacy of
the risk management framework in relation to the risks faced by the Group.
Credit Risk
Credit risk refers to the risk that a counterparty or customer will default on its contractual obligations resulting in financial loss
to the Group. The Group has adopted a policy of only dealing with credit worthy counterparties as a means of mitigating the
risk of financial loss from defaults. The Head of Treasury and Risk has day to day responsibility for managing credit risk within
the risk appetite of the Board. Appropriate oversight occurs via monthly credit performance reporting to management and the
Board.
The Group has minimal concentrations of credit risk in relation to debtors and lease receivables with the portfolio comprising
a large number of relatively low value receivables. In the case of the special purpose entity funded operations, ThinkSmart’s
exposure to credit risk is limited to the value of its notes in the relevant series of the special purpose entity plus $3.5m.
Losses in excess of that are borne by the senior financier’s notes. The notes in the various series of the special purpose entity
are structured such that on a probability weighted outcomes basis, ThinkSmart bears the credit risk (refer to Note 28(c) for
further information).
To manage credit risk in relation to its customers, the Group employs a sophisticated credit assessment and fraud
minimisation process delivered through its patented QuickSmart system. The credit underwriting system uses a combination
of credit scoring and credit bureau reports as well as electronic identity verification and a review of an applicant’s details
against a fraud database. The credit policy is developed and applied by the group’s Head of Treasury and Risk who monitors
ongoing credit performance on different cohorts of customer contracts. The Group has a specialist collections function which
manages all delinquent accounts.
The Group’s credit risk exposure to funder deposits are more concentrated, however the counterparties are regulated banking
institutions and the credit risk exposure is assessed as low. The Group closely monitors the credit risk associated with each
funder deposit counterparty.
Liquidity risk
Liquidity risk is the risk that the Group will not be able to meet its financial obligations as they fall due. The Group’s approach
to managing liquidity is to ensure, as far as possible, that it will always have sufficient liquidity to meet its liabilities when
due, under both normal and stressed conditions, without incurring unacceptable losses or risking damage to the Group’s
reputation.
The consolidated entity manages liquidity risk by maintaining adequate reserve facilities by continuously reviewing its facilities
and cash flows.
The Group ensures that it has sufficient cash on demand to meet expected operational expenses and financing subordination
requirements. In addition, the Group maintains the operational facilities which are shown in Notes 18 and 19.
For
per
sona
l use
onl
y

NOTES TO THE FINANCIAL STATEMENTS
62
Market risk
Market risk is the risk that changes in market prices, such as foreign exchange rates, interest rates and equity prices will
affect the Group’s income or the value of its holdings of financial instruments. The objective of market risk management is to
manage and control market risk exposures within acceptable parameters, while optimising return.
Currency risk
The Group is exposed to currency risk on sales, purchases and borrowings that are denominated in a currency other than the
respective functional currencies of the Group entities, primarily the Australian dollar, Sterling and Euro.
Interest on borrowings is denominated in currencies that match the cash flows generated by the underlying operations of the
Group. This provides an economic hedge and no derivatives are entered into.
Liabilities incurred in each respective geographical territory are paid for by the cash flows of the functional currency of that
territory. Exposures for singular transactions greater than $50,000 are considered for hedging by management, with forward
exchange contracts to mitigate exchange rate risk and are considered separately as they arise. The consolidated entity has no
forward exchange contracts as at reporting date (2011: nil).
In respect of other monetary assets and liabilities denominated in foreign currencies, the management ensures that the
Group’s net exposure is kept to an acceptable level by buying or selling foreign currencies at spot rates when necessary to
address the short term imbalances (refer to Note 28 for further information).
Interest rate risk
The Group has no current or non-current corporate borrowings as at 31 December 2012. Exposure to interest rate risk on any
future corporate borrowings will be assessed by the Board and where appropriate, the exposure to movement in interest rates
may be hedged by entering into interest rate swaps, when considered appropriate by the management and the Board.
The Group has interest rate risk exposure to the notes in the SPE that it has issued to the financiers of its lease receivables.
These notes are floating rate notes with the rate based on a fixed margin above a benchmark interest rate. Interest rate
risk results principally from changes in the benchmark interest rate and accordingly the Group mitigates some of this risk by
entering into an interest rate swap to hedge against the variability in the cash flows due to changes in the interest rate (refer
to Note 28(a) for further information).
Operational risk
Operational risk is the risk of direct or indirect loss arising from a wide variety of causes associated with the Group’s
processes, personnel, technology and infrastructure, and from external factors other than credit, market and liquidity risks
such as those arising from legal and regulatory requirements and generally accepted standards of corporate behaviour.
Operational risks arise from all of the Group’s operations.
The primary responsibility for the development and implementation of controls to address operational risk is assigned to
senior management within each business unit. This responsibility is supported by the development of overall group standards
for the management of operational risk in the following areas:
• Requirements for appropriate segregation of duties, including the independent authorisation of transactions
• Requirements for the reconciliation and monitoring of transactions
• Compliance with regulatory and other legal requirements
For
per
sona
l use
onl
y

NOTES TO THE FINANCIAL STATEMENTS
ANNUAL REPORT 2012 63
• Documentation of controls and procedures
• Requirements for the periodic assessment of operational risks faced, and the adequacy of controls and procedures
to address the risks identified
• Ethical and business standards
• Risk mitigation, including insurance where this is effective
Capital management
The Board’s policy is to maintain a strong capital base so as to maintain investor, creditor and market confidence and to
sustain future development of the business. Management aims to maintain a capital structure that ensures the lowest cost
of capital available to the Group. Management constantly reviews the capital structure to ensure an increasing return
on assets.
Under the terms of its financing arrangements in the SPE, the Group is required to subscribe to and hold a minimum value
of notes based on the value of receivables outstanding to ensure ongoing financing. The SPE is bankruptcy remote in that
ThinkSmart’s risk exposure is limited to the amount of capital that it holds within the relevant series of the SPE plus $3.5m.
ThinkSmart Finance Limited holds an Australian Financial Services Licence (AFSL) in relation to its role as Trust Manager
of the SPE. Under the terms of its AFSL it must have assets that exceed its liabilities and there are also liquidity conditions
(measured on a Group basis).
The Group’s debt-to-adjusted capital ratio at the end of the reporting period was as follows:
2012
$000
2011
$000
Total liabilities 66,924 67,915
Less cash and cash equivalents (18,568) (4,610)
Net debt 48,356 63,305
Total equity 48,021 40,266
Debt-to-adjusted capital ratio at 31 December 1.0 1.6
Other than as described above in relation to the SPE, the Group is not subject to externally imposed capital requirements. For
the purposes of capital management, capital consists of share capital, reserves and retained earnings.
For
per
sona
l use
onl
y

NOTES TO THE FINANCIAL STATEMENTS
64
6. CONSOLIDATED INCOME STATEMENT
Notes
2012
$000
2011
$000
Profit/(loss) is arrived at after crediting/(charging) the following items:
a) Portfolio income
Finance lease income
Interest revenue – customers
Interest revenue – other entities
Surplus unguaranteed residual income
Extended rental income
Other inertia income
Fee revenue – customers
11,391 6,307
488 -
854 880
2,222 4,408
5,780 6,205
17 2,438 1,037
925 672
24,098 19,509
b) Other revenue
Services revenue – insurance
Services revenue – Dick Smith Warranty contract
Other revenue
2,043 2,618
650 2,280
895 87
3,588 4,985
c) Interest expense
Interest expense – corporate banking facilities
Interest expense – other interest bearing liabilities
242 177
3,998 1,115
4,240 1,292
d) Other operating expenses
Employees benefits expense:
- Payments to employees
- Employee superannuation costs
- Share-based payment expense
- Provision for employee entitlements
12,812 11,896
842 787
326 604
605 509
14,585 13,796
Occupancy costs
Professional services
Finance charges
Other costs
1,214 1,180
2,365 1,504
953 1,756
2,617 2,808
21,734 21,044
e) Depreciation and amortisation
Depreciation
Amortisation
11 428 541
12 2,808 1,720
3,236 2,261
f) Impairment losses
Impairment losses on finance leases and receivables
Impairment losses on intangible assets (net)
28(c) 4,098 1,522
182 69
4,280 1,591
For
per
sona
l use
onl
y
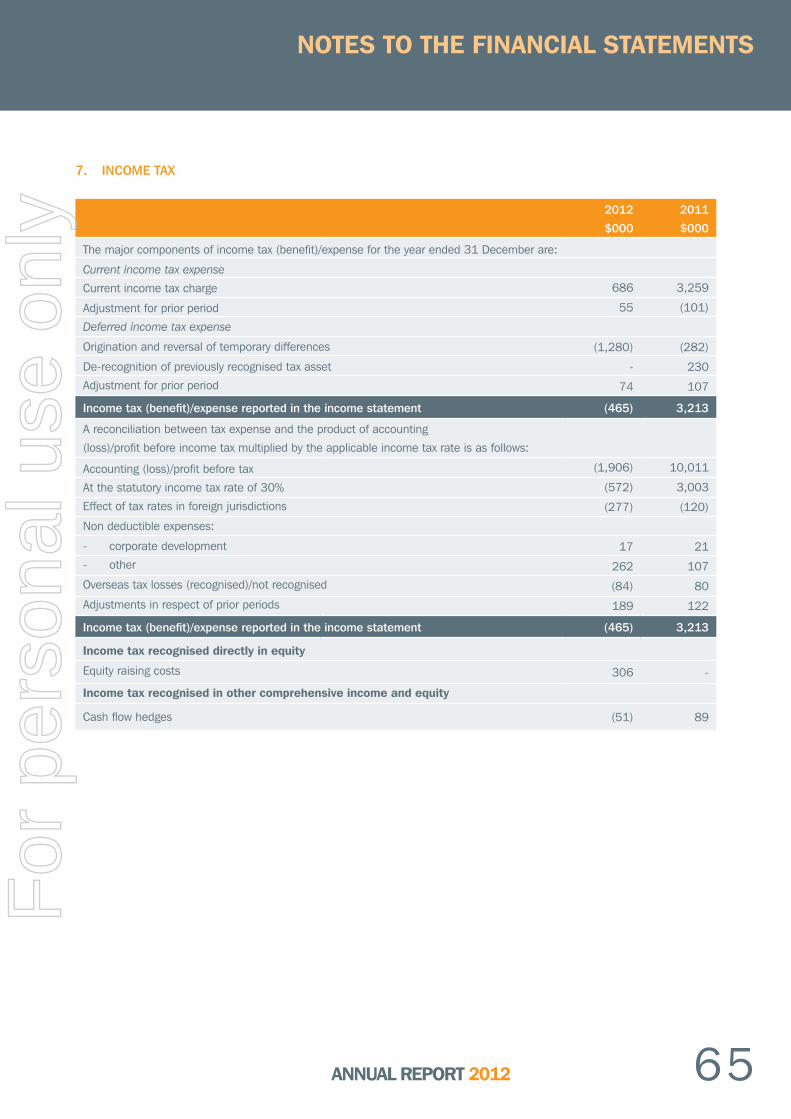
NOTES TO THE FINANCIAL STATEMENTS
ANNUAL REPORT 2012 65
7. INCOME TAX
2012
$000
2011
$000
The major components of income tax (benefit)/expense for the year ended 31 December are:
Current income tax expense
Current income tax charge
Adjustment for prior period
Deferred income tax expense
Origination and reversal of temporary differences
De-recognition of previously recognised tax asset
Adjustment for prior period
686 3,259
55 (101)
(1,280) (282)
- 230
74 107
Income tax (benefit)/expense reported in the income statement (465) 3,213
A reconciliation between tax expense and the product of accounting
(loss)/profit before income tax multiplied by the applicable income tax rate is as follows:
Accounting (loss)/profit before tax
At the statutory income tax rate of 30%
Effect of tax rates in foreign jurisdictions
Non deductible expenses:
- corporate development
- other
Overseas tax losses (recognised)/not recognised
Adjustments in respect of prior periods
(1,906) 10,011
(572) 3,003
(277) (120)
17 21
262 107
(84) 80
189 122
Income tax (benefit)/expense reported in the income statement (465) 3,213
Income tax recognised directly in equity
Equity raising costs 306 -
Income tax recognised in other comprehensive income and equity
Cash flow hedges (51) 89
For
per
sona
l use
onl
y

NOTES TO THE FINANCIAL STATEMENTS
66
7. INCOME TAX (CONTINUED)
2012
$000
2011
$000
Deferred tax asset
Loan and lease receivables 1,192 502
Accrued expenses 67 134
Employee entitlements 181 178
Equity raising costs 433 191
Borrowing costs 18 11
Plant & equipment 330 524
Tax losses 723 160
Derivatives - 89
Other 82 91
Total 3,026 1,880
Deferred tax liability
Derivatives 51 -
Prepayments - 2
Deals awaiting settlement - 386
Intangible assets 380 143
Plant and equipment 241 1,186
Other 2 336
Total 674 2,053
Net deferred tax asset (i) 2,352 -
Net deferred tax liability (i) - 173
(i) Deferred tax assets and deferred tax liabilities that relate to the same taxable entity have been netted off.
Unrecognised deferred tax assets
Deferred tax assets have not been recognised in respect of the following items:
Tax losses 905 957
905 957
The deductible temporary differences and tax losses do not expire under current tax legislation.
Deferred tax assets that relate to tax losses in Italy and USA have not been recognised in respect of these items because
it is not probable that future taxable profit will be available against which the group can utilise the benefits there from.
Deferred tax assets relating to temporary differences and tax losses in Australia of $3.517m have been recognised based
on management’s forecasts which provides convincing other evidence that it is probable that future taxable profits would be
available against which they can be utilised.
Management forecasts of future taxable profits incorporate estimates of future trading of the Australian operations, including
that the Australian business has now transitioned to lease accounting.
For
per
sona
l use
onl
y

NOTES TO THE FINANCIAL STATEMENTS
ANNUAL REPORT 2012 67
8. OTHER CURRENT ASSETS
2012
$000
2011
$000
Prepayments 2,427 3,336
Inventories 185 58
Other assets - 771
Sundry debtors 959 1,172
3,571 5,337
9. LOAN AND LEASE RECEIVABLES
2012
$000
2011
$000
Current
Rental receivables (net of GST) 23,142 17,268
Unguaranteed residuals 4,925 2,816
Unearned finance income (5,561) (2,385)
Net lease receivables 22,506 17,699
Other lease receivable 18,452 21,584
Loan receivables 2,020 -
Allowance for losses (3,814) (864)
39,164 38,419
Non-current
Rental receivables (net of GST) 15,166 8,870
Unguaranteed residuals 1,248 1,463
Unearned finance income (5,961) (1,239)
Net lease receivables 10,453 9,094
Other lease receivable 12,178 19,637
Loan receivables 619 -
Allowance for losses - (725)
23,250 28,006
Loan and lease receivables due within 12 months 39,164 38,419
Loan and lease receivables due in greater than 12 months and less than 5 years 23,250 28,006
62,414 66,425
For
per
sona
l use
onl
y

NOTES TO THE FINANCIAL STATEMENTS
68
9. LOAN AND LEASE RECEIVABLES (CONTINUED)
The net carrying value of lease receivables includes the earned portion of any unguaranteed residual value expected to
accrue to the Group at the end of the lease, which by its nature introduces estimation uncertainty into the amortised cost
calculation. The Group continually assesses current unguaranteed residual value proceeds and includes these as the Group’s
best estimate of future unguaranteed residual value.
The calculation of the allowance for losses contains a number of elements of judgement. The Group makes judgements
as to how the current level of arrears of a loan or lease receivable relate to its probability of future default. The Group also
makes judgements as to the recoverable amount in circumstances of default. These estimates are based on historical loss
experience and objective experience of historical recoveries for assets with similar characteristics. The methodology and
assumptions used for estimating losses are reviewed regularly to reduce the difference between loss estimates and actual
loss experience. Further information about the allowance for losses is set out in Note 28(c).
During the second half of 2011, the Group progressed the acquisition of lease receivables originated under an existing
brokerage arrangement with Bendigo and Adelaide Bank (“BEN”). The acquisition was subject to APRA approval. On 22
December 2011, agreement was reached with BEN resulting in the rights to the lease receivables held by BEN being
assigned to the Group effective 1 October 2011. This was accounted for as a “pass through” arrangement under AASB
139 Financial Instruments: Recognition and Measurement whereby the risks and rewards of the underlying finance lease
receivables were transferred to the Group. Subsequent to 31 December 2011, the APRA approval being sought was not
granted. On 28 June 2012, the Group renegotiated the funding agreement maintaining the rights to the lease receivables
which were the subject of the 22 December 2011 agreement, and also acquired the rights to lease receivables originated
between 1 October 2011 and 28 March 2012. This acquisition is also recognised as a “pass through” arrangement. The
liabilities relating to the acquired rights to lease receivables are set out in Note 19.
On 14 June 2011 the Group acquired a portfolio of finance lease receivables from BEN. These receivables were previously
originated by the Group on behalf of BEN. The receivables were acquired by ThinkSmart Trust at a fair value of $36 million at
the date of acquisition. The receivables were acquired into series 2 of ThinkSmart Trust with funding provided by the issue of
$26 million of a series notes in series 2 of ThinkSmart Trust to Westpac with the balance provided by internally funded notes
in the same series of ThinkSmart Trust issued to ThinkSmart. Further details of the notes are disclosed in Note 19.
Further information about the Group’s exposure to credit risk and interest rate risk in relation to the loan and lease
receivables are set out in Note 28.
For
per
sona
l use
onl
y

NOTES TO THE FINANCIAL STATEMENTS
ANNUAL REPORT 2012 69
10. OTHER NON-CURRENT ASSETS
2012
$000
2011
$000
Insurance prepayments 1,564 1,602
Deposits held by funders (i) 5,080 5,175
6,644 6,777
(i) Deposits held by funders for the servicing and management of their portfolios in the event of default. The deposits
earn interest at market rates of return for similar instruments.
11. PLANT AND EQUIPMENT
Plant & Equipment
$000
Lease equipment &
software
$000
Total
$000
Gross Carrying Amount
Cost or deemed cost
Balance at 1 January 2011 1,663 929 2,592
Net foreign currency translation differences (2) - (2)
Additions 238 97 335
Disposals (1) - (1)
Transfers - (44) (44)
Balance at 31 December 2011 1,898 982 2,880
Net foreign currency translation differences 74 - 74
Additions 199 239 438
Disposals (2) - (2)
Balance at 31 December 2012 2,169 1,221 3,390
Accumulated Depreciation
Balance at 1 January 2011 (1,063) (409) (1,472)
Effect of movement in exchange rate 10 - 10
Disposals - - -
Depreciation expense (397) (144) (541)
Impairment loss (3) - (3)
Balance at 31 December 2011 (1,453) (553) (2,006)
Effect of movement in exchange rate (70) - (70)
Disposals - - -
Depreciation expense (326) (102) (428)
Balance at 31 December 2012 (1,849) (655) (2,504)
Net Book Value
At 31 December 2011 445 429 874
At 31 December 2012 320 566 886
For
per
sona
l use
onl
y

NOTES TO THE FINANCIAL STATEMENTS
70
12. INTANGIBLE ASSETS
Contract
rights
$000
Software
$000
Distribution
network
$000
Intellectual
Property
$000
Inertia
Contracts
$000
Total
$000
Gross carrying amount
At cost
Balance at 1 January 2011 2,644 4,167 411 642 2,911 10,775
Additions 2,891 1,574 - - 3,609 8,074
Disposals - - - - (2,910) (2,910)
Effect of movement in exchange rate (6) - - - (2) (8)
Transfers 2 43 - - - 45
Balance at 31 December 2011 5,531 5,784 411 642 3,608 15,976
Additions 1,000 894 - - 4,800 6,694
Disposals/transfer to inventory - (17) - - (225) (242)
Effect of movement in exchange rate (10) - 10 - 90 90
Transfers (7) 7 - - - -
Balance at 31 December 2012 6,514 6,668 421 642 8,273 22,518
Accumulated amortisation and
impairment
Balance at 1 January 2011 (1,192) (1,613) (373) (337) (2,911) (6,426)
Amortisation expense (1,010) (640) (38) (32) - (1,720)
Disposals - - - - 2,908 2,908
Effect of movement in exchange rate 13 - 1 - 2 16
Impairment loss (65) - - - - (65)
Balance at 31 December 2011 (2,254) (2,253) (410) (369) (1) (5,287)
Amortisation expense (1,489) (1,287) - (32) - (2,808)
Disposals - - - - - -
Effect of movement in exchange rate 14 - (10) - (6) (2)
Impairment loss (i) - - - - (341) (341)
Balance at 31 December 2012 (3,729) (3,540) (420) (401) (348) (8,438)
Net book value
At 31 December 2011 3,277 3,531 1 273 3,607 10,689
At 31 December 2012 2,785 3,128 1 241 7,925 14,080
(i) Impairment loss relates to the write off where the related contract has early terminated principally due to
contract default.
Inertia contract assets acquired are measured at fair value based on the discounted cash flows expected to be derived from
the sale or hire of the assets at the end of the term. This measurement inherently introduces estimation uncertainty. The
Group continually assesses current inertia proceeds and includes these in the estimation of inertia assets acquired.
For
per
sona
l use
onl
y

NOTES TO THE FINANCIAL STATEMENTS
ANNUAL REPORT 2012 71
13. INTEREST IN SUBSIDIARIES
% of Equity
2012 2011
Interest in Subsidiaries Country of Incorporation
RentSmart Limited UK 100 100
RentSmart Pty Ltd Australia 100 100
RentSmart (NZ) Pty Ltd New Zealand 100 100
RentSmart Servicing Pty Ltd Australia 100 100
RentSmart Unit Trust Australia 100 100
SmartCheck Finance Spain SL Spain 100 100
SmartCheck Ltd UK 100 100
SmartCheck Pty Ltd Australia 100 100
SmartPlan Spain SL Spain 100 100
ThinkSmart Employee Share Trust Australia 100 -
ThinkSmart Europe Ltd UK 100 100
ThinkSmart Finance Ltd Australia 100 100
ThinkSmart Financial Services Ltd UK 100 100
ThinkSmart Inc USA 100 100
ThinkSmart Insurance Administration Ltd UK 100 100
ThinkSmart Italy Srl Italy 100 100
ThinkSmart LTI Pty Limited Australia 100 -
ThinkSmart Trust Australia 100 100
For
per
sona
l use
onl
y

NOTES TO THE FINANCIAL STATEMENTS
72
14. GOODWILL
2012
$000
2011
$000
Balance at beginning of financial year 3,539 3,541
Effect of movement in exchange rate 88 (2)
Balance at end of financial year 3,627 3,539
Impairment testing for cash-generating units containing goodwill
For the purpose of impairment testing, goodwill is allocated to the UK segment as disclosed in Note 24, which represents the
lowest level within the Group at which goodwill is monitored for internal management purposes. The goodwill arose on the
acquisition of RentSmart Limited.
The recoverable amount of the UK cash-generating unit was based on its value in use using business plan assumptions and
a discount rate approximating the weighted average cost of capital of the group (circa 14% pre tax) and hence includes
inherent estimation uncertainty. The recoverable amount of the unit was determined to be significantly higher than the
carrying amount, therefore no impairment of goodwill is required, and no further sensitivity analysis is considered necessary.
Value in use is determined by discounting the future cash flows generated from the continuing use of the unit and was based
on the following key assumptions:
• Cash flows were projected based on the forecast operating results for 2013 to 2016 and 10% growth to 2017,
2.0% year-on-year growth, and estimated terminal growth at 2.0%.
• A post tax discount rate of 8.7% (11.6% pre tax) was applied in determining the recoverable amount of the unit.
The discount rate was based on the estimated weighted average cost of capital (WACC) for the Group’s
UK operation.
15. ASSETS PLEDGED AS SECURITY
ThinkSmart Limited and ThinkSmart Finance Limited have pledged all their present and future assets to Westpac as security
for $3.5m of the ‘Other Interest Bearing Liabilities’ Westpac has provided, as disclosed in Notes 18 and 19. ThinkSmart
Europe Limited has provided an equitable mortgage over the shares it holds in the main UK operating entity, RentSmart
Limited.
For
per
sona
l use
onl
y

NOTES TO THE FINANCIAL STATEMENTS
ANNUAL REPORT 2012 73
16. TRADE AND OTHER PAYABLES, AND PROVISIONS
2012
$000
2011
$000
Trade and other payables 3,476 3,219
Hedging derivative 128 297
Product plan 20 251
GST Payable 1,010 1,665
Other accrued expenses 2,007 1,471
6,641 6,903
Provisions
Annual leave 386 310
Long service leave (i) 219 200
Other 1 1
606 511
(i) The pro rata entitlement of long service leave is provided for after 7 years of service.
The Group’s exposure to currency and liquidity risk related to trade and other payables is disclosed in Note 28.
17. DEFERRED SERVICE INCOME
Notes
2012
$000
2011
$000
Balance at 1 January 2012 2,572 -
Effect of movement in exchange rate 22 -
Intangible inertia assets acquired 12 4,800 3,609
Reversal due to intangible asset impairment (158) -
Recognised in Consolidated Income Statement 6(a) (2,438) (1,037)
4,798 2,572
Deferred service income to be recognised within 12 months 2,977 1,380
Deferred service income to be recognised in greater than 12 months 1,821 1,192
4,798 2,572
For
per
sona
l use
onl
y

NOTES TO THE FINANCIAL STATEMENTS
74
18. CURRENT BORROWINGS
2012
$000
2011
$000
Term loans
Borrowing costs
- 2,500
- (73)
- 2,427
Corporate financing facilities
Secured bank overdraft facility reviewed annually and payable at call:
- amount used
- amount unused
- -
778 -
778 -
Committed cash advance facility/Secured bill acceptance facility:
- amount used
- amount unused
- 2,500
5,000 2,500
5,000 5,000
Standby letter of credit facility:
- amount used
- amount unused
- 3,035
- -
- 3,035
Other finance facilities (business credit card, payroll facility, term loan, multi-option facility):
- amount used
- amount unused
14 -
25 129
39 129
Total corporate financing facility 5,817 8,164
The total corporate facilities of $5.817m (2011: $8.164m) identified above are reviewed annually and secured over the
assets of the Group. The next annual review is scheduled to be completed by 30 June 2013. Further information about the
Group’s exposure to interest rate, foreign currency and liquidity risk is provided in Note 28.
At this time, Directors consider it probable that the facilities will continue to be available to the Group.
For
per
sona
l use
onl
y

NOTES TO THE FINANCIAL STATEMENTS
ANNUAL REPORT 2012 75
19. OTHER INTEREST BEARING LIABILITIES
2012
$000
2011
$000
Current
Loan advances – secured (i)
Financial liability – secured (ii)
18,830 14,930
15,470 21,801
34,300 36,731
Non-current
Loan advances – secured (i)
Financial liability – secured (ii)
8,373 2,300
11,690 14,691
20,063 16,991
Customer financing facilities
Secured financing facilities
- amount used – lease financing arrangement – series 2
- amount used – lease financing arrangement – series 3
- amount used – brokerage arrangement
- amount unused
18,377 53,722
8,827 -
27,159 9,460
113,137 104,318
Total facility (iii) 167,500 167,500
(i) The loans are provided in the form of notes in a series of ThinkSmart Trust. The notes are secured by all payments
receivable in respect of the underlying lease receivable contracts assigned to the relevant series of ThinkSmart Trust
and pay down in line with the repayments of the underlying leases, regardless of the result of any review outlined in
note (iii) below. An additional $3.5m corporate guarantee is provided as support for one of the tranches of senior
funding. The notes are interest bearing and during the period the weighted average rate was 6.64% (2011: 7.62%).
(ii) The financial liability arises from a contractual obligation the Group has to remit funds to Bendigo and Adelaide Bank
arising from the “pass through” arrangement. The obligation is secured by all payments receivable in respect of the
underlying lease receivable contracts subject to the “pass through” arrangement and pay down in line with the
repayments of the underlying leases. The obligation is interest bearing and the weighted average interest rate was
6.75% (2011: 8.49%).
(iii) A customer financing facility of $100.0m (2011: $100.0m) is reviewed annually, with the next review due in June
2013. Another customer financing facility of $67.5m (2011: $67.5m) is available until December 2016 on an
offer and accept basis.
For
per
sona
l use
onl
y

NOTES TO THE FINANCIAL STATEMENTS
76
20. ISSUED CAPITAL
2012
$000
2011
$000
(a) Issued and paid up capital
159,163,764 Ordinary Shares fully paid (2011: 130,004,390) 48,073 39,664
2012
Number
2012
$000
2011
Number
2011
$000
Fully Paid Ordinary Shares
Balance at beginning of the financial year 130,004,390 39,664 129,879,390 39,615
Issue of new shares for employee loan-funded share plan 3,033,333 - - -
Issue of new shares for employee share-based payment 125,000 23 125,000 65
Issue of new shares 26,001,041 9,100 - -
Capital raising costs - (714) - (16)
Balance at end of the financial year 159,163,764 48,073 130,004,390 39,664
During the year no employee share options or loan-funded shares were exercised (2011: nil). The Company issued 125,000
escrowed shares to an Executive, A Baum, during the year as part of his employment contract, refer to Note 20(b)(ii).
Ordinary Shares entitle the holder to participate in dividends and the proceeds on winding up the Company in proportion to
the number of and amount paid on the Shares held.
On a show of hands, every holder of Ordinary Shares present in the meeting in person or by proxy is entitled to one vote, and
upon a poll each Share is entitled to one vote.
The Company does not have authorised capital or par value in respect to its issued shares.
(b)(i) Share options – employee options and loan-funded shares
The Company has an ownership-based remuneration scheme for Executives and senior employees. Each employee share
option converts to one ordinary share of ThinkSmart Limited on exercise and payment of the exercise price. Each employee
loan-funded share converts to one ordinary share of ThinkSmart Limited on exercise and repayment of the loan. The options
carry neither rights or dividends nor voting rights. The loan-funded shares carry voting and rights to dividends.
Options issued in previous periods:
• 3,350,000 options over ordinary shares were issued 30 June 2009 and exercisable at $0.62, with an exercise
period between 1 January 2012 and 31 December 2013. Vesting of the options is subject to achievement of the
following performance conditions:
- 50% of options are subject to achievement of Earnings per Share (“EPS”) performance conditions; and
- 50% of options are subject to achievement of Total Shareholder Return (“TSR”) performance conditions.
For
per
sona
l use
onl
y

NOTES TO THE FINANCIAL STATEMENTS
ANNUAL REPORT 2012 77
• 2,200,000 and 333,333 options over ordinary shares were issued 5 May 2010 and 1 September 2010
respectively. The options are exercisable at $1.11, with an exercise period between 1 January 2013 and 31
December 2014. Vesting of the options is subject to achievement of the following performance conditions:
- 50% of options are subject to achievement of Earnings per Share (“EPS”) performance conditions; and
- 50% of options are subject to achievement of Total Shareholder Return (“TSR”) performance conditions.
• 2,133,333, 100,000 and 250,000 options over ordinary shares were issued 11 April 2011, 15 June 2011 and
25 July 2011 respectively. The options are exercisable at $0.84, with an exercise period between 1 January 2014
and 31 December 2015. Vesting of the options is subject to achievement of the following performance conditions:
- 50% of options are subject to achievement of Earnings per Share (“EPS”) performance conditions; and
- 50% of options are subject to achievement of Total Shareholder Return (“TSR”) performance conditions.
Options and loan-funded shares issued in the current period:
• 400,000 options over ordinary shares were issued 10 August 2012 and exercisable at $0.1923, vesting and
exercisable on 10 August 2015 until 09 August 2017. Vesting of the options is subject to achievement of the
following performance conditions:
- Tranche 1: 25% of options will vest if the share price hurdle of $0.35 is met in accordance with the
performance conditions;
- Tranche 2: 25% of options will vest if the share price hurdle of $0.55 is met in accordance with the
performance conditions; and
- Tranche 3: 50% of loan options will vest if the share price hurdle of $0.75 is met in accordance with the
performance conditions.
• 3,033,333 loan-funded shares were issued 10 August 2012 and exercisable at $0.1923, vesting and exercisable
on 10 August 2015 until 09 August 2017. Vesting of the loan-funded shares is subject to achievement of the
following performance conditions:
- Tranche 1: 25% of loan-funded shares will vest if the share price hurdle of $0.35 is met in accordance
with the performance conditions;
- Tranche 2: 25% of loan-funded shares will vest if the share price hurdle of $0.55 is met in accordance
with the performance conditions; and
- Tranche 3: 50% of loan-funded shares will vest if the share price hurdle of $0.75 is met in accordance
with the performance conditions.
The value of these options and loan-funded shares will be expensed over the vesting period in accordance with AASB 2.For
per
sona
l use
onl
y

NOTES TO THE FINANCIAL STATEMENTS
78
20. ISSUED CAPITAL (CONTINUED)
(b)(i) Share options – employee options and loan-funded shares (continued)
Below are options and loan-funded shares issued in 2011 and 2012:
Loan-funded shares
issued in 2012Number Grant date Exercise period
Exercise
price
Fair value at
grant date
Employee loan-funded shares 3,033,333 10/08/2012 10 Aug 2012 to 09 Aug 2017 $0.19 $0.02 - $0.06
Options series issued in 2012 Number Grant date Exercise periodExercise
price
Fair value at
grant date
Employee options 400,000 10/08/2012 10 Aug 2012 to 09 Aug 2017 $0.19 $0.02 - $0.06
Options series issued in 2011 Number Grant date Exercise periodExercise
price
Fair value at
grant date
Employee options 1,000,000 11/04/2011 1 Jan 2014 to 31 Dec 2015 $0.84 $0.42
Employee options 1,133,333 11/04/2011 1 Jan 2014 to 31 Dec 2015 $0.84 $0.40
Employee options 100,000 15/06/2011 1 Jan 2014 to 31 Dec 2015 $0.84 $0.30
Employee options 250,000 25/07/2011 1 Jan 2014 to 31 Dec 2015 $0.84 $0.28
The weighted average fair value of the share options and loan-funded shares granted in 2012 is $0.35 (2011: $0.33).
Options issued before 2012 were priced using a binomial option pricing model. Expected volatility is based on that observed
for comparable listed companies over the time period appropriate to the option grant in question. Options and loan-funded
shares issued in 2012 were priced using a monte-carlo pricing model. Expected volatility is based on the historic volatility of
the market price of the Company’s share and the mean reversion tendency of volatilities.
For
per
sona
l use
onl
y

NOTES TO THE FINANCIAL STATEMENTS
ANNUAL REPORT 2012 79
20. ISSUED CAPITAL (CONTINUED)
(b)(i) Share options – employee options and loan-funded shares (continued)
Below are the inputs used to measure the fair value of the options and loan-funded shares:
Employee options and
loan-funded shares
Issued in 2012
Grant date 10/08/2012
Fair value at grant date $0.02-$0.06
Grant date share price $0.19
Exercise price $0.19
Expected volatility 50%
Option/loan share life 4 years
Dividend yield 2.14%
Risk-free interest rate 2.5%
Employee options Employee options Employee options Employee options
Issued in 2011
Grant date 11/04/2011 11/04/2011 15/06/2011 25/07/2011
Fair value at grant date $0.42 $0.40 $0.30 $0.28
Grant date share price $0.83 $0.83 $0.70 $0.66
Exercise price $0.84 $0.84 $0.84 $0.84
Expected volatility 78% 78% 78% 78%
Option life 4.2 years 3.7 years 3.5 years 3.4 years
Dividend yield 4.15% 4.15% 4.88% 4.88%
Risk-free interest rate 5.85% 5.75% 5.50% 4.56%
For
per
sona
l use
onl
y

NOTES TO THE FINANCIAL STATEMENTS
80
20. ISSUED CAPITAL (CONTINUED)
(b)(i) Share options – employee options and loan-funded shares (continued)
The following reconciles the outstanding share options/loan-funded shares granted under the employee share option plan and
loan-funded shares at the beginning and end of the financial year:
2012 2011
Number of
options/loan
funded shares
Weighted
average
exercise price
$
Number of
options
Weighted
average
exercise price
$
Balance at beginning of the financial year 7,166,667 $0.84 6,293,333 $1.05
Granted during the financial year 3,433,333 $0.19 2,483,333 $0.84
Forfeited during the financial year (1,400,000) $0.74 (649,999) $0.85
Exercised during the financial year - - - -
Expired during the financial year - - (960,000) $2.19
Balance at the end of financial year 9,200,000 $0.61 7,166,667 $0.84
Exercisable at end of the financial year - - - -
The options and loan-funded shares outstanding at 31 December 2012 have an exercise price in the range of $0.19 to
$1.11 (2011: $0.62 to $1.11) and a weighted average contractual life of 2.83 years (2011: 2.97 years).
The following is the total expense recognised for the period arising from share-based payment transactions:
2012
$000
2011
$000
Share options granted in 2006 – equity settled (85) -
Share options granted in 2009 – equity settled (64) 43
Share options granted in 2010 – equity settled 111 224
Share options granted in 2011 – equity settled 212 255
Shares as remuneration granted in 2010, 2011 and 2012 – equity settled 98 82
Share options/loan-funded shares granted in 2012 – equity settled 54 -
Total expense recognised as employee costs 326 604
For
per
sona
l use
onl
y

NOTES TO THE FINANCIAL STATEMENTS
ANNUAL REPORT 2012 81
20. ISSUED CAPITAL (CONTINUED)
(b)(ii) Share compensation – employee shares
Details on shares of the Company that were granted as remuneration to each Key Management Person and details of shares
vested during the reporting period are as follows:
No of shares
granted Grant date
Fair value at
grant date ($) Vesting period
No of shares
vested during
2012
No of shares
vested during
2011
Executives
A Baum 350,000 01/09/2010 0.64 3 years - -
A Baum 125,000 01/09/2011 0.52 3 years - -
A Baum 125,000 03/10/2012 0.18 3 years - -
The shares are provided at no cost to the recipient as part of his employment contract and are held in escrow. No shares
have been granted since the end of the financial year.
These shares were issued to A Baum. The shares are ordinary shares in the Company and will vest upon completion of
a 3-year service period from the date of issue. During this period, Mr Baum is entitled to any dividends declared by the
Company and normal voting rights are attached. In the event that Mr Baum’s employment with the Company ceases before
the vesting period (i.e. through resignation or termination), the shares will be cancelled. If Mr Baum is retrenched by the
Company due to changes in the Company’s structure or operations, he will be entitled to retain the shares and they will
become immediately unconditional if this occurs before the escrow period expires.
The fair value of these shares is recorded in the profit and loss on a straight line basis across their vesting term, with
$0.098m (2011: $0.082m) expensed during the year.
(c) Dividends
There were no dividends declared or paid during the year or since the year end.
During 2011, $4.546m of dividends were paid on 29 April 2011. This was a dividend of 3.5 cents per share which was 45%
franked at the tax rate of 30%.
For
per
sona
l use
onl
y

NOTES TO THE FINANCIAL STATEMENTS
82
20. ISSUED CAPITAL (CONTINUED)
(d) Franking credits
2012
$000
2011
$000
Franking credit account balance as at the beginning of the financial year at a tax rate of
30% (2011: 30%) 1,190 615
Franking credits from the payment of income tax paid and payable as at the end of the
financial year 1,539 1,644
Franking debits from the payment of dividends in the financial year - (1,069)
Franking credit account balance as at the beginning of the financial year at a tax
rate of 30% (2011: 30%) 2,729 1,190
The ability to utilise the franking credits is dependent upon there being sufficient available profits to declare dividends. In
accordance with the tax consolidation legislation, the Company as the head entity in the tax-consolidated group is allowed to
assume the relevant subsidiaries’ franking credits. As at 31 December 2012, the subsidiaries have no franking credits for the
benefit of the Company (2011: nil).
21. RESERVES
2012
$000
2011
$000
Equity settled employee benefits reserve – options (i) 1,159 951
Equity settled employee benefits reserve – shares (i) (86) (181)
Foreign currency translation reserve (ii) (4,066) (4,432)
Hedge reserve (iii) (90) (208)
(3,083) (3,870)
(i) The share-based remuneration reserve arises on the grant of share options and shares to Executives under the
employee share option plan and loan-funded share plan. Amounts are transferred out of the reserves and into
issued capital when the options are exercised. For shares issued as remuneration and accounted for as a share-
based payment arrangement, the full fair value of the shares are initially recognised in the reserve and share capital,
and are subsequently transferred out of the reserve to the profit and loss over the vesting period. Further information
about the share-based payments is provided in Note 20(b) to the financial statements.
(ii) The translation reserve comprises all foreign currency differences arising from the translation of the financial
statements of foreign operations as well as from the translation of liabilities that hedge the Company’s net
investment in a foreign subsidiary.
(iii) The hedge reserve comprises the effective portion of the cumulative net change in fair value of the cash flow hedge
relating to hedged transactions that have not yet occurred.
For
per
sona
l use
onl
y

NOTES TO THE FINANCIAL STATEMENTS
ANNUAL REPORT 2012 83
22. NOTES TO THE CASH FLOW STATEMENT
(a) For the purposes of the cash flow statement, cash and cash equivalents includes cash on hand and in banks and
investments in money market instruments, net of outstanding bank overdrafts. Cash and cash equivalents at the
end of the financial year as shown in the cash flow statement is reconciled to the related items in the balance sheet
as follows:
2012
$000
2011
$000
Reconciliation of cash and cash equivalents
Cash balance comprises:
- Available cash and cash equivalents
- Restricted cash
6,008 2,582
12,560 2,028
18,568 4,610
The restricted cash is held as part of the Group's funding arrangements in Australia and the UK. Included within restricted
cash is $5.432m (31 December 2011: $nil) of deposits held as a loss reserve against the performance of lease assets
within the funding agreement which was finalised in June 2012 and is described in Note 9.
The Group’s exposure to credit risk, interest rate and sensitivity analysis of the financial assets and liabilities are provided in
Note 28.
For
per
sona
l use
onl
y

NOTES TO THE FINANCIAL STATEMENTS
84
22. NOTES TO THE CASH FLOW STATEMENT (CONTINUED)
2012
$000
2011
$000
(b) Reconciliation of the (loss)/profit for the year to net cash
flows from operating activities:
(Loss)/profit after tax (1,441) 6,798
Add back non-cash items:
Depreciation 428 541
Amortisation 2,808 1,720
Impairment - 69
Impairment losses on finance lease receivables 4,098 1,522
Foreign currency loss/(gain) unrealised 358 (13)
Provision for employee entitlements 95 3
Equity settled share-based payment 326 604
(Increase)/decrease in assets:
Trade receivables, deposits held with funders and other movements in lease assets 1,198 (6,959)
Prepayments 811 712
Deferred tax asset (1,825) 288
Other assets 444 (377)
Rental asset inventory (124) -
Increase/(decrease) in liabilities:
Trade and other creditors (4,732) 6,612
Provision for income tax (2,151) 1,086
Deferred tax liability 493 (194)
Other payables (96) -
Net cash from operating activities 690 12,412
For
per
sona
l use
onl
y

NOTES TO THE FINANCIAL STATEMENTS
ANNUAL REPORT 2012 85
23. LEASES AND HIRE PURCHASE OBLIGATIONS
Operating leases – leasing arrangements
Operating leases relate to office facilities with lease terms of up to 6 years. All operating lease contracts contain market
review clauses in the event that the consolidated entity exercises its option to renew. The consolidated entity does not have
an option to purchase the leased asset at the expiry of the lease period.
2012
$000
2011
$000
Non-cancellable operating lease payments:
No later than 1 year 871 838
Later than 1 year and not later than 5 years - 871
871 1,709
No provisions have been recognised in respect of non-cancellable operating leases.
24. SEGMENT INFORMATION
The Group has three reportable segments which comprise the Group’s two core business units, with the “other” segment
presented composing low volume territories. The head office corporate function composes the reconciliation between
the three reportable segments and the Group, given that there is no inter-segment revenue. The business units offer
predominantly similar products and services, however have separate Executive structures and separate operational teams.
During the year, the internal information supplied to management changed to align with this structure and as a result
comparative segment information has been restated in conformity with the requirements of AASB 8 Operating Segments.
For each of the segments, the Board and the CEO review internal management reports on a monthly basis. The composition
of the reportable segments is as follows:
Australia: Other:
- ThinkSmart Finance Ltd - RentSmart (NZ) Pty Ltd
- ThinkSmart Trust - SmartCheck Finance Spain SL
- RentSmart Servicing Pty Ltd - ThinkSmart Europe Ltd
- RentSmart Pty Ltd - ThinkSmart France SARL
- ThinkSmart Inc
UK: - ThinkSmart Inc (USA)
- RentSmart Limited - ThinkSmart Italy Srl
- ThinkSmart Insurance Administration Ltd
Corporate:
- ThinkSmart Limited
For
per
sona
l use
onl
y

NOTES TO THE FINANCIAL STATEMENTS
86
24. SEGMENT INFORMATION (CONTINUED)
Operating Segments
Information about
reportable segmentsUK Australia
Other
TerritoriesCorporate Total
For the year ended 31
December
2012
$000
2011
$000
2012
$000
2011
$000
2012
$000
2011
$000
2012
$000
2011
$000
2012
$000
2011
$000
Portfolio income 7,556 6,393 16,286 12,460 217 419 39 237 24,098 19,509
Interest expense - - (4,001) (1,116) (1) (2) (238) (174) (4,240) (1,292)
Net portfolio income 7,556 6,393 12,285 11,344 216 417 (199) 63 19,858 18,217
Commission income 9,256 6,034 2,837 15,292 (56) 534 - - 12,037 21,860
Other revenue 2,044 2,366 1,485 2,301 59 318 - - 3,588 4,985
Net operating income 18,856 14,793 16,607 28,937 219 1,269 (199) 63 35,483 45,062
Indirect customer
acquisition costs (4,962) (2,779) (3,129) (6,324) (26) (644) (22) (6) (8,139) (9,753)
Operating expenses (5,580) (5,340) (10,921) (10,809) (316) (568) (4,917) (4,327) (21,734) (21,044)
Depreciation and
amortisation (394) (539) (2,786) (1,591) (56) (131) - - (3,236) (2,261)
Impairment losses (Note
6(f)) (182) - (4,098) (1,524) - (67) - - (4,280) (1,591)
Restructuring costs - - - - - (217) - (185) - (402)
Reportable segment profit
before income tax 7,738 6,135 (4,327) 8,689 (179) (358) (5,138) (4,455) (1,906) 10,011
Reportable segment assets 22,319 10,795 88,486 90,394 3,066 6,108 1,074 884 114,945 108,181
Reportable segment
liabilities 8,103 1,659 59,751 63,504 (1,275) 1,019 345 1,733 66,924 67,915
Capital expenditure 235 639 2,097 4,161 - - - - 2,332 4,800
Major customer
Revenues from the Group’s funding partners represent $12.038m (2011: $28.166m) of the Group’s total revenue.
For
per
sona
l use
onl
y

NOTES TO THE FINANCIAL STATEMENTS
ANNUAL REPORT 2012 87
25. REMUNERATION OF AUDITORS
2012
$
2011
$
Audit services:
Auditors of the Company:
Audit and review of financial reports (Australia) 353,981 302,645
Audit and review of financial reports (Overseas) 77,707 96,373
431,688 399,018
Services other than statutory audit:
Other assurance services:
Tax and other services 31,481 80,307
Accounting advice 16,500 -
47,981 80,307
The Group’s auditors were KPMG in 2012 and 2011.
26. COMMITMENTS AND CONTINGENT LIABILITIES
Australia
Under the terms of its Australian non-SPE funding agreement the Group had deposits held by the funder as credit support for the
portfolio of leases funded by the funder. These deposits represented amounts held in excess of expected future losses, however the
Group has a potential risk that, if losses exceeded expected levels and alternate remedies were not made, a portion of these deposits
would have been forfeited. As at 31 December 2011, the maximum amount of funder deposits that the Group could have potentially
forfeited in the future was $1.241m. During June 2012, the Group renegotiated this funding agreement to provide a different method of
credit support, releasing all previous deposits held.
UK
Under the terms of its current UK funding agreement, the Group is obliged to purchase delinquent leases from the funder at the funded
amount plus any commission previously received. At 31 December 2012, the total funded amount of all leases funded by the funder
is $42.455m (31 December 2011: $26.131m). The Group has entered into a Credit Default Swap (CDS) with STB for which it has
provided a deposit of $6.995m (31 December 2011: $4.303m) as collateral for the obligation under the funding agreement and
CDS. The Group has provided $1.881m (31 December 2011: $1.330m) which includes some estimation uncertainty as it requires
an estimate of the future amount potentially payable for those leases that are likely to become delinquent in the future. The Group
estimates this amount based on historical loss experience for assets with similar characteristics.
The total balance of deposits recognised with funders, net of associated provisions and financial guarantee contracts, is $5.080m (31
December 2011: $5.175m).For
per
sona
l use
onl
y

NOTES TO THE FINANCIAL STATEMENTS
88
27. CONTINGENT INERTIA ASSETS
Under the Group’s accounting policy, inertia revenue for those assets funded under the brokerage model in the UK, where
the Group does not have an unconditional right to the asset and residual lease rights, is not recognised until the conclusion
of the initial rental period. At this point, the Group is entitled to acquire the equipment from the funders at a nominal value,
and the equipment can be disposed of, or continue to be rented to third parties. The Group does not have control over
these future revenue streams and accordingly the revenue is not brought to account until it is received. An estimate of the
realisable value of the future revenue streams of $0.939m (31 December 2011: $1.356m) has been made by estimating
expected proceeds through sales channels and public auction.
Where the Group does have an unconditional right to these future revenue streams it recognises an intangible asset.
28. FINANCIAL INSTRUMENTS
(a) Interest rate risk
At the reporting date, the interest rate profile of the Group’s interest bearing financial instruments were:
Carrying amount
2012
$000
2011
$000
Fixed rate instruments
Loan and lease receivables 62,414 66,425
62,414 66,425
Variable rate instruments
Cash and cash equivalents 18,568 4,610
Deposits held by funder (non-current) 5,080 5,175
Term loan - (2,427)
Secured note facility (54,363) (53,722)
Net financial liability (30,715) (46,364)
Sensitivity analysis
A change in 1% in interest rates would have increased or decreased the Group’s profit by the amounts show below (2011:
$0.202m). This analysis assumes that all other factors remain constant including foreign currency rates.
Profit or Loss
Increase
1%
Decrease
1%
Variable rate instruments (90) 127
Interest rate hedge 36 (36)
Net profit sensitivity (54) 91
For
per
sona
l use
onl
y

NOTES TO THE FINANCIAL STATEMENTS
ANNUAL REPORT 2012 89
28. FINANCIAL INSTRUMENTS (CONTINUED)
(b) Fair value of financial instruments
The carrying amounts of financial assets and financial liabilities recorded in the financial statements are not materially
different to their fair values. In the case of fixed rate loan and lease receivables, changes in market interest rates and other
factors influencing their fair value since inception have an immaterial impact on the effective interest rate.
Fair value hierarchy
The financial instruments carried at fair value have been classified by valuation method.
The different levels have been defined as follows:
• Level 1: quoted prices (unadjusted) in active markets for identical assets or liabilities
• Level 2: inputs other than quoted prices included within Level 1 that are observable for the asset or liability, either
directly (i.e., as prices) or indirectly (i.e., derived from prices)
• Level 3: inputs for the asset or liability that are not based on observable market data (unobservable inputs)
The financial liability of the Group is solely comprised of interest rate swaps used for hedging, classified as level 2.
Key assumptions in the valuation of the instruments are limited to interpolating interest rates for certain future periods where
there is no observable market data.
(c) Credit risk management
The maximum credit risk exposure of the Group is the sum of the carrying amount of the Group’s financial assets and the
contingent liabilities in Note 26. The carrying amount of the Group’s financial assets that is exposed to credit risk at the
reporting date is:
Note
2012
$000
2011
$000
Cash and cash equivalents 22(a) 18,568 4,610
Loan and lease receivables (current) 9 39,164 38,419
Loan and lease receivables (non-current) 9 23,250 28,006
Trade receivables 2,890 10,015
Prepayments (current) 1,858 3,336
Other assets (current) 8 - 771
Sundry debtors 8 959 1,172
Other non-current assets 10 6,644 6,777
93,333 93,106
For
per
sona
l use
onl
y

NOTES TO THE FINANCIAL STATEMENTS
90
28. FINANCIAL INSTRUMENTS (CONTINUED)
(c) Credit risk management (continued)
The carrying amount of the Group’s financial assets that is exposed to credit risk at the reporting date by geographic region is:
2012
$000
2011
$000
Australia 79,221 82,759
UK 13,886 10,026
Other 226 321
93,333 93,106
The carrying amount of the Group’s financial assets that is exposed to credit risk at the reporting date by types of
counterparty is:
2012
$000
2011
$000
Banks (i) 18,568 4,610
Funders 5,080 5,990
Insurance partners (ii) 3,421 3,512
Retail finance customers (iii) 62,415 66,426
Others (iii) 3,849 12,568
93,333 93,106
(i) Cash and cash equivalents are held with banks with S&P ratings of A- and AA-.
(ii) In 2012, 86% (2011: 72%) of the total prepayment relates to RentSmart Limited’s upfront insurance premium
payments to Allianz on behalf of the rental customer. The premiums are recovered from the customer on a monthly
basis. In the event the customer defaults, the policy is cancelled and Allianz refunds the unexpired premium.
(iii) Included in Others is an amount of $1.803m (2011: $7.297m) relating to collections from lessee customers in
relation to the portfolio of leases acquired by the Group via a “pass through” arrangement from Bendigo and
Adelaide Bank. The credit risk exposure from retail customers also includes an amount of $30.630m (2011:
$41.221m) which relates to the same portfolio of leases. The bank account to which collections are deposited is
held with Bendigo and Adelaide Bank and accordingly the Group has a credit risk exposure to Bendigo and Adelaide
Bank with respect to these amounts.For
per
sona
l use
onl
y

NOTES TO THE FINANCIAL STATEMENTS
ANNUAL REPORT 2012 91
28. FINANCIAL INSTRUMENTS (CONTINUED)
(c) Credit risk management (continued)
Trade receivables
The ageing of the Group’s trade receivables at the reporting date was:
Gross
2012
$000
Impairment
2012
$000
Gross
2011
$000
Impairment
2011
$000
Not past due 1,803 - 344 -
Past due 0-30 days 1,000 - 9,602 30
Past due 31-120 days 87 87 35 21
Past due 121-365 days - - 32 32
More than 1 year - - 2 2
2,890 87 10,015 85
The movement in the allowance for impairment in respect of trade receivables during the year was as follows:
2012
$000
2011
$000
Balance at 1 January 85 112
Impairment loss recognised 217 148
Bad debt written off (216) (175)
Effect of exchange rate 1 -
Balance at 31 December 87 85
Trade receivables are reviewed and considered for impairment on a periodic basis, based on the number of days outstanding
and number of payments in arrears. $1.803m (2011: $9.510m) of the trade receivables balance is owed by the Group’s
most significant financiers.
For
per
sona
l use
onl
y

NOTES TO THE FINANCIAL STATEMENTS
92
28. FINANCIAL INSTRUMENTS (CONTINUED)
(c) Credit risk management (continued)
Loan and lease receivables
The ageing of the Group’s loan and lease receivables at the reporting date was:
Gross
2012
$000
Impairment
2012
$000
Gross
2011
$000
Impairment
2011
$000
Not past due 53,711 - 59,565 -
Past due 0-30 days 4,598 20 5,200 227
Past due 31-120 days 3,698 749 2,986 1,208
Past due 121-365 days 3,826 2,735 259 153
More than 1 year 395 310 4 1
66,228 3,814 68,014 1,589
The Group’s loan and lease receivables are high volume low value and are advanced to individual customers and small
businesses, which prior to inception require to pass the Group’s internal credit assessment threshold.
The movement in the allowance for impairment in respect of lease receivables during the year was as follows:
Note
2012
$000
2011
$000
Balance at 1 January 1,589 67
Impairment loss recognised 6(f) 4,098 1,522
Bad debt written off (1,873) -
Balance at 31 December 3,814 1,589
The management of credit risk in relation to its customers is described in Note 5.
For
per
sona
l use
onl
y

NOTES TO THE FINANCIAL STATEMENTS
ANNUAL REPORT 2012 93
28. FINANCIAL INSTRUMENTS (CONTINUED)
(d) Currency risk management
Exposure to currency risk
The Group’s exposure to foreign currency risk at balance date was as follows, based on notional amounts:
31 December 2012
GBP
£000
EUR
€000
NZD
$000
USD
$000
Cash and cash equivalents 2,301 60 14 8
Trade receivables 646 16 - -
Trade and other payables (1,903) (53) - (3)
Net exposure 1,044 23 14 5
31 December 2011
GBP
£000
EUR
€000
NZD
$000
USD
$000
Cash and cash equivalents 1,180 75 24 9
Trade receivables 955 29 116 -
Trade and other payables (1,109) (51) (44) (3)
Net exposure 1,026 53 96 6
The following significant exchange rates applied during the year:
AUD
Average rate Reporting date spot rate
2012 2011 2012 2011
EUR 0.8061 0.7412 0.7868 0.7847
GBP 0.6536 0.6434 0.6428 0.6589
USD 1.0358 1.0320 1.0384 1.0156
NZD 1.2787 1.3053 1.2608 1.3146
For
per
sona
l use
onl
y

NOTES TO THE FINANCIAL STATEMENTS
94
28. FINANCIAL INSTRUMENTS (CONTINUED)
(d) Currency risk management (continued)
Sensitivity analysis
A 10% strengthening of the Australian dollar against the following currencies at 31 December would have increased/
(decreased) equity and profit and loss by the amounts shown below. This analysis assumes that all other variables, in
particular interest rates, remain constant. The analysis is performed on the same basis for 2011:
Equity
$000
Profit or loss
$000
31 December 2012
EUR (10) 3
GBP (1,820) (513)
USD (1) (205)
NZD (2) 4
31 December 2011
EUR 121 49
GBP (822) (22)
USD 190 -
NZD (4) 3
A 10% weakening of the Australian dollar against the above currencies at 31 December would have had an equal but
opposite effect on the above currencies to the amounts shown above, on the basis that all other variables remain constant.
For
per
sona
l use
onl
y

NOTES TO THE FINANCIAL STATEMENTS
ANNUAL REPORT 2012 95
28. FINANCIAL INSTRUMENTS (CONTINUED)
(e) Liquidity risk management
The following are the contractual maturities of non-derivative financial liabilities, including estimated interest payments and
excluding the impact of netting agreements:
Non-derivatives
Carrying
Amount
$000
Contractual
cash flow
$000
Less than 1
year
$000
1-2 years
$000
2-5 years
$000
31 December 2012
Trade and other payables 6,513 (6,513) (6,513) - -
Term loans - - - - -
Secured note facility 54,363 (57,966) (37,009) (16,634) (4,323)
60,876 (64,479) (43,522) (16,634) (4,323)
31 December 2011
Trade and other payables 6,606 (6,606) (6,606) - -
Term loans 2,427 2,616 2,616 - -
Secured note facility 53,722 (57,766) (39,964) (14,302) (3,500)
62,755 (61,756) (43,954) (14,302) (3,500)
Derivatives
Carrying
Amount
$000
Contractual
cash flow
$000
Less than 1
year
$000
1-2 years
$000
2-5 years
$000
31 December 2012
Interest rate swaps used for hedging 128 (128) (113) (15) -
128 (128) (113) (15) -
31 December 2011
Interest rate swaps used for hedging 297 (297) (227) (65) (5)
297 (297) (227) (65) (5)
For
per
sona
l use
onl
y

NOTES TO THE FINANCIAL STATEMENTS
96
29. RELATED PARTY DISCLOSURES
The following were Key Management Personnel of the Group at any time during the reporting period and unless otherwise
indicated were Key Management Personnel for the entire period:
Non-Executive Directors
D Griffiths (Deputy Chairman)
S Penglis
F de Vicente
N Fox
Executive Directors
N Montarello (Executive Chairman and Chief Executive Officer)
Executives
A Baum (Group Chief Operating Officer)
G Halton (Managing Director (acting) – UK) – appointed 1 October 2012
A Stevens (Group Chief Financial Officer) – appointed 28 March 2012
G Varma (Group Chief Information Officer)
A Deller (Managing Director – Europe) – from 23 January 2012 to 30 September 2012
J Ferreira (Group Chief Financial Officer (acting)) – until 28 March 2012
S McDonagh (Executive General Manager) – until 30 November 2012
G Parry (Managing Director - UK) – until 30 April 2012
The Key Management Personnel remuneration included in ‘employee benefits expense’ in Note 6(d) is as follows:
2012
$
2011
$
Short-term employee benefits 2,735,118 2,537,505
Post-employment benefits 312,656 317,933
Other long-term benefits 69,064 (36,735)
Share-based payments 287,943 534,908
3,404,781 3,353,611
The Key Management Personnel receive no remuneration in relation to management of the Company (2011: nil).
Individual Directors and Executives Remuneration Disclosures
Information regarding individual Directors and Executives remuneration and some equity instruments disclosures as permitted
by Corporations Regulations 2M.3.03 is provided in the Remuneration Report section of the Directors’ Report.
Apart from the details disclosed in this note, no Director has entered into a material contract with the Group since the end of
the previous financial year and there were no material contracts involving Directors’ interests existing at year-end.
For
per
sona
l use
onl
y

NOTES TO THE FINANCIAL STATEMENTS
ANNUAL REPORT 2012 97
29. RELATED PARTY DISCLOSURES (CONTINUED)
Loans to Key Management Personnel and their related parties
There have been no loans provided to Key Management Personnel and their related parties as at 31 December 2012 (2011:
nil), with the exception of the limited recourse loans in relation to the loan-funded share scheme (refer to Note 20(b)(i) and
the Remuneration Report section of the Directors Report).
Other Key Management Personnel transactions
During the year and previous year, there has been no transaction with entities in which the Key Management Personnel has
significant control or influence over those entities’ financial or operating policies.
Options and rights over equity instruments
The movement during the reporting period in the number of options over ordinary shares in ThinkSmart Ltd held, directly,
indirectly or beneficially, by each Key Management Person, including their related parties, is as follows:
For
per
sona
l use
onl
y

NOTES TO THE FINANCIAL STATEMENTS
98
29. RELATED PARTY DISCLOSURES (CONTINUED)
Employee options
2012
Held at 1
January
2012
Held at
date of
new ap-
pointment
Granted as
compensa-
tion
Other
movement
Lapsed or
forfeited
Held at 31
December
2012
Vested during
the year
Vested and
exercis-
able at 31
December
2012
Directors
N Montarello 3,000,000 - - - - 3,000,000 1,000,000 1,000,000
D Griffiths - - - - - - - -
S Penglis - - - - - - - -
F de Vicente - - - - - - - -
N Fox - - - - - - - -
Executives
A Baum 666,666 - - - - 666,666 - -
G Halton - 350,000 100,000 - - 450,000 150,000 150,000
A Stevens - - - - - - - -
G Varma 350,000 - - - - 350,000 - -
J Ferreira 400,000 - - - (400,000) - - -
S McDonagh 250,000 - - (250,000) - - - -
G Parry 700,000 - - - (700,000) - - -
2011
Held at 1
January
2011
Held at
date of
new ap-
pointment
Granted as
compensa-
tion
Other
movement
Lapsed or
forfeited
Held at 31
December
2011
Vested during
the year
Vested and
exercis-
able at 31
December
2011
Directors
N Montarello 2,000,000 - 1,000,000 - - 3,000,000 - -
D Griffiths - - - - - - - -
S Penglis - - - - - - - -
F de Vicente - - - - - - - -
N Fox - - - - - - - -
Executives
A Baum 333,333 - 333,333 - - 666,666 - -
G Varma 250,000 - 100,000 - - 350,000 - -
N Barker 1,113,333 - - - (479,999) n/a - -
J Ferreira 250,000 - 150,000 - - 400,000 - -
S McDonagh - - 250,000 - - 250,000 - -
G Parry 780,000 - 200,000 - (280,000) 700,000 - -
Movements in loan-funded shares granted as compensation are set out in the following movements in shares table.
For
per
sona
l use
onl
y

NOTES TO THE FINANCIAL STATEMENTS
ANNUAL REPORT 2012 99
29. RELATED PARTY DISCLOSURES (CONTINUED)
Movement in shares
The movement during the reporting period in the number of ordinary shares in ThinkSmart Limited held, directly, indirectly or
beneficially, by each Key Management Person, including their related parties, is as follows:
2012
Held at 1
January
2012 Purchases
Rights
issue Sales
Received
on exercise
of options
Loan-
funded
share issue
Granted as
compensation
Held at 31
December
2012
Directors
N Montarello 22,520,297 1,535,000 4,504,059 - - 1,000,000 - 29,559,356
D Griffiths 2,160,000 - 432,001 - - - - 2,592,001
S Penglis 1,272,600 - - - - - - 1,272,600
F de Vicente - 356,500 - - - - - 356,500
N Fox 68,000 - 13,600 - - - - 81,600
Executives
A Baum 751,910 100,000 149,222 - - 333,333 125,000 1,459,465
A Stevens - - - - - 500,000 - 500,000
G Varma - - - - - 200,000 - 200,000
S McDonagh 11,000 - - - - 200,000 - n/a
G Parry 25,357 - - - - - - n/a
2011
Held at 1
January
2011 Purchases
Rights
issue Sales
Received
on exercise
of options
Loan-
funded
share issue
Granted as
compensation
Held at 31
December
2011
Directors
N Montarello 22,020,297 500,000 - - - - - 22,520,297
D Griffiths 2,160,000 - - - - - - 2,160,000
S Penglis 1,272,600 - - - - - - 1,272,600
F de Vicente - - - - - - - -
N Fox 68,000 - - - - - - 68,000
Executives
A Baum 626,910 - - - - - 125,000 751,910
G Varma 185,082 - - (185,082) - - - -
N Barker 547,999 - - - - - - n/a
S McDonagh 12,713 10,000 - (11,713) - - - 11,000
G Parry 25,357 - - - - - - 25,357
n/a: Where personnel are no longer employed on the report date, the share movement only relates to the period up to their
respective resignation dates.
For
per
sona
l use
onl
y

NOTES TO THE FINANCIAL STATEMENTS
100
29. RELATED PARTY DISCLOSURES (CONTINUED)
The following shares are subject to escrow as at 31 December 2012 (refer to Note 22(b)(ii)):
Held at
31 December 2012
Held at
31 December 2011
Executive
A Baum 600,000 475,000
30. SUBSEQUENT EVENTS
On 4 February 2013, ThinkSmart announced that it had extended its contractual relationship with JB Hi-Fi Limited to the
second half of 2015. As part of the agreement, ThinkSmart and JB Hi-Fi agreed to offer ThinkSmart's payment plan product,
Fido, to JB Hi-Fi's customers throughout the term of the new agreement.
31. EARNINGS PER SHARE
2012
$000
2011
$000
(Loss)/profit after tax from continuing operations attributable to ordinary
shareholders (basic and diluted) (1,441) 6,798
2012
Number
2011
Number
Weighted average number of ordinary shares (basic and diluted) 151,546,324 129,921,171
2012 2011
Earnings per share
Basic (loss)/earnings per share (cents) (0.95) 5.23
Diluted (loss)/earnings per share (cents) (0.95) 5.23
At 31 December 2012 6,366,667 options (2011: 7,166,667) were excluded from the diluted weighted average number of
ordinary shares calculation as their effect would have been anti-dilutive.
For
per
sona
l use
onl
y

NOTES TO THE FINANCIAL STATEMENTS
ANNUAL REPORT 2012 101
32. PARENT ENTITY DISCLOSURES
As at, and throughout, the financial year ending 31 December 2012, the parent entity of the Group was ThinkSmart Limited.
2012
$000
2011
$000
Result of parent entity
(Loss)/profit for the period (186) 649
Other comprehensive income - (26)
Total comprehensive income for the period (186) 623
Financial position of parent entity at year end
Current assets 574 693
Total assets 41,878 35,045
Current liabilities 337 1,707
Total liabilities 345 1,733
Total equity of the parent entity comprising of:
Share capital 48,289 39,664
Share-based payment reserve 526 744
Retained earnings (7,282) (7,096)
Total equity 41,533 33,312
Parent entity contingencies
The parent entity has provided a commitment to continue its financial support of RentSmart Unit Trust, ThinkSmart Europe
Ltd and RentSmart Ltd to enable the subsidiaries to pay their debts as and when they fall due. The Company will not call for
the repayment of its loan until RentSmart Unit Trust, ThinkSmart Europe Ltd and RentSmart Ltd are in a financial position to
make such a payment without affecting its operational capabilities.
The parent entity has issued an unlimited parental guarantee in favour of its UK clearing bank to guarantee the obligations of
RentSmart Limited with respect to its Direct Debit and corporate credit card facilities.
The Directors are of the opinion that provisions are not required in respect of these matters, as it is not probable that a future
sacrifice of economic benefits will be required or the amount is not capable of reliable measurement.
For
per
sona
l use
onl
y

102
Report on the financial report
We have audited the accompanying financial report of ThinkSmart Limited (the Company), which comprises the consolidated
statement of financial position as at 31 December 2012, the consolidated income statement, consolidated statement of
comprehensive income, consolidated statement of changes in equity and consolidated statement of cash flows for the year
ended on that date, notes 1 to 32 comprising a summary of significant accounting policies and other explanatory information
and the directors’ declaration of the Group comprising the company and the entities it controlled at the year’s end or from
time to time during the financial year.
Directors’ responsibility for the financial report
The directors of the company are responsible for the preparation of the financial report that gives a true and fair view in
accordance with Australian Accounting Standards and the Corporations Act 2001 and for such internal control as the
directors determine is necessary to enable the preparation of the financial report that is free from material misstatement
whether due to fraud or error. In note 2, the directors also state, in accordance with Australian Accounting Standard AASB
101 Presentation of Financial Statements, that the financial statements of the Group comply with International Financial
Reporting Standards.
Auditor’s responsibility
Our responsibility is to express an opinion on the financial report based on our audit. We conducted our audit in accordance
with Australian Auditing Standards. These Auditing Standards require that we comply with relevant ethical requirements
relating to audit engagements and plan and perform the audit to obtain reasonable assurance whether the financial report is
free from material misstatement.
An audit involves performing procedures to obtain audit evidence about the amounts and disclosures in the financial report.
The procedures selected depend on the auditor’s judgement, including the assessment of the risks of material misstatement
of the financial report, whether due to fraud or error. In making those risk assessments, the auditor considers internal control
relevant to the entity’s preparation of the financial report that gives a true and fair view in order to design audit procedures
that are appropriate in the circumstances, but not for the purpose of expressing an opinion on the effectiveness of the entity’s
internal control. An audit also includes evaluating the appropriateness of accounting policies used and the reasonableness of
accounting estimates made by the directors, as well as evaluating the overall presentation of the financial report.
We performed the procedures to assess whether in all material respects the financial report presents fairly, in accordance
with the Corporations Act 2001 and Australian Accounting Standards, a true and fair view which is consistent with our
understanding of the financial position and of their performance.
We believe that the audit evidence we have obtained is sufficient and appropriate to provide a basis for our audit opinion.
INDEPENDENT AUDITOR’S REPORT TO THE MEMBERS OF THINKSMART LIMITED
For
per
sona
l use
onl
y
ANNUAL REPORT 2012 103
Independence
In conducting our audit, we have complied with the independence requirements of the Corporations Act 2001.
Auditor’s opinion
In our opinion:
(a) the financial report of the Group is in accordance with the Corporations Act 2001, including:
(i) giving a true and fair view of the Group’s financial position as at 31 December 2012 and of its
performance for the year ended on that date; and
(ii) complying with Australian Accounting Standards and the Corporations Regulations 2001.
(b) the financial report also complies with International Financial Reporting Standards as disclosed in note 2.
Report on the remuneration report
We have audited the Remuneration Report included on pages 16 to 28 of the directors’ report for the year ended 31
December 2012. The directors of the company are responsible for the preparation and presentation of the remuneration
report in accordance with Section 300A of the Corporations Act 2001. Our responsibility is to express an opinion on the
remuneration report, based on our audit conducted in accordance with auditing standards.
Auditor’s opinion
In our opinion, the remuneration report of ThinkSmart Limited for the year ended 31 December 2012, complies with Section
300A of the Corporations Act 2001.
KPMG
Matthew Beevers
Partner
Perth
19 February 2013
INDEPENDENT AUDITOR’S REPORTTO THE MEMBERS OF THINKSMART LIMITED
KPMG
Matthew Beevers
KPMG
Matthew Beevers
For
per
sona
l use
onl
y

104
The shareholder information set out below was applicable as at 28 March 2013.
Distribution of Equity Security
Number of equity security holders
Ordinary Shares Options
1 – 1,000 103 -
1,001 – 5,000 623 -
5,001 – 10,000 480 -
10,001 – 100,000 1,032 3
100,001 and over 155 8
There were 230 holders of less than a marketable parcel of Ordinary Shares.
Equity Security Holders
Twenty largest quoted equity security holders
The names of the 20 largest holders of quoted equity securities are listed below:
Ordinary Shares
Name Number held
Percentage of issued
shares (%)
UBS Wealth Management Australia Nominees Pty Ltd 29,574,636 18.57
UBS Nominees Pty Ltd 7,174,265 4.50
JAWP Pty Ltd 5,750,000 3.61
Wroxby Pty Ltd 5,561,172 3.49
Kemast Investments Pty Ltd 4,752,000 2.98
JP Morgan Nominees Australia Limited <Cash Income A/C> 4,629,134 2.91
HSBC Custody Nominees (Australia) Limited 3,837,290 2.41
Phoenix Properties International Pty Ltd 3,600,000 2.26
Longfellow Nominees Pty Ltd 3,303,167 2.07
Mr Noel D’Souza 3,105,512 1.95
ThinkSmart LTI Pty Ltd 3,033,333 1.90
M F Custodians Ltd 2,500,000 1.57
Wulura Investments Pty Ltd <PJT Gammell Super Fund A/C> 2,400,262 1.51
Darju Pty Ltd 2,107,239 1.32
JP Morgan Nominees Australia Limited 2,094,881 1.32
Wulura Investments Pty Ltd 1,566,948 0.98
Manfam Pty Ltd 1,480,334 0.93
Mrs Kelyna Margaret Penglis 916,800 0.58
Mr Victor John Plummer 721,000 0.45
Incani & Papadopoulos Super Pty Ltd 720,000 0.45
Total 88,827,973 55.76
SHAREHOLDER INFORMATIONF
or p
erso
nal u
se o
nly

ANNUAL REPORT 2012 105
Unquoted Equity Securities
Number on issue Number of holders
Options issued under the ESOP to take up ordinary shares 6,366,667 11
The Company has no other unquoted equity securities.
Substantial Holders
Substantial holders in the Company are set out below:
Include those above 5%
Number of ordinary
shares
Percentage
%
UBS Wealth Management Australia Nominees Pty Ltd 29,574,636 18.57
Voting Rights
The voting rights attaching to equity securities are set out below:
(a) Ordinary shares
On a show of hands, every holder of Ordinary Shares present in the meeting in person or by proxy is entitled to one vote, and
upon a poll each Share is entitled to one vote.
(b) Loan-Funded Ordinary Shares issued under the Long-Term Incentive Plan
Shares under the plan rank equally in all respects with Ordinary Shares, including voting rights.
(c) Options
There are no voting rights attached to the options.
SHAREHOLDER INFORMATIONF
or p
erso
nal u
se o
nly

106
CORPORATE INFORMATION
ABN 24 092 319 698
DIRECTORSN R Montarello (Chairman and Chief Executive Officer)
D Griffiths (Deputy Chairman)
S Penglis
F de Vicente
N Fox
COMPANY SECRETARYA Stevens
REGISTERED OFFICELevel 1, The West Centre
1260 Hay Street
West Perth WA 6005
Australia
PRINCIPAL PLACE OF BUSINESSLevel 1, The West Centre
1260 Hay Street
West Perth WA 6005
Australia
Phone: +61 8 9463 7500
SHARE REGISTER Computershare Investor Services Pty Limited
Level 2, 45 St Georges Terrace
Perth WA 6000
Australia
Phone: 1300 850 505
ThinkSmart Limited shares are listed on the Australian
Securities Exchange (ASX code: TSM)
SOLICITORSHerbert Smith Freehills
250 St Georges Terrace
Perth WA 6000
Australia
AUDITORSKPMG
235 St Georges Terrace
Perth WA 6000
Australia
BANKERSWestpac Banking Corporation
109 St Georges Terrace
Perth WA 6000
Australia
For
per
sona
l use
onl
y

Level 1, The West Centre 1260 Hay Street
West Perth WA 6005Australia
For
per
sona
l use
onl
y

THINKSMART LIMITED ABN 24 092 319 698
NOTICE OF ANNUAL GENERAL MEETING Notice is hereby given that the 2013 Annual General Meeting of ThinkSmart Limited (the “Company”) will be held at Level 36, 250 St Georges Terrace, Perth, Western Australia on Thursday, 23 May 2013 at 2.30pm (WST). An Explanatory Statement containing information in relation to each of the resolutions to be put to shareholders accompanies this Notice of Meeting. The 2012 Annual Report is available on the Company’s website: www.thinksmartworld.com AGENDA ITEMS ORDINARY BUSINESS
Financial Reporting
To receive and consider the financial report of the Company and the consolidated entity and the reports of the directors and the auditors for the financial year ended 31 December 2012.
There is no vote on this item.
Resolution 1 – Remuneration Report
To consider and, if thought fit, pass the following resolution as an ordinary resolution:
“That the Remuneration Report contained within the Company’s financial report for the year ended 31 December 2012 be adopted.”
This resolution is advisory only and does not bind the directors or the Company.
Voting Exclusion Statement
The Company will disregard any votes cast on Resolution 1 (in any capacity) by or on behalf of a member of the Company’s key management personnel (“KMP”), details of whose remuneration is included in the Remuneration Report, or their closely related parties (such as close family members and any companies the person controls).
However, the Company need not disregard a vote cast on Resolution 1 by a member of the KMP or their closely related parties as a proxy if the vote is not cast on behalf of a member of the KMP or their closely related parties and either:
the voter is appointed as a proxy by writing that specifies how the proxy is to vote on Resolution 1; or
the proxy is the Chairman of the Meeting and the appointment expressly authorises the Chairman to exercise the proxy.
Resolution 2 – Retirement by Rotation and Re-election of Director – Mr Fernando de Vicente
To consider and, if thought fit, pass the following resolution as an ordinary resolution: “That Mr Fernando de Vicente, being a director of the Company who retires by rotation under rule 8.1(e) of the Company’s constitution, and being eligible, is re-elected as a director of the Company.”
SPECIAL BUSINESS
Resolution 3 – Approval of Participation by Mr Ned Montarello in the Long Term Incentive Plan
To consider and, if thought fit, pass the following resolution as an ordinary resolution:
“That, for the purposes of Listing Rule 10.14 and for all other purposes, the issue of shares to Mr Ned Montarello under the existing Long Term Incentive Plan and on the terms and conditions described in the Explanatory Statement accompanying this Notice of Meeting be approved.”
For
per
sona
l use
onl
y
Voting Exclusion Statement
The Company will disregard any votes cast on Resolution 3:
by a director of the Company, except those ineligible to participate in any employee incentive scheme of the Company, and any of their associates; and
as proxy by a member of the KMP or their closely related parties.
However, the Company need not disregard a vote if:
it is cast by a person as proxy for a person entitled to vote, in accordance with a direction on the Proxy Form; or
it is cast by the Chairman of the Meeting as proxy for a person who is entitled to vote and the appointment expressly authorises the Chairman to exercise the proxy.
ENTITLEMENT TO VOTE
It has been determined that under regulation 7.11.37 of the Corporations Regulations 2001 (Cth), for the purposes of the Annual General Meeting, shares will be taken to be held by the persons who are the registered holders at 5:00pm (WST) on Tuesday, 21 May 2013. Accordingly, share transfers registered after that time will be disregarded in determining entitlements to attend and vote at the Meeting.
PROXIES
A shareholder entitled to attend and vote has a right to appoint a proxy to attend and vote instead of the shareholder. A proxy need not be a shareholder and can be either an individual or a body corporate. If a shareholder appoints a body corporate as a proxy, that body corporate will need to ensure that it:
appoints an individual as its corporate representative to exercise its powers at the Meeting, in accordance with section 250D of the Corporations Act; and
provides satisfactory evidence of the appointment of its corporate representative at the Meeting.
If such evidence is not received at the Meeting, then the body corporate (through its representative) will not be permitted to act as a proxy.
Members of the KMP (which includes each of the directors and the company secretary) will not be able to vote as proxy on Resolutions 1 or 3 unless shareholders direct them how to vote. If a shareholder intends to appoint a member of the KMP (such as one of the directors or the company secretary) as their proxy, they should ensure that they direct that person how to vote on Resolutions 1 and 3.
As a member of the KMP, the Chairman of the Meeting will not be permitted to vote undirected proxies on Resolutions 1 and 3. If a shareholder intends to appoint the Chairman as their proxy in relation to Resolutions 1 and 3, or the Chairman will be appointed as their proxy by default, the shareholder can direct the Chairman how to vote by either marking the boxes for each of Resolutions 1 and 3 (for example, if the shareholder wishes to vote ‘for’, ‘against’ or to ‘abstain’ from voting), or by marking as indicated on the Proxy Form (in which case the Chairman will vote in favour of Resolutions 1 and 3).
A shareholder that is entitled to cast two or more votes may appoint two proxies and may specify the proportion or number of votes each proxy is appointed to exercise. If no proportion or number is specified, each proxy may exercise half of the shareholder’s votes.
A Proxy Form accompanies this Notice and to be effective must be received:
by post to: Computershare Investor
Services Pty Limited GPO Box 242 Melbourne VIC 3001
in person at: Computershare Investor Services Pty Limited
Level 2, 45 St Georges Terrace Perth WA 6000
by facsimile on: (+61 3) 9473 2555
by no later than 2:30pm (WST) on Tuesday, 21 May 2013. By order of the Board Alistair Stevens Company Secretary Date: 17 April 2013
For
per
sona
l use
onl
y

EXPLANATORY STATEMENT
This Explanatory Statement is intended to provide shareholders with sufficient information to assess the merits of the accompanying Notice of Meeting. The directors recommend shareholders read this Explanatory Statement in full before making any decision in relation to the Resolutions. The following information should be noted in respect of the various matters contained in the accompanying Notice of Meeting:
Financial Statement and Reporting
The Corporations Act 2001 (Cth) (“Corporations Act”) requires: The reports of the directors and auditors; and The annual financial report, including the financial
statements of the Company for the year ended 31 December 2012,
to be laid before the Annual General Meeting. Neither the Corporations Act nor the constitution requires a vote of shareholders on the reports or statements. However, shareholders will be given reasonable opportunity to raise questions or make comments on the financial affairs of the Company at the Annual General Meeting. Also, a reasonable opportunity will be given to members as a whole at the Meeting to ask the Company’s auditor questions relevant to the conduct of the audit, the preparation and content of the auditor’s report, the accounting policies adopted by the Company in relation to the preparation of the financial statements and the independence of the auditor in relation to the conduct of the audit.
Resolution 1 – Remuneration Report
In accordance with section 250R(2) of the Corporations Act, the Remuneration Report for the financial year ended 31 December 2012 is put to shareholders for adoption. The vote on this resolution is advisory only and does not bind the directors or the Company. However, the Board will take the discussion on this Resolution and the outcome of the vote into account when considering the Company’s remuneration policy. In addition, shareholders will be given a reasonable opportunity to ask questions about, and make comments on, the Remuneration Report at the Annual General Meeting. As a result of amendments to the Corporations Act known generally as the ‘two strikes rule’, shareholders should note that if 25 per cent or more of the votes cast on this Resolution are voted against the Resolution (constituting a ‘first strike’), a resolution on whether to hold a further Meeting to spill the Board (a ‘spill resolution’) would be put to shareholders if a ‘second strike’ occurs at the 2014 Annual General Meeting. This spill resolution would be included in the 2014 Notice of Annual General Meeting. The Chairman intends to vote all available proxies in favour of Resolution 1.
Resolution 2 – Re-election of Director
The Company’s constitution requires that, after excluding managing directors and directors standing for election after being appointed under rule 8.1(b), one third of the remaining directors must retire from office. Mr Fernando de Vicente, being a director of the Company, retires in accordance with rules 8.1(d) and 8.1(e) of the Company’s constitution, with effect from the end of the Meeting and offers himself for re-election. A brief description of the candidate follows: Fernando de Vicente B. Econ and MBA Bus Mr de Vicente is a citizen of Spain who joined the Board on 7 April 2010. Mr de Vicente has a Degree in Economics (International Development) from the University Complutense in Madrid, and an Executive MBA from IESE Business School in Madrid. Mr de Vicente spent nine years at DSG International, one of Europe’s largest electrical retailers, where he most recently held the role of International Managing Director, with responsibility for DSG’s Central & Southern European operations, a A$3 billion business with 350 stores across six countries. Mr de Vicente started his career with DSG as Finance Director for PC City Spain, and became the MD for Spain in 2003. In 2006 he was promoted to Regional Managing Director for South-East Europe based in Greece, before assuming the role of International Managing Director in 2008. In March 2010, Mr de Vicente left DSG to become the Executive Chairman of BodyBell Group, one of Spain’s largest speciality retailers. On 15 February 2012, Mr de Vicente was appointed Non-Executive Director of Levantina, a multinational company dealing in natural stone products. The directors consider that Mr de Vicente brings considerable commercial experience to the Board and will continue to be a key contributor to the Company seeking to continue its product and channel diversification strategy. The directors (other than Mr de Vicente) recommend that shareholders vote in favour of Resolution 2. Mr de Vicente, who has an interest in the outcome of Resolution 2, declines to make a recommendation.
For
per
sona
l use
onl
y

Resolution 3 – Approval of Participation by Mr Ned Montarello in the Long Term Incentive Plan
The terms and conditions of the Long Term Incentive Plan were approved at the 2012 Annual General Meeting.
Resolution 3 seeks shareholder approval for the issue of ordinary shares (“Plan Shares”) to Mr Ned Montarello, the Company’s Executive Chairman and Chief Executive Officer, under the Long Term Incentive Plan, and otherwise on the terms and conditions set out in this Explanatory Statement.
The Company’s remuneration policy is to ensure that executive remuneration is competitive in attracting, motivating and retaining executives of high calibre and properly reflects the duties and responsibilities of each relevant executive. The remuneration structure used by the Company to achieve these objectives includes the combination of fixed annual remuneration and performance related remuneration – including participation in employee incentive schemes such as the Long Term Incentive Plan. The Board considers it appropriate to include the issue of Plan Shares in Mr Montarello’s remuneration package for the 2013 financial year. ASX requires, under Listing Rule 10.14, that shareholders approve the grant of securities to a director under an employee share scheme. Accordingly, shareholder approval is sought for the issue of Plan Shares under the Long Term Incentive Plan to the trustee of the Plan (“Plan Trustee”) to hold on behalf of Mr Montarello as set out below. Number of Plan Shares As part of Mr Montarello’s remuneration for the Company’s 2013 financial year, the Plan Trustee will be issued 1 million Plan Shares to hold on behalf of Mr Montarello. The Plan Shares will be held subject to the terms and conditions of the Long Term Incentive Plan, a full copy of which is available to shareholders on request from the Company Secretary. Performance conditions attached to Plan Shares Mr Montarello’s Plan Shares will also be issued subject to the performance conditions outlined below. First Condition: One-quarter of Mr Montarello’s Plan Shares will vest at the end of the 3 years from the date they are issued (“Performance Period”) if at any time during the Performance Period the volume-weighted average price of the Company’s Shares on ASX (“VWAP”) over any consecutive 30 trading days is or is in excess of 40% greater than the VWAP of the Company’s Shares on ASX over the 30 trading days prior to the date of issue (“Initial VWAP”). Second Condition: A further quarter of Mr Montarello’s Plan Shares will vest at the end of the Performance Period if at any time during the Performance Period the
VWAP over any consecutive 30 trading days is or is in excess of 80% greater than the Initial VWAP. Third Condition: The remaining half of Mr Montarello’s Plan Shares will vest at the end of the Performance Period if at any time during the Performance Period the VWAP over any consecutive 30 trading days is or is in excess of 120% greater than the Initial VWAP. Regulatory information ASX Listing Rule 10.15 requires the following information regarding the Long Term Incentive Plan to be included in this Explanatory Statement: Subject to shareholder approval being obtained, the
number of Plan Shares that the Company may issue to the Plan Trustee on behalf of Mr Montarello will be 1 million.
No consideration is payable by Mr Montarello at the time of issue of the Plan Shares. However, the deemed acquisition price of the Plan Shares (which will be the VWAP of the Company’s shares on ASX during the 5 trading days up to and including the date on which the shares are issued to the Plan Trustee to hold on behalf of Mr Montarello) will be funded by a non-recourse, interest free loan from the Company which will be repayable on the earlier of 5 years after the Plan Shares are issued and the date on which they are disposed of by Mr Montarello.
In accordance with approval sought and obtained at the 2012 Annual General Meeting, 1 million ordinary shares in the Company were issued to the Plan Trustee to hold on behalf of Mr Montarello under the Long Term Incentive Plan, with vesting of the shares subject to satisfaction of certain performance conditions. The deemed acquisition price of the shares was $0.1923, funded by a non-recourse, interest free loan under the terms of the Long Term Incentive Plan. As at the date of this Explanatory Statement, none of the shares have vested.
Mr Montarello is the only director who is eligible to participate in the Long Term Incentive Plan. Other executives and employees determined by the Board will also be eligible to participate in the Long Term Incentive Plan. Non-executive directors will not be entitled to participate in the Long Term Incentive Plan.
The Company will provide a non-recourse, interest free loan to fund the purchase price of the Plan Shares. The loan will be non-recourse in that Mr Montarello’s liability will be limited at all times to the lesser of the outstanding loan value and the value of the Plan Shares. In the event that the performance conditions are not satisfied, Mr Montarello’s Plan Shares will be acquired by the Company and the loan offset against the value of the Plan Shares. In that case, Mr Montarello would receive no value from the unvested Plan Shares.
The Company will issue the Plan Shares to the Plan Trustee to hold in trust for Mr Montarello as soon as practicable following the Annual General Meeting and no later than 3 months after the Meeting.
The Board, with Mr Montarello abstaining, recommends that shareholders vote in favour of Resolution 3. The Chairman intends to vote all available proxies in favour of Resolution 3.
For
per
sona
l use
onl
y

SRN/HIN: I9999999999
T 000001 000 TSM
MR SAM SAMPLEFLAT 123123 SAMPLE STREETTHE SAMPLE HILLSAMPLE ESTATESAMPLEVILLE VIC 3030
Lodge your vote:
By Mail:Computershare Investor Services Pty LimitedGPO Box 242 MelbourneVictoria 3001 Australia
Alternatively you can fax your form to(within Australia) 1800 783 447(outside Australia) +61 3 9473 2555
For Intermediary Online subscribers only(custodians) www.intermediaryonline.com
For all enquiries call:(within Australia) 1300 850 505(outside Australia) +61 3 9415 4000
Proxy Form
For your vote to be effective it must be received by 2:30pm (WST) Tuesday 21 May 2013
How to Vote on Items of BusinessAll your securities will be voted in accordance with your directions.
Appointment of ProxyVoting 100% of your holding: Direct your proxy how to vote bymarking one of the boxes opposite each item of business. If you donot mark a box your proxy may vote as they choose. If you markmore than one box on an item your vote will be invalid on that item.
Voting a portion of your holding: Indicate a portion of yourvoting rights by inserting the percentage or number of securitiesyou wish to vote in the For, Against or Abstain box or boxes. Thesum of the votes cast must not exceed your voting entitlement or100%.
Appointing a second proxy: You are entitled to appoint up to twoproxies to attend the meeting and vote on a poll. If you appoint twoproxies you must specify the percentage of votes or number ofsecurities for each proxy, otherwise each proxy may exercise half ofthe votes. When appointing a second proxy write both names andthe percentage of votes or number of securities for each in Step 1overleaf.
Signing InstructionsIndividual: Where the holding is in one name, the securityholdermust sign.Joint Holding: Where the holding is in more than one name, all ofthe securityholders should sign.Power of Attorney: If you have not already lodged the Power ofAttorney with the registry, please attach a certified photocopy of thePower of Attorney to this form when you return it.Companies: Where the company has a Sole Director who is also theSole Company Secretary, this form must be signed by that person. Ifthe company (pursuant to section 204A of the Corporations Act2001) does not have a Company Secretary, a Sole Director can alsosign alone. Otherwise this form must be signed by a Director jointlywith either another Director or a Company Secretary. Please sign inthe appropriate place to indicate the office held. Delete titles asapplicable.
Attending the MeetingBring this form to assist registration. If a representative of a corporatesecurityholder or proxy is to attend the meeting you will need toprovide the appropriate “Certificate of Appointment of CorporateRepresentative” prior to admission. A form of the certificate may beobtained from Computershare or online at www.investorcentre.comunder the information tab, "Downloadable Forms".
Comments & Questions: If you have any comments or questionsfor the company, please write them on a separate sheet of paper andreturn with this form.
Turn over to complete the form
A proxy need not be a securityholder of the Company.
ThinkSmart LimitedABN 24 092 319 698
www.investorcentre.comUpdate your securityholder information, 24 hours a day, 7 days a week:
Your secure access information is:
PLEASE NOTE: For security reasons it is important that you keep yourSRN/HIN confidential.
www.thinksmartworld.comView the Annual Report:
Samples/000001/000001
*L000001*
For
per
sona
l use
onl
y

I 9999999999
I/We acknowledge that the Chairman of the Meeting may exercise my/our proxy even if the Chairman has an interest in the outcome ofResolutions 1 and 3 and that votes cast by the Chairman, other than as proxy holder, would be disregarded because of that interest.
Important for Resolutions 1 and 3: If the Chairman of the Meeting is (or becomes) your proxy you can direct the Chairman how to vote onResolutions 1 and 3 by either marking the appropriate box in Step 2 below, or by marking the box in this section (in which case the Chairman ofthe Meeting will vote in favour of Resolutions 1 and 3). If you do not mark the box in this section and you have not otherwise directed your proxyhow to vote on Resolutions 1 and 3, the Chairman of the Meeting will not cast your votes on Resolutions 1 and 3 and your votes will not becounted in computing the required majority if a poll is called on these Resolutions.
Change of address. If incorrect,mark this box and make thecorrection in the space to the left.Securityholders sponsored by abroker (reference numbercommences with ’X’) should adviseyour broker of any changes.
Proxy Form Please mark to indicate your directions
Appoint a Proxy to Vote on Your BehalfI/We being a member/s of ThinkSmart Limited hereby appoint
STEP 1
the ChairmanOR
PLEASE NOTE: Leave this box blank ifyou have selected the Chairman of theMeeting. Do not insert your own name(s).
or failing the individual or body corporate named, or if no individual or body corporate is named, the Chairman of the Meeting, as my/our proxyto act generally at the Meeting on my/our behalf and to vote in accordance with the following directions (or if no directions have been given, andto the extent permitted by law, as the proxy sees fit) at the Annual General Meeting of ThinkSmart Limited to be held at Level 36, 250 StGeorge's Terrace, Perth, Western Australia on Thursday 23 May 2013 at 2:30pm (WST) and at any adjournment or postponement of thatMeeting. I/we acknowledge that the Chairman of the Meeting intends to vote undirected proxies in favour of Resolutions 1 and 3.
Express authorisation of the Chairman to exercise undirected proxies on remuneration related resolutions: Where I/we have appointedthe Chairman of the Meeting as my/our proxy (or the Chairman becomes my/our proxy by default), I/we expressly authorise the Chairman toexercise my/our proxy on Resolutions 1 and 3 (except where I/we have indicated a different voting intention in Step 2 below) even thoughResolutions 1 and 3 are connected directly or indirectly with the remuneration of a member of key management personnel, which includes theChairman.Important Note: For Resolutions 1 and 3, this express authority is also subject to you marking the box in the section immediately below.
STEP 2 Items of Business PLEASE NOTE: If you mark the Abstain box for an item, you are directing your proxy not to vote on yourbehalf on a show of hands or a poll and your votes will not be counted in computing the required majority.
SIGN Signature of Securityholder(s) This section must be completed.Individual or Securityholder 1 Securityholder 2 Securityholder 3
Sole Director and Sole Company Secretary Director Director/Company Secretary
ContactName
ContactDaytimeTelephone Date
The Chairman of the Meeting intends to vote all available proxies in favour of each item of business.
of the Meeting
I ND
T S M 9 9 9 9 9 9 A
MR SAM SAMPLEFLAT 123123 SAMPLE STREETTHE SAMPLE HILLSAMPLE ESTATESAMPLEVILLE VIC 3030
/ /
XX
ForAgainst
Abstain
Resolution 1 Remuneration Report
Resolution 2 Retirement by Rotation and Re-election of Director - Mr Fernando de Vicente
Resolution 3 Approval of Participation by Mr Ned Montarello in the Long Term Incentive Plan
For
per
sona
l use
onl
y