16. new england - department of linguistics · 16. new england 1 2 3 5 6 7 figure 16.1. the regions...
TRANSCRIPT

Chapter 11 presented a brief characterization of Eastern New England [ENE] as a dialect area centered on the city of Boston. Its defining features were displayed in Maps 11.7 and 11.12. Eastern New England was defined as the region of r-vocal-ization where short-a is split into /æ/ and /ah/, as opposed to the New York City area where short-a is split into /æ/ and /æh/.1
Chapter 14 presented a brief characterization of Western New England [WNE] in Map 14.12. WNE appeared as an extension of the ED measure of the Northern Cities Shift, but the WNE system is not driven by the general raising of /æ/ and lies outside of the EQ isogloss. The WNE system appears as a possible originat-ing matrix of the NCS as a whole.
The maps in this chapter will show a New England divided into four quad-rants by two intersecting isoglosses: a north–south split formed principally by the /o/ ~ /oh/ isogloss and an east–west split formed by r-vocalization. Northeastern New England [NENE] is the r-less area with the low back merger, a sizeable area centered about Boston and extending into New Hampshire and Maine. A smaller southeastern area [SENE] is also r-less, without the low back merger: it is cen-tered on Providence and Narragansett Bay. Western New England is about evenly divided into an r-ful northwest region with the low back merger [NWNE] in-cluding the major cities of Vermont, and a more heavily populated southwestern quadrant [SWNE], a second r-ful area with /o/ and /oh/ distinct which is centered about Hartford in western Connecticut and Springfield in western Massachusetts. Other features of the vowel system coincide with these criteria and reinforce the four-fold division.
16.1. New England in earlier Atlas studies
Chapter 2 of Carver (1987) sums up the evidence of LANE and Kurath (1949) on the linguistic geography of New England. Though LANE set up seven re-gions largely on the basis of settlement history, Carver finds the evidence scanty: “None have more than a handful of representative isoglosses and most of these have completely faded from use”. (p. 27). The lexical evidence available to Ku-rath (1949) led him to reduce these regions to three: Northeastern (Eastern New England north of Boston), Southeastern (the Boston area and the Narragansett Bay area centered on Providence) and Southwestern (the Connecticut Valley area centered on Hartford and extending northward to western Massachusetts). The DARE evidence was based on 45 areal isoglosses, of which only 20 were found in LANE maps. The new dialect divisions based on DARE data are somewhat different from Kurath (1949), as shown in Figure 16.1.
The two maps agree on the number of dialect areas, but differ in what those areas are. The essential difference is that Kurath groups Boston and Providence together, opposing them to New Hampshire and Maine, while the DARE evi-dence makes Boston the center of Northeastern New England, and segregates Providence quite sharply. In the revised view based on DARE data, the major dialect area of Northeastern New England includes southern Maine, New Hamp-shire, Vermont east of the Green Mountains, and all but the westernmost part of Massachusetts. The Narragansett Bay area surrounding Providence is distinct
16. New England
1
2
35
6
7
Figure 16.1. The regions of New England
(a) Regions based on LANE data (Kurath 1949, Fig. 3): 1 Northeastern New England; 2 Southeastern New England; 3 Southwestern New England; 5 The Hudson Valley; 6 Metropolitan New York
NorthwesternNew England
WesternNew England
SouthwesternNew England
Narragansett Bay Area
EasternNew England
UpperMaine
1 The Eastern New England split of /æ/ and /æh/ is more fragmentary and less consistent than the New York City split. In the general treatment of U.S. dialects in Chapter 11, “split short-a” does not include New England.
(b) Regions based on 45 DARE isoglosses (Carver 1987, Figs. 2.4, 5)
224
from Massachusetts, expanding only a little ways beyond Rhode Island to east and west. Southwestern New England is more limited in its northward extension, including only a small part of southwestern Massachusetts. The evidence to be presented below agrees with Figure 16.2, the DARE version.
16.2. Vocalization of /r/
Chapter 7 found r-vocalization in the Eastern United States in three distinct ar-eas: the South, New York City, and ENE. All three areas participated in the trend toward replacement of vocalized r with consonantal r that began after the end of World War II. As Chapter 7 showed, the shift towards r-fulness took a different form in the South than in the North. While the South shows an overall shift to consistent r-pronunciation, the change in the North has been essentially a change in the normative attitude towards /r/, so that the shift takes place primarily in careful (superposed) varieties of speech. Map 16.1 presents this situation in ENE, where a full range of r-vocalization is found, from 0 to 100 percent. Even in the Telsur interviews, which are relatively formal, the majority of speakers maintain a level of r-vocalization above 75 percent. It is only in New Hampshire where vocalized /r/ falls to very low levels. If it were not for the very close association of New Hampshire with the rest of Eastern New England on other variables, the light red isogloss might have to exclude the two New Hampshire cities.
The light red isogloss outlines the area of r-vocalization, as in Map 11.7. The light blue isogloss is the area with moderate approximation of /e/ and /o/ on the front–back dimension: that is, the ED measure is between 375 and 450 Hz (Map 11.12).
The division between ENE and WNE on the basis of r-vocalization appears to be quite firm. The definition of ENE based on r-vocalization does not appear at first to be related to the definitions of the North, Canada, and the South in Chapter 11, which reflected active chain shifts in progress. However, the maps to follow will show that many of the characteristic features that sub-divide ENE lie within the subsystem of vowels before /r/, and the dynamics of this subsystem depend on whether or not /Vhr/ is merged with /Vh/. The major ENE cities, Boston and Providence, are the most consistent in r-vocalization. The consequences for the vowel system will be developed in the maps to follow.
Phonemic oppositions in New England
Chapter 2 showed that the initial position of North American English vowels maintained a distinction between the lower and upper mid–back rounded vowels /ohr/ and /çhr/ in hoarse ~ horse, mourning ~ morning, port ~ storm, etc. In Chapter 8, Map 8.2 displayed this nearly completed merger across the continent, with scattered remnants of this distinction in the South and a fairly strong concen-tration in New England. Map 16.2 gives a more detailed view of the situation in Eastern New England, using the same key as in Map 8.2. The blue symbols indi-cate speakers for whom the merger is complete. Although all of this area showed the distinction in the PEAS data of the 1940s, here the blue circles predominate in much of the region. Clearly different production of the two vowel classes is registered by the red stars; if the production seemed ʻclose ̓to the analyst, a red circle appears. Yellow circles are speakers who are intermediate in one respect or another.
The overall display shows that the distinction is maintained only in Eastern New England. In Western New England, there is only one speaker – an octoge-narian in Middlebury, Vermont – who makes a distinction: all the others have a total merger. There is also a clear indication of the weakening and disappear-
ance of this distinction in ENE. Map 16.2 follows the convention of ordering the speakers by age, with the oldest at upper left and the youngest at lower right. In Bangor, Portland, Manchester, and Worcester, there is some evidence of age-grading, with younger speakers losing the distinction. Boston and Providence are mixed, and do not show this pattern.
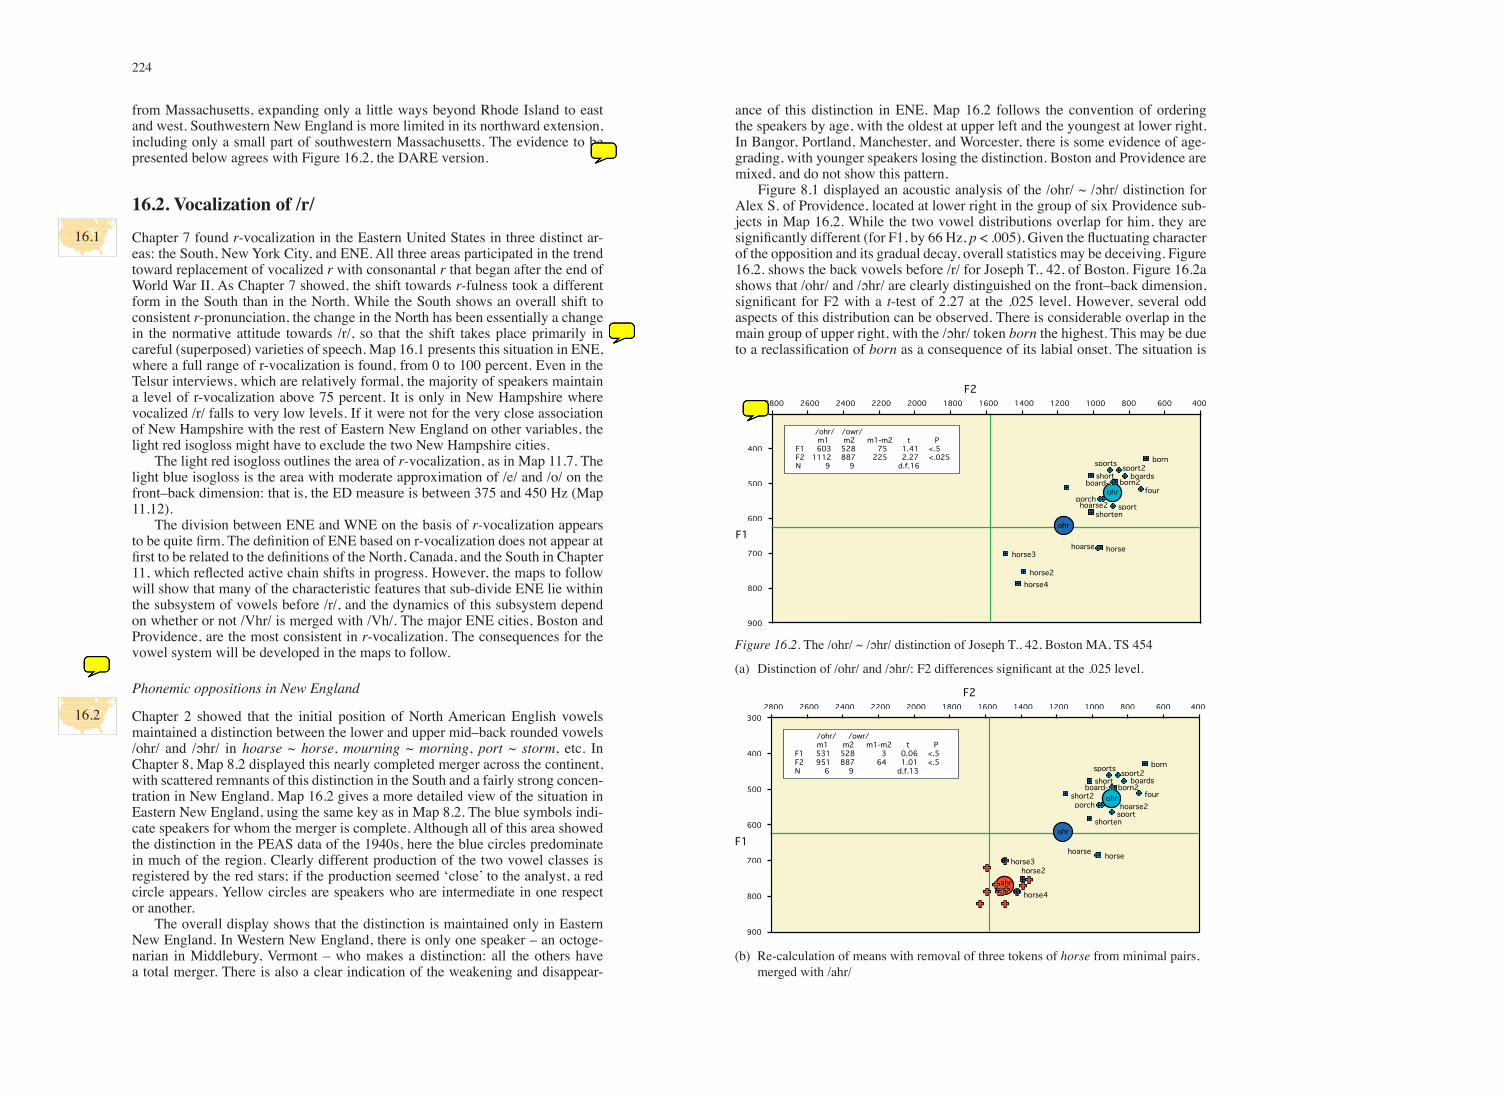
Figure 8.1 displayed an acoustic analysis of the /ohr/ ~ /çhr/ distinction for Alex S. of Providence, located at lower right in the group of six Providence sub-jects in Map 16.2. While the two vowel distributions overlap for him, they are significantly different (for F1, by 66 Hz, p < .005). Given the fluctuating character of the opposition and its gradual decay, overall statistics may be deceiving. Figure 16.2. shows the back vowels before /r/ for Joseph T., 42, of Boston. Figure 16.2a shows that /ohr/ and /çhr/ are clearly distinguished on the front–back dimension, significant for F2 with a t-test of 2.27 at the .025 level. However, several odd aspects of this distribution can be observed. There is considerable overlap in the main group of upper right, with the /çhr/ token born the highest. This may be due to a reclassification of born as a consequence of its labial onset. The situation is
Figure 16.2. The /ohr/ ~ /çhr/ distinction of Joseph T., 42, Boston MA, TS 454
(a) Distinction of /ohr/ and /çhr/: F2 differences significant at the .025 level.
(b) Re-calculation of means with removal of three tokens of horse from minimal pairs, merged with /ahr/
/ohr/ /owr/ m1 m2 m1-m2 t PF1 603 528 75 1.41 <.5F2 1112 887 225 2.27 <.025N 9 9 d.f.16
horse
horse4
horse3
horse2
born
born2short
short2
shortenhoarse2
hoarse
four
sport2
sportporch
boards
sports
board-
ohr
ohr
F2
F1
2800 2600 2400 2200 2000 1800 1600 1400 1200 1000 800 600300
400
500
600
700
800
900
400
horse
horse4
horse3horse2
born
born2short
short2
shorten
hoarse2
hoarse
four
sport2
sportporch
boardssports
board-ohr
ohr
ahr
/ohr/ /owr/ m1 m2 m1-m2 t PF1 531 528 3 0.06 <.5F2 951 887 64 1.01 <.5N 6 9 d.f.13
F2
F1
2800 2600 2400 2200 2000 1800 1600 1400 1200 1000 800 600 400300
400
500
600
700
800
900
16.1
16.2

225
ding Trenton
Passaic
Newark
Paterson
ranton
entown
Montreal
Burlington
Brick
Jersey Citry
NewHaven
Albany
Hartford
Springfield
NewBritain
New York City
Rutland
Middletown
Middlebury
Concord
Manchester
Worcester
Providence
Waterville
Portland
Boston
Bangor
% r-vocalization76-10051-7526-5011-251-100/o/ = /oh/ENEWNE
A defining feature of ENE is the vocalization of /r/ in fear, fair, car, card, board, etc. as shown by the pink isogloss. Although it is being replaced by consonantal /r/ in formal speech, ENE shows a high level of vocalization for most speakers. The weakening of this feature is most notable in New Hampshire and central Massachusetts; it is most consistent in Providence.
Map 16.1. r-vocalization in Eastern New England
ding Trenton
Passaic
Newark
Paterson
ranton
entown
Montreal
Burlington
Brick
Jersey Citry
NewHaven
Albany
Hartford
Springfield
NewBritain
New York City
Rutland
Middletown
Middlebury
Concord
Manchester
Worcester
Providence
Waterville
Portland
Boston
Bangor
close in productiondifferent in productionsame in production and perceptionotherEastern New EnglandWestern New England
The contrast between four and for, mourning and morning was once quite gen-eral in the North and ENE, but it survives now principally in ENE. The red stars designate the six speakers who show this relic distinction most clearly. The light blue symbols show what is now the prevailing situation for most speakers – these two word classes are exactly the same.
Map 16.2. The distinction between /ohr/ and /çhr/ in Eastern New England
Vocalization of /r/
226
even more difficult to resolve when we examine the tokens at lower left and right. While hoarse and horse are in identical position at lower right, at lower left there are three tokens of horse that are far removed from the hoarse2 token in the main distribution.
Adding /ahr/ to the display in Figure 16.2b clarifies the situation. The three tokens of horse at lower left have actually been merged with /ahr/: these are all taken from minimal pair tests, while the identical hoarse/horse tokens at lower left are elicited outside of the minimal pair framework. When the means are re-calculated without the horse2–4 tokens, the means of /ohr/ and /çhr/ are almost identical. This situation reverses that of Bill P. in Duncannon, PA, of LYS Figure 9.2, who all but merged /o/ and /oh/ in minimal pairs but maintained the distinc-tion clearly in spontaneous speech. Here the merger is characteristic of spontane-ous speech. When maximal attention to speech is stimulated by the minimal pair test, Joseph T. recollects that horse is different from hoarse. But he no longer has access to the original phonetic differentiation of /ohr/ and /çhr/ , and assigns /çhr/ to the next available vowel class, /ahr/.
16.3. The low back merger in Eastern New England
In the study of the low back merger in Chapter 9, a high concentration of merged tokens was found in Eastern New England, in agreement with previous studies. Map 16.3 shows the merger before nasals in Don and dawn in New England. The green symbols indicate complete merger of Don and dawn in production and perception. Their distribution follows the general low back merger isogloss, the oriented green line. Though there is a small amount of variation within the /o/ = /oh/ isogloss (eight of 35 speakers did not have a complete merger), there is only one green symbol outside of it: a 65 year old woman from Springfield, MA.
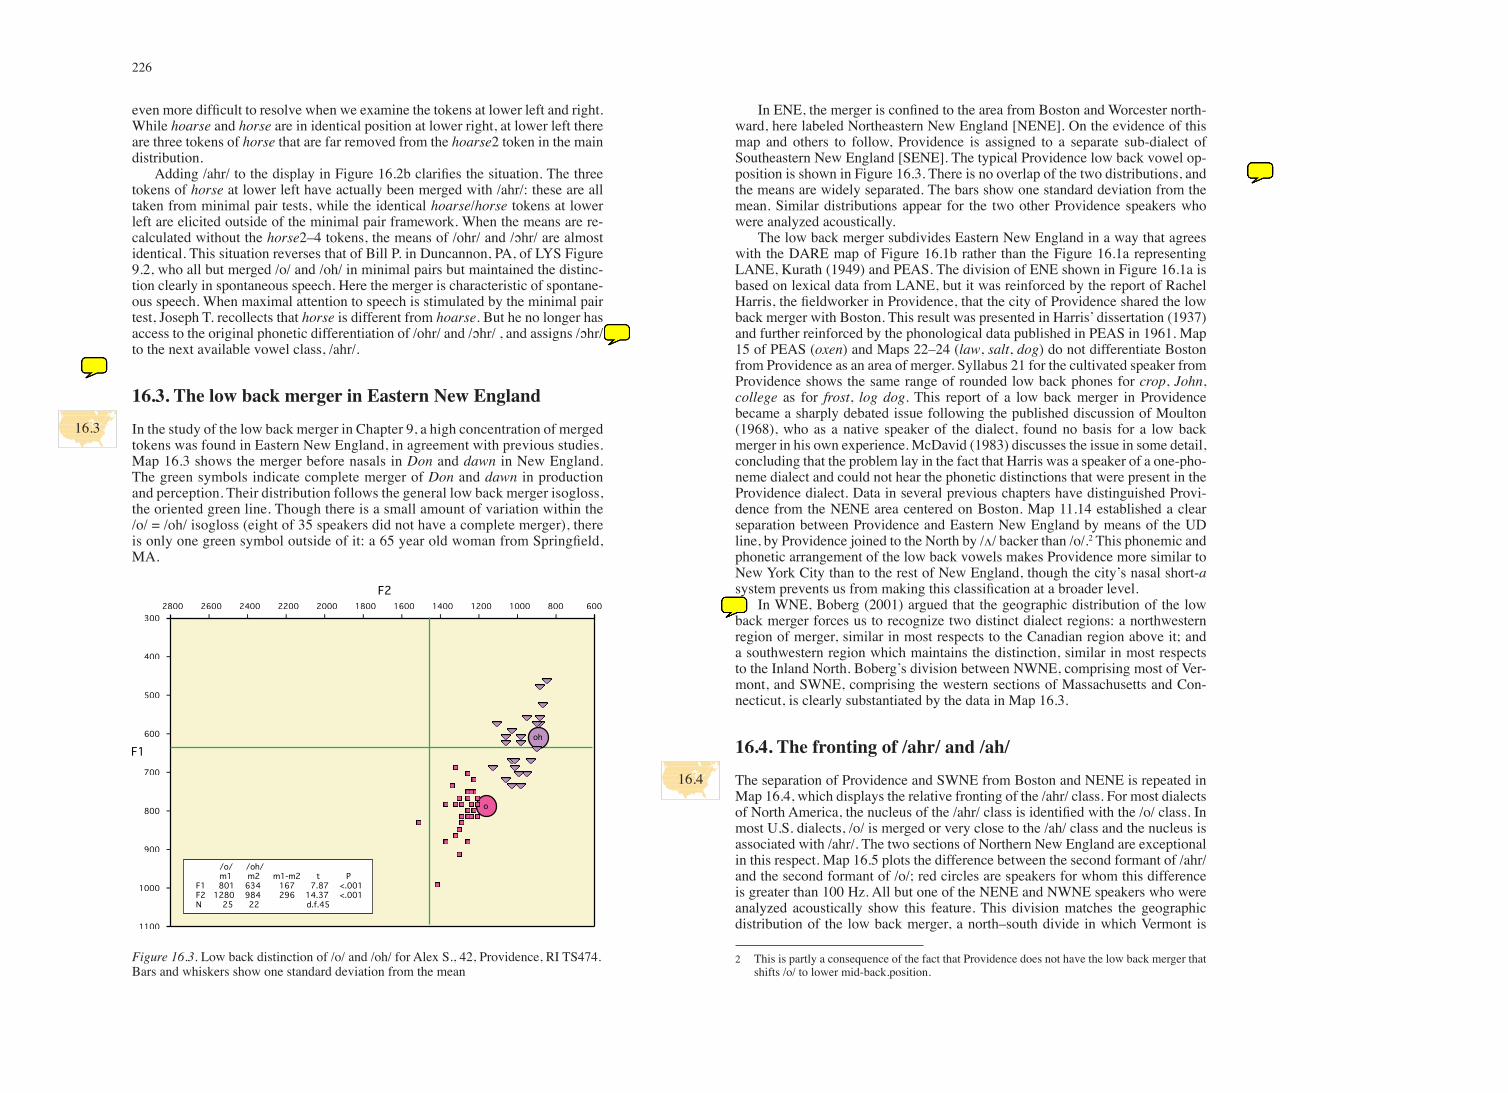
In ENE, the merger is confined to the area from Boston and Worcester north-ward, here labeled Northeastern New England [NENE]. On the evidence of this map and others to follow, Providence is assigned to a separate sub-dialect of Southeastern New England [SENE]. The typical Providence low back vowel op-position is shown in Figure 16.3. There is no overlap of the two distributions, and the means are widely separated. The bars show one standard deviation from the mean. Similar distributions appear for the two other Providence speakers who were analyzed acoustically.
The low back merger subdivides Eastern New England in a way that agrees with the DARE map of Figure 16.1b rather than the Figure 16.1a representing LANE, Kurath (1949) and PEAS. The division of ENE shown in Figure 16.1a is based on lexical data from LANE, but it was reinforced by the report of Rachel Harris, the fieldworker in Providence, that the city of Providence shared the low back merger with Boston. This result was presented in Harris ̓dissertation (1937) and further reinforced by the phonological data published in PEAS in 1961. Map 15 of PEAS (oxen) and Maps 22–24 (law, salt, dog) do not differentiate Boston from Providence as an area of merger. Syllabus 21 for the cultivated speaker from Providence shows the same range of rounded low back phones for crop, John, college as for frost, log dog. This report of a low back merger in Providence became a sharply debated issue following the published discussion of Moulton (1968), who as a native speaker of the dialect, found no basis for a low back merger in his own experience. McDavid (1983) discusses the issue in some detail, concluding that the problem lay in the fact that Harris was a speaker of a one-pho-neme dialect and could not hear the phonetic distinctions that were present in the Providence dialect. Data in several previous chapters have distinguished Provi-dence from the NENE area centered on Boston. Map 11.14 established a clear separation between Providence and Eastern New England by means of the UD line, by Providence joined to the North by /√/ backer than /o/.2 This phonemic and phonetic arrangement of the low back vowels makes Providence more similar to New York City than to the rest of New England, though the cityʼs nasal short-a system prevents us from making this classification at a broader level.
In WNE, Boberg (2001) argued that the geographic distribution of the low back merger forces us to recognize two distinct dialect regions: a northwestern region of merger, similar in most respects to the Canadian region above it; and a southwestern region which maintains the distinction, similar in most respects to the Inland North. Bobergʼs division between NWNE, comprising most of Ver-mont, and SWNE, comprising the western sections of Massachusetts and Con-necticut, is clearly substantiated by the data in Map 16.3.
16.4. The fronting of /ahr/ and /ah/
The separation of Providence and SWNE from Boston and NENE is repeated in Map 16.4, which displays the relative fronting of the /ahr/ class. For most dialects of North America, the nucleus of the /ahr/ class is identified with the /o/ class. In most U.S. dialects, /o/ is merged or very close to the /ah/ class and the nucleus is associated with /ahr/. The two sections of Northern New England are exceptional in this respect. Map 16.5 plots the difference between the second formant of /ahr/ and the second formant of /o/; red circles are speakers for whom this difference is greater than 100 Hz. All but one of the NENE and NWNE speakers who were analyzed acoustically show this feature. This division matches the geographic distribution of the low back merger, a north–south divide in which Vermont is
2 This is partly a consequence of the fact that Providence does not have the low back merger that shifts /o/ to lower mid-back.position.
oh
o
/o/ /oh/ m1 m2 m1-m2 t PF1 801 634 167 7.87 <.001F2 1280 984 296 14.37 <.001N 25 22 d.f.45
F2
F1
2800 2600 2400 2200 2000 1800 1600 1400 1200 1000 800 600300
400
500
600
700
800
900
1000
1100
Figure 16.3. Low back distinction of /o/ and /oh/ for Alex S., 42, Providence, RI TS474. Bars and whiskers show one standard deviation from the mean
16.4
16.3

227
The merger of /o/ and /oh/ is shown here by the minimal pair Don ~ dawn, which was found to be almost totally merged in Canada. In ENE., it is almost as consistent but establishes a different set of boundaries than those shown in the last map. Provi-dence is excluded, and the northern part of Western New England is included. The NENE region shows a consistent unity for the features of Maps 16.1–16.3.
Map 16.3. The low back merger in New England
ading Trenton
Passaic
Newark
Paterson
cranton
lentown
Montreal
Burlington
Brick
Jersey Citry
NewHaven
Albany
Hartford
Springfield
NewBritain
New York City
Rutland
Middletown
Middlebury
Concord
Manchester
Worcester
Providence
Waterville
Portland
Boston
Bangor
NWNE
SWNE
NENE
SENE
Don = dawn/o/ = /oh/Western New England NWNE SWNEEastern New England NENE SENE
For many North Americans, the vowel of /ahr/ in car, card, etc. has shifted up and to the back, but in ENE it is located in a much more central position. This fea-ture unites Northeastern and Northwestern New England, along with the Atlantic Provinces as seen in Map 15.6.
Map 16.4. Fronting of /ahr/ in Eastern New England
ding
cranton
town
Trenton
Paterson
Passaic
Newark Jersey City
NewBritain
NewHaven
Burlington
Rutland
Albany
Montreal
Hartford
Springfield
Middletown
New York City
Concord
Manchester
Portland
Waterville
WorcesterBoston
Providence
Bangor
NWNE
SWNE
NENE
SENE
F2(ahr) - F2(o) > 100 HzWestern New EnglandEastern New England/o/ = /oh/
The fronting of /ahr/ and /ah/

228
united with NENE, and Providence with SWNE. No Providence subject shows this relative fronting of /ahr/, nor do any of the speakers from western Massachu-setts or Connecticut.3
The fronting of /ah/
The features that separated the Boston area from the Providence area in Maps 16.3, 16.4, 11.14, and 14.8 are not specific to NENE, but are shared by NWNE. The aspect of the vowel system that distinguishes NENE most clearly from other sections of New England is the fronting of the /ah/ class in father, spa, pa, pa-jama, aunt, half, etc., separating it from /o/.4 The identification of the /ah/ class with the fronted /ahr/ class is the inheritance of the long-established r-vocaliza-tion of ENE, and though the r-less pattern is weakening, the identification of the two nuclei remains.
In Map 16.5, dark red circles show speakers with the relative fronting of /ar/ relative to /o/ as well as the fronting of /ahr/ relative to /o/ that was displayed in Map 16.4. The bright-red circles in NWNE indicate speakers who front only /ahr/, not /ah/. There are no exceptions in NENE: all six speakers for whom we have sufficient data show the dark red symbols.5
Figure 16.4 displays this pattern in the low vowels of a 75-year-old woman from Manchester, New Hampshire. In her system, short-a vowels follow the na-sal configuration shown to be characteristic of New England in Chapter 13. Ham and man are higher and fronter than other short-a words, followed by syllables ending in palatals and other voiceless stops. The word can t̓ is assigned to the broad-a class in low center position; half might also be considered for this class, since it is quite far removed from the other words with voiceless fricative codas (athlete, fast). These /ah/ words are associated with the /ahr/ class, represented by scarf, barbecue, hard, etc. Both /ah/ and /ahr/ are near the normalized grand mean of 1550 Hz. The short /o/ tokens are in low back position, around 1200 Hz, and are fully merged with /oh/ (not shown here).
The distribution of the /ah/ ~ /o/ distinction in Eastern New England
Map 16.5 indicates a uniform distinction of /ah/ and /o/ in NENE that can be con-sidered a defining property of the dialect area. But the six acoustic records in this
area do not provide a dense enough coverage to make this uniformity clear. Nagy (2001) provides information on 474 subjects interviewed by University of New Hampshire students. The question posed was, “Does father rhyme with bother, like feather and weather”?6 Massachusetts subjects showed a solid distinction, except for those most distant from Boston. In New Hampshire, the merger was reported by 20 to 60 percent, but here it was the regions closest to Boston that showed the highest percent of merger. This tendency of New Hampshire people to distance themselves from Boston is most noticeable among younger speakers (Nagy 2001, Table 1).
The east–west New England line
The evidence presented so far agrees with Figure 16.1 in the general placement of the line separating ENE from WNE, in that it passes somewhere near the Ver-mont–New Hampshire border, and through the middle of Massachusetts and Con-necticut. In this respect, the results from LANE (16.1a) and DARE (16.1b) do not differ. However, a more detailed comparison of Maps 16.l–16.5 with Figures 16.1a, b is not possible, since LANE and DARE included data from a number of small towns and rural communities near the border that were not included in the survey of urbanized areas conducted for TELSUR. In Kurath (1949) and Carver (1987), a great deal of attention is necessarily given to the location of the bound-ary separating ENE from WNE. The line passes east of the Connecticut Valley cities (Springfield and Hartford), and divides the eastern part of Vermont (the northern Connecticut valley) from western Vermont (Burlington and Rutland), following the Green Mountain divide. There are no ANAE data that can relate to this level of detail, since that line is defined by rural communities that are absent from Map 16.1: a more precise contemporary delineation of the borders between the subregions of New England awaits more detailed local studies.
The conservative position of Providence
Chapter 12 identified some areas of the North that did not participate in the gen-eral fronting of back vowels, and in this respect, the city of Providence was ex-treme. The vowel system of Alex S. of Providence was displayed in Figure 12.8, showing the back position of /aw/, /ow/, and /uw/. Map 16.6 shows the location of the most conservative dialects in regard to the fronting of these three vowels. The blue circles are speakers for whom the mean F2 value for the nucleus of /uw/ is less than 1350 Hz (200 Hz further back than the normalized mean of 1550 Hz), the F2 mean of /ow/ less than 1200 Hz, and the F2 of /aw/ less than 1450 Hz. All three Providence speakers are so marked. Outside of Providence, there is only one such speaker in New England (in Waterville, Maine), and one in New York City. The conservative treatment of the back upgliding vowels is therefore a hall-mark of the SENE dialect.7
3 The other side of the coin is the fact that /ah/ is fronted towards the center of the vowel system in absolute terms; but it is the distinction between /ah/ and /oh/ that forms the structural defini-tion of this region.
4 See Chapter 2 for the history and specific composition of this class, which incorporates the original father set with a large body of foreign loan words, and in Northeastern New England, a certain number of the British broad-a words, irregularly distributed across individual speak-ers..
5 Since the /ah/ class was not the focus of direct elicitation, there are some speakers who did not have sufficient information on that class to be displayed here.
6 Results are currently posted at http://www.unh.edu/linguistics/NN/papers/survey.S99.html7 There are only five other such speakers in North America: one in Rochester, NY, and four in
Wisconsin.
F2
F1
2800 2600 2400 2200 2000 1800 1600 1400 1200 1000 800 600400
500
600
700
800
900
1000
/æ/ /æN/ /ah/ /ahr/ /o/
hat
that
back
jacket
Saturdaynatural2
natural
half
athletefast
ham
hamburgs
man
Palace cot
hot
hotdogssod
sock
stocking2
on
pond
fond
Don
tonic2
tonic
tonic3
dollar2
can't
hard2
hardscarfs
barn2barbecue
æ
ahr
o
Figure 16.4. Low vowels of Adrienne M., 75, Manchester NH, TS 447
16.5
16.6

229
Northeastern New England is particularly marked by the central position of the vowel in father, pa along with “broad-a” words like can t̓, aunt, and half. While this class merges with /o/ in other dialects, it is distinct here. Only in NENE does it merge with the larger /ahr/ class in car, card, etc. when /r/ is vocalized. Com-pare this map with Map 16.4.
Map 16.5. Fronting of /ah/ in Northeastern New England
ding
ranton
town
Trenton
Paterson
Passaic
Newark Jersey City
NewBritain
NewHaven
Burlington
Rutland
Albany
Montreal
Hartford
Springfield
Middletown
New York City
Concord
Manchester
Portland
Waterville
WorcesterBoston
Providence
Bangor
NWNE
SWNE
NENE
SENE
F2(ah) - F2(o) > 100 Hz Both /ah/ and /ahr/ Only /ahr/Western New EnglandEastern New England/o/ = /oh/
In Chapter 12, it appeared that Providence was the most conservative city in re-spect to the fronting of /uw/ and /ow/. This map shows how Providence contrasts with the rest of ENE in this respect, and is also differentiated from SWNE at the center of a separate SENE region.
Map 16.6. The conservative treatment of back upgliding vowels in Providence
ng
anton
own
Trenton
Paterson
Passaic
Newark Jersey City
NewBritain
NewHaven
Burlington
Rutland
Albany
Montreal
Hartford
Springfield
Middletown
New York City
Concord
Manchester
Portland
Waterville
WorcesterBoston
Providence
Bangor
F2(uw) < 1350 Hz and F2(ow) < 1200 Hz and F2(aw) < 1450Western New EnglandEastern New EnglandNENESENE
The fronting of /ahr/ and /ah/

230
Short-a systems
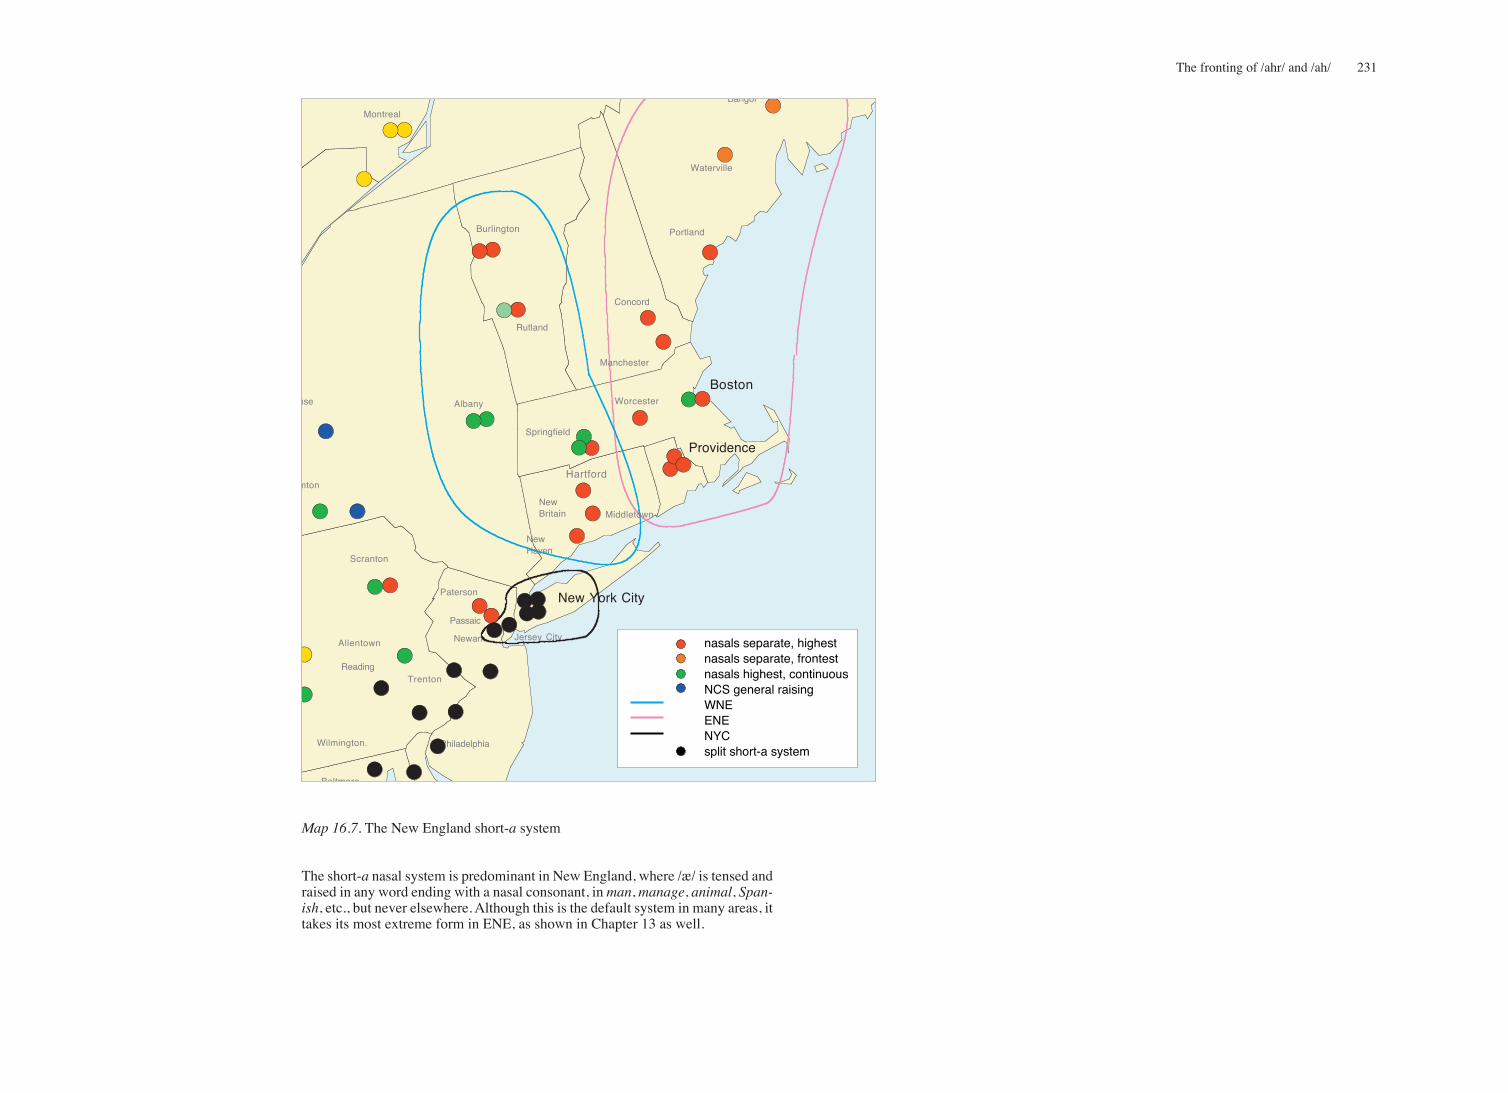
Chapter 13 presented a range of different organizations of the short-a word-class characteristic of American dialects. The New England patterns are displayed in Map 16.7. As Chapter 13 indicated, the nasal system predominates in both ENE and WNE. The red circles designate those speakers for whom words with nasal codas are higher and fronter than the rest, with a clear separation that can extend from the top to the bottom of the phonological space available. Figure 13.5 shows the vowel system of Dana L. of Boston, the right-hand of the two Boston speak-ers in Map 16.7. The nasal short-a pattern is dominant in both ENE and WNE, though WNE has more speakers with the continuous variant.
Not all New England short-a systems show the clear separation of Figure 13.5. Figure 16.5 shows a variant of this system, with a small set of words in syl-lables closed by nasal consonants in high–front position, and a second set only slightly higher than the main formation of lax /æ/ words. These include /æ/ before nasals in open syllables or polysyllables. It is characteristic of New England that vowels before voiceless fricatives are low, considerably lower than vowels before voiceless stops like that.8 Another variant of the nasal system is found in Maine, where the nasal group is separated exclusively by F2: that is, vowels before na-sals are considerably fronter than others (orange symbols in Map 16.7). To the south is found the split short-a system (Figure 13.3) characteristic of NYC. To the west are the general raising patterns of the Inland North, shown on Map 16.7 as blue circles.
Figure 16.5. Short-a system of Natalie M., 45 [1998], Portland ME, TS 724
F2
F1
2800 2600 2400 2200 2000 1800 1600 1400 1200 1000 800300
400
500
600
700
800
900
1000
1100
/æ/ /æN/ /ah/
happy
hat
cat
mattress
that3that2
that4
bad3bad
bad2bad
packedback2
back3
back
bag
tag
Saturdaynatural
ask
pass2last2
ham
hamburgers
animal
pan's
pantsmansion
mansion2Dan
Stanford
mechanic
pancakes
garages
æ
8 The word ask in Figure 16.5 may in fact be assigned to the /ah/ (“broad a”) class, along with garage.
16.7
231
The short-a nasal system is predominant in New England, where /æ/ is tensed and raised in any word ending with a nasal consonant, in man, manage, animal, Span-ish, etc., but never elsewhere. Although this is the default system in many areas, it takes its most extreme form in ENE, as shown in Chapter 13 as well.
Map 16.7. The New England short-a system
use
mton
Reading
Baltmore
Wilmington.
Scranton
Allentown
Philadelphia
Trenton
Paterson
Passaic
Newark Jersey City
NewBritain
NewHaven
Burlington
Rutland
Albany
Montreal
Hartford
Springfield
Middletown
New York City
Concord
Manchester
Portland
Waterville
WorcesterBoston
Providence
Bangor
nasals separate, highestnasals separate, frontestnasals highest, continuousNCS general raisingWNEENENYCsplit short-a system
The fronting of /ahr/ and /ah/