16. information technology. information technology 223 legacy it spending historically, the federal...
TRANSCRIPT

221
16. INFORMATION TECHNOLOGY
Every day millions of Americans rely on Federal infor-mation technology (IT) to engage with Federal services and information. The President proposes spending nearly $45.8 billion on IT investments at major civilian agen-cies, which will be used to acquire, develop, and implement modern technologies that enhance digital service delivery. This budget also supports the forthcoming President’s Management Agenda (PMA), OMB policies, and Federal laws that enable agency technology planning, oversight, funding, and accountability practices. It will also support the consolidation of common agency services; migration to secure, cost-effective commercial cloud solutions; and the modernization of antiquated and often unsecured legacy systems. This investment will, in alignment with the PMA, focus on addressing root structural, process, and capabil-ity challenges in government technology service delivery. The analysis in this chapter excludes the Department of Defense and classified spending which in FY 2018 was $42.5 billion, or 44 percent of the IT budget for that year.
OVERVIEW OF FEDERAL INFORMATION TECHNOLOGY
Federal Spending on IT
As shown in Table 16-1, the Federal Government Budget for civilian IT is estimated to be $45.8 billion in FY 2019.1 This figure is a decrease from the reported civilian value for FY 2018, largely due to a change in reporting guidance for Federal IT spending. In previous years, the IT budget included grants made by two Federal agencies to state and local governments for IT systems used to administer Federal benefits. In FY 2018, these grants were estimated
1 Based on agencies represented on the IT Dashboard, located at https://www.itdashboard.gov.
to be $9.0 billion, making up 10 percent of the IT budget. Not including these grants in FY 2019 affects the IT bud-gets reported for the Department of Agriculture (USDA) and the Department of Health and Human Services (HHS), as these agencies account for all of the aforemen-tioned grants spending. While USDA and HHS typically set requirements for State and local government use of these funds, it is the State or local government that is responsible for development and maintenance of the sys-tems, so the revised time series excluding these grants effectively presents the spending for which Federal Chief Information Officers (CIOs) can be fairly held accountable. Chart 16-1 shows historical estimates of the annual IT budget since FY 2011, with an additional estimate where these grants have been removed2 in order to maintain continuity with current reporting guidance. It should be noted that the total agency budgets presented elsewhere in the budget do include these IT grants.
Table 16–1. FEDERAL IT SPENDING(In millions of dollars)
2017 2018 2019
Non-Defense ��������������������������������������� 44,924 45,554 45,775
Total .................................................... 44,924 45,554 45,775The analysis in this chapter excludes the Department of Defense and classified spending�
There is significant variation in spending on IT among Executive Branch Departments and Agencies, as shown in Table 16-2, which displays IT spending by agency. The
2 Investments labeled as ‘Part 06 – Grants to State and Local IT In-vestments’ were excluded from FY 2011 – 2015 figures and investments labeled ‘Part 04 - Grants and Other Transferred Funding’ were excluded in FY 2016 – 2017 figures. FY 2018 – 2019 estimates did not collect these investments.
$37.33
$37.47 $36.98$38.73
$41.51$43.30
$45.55 $45.77
$40.97 $40.69 $41.27
$44.44
$49.96
$52.21
$44.92
25
30
35
40
45
50
55
2011 2012 2013 2014 2015 2016 2017 2018 2019
Federal IT Spending without Grants Category
Federal IT Spending with Grants Category
Billions of dollars
Chart 16-1. Trends in Federal IT SpendingGrants Spending Removal Comparison
Note: This excludes the Department of Defense and classified spending� This is a new calculation for Federal IT Spending in which grants are no longer included�

222 ANALYTICAL PERSPECTIVES
Department of Homeland Security is the largest civilian agency in IT spending, while the bottom 5 agencies only spend 1.3 percent of Federal IT spending.
IT Investments Overview
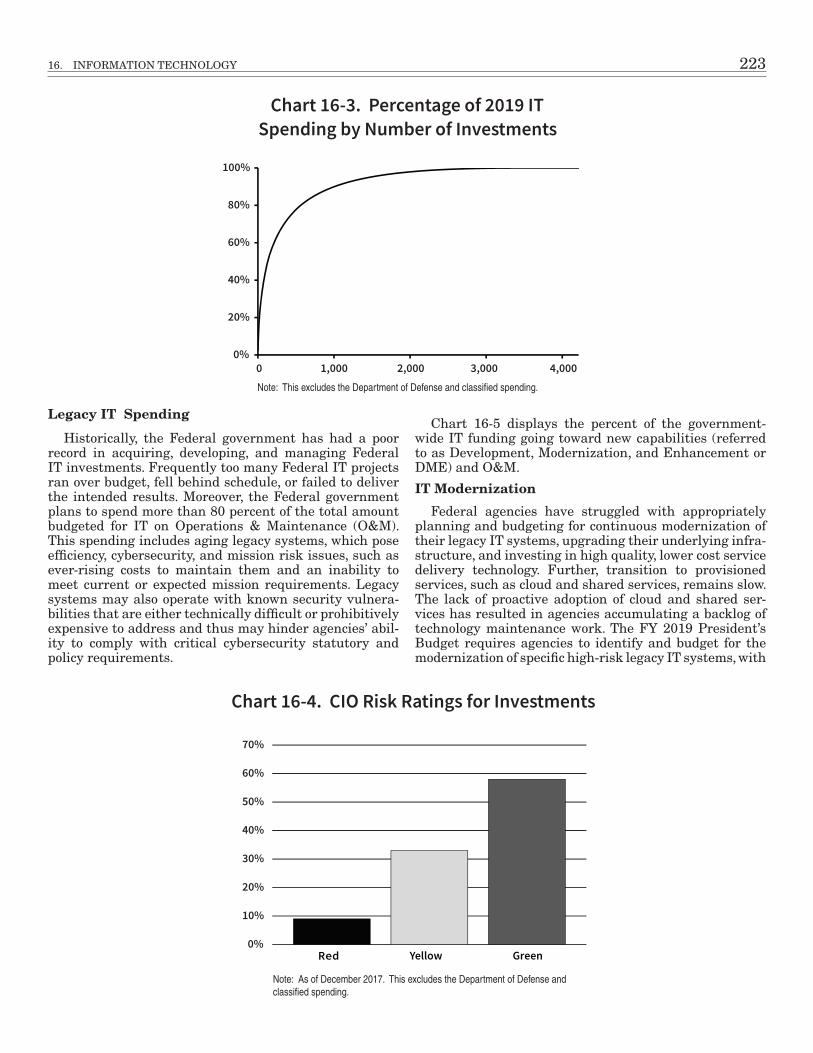
The FY 2019 budget includes funding for 4,113 IT investments at major civilian agencies. These invest-ments support three main functions: mission delivery; IT infrastructure, IT security, and IT management; and administrative services and support systems (see Chart 16-2). As Chart 16-3 shows, IT investments can vary widely in size and scope. As a result, the largest 100 in-vestments account for 45 percent of Federal IT spending.
Of those 4,113 IT investments, 507 are major IT in-vestments. Agencies determine if an IT investment is classified as major based on whether the associated in-vestment has significant program or policy implications; has high executive visibility; has high development, operating, or maintenance costs; or requires special management attention because of its importance to the mission or function of the agency. For all major IT invest-ments, agencies are required to submit Business Cases, which provide additional transparency regarding the cost, schedule, and performance data related to its spending.
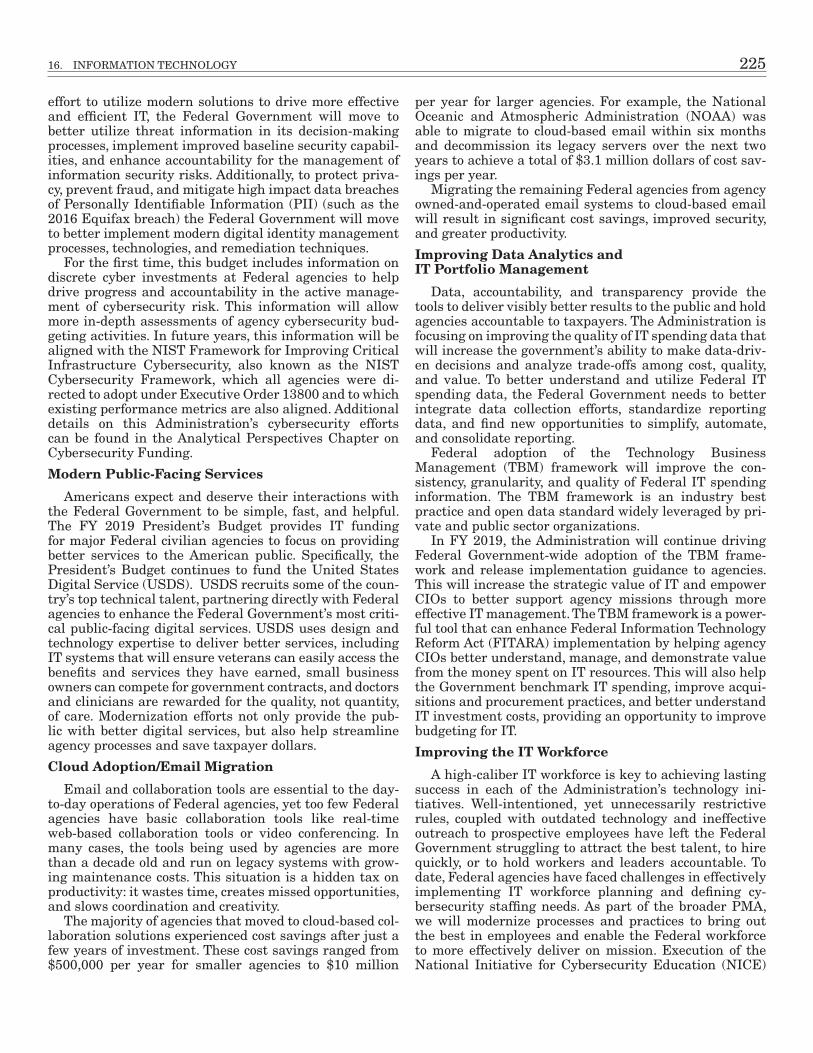
OMB requires that agency CIOs provide risk ratings for all major IT investments on the IT Dashboard website on a continuous basis and assess how risks for major de-velopment efforts are being addressed and mitigated. The Agency CIO rates each investment based on his or her best judgment, using a set of pre-established criteria. As a rule, the evaluation should reflect the CIO’s assessment of the investment’s ability to accomplish its goals. Chart 16-4 summarizes the latest CIO risk ratings for all major IT investments government-wide.
The IT Dashboard shows slight decreases in the gen-eral health of IT investments across government, as denoted by the decreased proportion of CIO-rated “Green” (“Low Risk” to “Moderately Low Risk”) investments on the IT Dashboard, which comprised 58 percent of all rated investments in 2018 compared to 79 percent in 2012 (as-sessments based on total life cycle of investments).
Agency FY 2019 Percent of Total
Department of Homeland Security ��������������������������������� $6,844 15�0%Department of Health and Human Services ������������������� $5,472 12�0%Department of the Treasury �������������������������������������������� $4,649 10�2%Department of Veterans Affairs ��������������������������������������� $4,281 9�4%Department of Transportation ����������������������������������������� $3,306 7�2%Department of Commerce ���������������������������������������������� $3,008 6�6%Department of Justice ���������������������������������������������������� $2,878 6�3%Department of State ������������������������������������������������������� $2,429 5�3%Department of Energy ���������������������������������������������������� $2,331 5�1%Department of Agriculture ���������������������������������������������� $2,034 4�4%Social Security Administration ���������������������������������������� $1,671 3�7%National Aeronautics and Space Administration ������������ $1,645 3�6%Department of the Interior ���������������������������������������������� $1,195 2�6%Department of Education ������������������������������������������������ $741 1�6%Department of Labor ������������������������������������������������������ $690 1�5%General Services Administration ������������������������������������ $667 1�5%U�S� Army Corps of Engineers ���������������������������������������� $468 1�0%Environmental Protection Agency ���������������������������������� $342 0�7%Department of Housing and Urban Development ����������� $338 0�7%Nuclear Regulatory Commission ������������������������������������ $169 0�4%U�S� Agency for International Development �������������������� $154 0�3%Office of Personnel Management ����������������������������������� $147 0�3%National Archives and Records Administration ��������������� $120 0�3%National Science Foundation ������������������������������������������ $105 0�2%Small Business Administration ��������������������������������������� $90 0�2%
Total ............................................................................... $45,775 100.0%The analysis in this chapter excludes the Department of Defense and classified spending�
Table 16–2. ESTIMATED FY 2019 FEDERAL IT SPENDING AND PERCENTAGE BY AGENCY
(In millions of dollars)
Chart 16-2. 2019 IT Investment Portfolio Summary
8.041.94 10.1Percent
IT Infrastructure, Security, & ManagementMission DeliveryAdministrative Services & Support Systems
0 20 40 60 80 100
Note: This excludes the Department of Defense and classified spending�
16. INFORMATION TECHNOLOGY 223
Legacy IT Spending
Historically, the Federal government has had a poor record in acquiring, developing, and managing Federal IT investments. Frequently too many Federal IT projects ran over budget, fell behind schedule, or failed to deliver the intended results. Moreover, the Federal government plans to spend more than 80 percent of the total amount budgeted for IT on Operations & Maintenance (O&M). This spending includes aging legacy systems, which pose efficiency, cybersecurity, and mission risk issues, such as ever-rising costs to maintain them and an inability to meet current or expected mission requirements. Legacy systems may also operate with known security vulnera-bilities that are either technically difficult or prohibitively expensive to address and thus may hinder agencies’ abil-ity to comply with critical cybersecurity statutory and policy requirements.
Chart 16-5 displays the percent of the government-wide IT funding going toward new capabilities (referred to as Development, Modernization, and Enhancement or DME) and O&M.
IT Modernization
Federal agencies have struggled with appropriately planning and budgeting for continuous modernization of their legacy IT systems, upgrading their underlying infra-structure, and investing in high quality, lower cost service delivery technology. Further, transition to provisioned services, such as cloud and shared services, remains slow. The lack of proactive adoption of cloud and shared ser-vices has resulted in agencies accumulating a backlog of technology maintenance work. The FY 2019 President’s Budget requires agencies to identify and budget for the modernization of specific high-risk legacy IT systems, with
Chart 16-3. Percentage of 2019 IT Spending by Number of Investments
0%
20%
40%
60%
80%
100%
0 1,000 2,000 3,000 4,000
0%
10%
20%
30%
40%
50%
60%
70%
Chart 16-4. CIO Risk Ratings for Investments
Red Yellow Green
Note: This excludes the Department of Defense and classified spending�
Note: As of December 2017� This excludes the Department of Defense and classified spending�

224 ANALYTICAL PERSPECTIVES
a particular focus on transitioning these systems to cloud and shared services. Doing so will improve the quality and efficiency of the Government’s critical citizen-facing services by migrating to commercial cloud solutions, con-solidating common agency services, and modernizing agencies’ legacy systems.
The forthcoming PMA will prominently feature IT modernization as one of the foundational pillars on which the Executive Branch will focus its time, resources, and attention. Detailed below are key elements of this Administration’s IT modernization strategy under the PMA.
Technology Modernization Fund
The FY 2019 President’s Budget includes $210 million for the Technology Modernization Fund (TMF). The TMF was established as a key component of the Modernizing Government Technology provisions in the Fiscal Year 2018 National Defense Authorization Act (NDAA). The FY 2019 funding will complement any initial seed funding provided in FY 2018, when discretionary appropriations are finalized, and will help grow the revolving fund to a sustained level that will allow the TMF to tackle more complex government-wide IT modernization efforts.
The TMF pioneers a new model for Federal technology modernization projects. Agencies must apply to and com-pete for TMF funds. Effective evaluation, selection, and monitoring of approved projects by the TMF Board will provide strong incentives for agencies to develop compre-hensive, high quality modernization plans. Agencies will provide plans that meet key criteria defined by the TMF Board, which will likely include: having a high probability of success, a strong team, and a substantial impact on mis-sion and citizen service delivery. Funds will be distributed in an incremental manner, tied to milestones and objec-tives. Agencies that receive funds from the TMF will work with the General Services Administration (GSA) and the Office of Management and Budget (OMB) to ensure that projects make maximum use of commercial products and
services in their planning and execution and have a high likelihood of success.
TMF funds will be repaid over a period not to exceed five years, aided through cost savings and avoidance, sub-ject to a written agreement and the availability of out-year agency appropriations. In addition, incremental funds transfers will be tied to successful delivery of products. Successful projects will operate as proofs of concept and will provide valuable insights to the Board, which may recommend prioritizing the selection of more comprehen-sive modernization projects that can serve the interests of the Executive Branch as a whole.
Cybersecurity
Strengthening the cybersecurity of Federal networks, systems, and data is one of the most important challenges we face as a nation. Risk management assessments car-ried out under the President’s Executive Order 138003, Strengthening the Cybersecurity of Federal Networks and Critical Infrastructure, demonstrated that the majority of Federal agencies could not appropriately manage their cybersecurity risk. These assessments found enterprise-wide gaps in network visibility, IT tool standardization, and common operating procedures, all of which negatively affect Federal cybersecurity and put our nation at risk. Bold approaches are needed to improve government-wide governance processes and implement cybersecurity capa-bilities “commensurate with risk and magnitude of the harm”4 that a compromise of Federal information sys-tems and information would entail. As part of the larger
3 https://www.whitehouse.gov/presidential-actions/presidential-executive-order-strengthening-cybersecurity-federal-networks-critical-infrastructure/
4 FISMA requires agencies to implement information security protec-tions commensurate with the risk and magnitude of the harm resulting from the unauthorized access, use, disclosure, disruption, modification, or destruction of “information collected or maintained by or on behalf of [an] agency” and “information systems used or operated by an agency or by a contractor of an agency or other organization on behalf of an agency”. 44 U.S.C. § 3554.
20 80Percent
Development, Modernization, & Enhancement
Operations and Maintenance
Chart 16-5. IT Spending by DME and O&M
0 20 40 60 80 100
Note: This excludes the Department of Defense and classified spending�
16. INFORMATION TECHNOLOGY 225
effort to utilize modern solutions to drive more effective and efficient IT, the Federal Government will move to better utilize threat information in its decision-making processes, implement improved baseline security capabil-ities, and enhance accountability for the management of information security risks. Additionally, to protect priva-cy, prevent fraud, and mitigate high impact data breaches of Personally Identifiable Information (PII) (such as the 2016 Equifax breach) the Federal Government will move to better implement modern digital identity management processes, technologies, and remediation techniques.
For the first time, this budget includes information on discrete cyber investments at Federal agencies to help drive progress and accountability in the active manage-ment of cybersecurity risk. This information will allow more in-depth assessments of agency cybersecurity bud-geting activities. In future years, this information will be aligned with the NIST Framework for Improving Critical Infrastructure Cybersecurity, also known as the NIST Cybersecurity Framework, which all agencies were di-rected to adopt under Executive Order 13800 and to which existing performance metrics are also aligned. Additional details on this Administration’s cybersecurity efforts can be found in the Analytical Perspectives Chapter on Cybersecurity Funding.
Modern Public-Facing Services
Americans expect and deserve their interactions with the Federal Government to be simple, fast, and helpful. The FY 2019 President’s Budget provides IT funding for major Federal civilian agencies to focus on providing better services to the American public. Specifically, the President’s Budget continues to fund the United States Digital Service (USDS). USDS recruits some of the coun-try’s top technical talent, partnering directly with Federal agencies to enhance the Federal Government’s most criti-cal public-facing digital services. USDS uses design and technology expertise to deliver better services, including IT systems that will ensure veterans can easily access the benefits and services they have earned, small business owners can compete for government contracts, and doctors and clinicians are rewarded for the quality, not quantity, of care. Modernization efforts not only provide the pub-lic with better digital services, but also help streamline agency processes and save taxpayer dollars.
Cloud Adoption/Email Migration
Email and collaboration tools are essential to the day-to-day operations of Federal agencies, yet too few Federal agencies have basic collaboration tools like real-time web-based collaboration tools or video conferencing. In many cases, the tools being used by agencies are more than a decade old and run on legacy systems with grow-ing maintenance costs. This situation is a hidden tax on productivity: it wastes time, creates missed opportunities, and slows coordination and creativity.
The majority of agencies that moved to cloud-based col-laboration solutions experienced cost savings after just a few years of investment. These cost savings ranged from $500,000 per year for smaller agencies to $10 million
per year for larger agencies. For example, the National Oceanic and Atmospheric Administration (NOAA) was able to migrate to cloud-based email within six months and decommission its legacy servers over the next two years to achieve a total of $3.1 million dollars of cost sav-ings per year.
Migrating the remaining Federal agencies from agency owned-and-operated email systems to cloud-based email will result in significant cost savings, improved security, and greater productivity.
Improving Data Analytics and IT Portfolio Management
Data, accountability, and transparency provide the tools to deliver visibly better results to the public and hold agencies accountable to taxpayers. The Administration is focusing on improving the quality of IT spending data that will increase the government’s ability to make data-driv-en decisions and analyze trade-offs among cost, quality, and value. To better understand and utilize Federal IT spending data, the Federal Government needs to better integrate data collection efforts, standardize reporting data, and find new opportunities to simplify, automate, and consolidate reporting.
Federal adoption of the Technology Business Management (TBM) framework will improve the con-sistency, granularity, and quality of Federal IT spending information. The TBM framework is an industry best practice and open data standard widely leveraged by pri-vate and public sector organizations.
In FY 2019, the Administration will continue driving Federal Government-wide adoption of the TBM frame-work and release implementation guidance to agencies. This will increase the strategic value of IT and empower CIOs to better support agency missions through more effective IT management. The TBM framework is a power-ful tool that can enhance Federal Information Technology Reform Act (FITARA) implementation by helping agency CIOs better understand, manage, and demonstrate value from the money spent on IT resources. This will also help the Government benchmark IT spending, improve acqui-sitions and procurement practices, and better understand IT investment costs, providing an opportunity to improve budgeting for IT.
Improving the IT Workforce
A high-caliber IT workforce is key to achieving lasting success in each of the Administration’s technology ini-tiatives. Well-intentioned, yet unnecessarily restrictive rules, coupled with outdated technology and ineffective outreach to prospective employees have left the Federal Government struggling to attract the best talent, to hire quickly, or to hold workers and leaders accountable. To date, Federal agencies have faced challenges in effectively implementing IT workforce planning and defining cy-bersecurity staffing needs. As part of the broader PMA, we will modernize processes and practices to bring out the best in employees and enable the Federal workforce to more effectively deliver on mission. Execution of the National Initiative for Cybersecurity Education (NICE)

226 ANALYTICAL PERSPECTIVES
coding structure is expected to identify critical cyber needs by the end of FY 2018. IT and cybersecurity recruit-ment and retention initiatives will continue to focus on mitigation of critical skill gaps and retaining current IT and cybersecurity talent. This past year the CIO Council, OMB, and the Office of Personnel Management held the first-ever government-wide tech and cyber hiring and re-cruitment event that attracted almost 2,000 attendees.
Increasing Buying Power
The Federal Government is the world’s largest buyer, yet does not adequately leverage its buying power or price information to get the best value for the taxpayer. Significant contract duplication means that agencies award multiple contracts for similar goods and services, and experience significant price variance for the exact same item. At the same time, acquisition processes remain slow and complicated, reflecting strategies that were de-
signed more than a half-century ago that fail to leverage modern technologies and private sector practices.
In FY 2019, the Administration will drive adop-tion of Category Management strategies, which enable Federal agencies to buy products and services in a co-ordinated and collaborative manner using Best in Class solutions and practices to the maximum extent practica-ble. Modernization will be supported with: (1) the adoption of government-wide standards; (2) using the standards to reduce contract duplication for IT and professional servic-es; and (3) leveraging common solutions, shared services, and innovative commercial and government practices to bring spending under management control, with contin-ued strong small business participation.
Implementation of these strategies has the potential to drive numerous benefits, including generating savings and administrative cost avoidance, increasing the Federal Government’s ability to rapidly deploy best-in-class in-dustry solutions, and enhancing cybersecurity.