1.5nutritionresearchstatistics
TRANSCRIPT

8/13/2019 1.5NutritionResearchStatistics
http://slidepdf.com/reader/full/15nutritionresearchstatistics 1/4
8/13/2019 1.5NutritionResearchStatistics
http://slidepdf.com/reader/full/15nutritionresearchstatistics 2/4
response to a certain exposure (in nutrition this is often a food or dietary compound). In a
paper it is common to see one of these measures in this form: OR = 2.0. What does this mean?
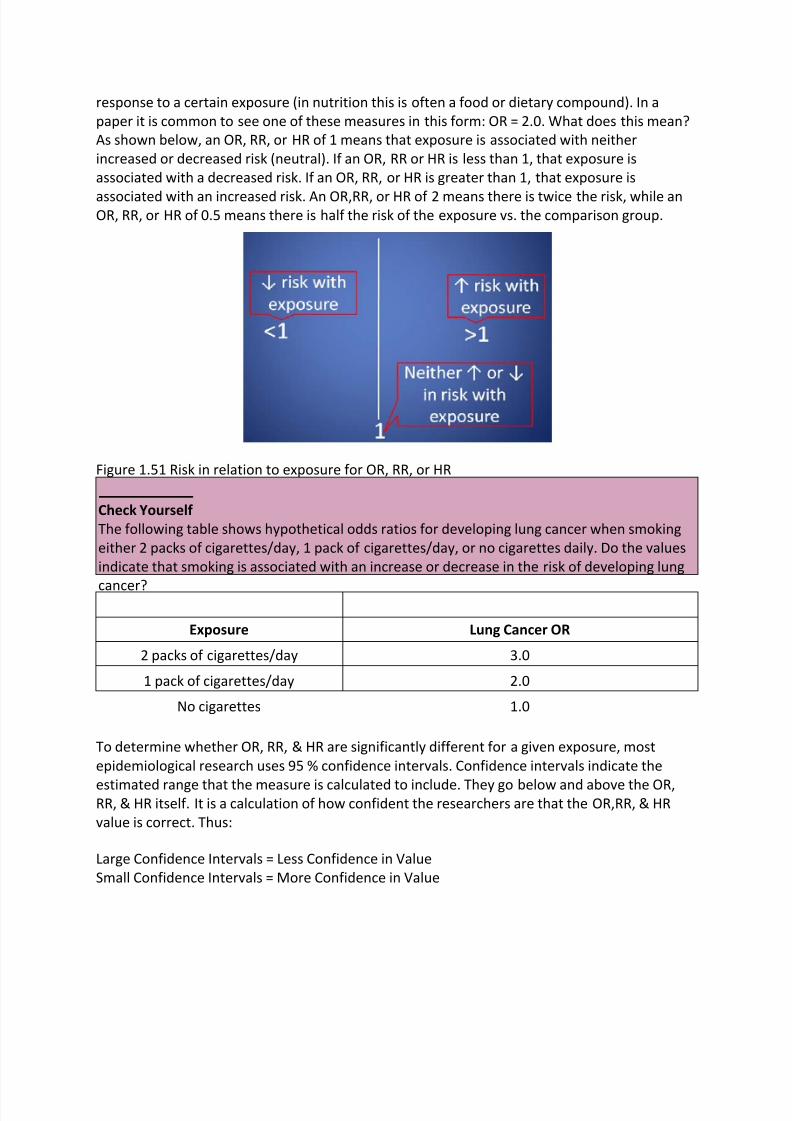
As shown below, an OR, RR, or HR of 1 means that exposure is associated with neither
increased or decreased risk (neutral). If an OR, RR or HR is less than 1, that exposure is
associated with a decreased risk. If an OR, RR, or HR is greater than 1, that exposure is
associated with an increased risk. An OR,RR, or HR of 2 means there is twice the risk, while anOR, RR, or HR of 0.5 means there is half the risk of the exposure vs. the comparison group.
Figure 1.51 Risk in relation to exposure for OR, RR, or HR Check Yourself The following table shows hypothetical odds ratios for developing lung cancer when smoking
either 2 packs of cigarettes/day, 1 pack of cigarettes/day, or no cigarettes daily. Do the values
indicate that smoking is associated with an increase or decrease in the risk of developing lung
cancer? Exposure Lung Cancer OR
2 packs of cigarettes/day 3.0 1 pack of cigarettes/day 2.0
No cigarettes 1.0 To determine whether OR, RR, & HR are significantly different for a given exposure, most
epidemiological research uses 95 % confidence intervals. Confidence intervals indicate the
estimated range that the measure is calculated to include. They go below and above the OR,RR, & HR itself. It is a calculation of how confident the researchers are that the OR,RR, & HR
value is correct. Thus: Large Confidence Intervals = Less Confidence in Value Small Confidence Intervals = More Confidence in Value
8/13/2019 1.5NutritionResearchStatistics
http://slidepdf.com/reader/full/15nutritionresearchstatistics 3/4
Thus, 95% confidence intervals indicate that researchers are 95% confident that the true value
is within the confidence intervals. A confidence interval is normally written in parenthesis
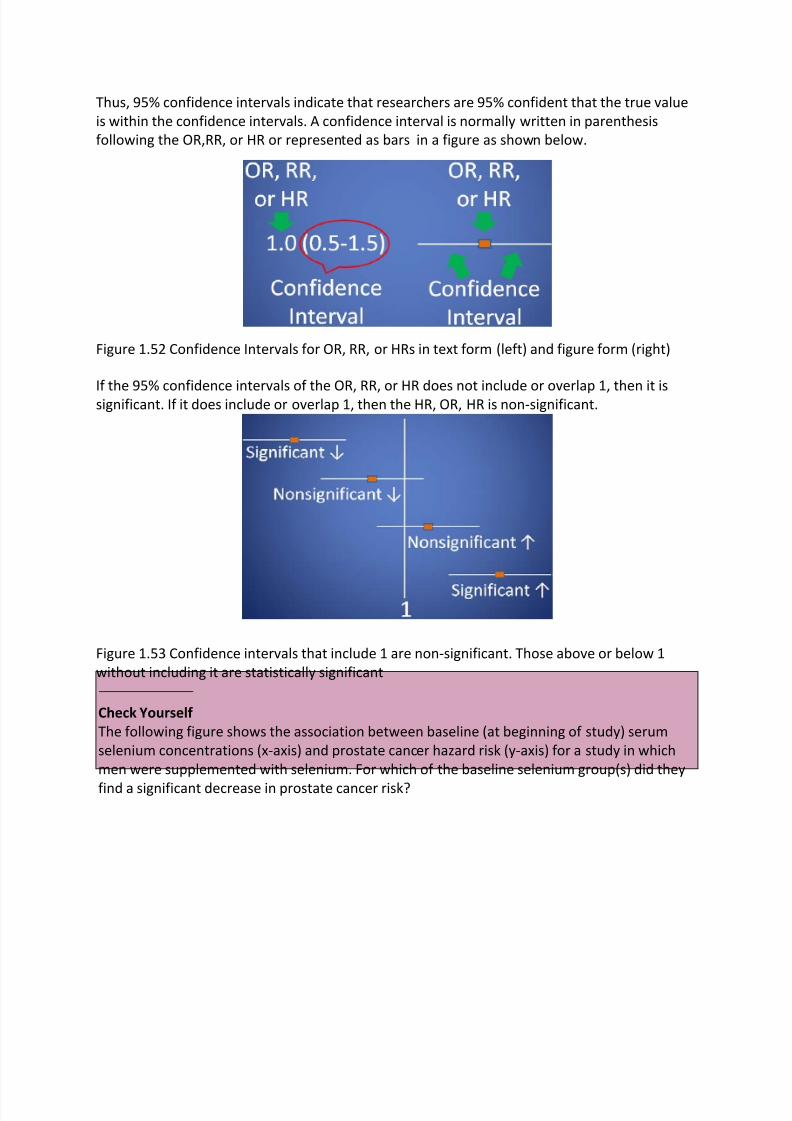
following the OR,RR, or HR or represented as bars in a figure as shown below.
Figure 1.52 Confidence Intervals for OR, RR, or HRs in text form (left) and figure form (right) If the 95% confidence intervals of the OR, RR, or HR does not include or overlap 1, then it issignificant. If it does include or overlap 1, then the HR, OR, HR is non-significant.
Figure 1.53 Confidence intervals that include 1 are non-significant. Those above or below 1
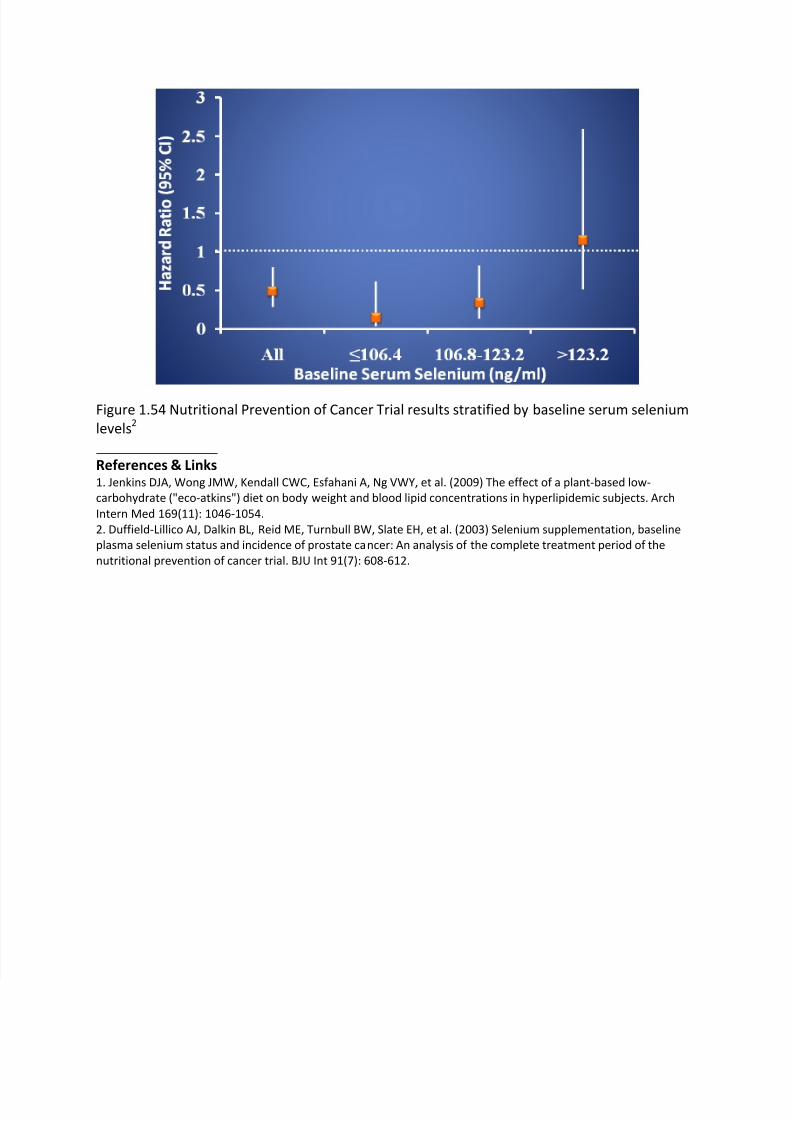
without including it are statistically significant Check Yourself The following figure shows the association between baseline (at beginning of study) serum
selenium concentrations (x-axis) and prostate cancer hazard risk (y-axis) for a study in which
men were supplemented with selenium. For which of the baseline selenium group(s) did they
find a significant decrease in prostate cancer risk?
8/13/2019 1.5NutritionResearchStatistics
http://slidepdf.com/reader/full/15nutritionresearchstatistics 4/4
Figure 1.54 Nutritional Prevention of Cancer Trial results stratified by baseline serum selenium
levels2
References & Links 1. Jenkins DJA, Wong JMW, Kendall CWC, Esfahani A, Ng VWY, et al. (2009) The effect of a plant-based low-
carbohydrate ("eco-atkins") diet on body weight and blood lipid concentrations in hyperlipidemic subjects. Arch
Intern Med 169(11): 1046-1054. 2. Duffield-Lillico AJ, Dalkin BL, Reid ME, Turnbull BW, Slate EH, et al. (2003) Selenium supplementation, baseline
plasma selenium status and incidence of prostate cancer: An analysis of the complete treatment period of the
nutritional prevention of cancer trial. BJU Int 91(7): 608-612.