150/5300-17c, standards for using remote sensing technologies
TRANSCRIPT

Advisory Circular
U.S. Department of Transportation
Federal Aviation Administration
Subject: Standards for Using Remote Sensing Technologies in Airport Surveys
Date: September 30, 2011
Initiated by: AAS-100
AC No: 150/5300-17C
Change: NA
1. What is the purpose of this AC?
This Advisory Circular (AC) provides guidance regarding the use of remote sensing technologies in the collection of data describing the physical infrastructure of an airport. This AC describes the acceptable uses and standards for use of different remote sensing technologies in the data collection process.
2. Who does this Advisory Circular apply to?
a. This AC applies to airport proponents contracting airport surveying services utilizing remote sensing technologies, such as aerial or satellite imagery or Light Detection and Ranging (LIDAR).
b. This AC also provides data providers the standards and recommended practices for using remote sensing technologies in the collection of airport data.
c. This AC uses a question and answer format for practical field application.
d. This AC uses “you” to mean the Airport Owner, Operator or Consultant, and “we” to mean the FAA.
3. Does this AC cancel any prior ACs?
This AC cancels AC 150/5300-17B, General Guidance and Specifications for Aeronautical Survey Airport Imagery Acquisition and Submission to the National Geodetic Survey, dated September 29, 2008.
4. What are the Principal Changes in this Version?
This is a substantial rewrite of this advisory circular. Users should review the entire document. Major changes include reformatting, more detailed explanations, and new sections on remote sensing technologies other than aerial imagery (primarily LIDAR) for collecting airport data.
5. What is the Application of this AC?
The Federal Aviation Administration (FAA) recommends the use of the guidance and specifications in this Advisory Circular for the collection and submission of data using remote sensing technologies. In general, use of this AC is not mandatory. However, the use of this AC is mandatory for all projects funded through the Airport Improvement Program (AIP) or Passenger Facility Charges (PFC) Program. See Grant Assurance No. 34, “Policies, Standards, and Specifications,” and PFC Assurance No. 9, “Standards and Specifications.”

AC 150/5300-17C September 30, 2011
6. Where do I provide comments or suggestions?
Direct comments or suggestions regarding this AC to:
Manager, Airport Engineering Division Federal Aviation Administration ATTN: AAS-100 800 Independence Avenue, S.W., Suite 621 Washington, DC, 20591
7. Where can I obtain copies of this AC:
The FAA Office of Airport Safety and Standards has made this AC available to the public for download through the FAA’s Internet home page (www.faa.gov). You can view a list of all ACs at http://www.faa.gov/regulations_policies/advisory_circulars/. You can view the other FAA regulatory guidance at http://www.faa.gov/regulations_policies/faa_regulations/.
Michael J. O’Donnell Director, Office of Airport Safety and Standards
ii
September 30, 2011 AC 150/5300-17C
Table of Contents Chapter 1. Remote Sensing Technologies .......................................................................................... 1
1.1 What are the acceptable remote sensing technologies for use in airport surveys? ............. 1
Chapter 2. Remote Sensing Project Planning .................................................................................... 3 2.1 What are the remote sensing plan requirements? ................................................................ 3 2.2 How do I document the location of a proposed runway extension in aerial imagery? ..... 17 2.3 What are the requirements for horizontal and vertical ties to the NSRS? ........................ 18 2.4 Can I use LIDAR to perform an obstruction analysis? ..................................................... 18 2.5 Can I use LIDAR to collection airport features that are non-airport related? ................... 18 2.6 What are the data delivery requirements for remote sensing projects? ............................ 18
Chapter 3. Aerial Imagery Specific Standards and Recommended Practices ............................. 19 3.1 What is the timeframe for imagery acquisition? ............................................................... 19 3.2 Do we capture the imagery in a leaf-on or leaf-off condition? ......................................... 19 3.3 What are the equipment and supplies requirements when using aerial imagery
technologies? .................................................................................................................... 19 3.4 What information do I include in the Aerial Photogrammetric Report? ........................... 20
Chapter 4. Digital Orthoimagery Standards and Recommended Practices ................................. 27 4.1 Data Content Standard. ..................................................................................................... 27 4.2 Coverage. .......................................................................................................................... 27 4.3 Ground Sample Distance. ................................................................................................. 27 4.4 Horizontal Positional Accuracy Testing and Reporting. .................................................. 27 4.5 Deliverable Requirements. ................................................................................................ 27 4.6 Orthoimagery Delivery. .................................................................................................... 27
Chapter 5. Light Imaging Detection and Ranging (LIDAR) Specific Standards ......................... 29 5.1 What are the differences in LIDAR technologies in the collection of airport data? ......... 29 5.2 What are the basic considerations in using LIDAR to collect airport data? ..................... 31 5.3 Why must I calibrate LIDAR systems? ............................................................................ 31 5.4 What are the system calibration requirements for using LIDAR to collect airport data? . 32 5.5 What are the specific requirements for Airborne Terrestrial LIDAR Mapping (ATLM)
sensors? ............................................................................................................................. 33 5.6 What are the specific requirements for MCLM sensors? ................................................. 35 5.7 What are the specific requirements for TLM sensors? ..................................................... 36 5.8 What are the data processing standards and recommended practices for using LIDAR in
airport obstruction data collection projects? ..................................................................... 37
Chapter 6. Satellite Imagery Standards and Recommended Practices ......................................... 39 6.1 Reserved............................................................................................................................ 39
Chapter 7. Required Project Deliverables ....................................................................................... 41 7.1 What deliverables are required for all remote sensing projects? ...................................... 41 7.2 What deliverables are required for projects incorporating aerial imagery technologies? . 41 7.3 What deliverables are required for projects incorporating LIDAR ATLM technologies? 41 7.4 What deliverables are required for projects incorporating LIDAR MCLM technologies?
.......................................................................................................................................... 42 7.5 What are the deliverables for projects incorporating LIDAR TLM technologies?........... 44
Chapter 8. Data Review and Acceptance ......................................................................................... 47
iii
AC 150/5300-17C September 30, 2011
8.1 Data Review and Acceptance Requirement ...................................................................... 47
Chapter 9. Points of Contact ............................................................................................................. 49 9.1 Advisory Circular Questions/Comments .......................................................................... 49
Appendix 1. LIDAR Usability Table .................................................................................................. 51 Appendix 2. Glossary ........................................................................................................................... 61
List of Figures Figure 2-1 Sample KML Code for a Placemark ........................................................................................... 4 Figure 2-2 Combined Flight Line and Supporting Ground Control Network ............................................... 5 Figure 2-3 Combined Flight Line and Network with Obstacle Identification Surfaces ............................... 6 Figure 2-4 Scanner and Target Locations for Passenger Loading Bridge Feature ....................................... 7 Figure 2-5 Sample Digital Photograph of Imagery Control Point with Antenna ........................................ 10 Figure 2-6 Typical Shape Target in LIDAR Surveys for MCLM or TLM ................................................. 11 Figure 2-7 LIDAR Response of Sheet Target Mounted to a Light Post ..................................................... 12 Figure 2-8 Potential Data Shadowing If Survey Prime is a LIDAR Target ................................................ 13 Figure 2-9 Field/Test Apparatus Deployed in Survey Area and Stabilized ................................................ 15 Figure 2-10 Typical MCLM Type A Scan Control Points Layout ............................................................. 16 Figure 2-11 Scanner Setup Locations ......................................................................................................... 17 Figure 3-1 Sample Directory Structure for an AP Acquisition Project....................................................... 21 Figure 3-2 Photographic Flight Report Form ............................................................................................. 23 Figure 5-1 Proposed Flight Plan Fails to Capture Tower A ........................................................................ 34 Figure 5-2 Sample Steps for Analyzing Airport Objects as Obstructions .................................................. 38 Figure 7-1 Sample Point Cloud Dataset and Same Data Converted to CADD ........................................... 42
List of Tables Table 2–1 ASCII Control Point File ........................................................................................................... 14 Table 3–1 Map Accuracies as a Function of Photo/Map Scale .................................................................. 20 Table 3–2 Sample ASCII Imagery Control Points File .............................................................................. 22 Table 3–3 Sample ASCII Image File .......................................................................................................... 25 Table 5–1 LIDAR Data Acquisition Point Spacing Parameters ................................................................. 33
iv

September 30, 2011 AC 150/5300-17C
Chapter 1. Remote Sensing Technologies
1.1 What are the acceptable remote sensing technologies for use in airport surveys?
There are three basic technologies in wide use today for the collection of data on and surrounding the airport. Each of these technologies has advantages and disadvantages to its use. The airport proponent should understand the capabilities of each technology including its benefits and limitations before deciding which technology or combination of technologies is appropriate for their project.
a. Aerial imagery is the most common technology being used in the planning, design, construction, and analysis activities of an airport. In collecting aerial imagery, an aircraft fitted with a camera (film or digital) flies a series of flight lines over the airport and surrounding area to capture images. Aerial imagery is a passive collection system since it relies on capturing the radiation (generally from the sun) reflected off an object and captured by the camera.
b. Light Detection and Ranging (LIDAR) scanning technology is a rapidly evolving field of active source remote sensing providing accurate spatial coordinates of individual points. The LIDAR systems calculate the spatial coordinate of an object using three variables. First, the system measures the reflected energy of a laser pulse. Second, it also uses the time of flight for each pulse. And third, when necessary, corrects the data for instrument platform motion to generate a geospatially referenced point cloud representation of the objects within its view. LIDAR scanners are used for a variety of survey tasks and currently fall into four principle categories:
• Ground Based LIDAR (GBL), generally used for measuring atmospheric composition • Airborne LIDAR Mapping (ALM), also known as Airborne Terrestrial LIDAR Mapping (ATLM) • Mobile Compensated LIDAR Mapping (MCLM) • Terrestrial LIDAR Mapping (TLM), sometimes referred to as Ground Based LIDAR Scanning
(GBLS or GBLM)
The use of the acronym GBLS and GBLM can create confusion between GBL and systems used for survey mapping (GBLS or GBLM), so we refer to all these systems as TLM.
These are the only LIDAR systems classified for the collection of airport data.
c. Satellite imagery uses the same basic concept as aerial imagery except the camera platform is a satellite in space. Currently, using satellite imagery to collect airport data is not an approved method. The FAA continues to research and identify new uses and standards regarding satellite imagery.
Remote Sensing Technologies 1

AC 150/5300-17C September 30, 2011
Intentionally Left Blank
2 Remote Sensing Technologies

September 30, 2011 AC 150/5300-17C
Chapter 2. Remote Sensing Project Planning
2.1 What are the remote sensing plan requirements?
All projects incorporating the use of remote sensing technologies require you submit a plan outlining how you propose to complete the data acquisition.
You must submit a remote sensing plan to us through Airports GIS (http://airports-gis.faa.gov) for review and approval prior to beginning data acquisition. Provide the plan in a non-editable format such as Adobe Portable Document Format (PDF)™, detailing the following information:
a. General Project Information.
(1) Airport Name.
(2) Airport Identifier.
(3) Submitting Organization. Include:
Name
Address
City
State
Zip Code
Telephone Number
FAX Number
Organization’s Contact Person Name
For this report, the submitting organization is the airport operator, owner, or sponsor. If used, identify the consultant collecting the information within the Airports GIS project.
b. Project Purpose. Briefly outline the purpose of the project. State why the airport is undertaking the data acquisition. If the project supports a larger project such as construction activity, indicate this in the project purpose.
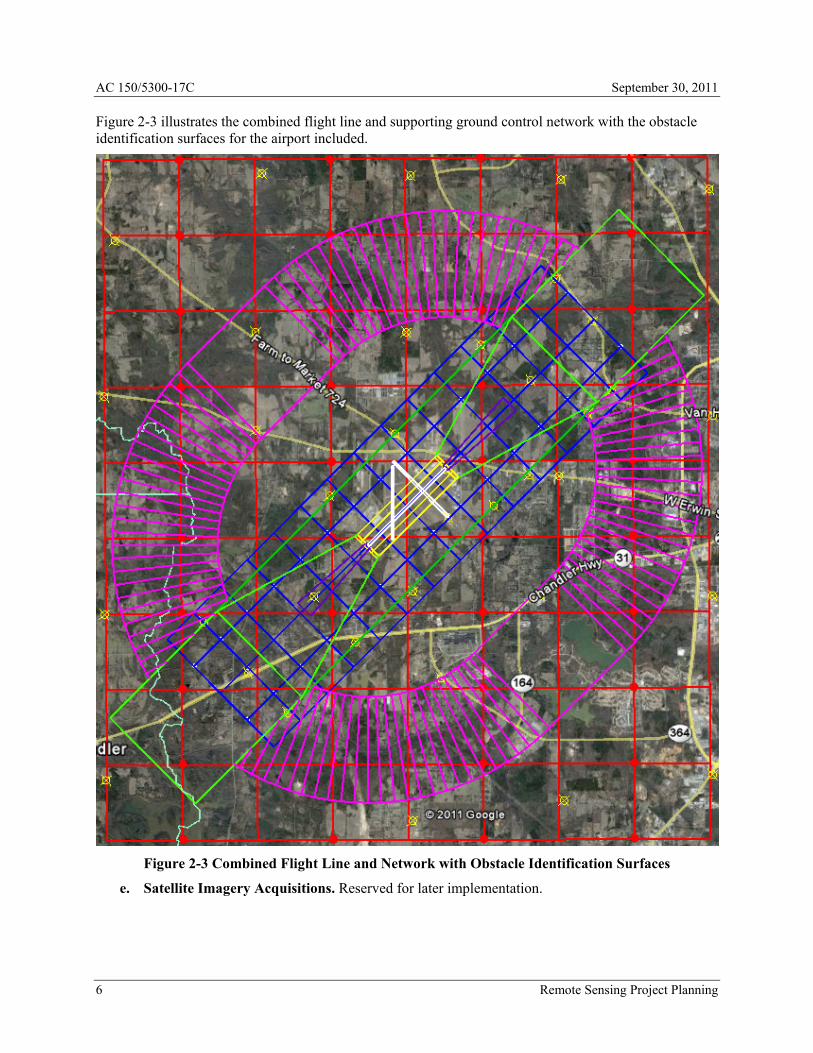
c. Project Boundaries. Briefly describe project boundaries of the data acquisition project. Include details about the surfaces and/or areas the data acquisition will cover such as obstruction identification surfaces (OIS), airport properties and other areas controlling the extent of the acquisition. Should the imagery acquisition include OIS, specify the runways for evaluation, as in Figure 2-3. In addition to the description, provide an active KML file of the project areas. See Figure 2-1 for an example. See also section 2.4, Can I use LIDAR to perform an obstruction analysis?
Remote Sensing Project Planning 3
AC 150/5300-17C September 30, 2011
d. Project Parameters. Briefly detail the proposed data acquisition for your aerial imagery mission. Describe the digital image resolution, horizontal and vertical accuracy values you plan to achieve in the data collection. Provide the accuracies in feet using Root Mean Square Error (RMSE). The values must comply with values in Table 3–1 Map Accuracies as a Function of Photo/Map Scale. If using multiple flight missions at different flying heights for the imagery acquisition, provide details for each flight mission. Include at a minimum the following information:
• Flying height or Above Ground Level (AGL) • Overlap percentage • Sidelap percentage • Number of flight lines • Number of total exposures • Camera film type (if using film) • Flight mission date range and sun angle range • Active Keyhole Markup Language (KML) file of the flight lines, as shown in Figure 2-1.
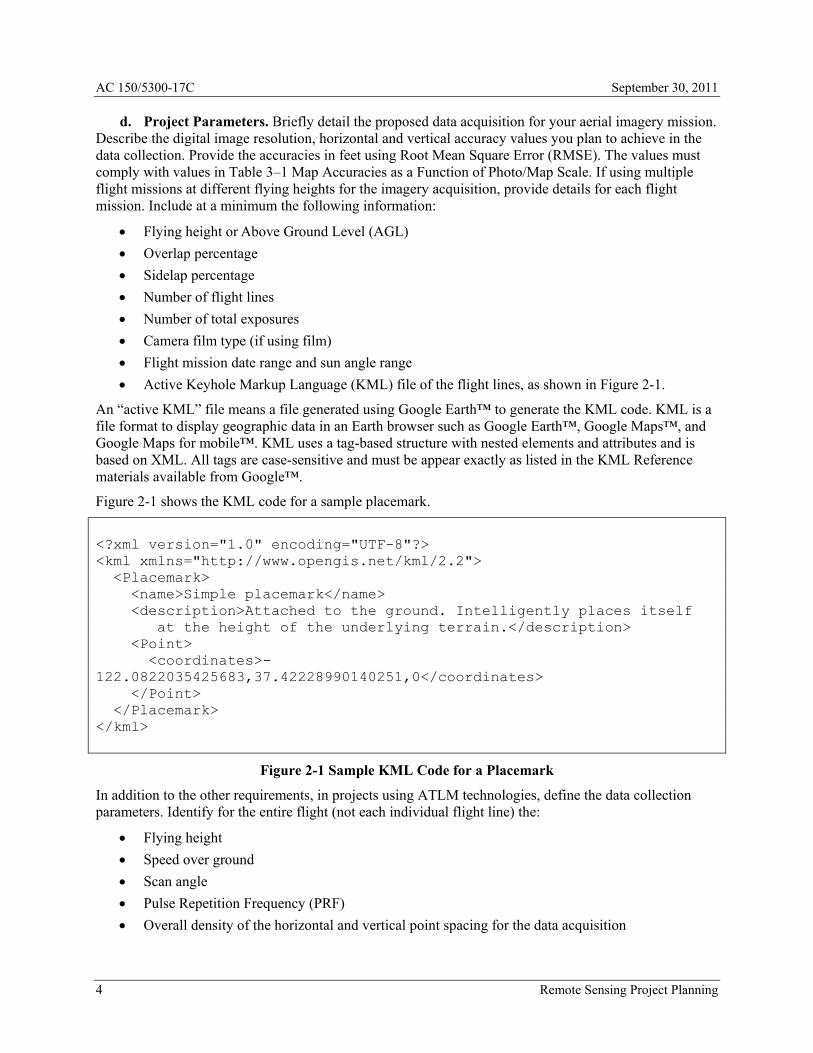
An “active KML” file means a file generated using Google Earth™ to generate the KML code. KML is a file format to display geographic data in an Earth browser such as Google Earth™, Google Maps™, and Google Maps for mobile™. KML uses a tag-based structure with nested elements and attributes and is based on XML. All tags are case-sensitive and must be appear exactly as listed in the KML Reference materials available from Google™.
Figure 2-1 shows the KML code for a sample placemark.
<?xml version="1.0" encoding="UTF-8"?> <kml xmlns="http://www.opengis.net/kml/2.2"> <Placemark> <name>Simple placemark</name> <description>Attached to the ground. Intelligently places itself at the height of the underlying terrain.</description> <Point> <coordinates>-122.0822035425683,37.42228990140251,0</coordinates> </Point> </Placemark> </kml>
Figure 2-1 Sample KML Code for a Placemark
In addition to the other requirements, in projects using ATLM technologies, define the data collection parameters. Identify for the entire flight (not each individual flight line) the:
• Flying height • Speed over ground • Scan angle • Pulse Repetition Frequency (PRF) • Overall density of the horizontal and vertical point spacing for the data acquisition
4 Remote Sensing Project Planning
September 30, 2011 AC 150/5300-17C
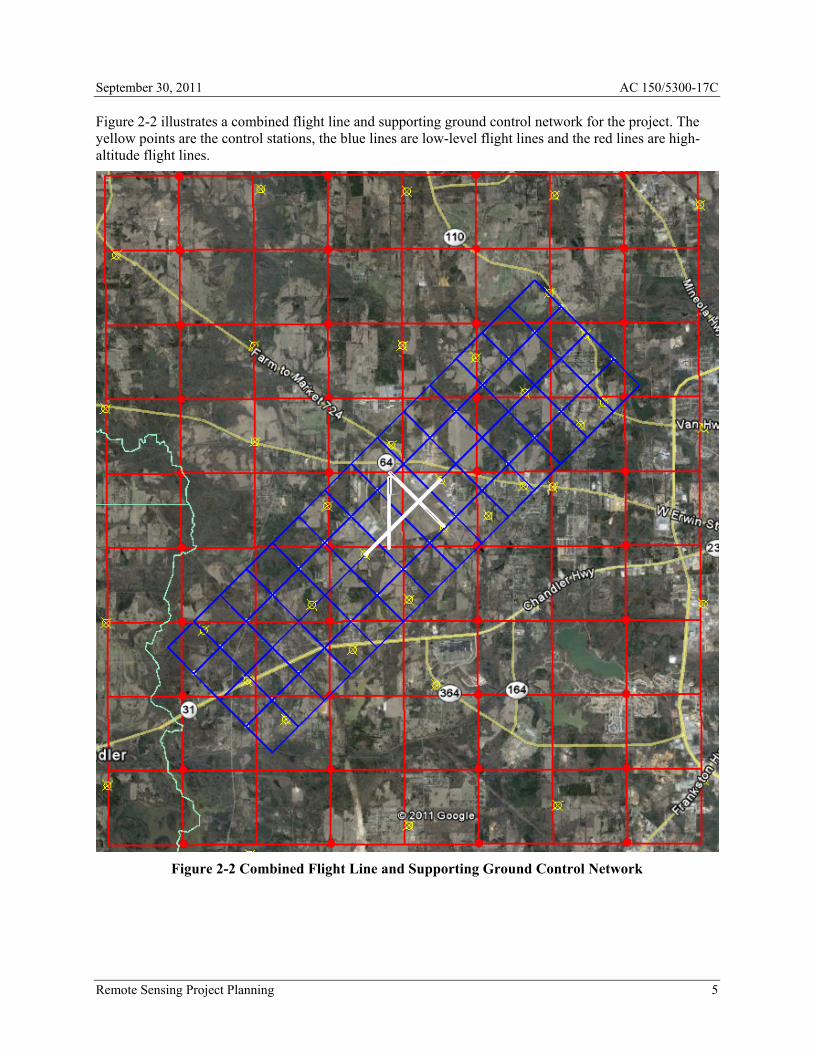
Figure 2-2 illustrates a combined flight line and supporting ground control network for the project. The yellow points are the control stations, the blue lines are low-level flight lines and the red lines are high-altitude flight lines.
Figure 2-2 Combined Flight Line and Supporting Ground Control Network
Remote Sensing Project Planning 5
AC 150/5300-17C September 30, 2011
Figure 2-3 illustrates the combined flight line and supporting ground control network with the obstacle identification surfaces for the airport included.
Figure 2-3 Combined Flight Line and Network with Obstacle Identification Surfaces
e. Satellite Imagery Acquisitions. Reserved for later implementation.
6 Remote Sensing Project Planning

September 30, 2011 AC 150/5300-17C
f. If proposing MCLM technologies, define how you will verify the satellite availability during the times of data acquisition. MCLM projects must have a minimum of six satellites in view for the Global Navigation Satellite System (GNSS) Control Stations and the GNSS unit in the MCLM system. In the plan, identify the predicted Position Dilution of Precision (PDOP) for the times of data acquisition. For MCLM collections, the predicted and actual PDOP during acquisition must be a value of five or less.
g. If proposing TLM technologies, reconnoiter the site to identify and document potential data collection stations. Document the proposed sites using digital photographs. The photographs will show the proposed target with electronically added captions. TLM systems capture features in great detail and can detect change at centimeter levels, and in some cases millimeter levels. However, achieving these levels of accuracy require multiple scanner setups. (See Figure 2-11.) Prior to survey execution, plan station selections for the entire survey area demonstrating capture of the features of interest. Ideally, also determine and document survey control and evaluation locations during reconnaissance. Plan to locate survey targets in areas of scan-arc overlap realizing the actual field conditions may require alternative locations for both scanner and target setup. Work with local airport authorities to determine the times of day when traffic has minimum impact on data quality. Plan to scan high traffic areas during times with the lightest traffic. Identify areas of vegetation and/or poor visibility. Detail how and when you will acquire data from these areas.
In the remote sensing plan, you must provide a drawing or illustration depicting the location and scan coverage for each potential site.
Figure 2-4 illustrates the scanner and target locations for collection of a passenger loading bridge feature.
Figure 2-4 Scanner and Target Locations for Passenger Loading Bridge Feature
Remote Sensing Project Planning 7
AC 150/5300-17C September 30, 2011
The schematic of an airport terminal feature (passenger loading bridge) shows the potential numbers of stations necessary to fully capture the plan view outline of the feature. The dashed polygons in depict the regions of capture available from each particular station.
h. Remote Sensing Equipment. In this section, provide a brief description of the remote sensing equipment you plan to use during the project. At a minimum, include:
(1) For projects incorporating aerial imagery technologies, include the:
(a) Type of acquisition camera/sensor (make/model)
(b) Focal length of proposed camera
(c) Serial number
(d) Area-weighted average resolution (AWAR) value and calibration date
(e) Calibration Certificate for all equipment. The date of the calibration certificate must be within three years of the estimated completion of the data collection.
If using a digital camera, provide the calibration report and/or information regarding the manufacturer’s recommended equivalent procedure.
If providing a manufacturer’s recommended procedure, include a Statement of Compliance on company letterhead. The statement of compliance will certify completion of the manufacturer’s recommended procedure at the recommended intervals, it will identify the date the procedure was last accomplished before the imagery was flown, and be signed by an authorized representative of the company submitting the Statement of Compliance.
(f) Detail how imagery from these sensors will be georeferenced, the collection bands to be used, and proposed imagery format.
(g) When using a film camera, provide the name and model number of the photogrammetric scanner used to create digital images.
(2) For projects incorporating LIDAR technologies, include:
(a) The makes, models, serial numbers, and any applicable software version numbers for all equipment the data provider proposes to use in data acquisition.
(b) Before and after collecting the data, ensure the calibration of all equipment in the system according to the manufacturer’s specifications. Refer to paragraph 5.5 for system calibration requirements.
(c) There is no standard format for the calibration reports, but they must contain, at a minimum:
(i) The date the calibration was performed.
(ii) The name of the person, company, or organization responsible for performing the calibration.
(iii) The methods used to perform the calibration.
(iv) The final calibration parameters or corrections determined through the calibration procedures.
(v) A discussion of the results.
(d) Provide the maintenance history of the sensor for acquiring LIDAR.
8 Remote Sensing Project Planning

September 30, 2011 AC 150/5300-17C
(3) Satellite imagery requirements. Reserved for later implementation.
i. Control Point Requirements.
(1) All remote sensing projects require some type of survey control to register or georeference the data to the National Spatial Reference System (NSRS). If airborne GPS procedures are integrated into the flight mission, make sure to reference this in the Remote Sensing Plan. In this section of the plan, describe the ground control network proposal, including characteristics such as panel point, photo identifiable, and others; locations; and expected accuracy of measurements in horizontal and vertical axis (stated as accuracy RMSE in feet).
(2) Develop and provide a Station Location and Visibility Diagram for each control point using the form available in the Surveyors’ section of the Airports GIS Web site at http://airports-gis.faa.gov. Include on the form a sketch of the area surrounding the control point.
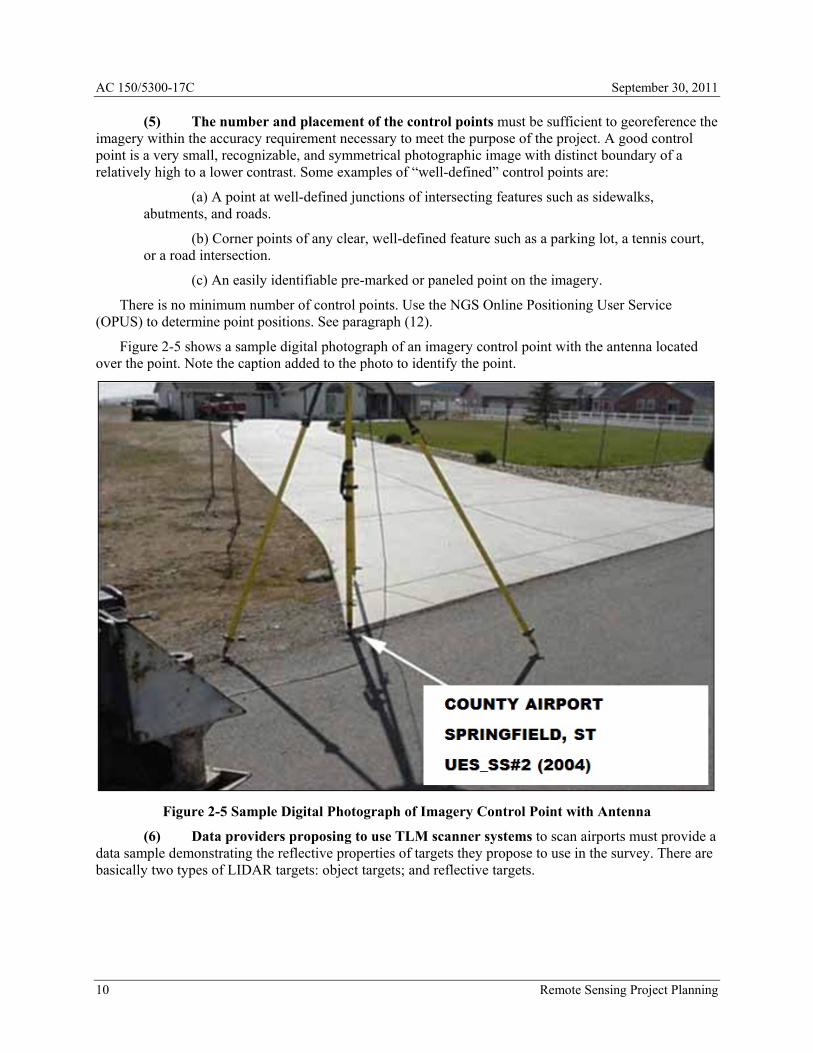
(3) Take digital photos of the station as prepared to support the data acquisition. (See Figure 2-5.) Electronically add to the photo a caption to uniquely identify it. Include the filenames of the digital images for the station in the sketch section of the appropriate Station Location and Visibility form.
(4) Include an active KML file showing control points supporting the data acquisition for the project area. See Figure 2-1.
Remote Sensing Project Planning 9
AC 150/5300-17C September 30, 2011
(5) The number and placement of the control points must be sufficient to georeference the imagery within the accuracy requirement necessary to meet the purpose of the project. A good control point is a very small, recognizable, and symmetrical photographic image with distinct boundary of a relatively high to a lower contrast. Some examples of “well-defined” control points are:
(a) A point at well-defined junctions of intersecting features such as sidewalks, abutments, and roads.
(b) Corner points of any clear, well-defined feature such as a parking lot, a tennis court, or a road intersection.
(c) An easily identifiable pre-marked or paneled point on the imagery.
There is no minimum number of control points. Use the NGS Online Positioning User Service (OPUS) to determine point positions. See paragraph (12).
Figure 2-5 shows a sample digital photograph of an imagery control point with the antenna located over the point. Note the caption added to the photo to identify the point.
Figure 2-5 Sample Digital Photograph of Imagery Control Point with Antenna
(6) Data providers proposing to use TLM scanner systems to scan airports must provide a data sample demonstrating the reflective properties of targets they propose to use in the survey. There are basically two types of LIDAR targets: object targets; and reflective targets.
10 Remote Sensing Project Planning

September 30, 2011 AC 150/5300-17C
(7) Object targets are objects of known size. Commercially the most common type is a plastic sphere. Constructing cylindrical targets using reflective tape applied to pipe for a registration cross is another appropriate target. Once captured by the scanner system, the point cloud data for the target is fit to the appropriate geometry. The quality of the fit is a measure of the accuracy of the target at a particular range.
Figure 2-6 shows a typical shape target for LIDAR surveys. The material is a durable, rough-finish, solid plastic sphere machined into a 6-inch sphere with a mounting bolt for attaching it to a standard 5/8 inch survey tripod.
Figure 2-6 Typical Shape Target in LIDAR Surveys for MCLM or TLM
Remote Sensing Project Planning 11

AC 150/5300-17C September 30, 2011
(8) Reflective targets are commercially available for most systems. These targets are two-dimensional, come in a variety of sizes, and are constructed of a reflective material and applied directly to a feature. Not all reflective sheet targets are ideal for some systems. Standard sheet targets commonly used for laser theodolites may reflect too strongly resulting in a saturated reading by the scanner system (See Figure 2-6). Using an inappropriate target results in a bright halo defined by the edges of the target and loss of data at the target center. This gap makes it less than ideal for precise georeferencing of the point cloud data set.
Figure 2-7 shows the LIDAR response of highly reflective sheet target mounted to the side of a light post.
Figure 2-7 LIDAR Response of Sheet Target Mounted to a Light Post
12 Remote Sensing Project Planning

September 30, 2011 AC 150/5300-17C
(9) You must demonstrate that both target types are reflective to the scanner of choice. Many manufactures provide some type of LIDAR target, but any object of regular, known dimensions is acceptable as long as it is reflective to the wavelength of laser. Lasers in the 900 or 1500 nanometer wavelength (near IR) will reflect accurately off of any material that is light in color, non-polished, and non-hydrated.
Figure 2-8 illustrates the potential data shadowing if a traditional survey prime is used as a LIDAR target.
Figure 2-8 Potential Data Shadowing If Survey Prime is a LIDAR Target
(10) Do not use surveying prisms as LIDAR targets. The orthogonal mirror geometry produces a measurement error for any incident beam that does not strike the exact center of the target. Secondly, the highly reflective target material will capture any beam that overlaps the target producing data shadow behind the target that becomes larger with beam divergence.
Remote Sensing Project Planning 13

AC 150/5300-17C September 30, 2011
(11) Provide an ASCII text file of the final imagery control point values identifying any changes from the remote sensing plan. This section should only include the coordinate values (easting, northing, elevation) for the photo control.
Table 2–1 illustrates an ASCII Control Point file ready for submission.
Table 2–1 ASCII Control Point File
Imagery Control Point Coordinates — Sample Airport Name _________________________________________________________ Coordinate System _____________________________________________________ UTM Zone ___________________________________________________________ (The state plane coordinate system in which the Airport Reference Point is located may also be used.) Reference Ellipsoid ____________________________________________________ Horizontal Reference Frame: NAD 83 (CORS 96) _______________________________________________ Vertical Reference Frame: NAVD 88 (Geoid) _________________________________________________ All heights are in feet.
Station Name Northing Easting Orthometric Height Ellipsoidal Height P01 2086849.62 3579322.68 115.48 83.34 P02 2086905.37 3583818.97 78.47 46.29 P03 2092134.98 3584776.85 93.59 61.45 P04 2093245.00 3586869.35 97.09 64.94 P05 2089958.84 3591583.70 88.78 56.53 P06 2084575.11 3596417.02 51.81 19.39 P07 2080281.03 3598531.32 12.47 -20.02 P08 2075655.30 3602180.66 3.04 -29.52 P09 2075499.76 3599408.29 11.76 -20.77
(12) Include OPUS Check Points. All technologies require you provide additional control point locations for use as “check points.” The purpose of the check point when using remote sensing technologies is to provide an additional means of verifying the georeferencing of the data. In addition to control points, collect and provide additional check points within the project area. The check points are used for independent check of accuracies and consist of OPUS points. Use the NGS Online Positioning User Service (OPUS) to determine point positions. Do not use these check points as part of georeferencing solution for the data. Submit a copy of the OPUS and GPS solution for each check point.
(a) For aerial imagery technologies, provide at least five check points within the project area. Provide a separate table describing the check points similar to the points you use to georeference the imagery. (See Table 3–1.)
(b) For LIDAR data projects:
(i) When using temporary or non-permanent survey ground control within or near the airport as airborne GPS base stations, tie to at least three NGS first-order horizontal and vertical and third-order or better vertical control. Constrain the stations in a 3D network adjustment to determine final positions and ellipsoid elevations. Submit GPS data to NGS Online User Positioning System (OPS) to verify the results of the network adjustment. Determine length of occupation using the standards in AC 150/5300-16.
14 Remote Sensing Project Planning

September 30, 2011 AC 150/5300-17C
(ii) ATLM technologies require field test apparatus.
a. Construct the Field/Test of the following materials and methods:
• A base plate or tube approximately 10 feet long. • Two (2) 6-inch diameter sections of PVC pipe, 8 feet long, (1) black-
color, (1) white-color. • Two (2) 4-inch diameter sections of PVC pipe, 8 feet long, (1) black-
color, (1) white-color. • Two (2) 2-inch diameter sections of PVC pipe, 8 feet long, (1) black-
color, (1) white-color. • Mount all the PVC sections vertically to the base plate/support as
plumb as possible. Equally space the sections across the base plate. The base plate must have two marks, one at each end, to geographically locate the test apparatus once installed in the survey area.
Figure 2-9 shows an example of the Field/Test Apparatus deployed in survey area, stabilized by supports and weights. (Source: “Light Detection and Ranging (LIDAR) Requirements” at the NGS/NOAA Web site, http://www.ngs.noaa.gov.)
Figure 2-9 Field/Test Apparatus Deployed in Survey Area and Stabilized
Using an appropriate GPS Survey grade receiver, collect the position of each end of the support base and process the information through the NGS OPUS to derive the geographic position of each end of the support.
b. Field/Test Apparatus Placement. To the extent practicable, locate the test device in a safe, flat, level terrain, an open area, within a normal section of the survey area. Support the structure if necessary by sand bags or other means so the device will remain erect and stable in windy conditions and so it is not prone to be toppled by passers-by others.
c. Flight Regime. The data provider must use the standard mission parameters planned for the survey. Do not collect extra data of the test apparatus location, and do not use any special maneuvers or flight lines to enhance or “densify” data distribution on the test object.
Remote Sensing Project Planning 15

AC 150/5300-17C September 30, 2011
d. Field/Test Apparatus data analysis. Provide the results to the FAA (including the OPUS results for the positioning of the end points) for analysis of the test data to determine of the following:
o The number and intensity of LIDAR returns from each vertical component of the device
o The vertical point spacing/density o The differences between the known top elevations of the
vertical components of the device and the elevations determined from the LIDAR data
o The ability to resolve each vertical component
j. For MCLM technologies, incorporate targets occupying known horizontal and vertical control in MCLM surveys to serve as known control points for point cloud adjustment and validation points for QA/QC. Bracket the scanned area on both sides of project area with scan control (local transformation) points at a maximum of 1500-foot stationing intervals. Validation points should be on both sides of the scanned area, at centerline stationing intervals not exceeding 500 feet for Type A MCLM surveys. Type B MCLM control and validation points should be placed at a maximum of 2400-foot and 800-foot stationing intervals respectively. Targets should be located as close to the MCLM vehicle path possible without compromising safety. The MCLM vehicle operators should adjust the vehicle speed at the target area so that the targets will be scanned at sufficient density to ensure good target recognition.
Figure 2-10 depicts the typical MCLM Type A local transformation and validation point layout.
Figure 2-10 Typical MCLM Type A Scan Control Points Layout
k. For TLM technologies, locate control points prior to the scanning campaign. Because the acquisition geometry of TLM scanner systems is radial, it is necessary to establish control points lying within regions of overlap between scanner stations and position reflectors to the geometry (See Figure 2-9). The scanner stations can also be used as part of the survey control by either replacing the scanner head with a survey target or collecting the position of the station using a total station or by using a high-quality GPS solution for the scanner station. TLM systems should use Real Time Kinematic (RTK) GPS base stations where appropriate to maintain/increase resolution and precision.
16 Remote Sensing Project Planning
September 30, 2011 AC 150/5300-17C
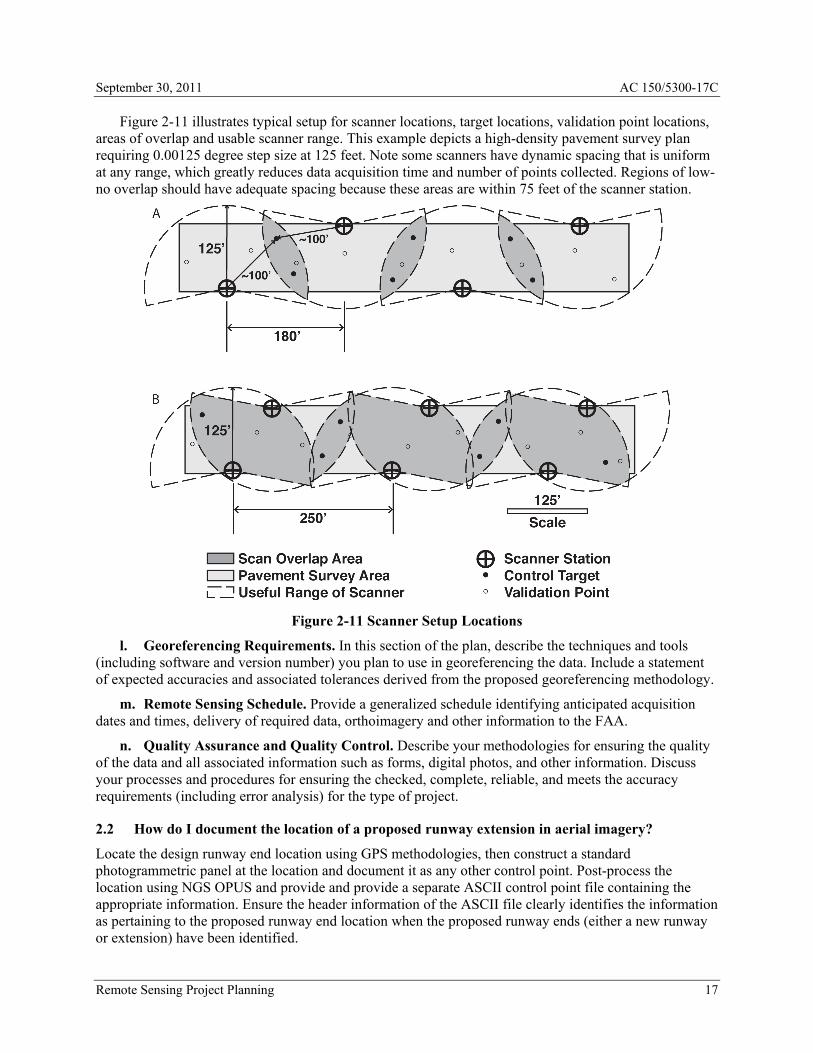
Figure 2-11 illustrates typical setup for scanner locations, target locations, validation point locations, areas of overlap and usable scanner range. This example depicts a high-density pavement survey plan requiring 0.00125 degree step size at 125 feet. Note some scanners have dynamic spacing that is uniform at any range, which greatly reduces data acquisition time and number of points collected. Regions of low-no overlap should have adequate spacing because these areas are within 75 feet of the scanner station.
Figure 2-11 Scanner Setup Locations
l. Georeferencing Requirements. In this section of the plan, describe the techniques and tools (including software and version number) you plan to use in georeferencing the data. Include a statement of expected accuracies and associated tolerances derived from the proposed georeferencing methodology.
m. Remote Sensing Schedule. Provide a generalized schedule identifying anticipated acquisition dates and times, delivery of required data, orthoimagery and other information to the FAA.
n. Quality Assurance and Quality Control. Describe your methodologies for ensuring the quality of the data and all associated information such as forms, digital photos, and other information. Discuss your processes and procedures for ensuring the checked, complete, reliable, and meets the accuracy requirements (including error analysis) for the type of project.
2.2 How do I document the location of a proposed runway extension in aerial imagery?
Locate the design runway end location using GPS methodologies, then construct a standard photogrammetric panel at the location and document it as any other control point. Post-process the location using NGS OPUS and provide and provide a separate ASCII control point file containing the appropriate information. Ensure the header information of the ASCII file clearly identifies the information as pertaining to the proposed runway end location when the proposed runway ends (either a new runway or extension) have been identified.
Remote Sensing Project Planning 17

AC 150/5300-17C September 30, 2011
2.3 What are the requirements for horizontal and vertical ties to the NSRS?
a. Tie all imagery control points to the National Spatial Reference System (NSRS) horizontally using the North American Datum of 1983 (NAD 83) and vertically using the North American Vertical Datum of 1988 (NAVD 88). Use the most current adjustment of NSRS. In Alaska and other areas outside the continental United States where NAVD 88 benchmarks are not available, contact the National Geodetic Survey (NGS) for further guidance.
b. The accuracy requirements for image photo control points shall meet a minimum accuracy of 1 foot (0.3 meters) horizontally and a vertical accuracy of 4 inches (0.1 meter) relative to the NSRS.
2.4 Can I use LIDAR to perform an obstruction analysis?
As a fairly recent and rapidly evolving technology, the FAA limits the use of LIDAR in collecting airport data and requires certain additional requirements and supporting documentation. You may use LIDAR technologies (specifically ATLM) in the capture of data supporting an obstruction analysis. See more about using LIDAR in obstruction analysis in the section and Figure 5-1.
2.5 Can I use LIDAR to collection airport features that are non-airport related?
The FAA is continuing its research into the use of LIDAR in airport data collection and will update these standards as appropriate. LIDAR mapping can collect many airport data elements listed in AC 150/5300-18. However, any single technology will not capture all feature classes. Key factors include the view angle and the positional accuracy requirements for individual features. For example, ATLM can detect with sub-meter precision objects viewed from the nadir position, vertical surfaces or objects smaller than 12 - 16 inches that cannot be adequately captured). Supplemental data collection will always need a separate sensor or other surveying technologies. Furthermore, any LIDAR-acquired data require post-processing interpretation, and the FAA must pre-approve any automated feature class recognition software. You must check the results for accuracy by comparing digital photography, or by spot-checking results at the survey site, or both.
2.6 What are the data delivery requirements for remote sensing projects?
Deliver all data on removable media such as a DVD clearly labeled with the following information; Project Name, Collection Dates, Data Provider’s name, and disk Contents. Deliver all project removable media to the FAA at the following address.
FAA Airport Engineering Division (AAS-100) Airport Surveying-GIS Program Manager 800 Independence Avenue, Suite 621 Washington DC, 20591 Front Office Phone: 202-267-7669
18 Remote Sensing Project Planning

September 30, 2011 AC 150/5300-17C
Chapter 3. Aerial Imagery Specific Standards and Recommended Practices
3.1 What is the timeframe for imagery acquisition?
Acquire imagery for use in planning, design, construction, or analysis activities within 6 months of intended use. This short time frame ensures the imagery accurately depicts the environment on and surrounding the airport. The decision for extending the use of aerial imagery beyond the 6-month period should be made by the ADO with the airport sponsor’s input. Generally, if vegetation growth or construction surrounding the airport is not significant or can be accounted for, re-using the imagery at 7-12 months is acceptable. The decision rests with the local ADO and airport sponsor who know the airport and environment best.
3.2 Do we capture the imagery in a leaf-on or leaf-off condition?
The determining factor of leaf-on or leaf-off condition in the acquisition of the imagery is a function of the project. If the project requires an Airport Airspace Analysis, then full leaf-on conditions are required. If the purpose of the imagery supports a project (such as an engineering or planning project) not requiring Airport Airspace Analysis, then the acquisition in a leaf-off condition is acceptable. The data provider should identify in the remote sensing plan if the imagery collection is leaf-on or leaf-off. This may require flights in both conditions to meet the project objective, however in most cases flying leaf-on is the preferred condition. The FAA reserves the right to accept or reject the data.
3.3 What are the equipment and supplies requirements when using aerial imagery technologies?
The consultant should take care in proposing the camera. All cameras are different, and poor quality image features and/or inability to accurately measure features will be cause for rejection and possible re-flight.
a. Frame (Film-based) Cameras 230 millimeters. A single lens metric camera must provide an equivalent resolution to or exceeding the capabilities of a Wild RC 30 or Z/I Imaging RMK-TOP 15, with forward motion compensation. The lens must have an area-weighted average resolution (AWAR) of at least 85.0 lines per millimeter. An AWAR ≥100 is preferred.
b. Aerial Film. Use high-resolution color negative aerial film to obtain aerial imagery. Film types such as Kodak 2444 or AGFA Aviphot X-100 are preferred for their proven ability to consistently meet quality and contract requirements. The low-contrast target resolution of color negative emulsions must be rated at greater than or equal to 80 line pairs per millimeter (lp/mm). Emulsion and filter combinations selected must be sensitive to and record on the film the green, yellow, orange, and red hues of the tree leaf canopy.
c. Photogrammetric Scanner. Convert aerial film to raster imagery on photogrammetric scanners with high geometric accuracy capable of producing scan pixel size of 15 microns or less. Identify the type of scanner you intend to use in the remote sensing plan.
d. Large-format Frame Digital Cameras. Digital cameras with high quality frame imagery such as the Zeiss DMC, Ultracam, DDS, or equivalent system are permissible but require approval on a case–by-case basis. The sensor must be geometrically stable and have a calibrated system suitable for high-accuracy photogrammetric mapping. The sensor must provide a high enough resolution and have a large Field of View (FOV) to meet the project requirements.
Aerial Imagery Specific Standards and Recommended Practices 19
AC 150/5300-17C September 30, 2011
e. Flight Planning.
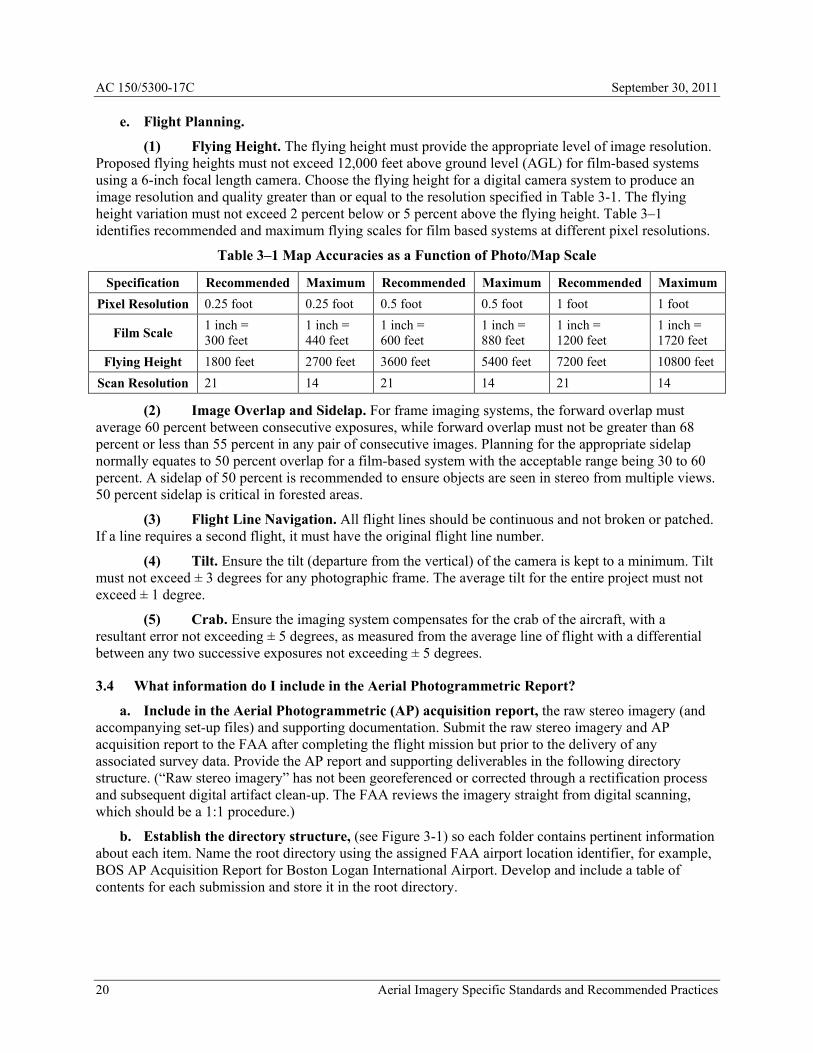
(1) Flying Height. The flying height must provide the appropriate level of image resolution. Proposed flying heights must not exceed 12,000 feet above ground level (AGL) for film-based systems using a 6-inch focal length camera. Choose the flying height for a digital camera system to produce an image resolution and quality greater than or equal to the resolution specified in Table 3-1. The flying height variation must not exceed 2 percent below or 5 percent above the flying height. Table 3–1 identifies recommended and maximum flying scales for film based systems at different pixel resolutions.
Table 3–1 Map Accuracies as a Function of Photo/Map Scale
Specification Recommended Maximum Recommended Maximum Recommended Maximum Pixel Resolution 0.25 foot 0.25 foot 0.5 foot 0.5 foot 1 foot 1 foot
Film Scale 1 inch = 300 feet
1 inch = 440 feet
1 inch = 600 feet
1 inch = 880 feet
1 inch = 1200 feet
1 inch = 1720 feet
Flying Height 1800 feet 2700 feet 3600 feet 5400 feet 7200 feet 10800 feet Scan Resolution 21 14 21 14 21 14
(2) Image Overlap and Sidelap. For frame imaging systems, the forward overlap must average 60 percent between consecutive exposures, while forward overlap must not be greater than 68 percent or less than 55 percent in any pair of consecutive images. Planning for the appropriate sidelap normally equates to 50 percent overlap for a film-based system with the acceptable range being 30 to 60 percent. A sidelap of 50 percent is recommended to ensure objects are seen in stereo from multiple views. 50 percent sidelap is critical in forested areas.
(3) Flight Line Navigation. All flight lines should be continuous and not broken or patched. If a line requires a second flight, it must have the original flight line number.
(4) Tilt. Ensure the tilt (departure from the vertical) of the camera is kept to a minimum. Tilt must not exceed ± 3 degrees for any photographic frame. The average tilt for the entire project must not exceed ± 1 degree.
(5) Crab. Ensure the imaging system compensates for the crab of the aircraft, with a resultant error not exceeding ± 5 degrees, as measured from the average line of flight with a differential between any two successive exposures not exceeding ± 5 degrees.
3.4 What information do I include in the Aerial Photogrammetric Report?
a. Include in the Aerial Photogrammetric (AP) acquisition report, the raw stereo imagery (and accompanying set-up files) and supporting documentation. Submit the raw stereo imagery and AP acquisition report to the FAA after completing the flight mission but prior to the delivery of any associated survey data. Provide the AP report and supporting deliverables in the following directory structure. (“Raw stereo imagery” has not been georeferenced or corrected through a rectification process and subsequent digital artifact clean-up. The FAA reviews the imagery straight from digital scanning, which should be a 1:1 procedure.)
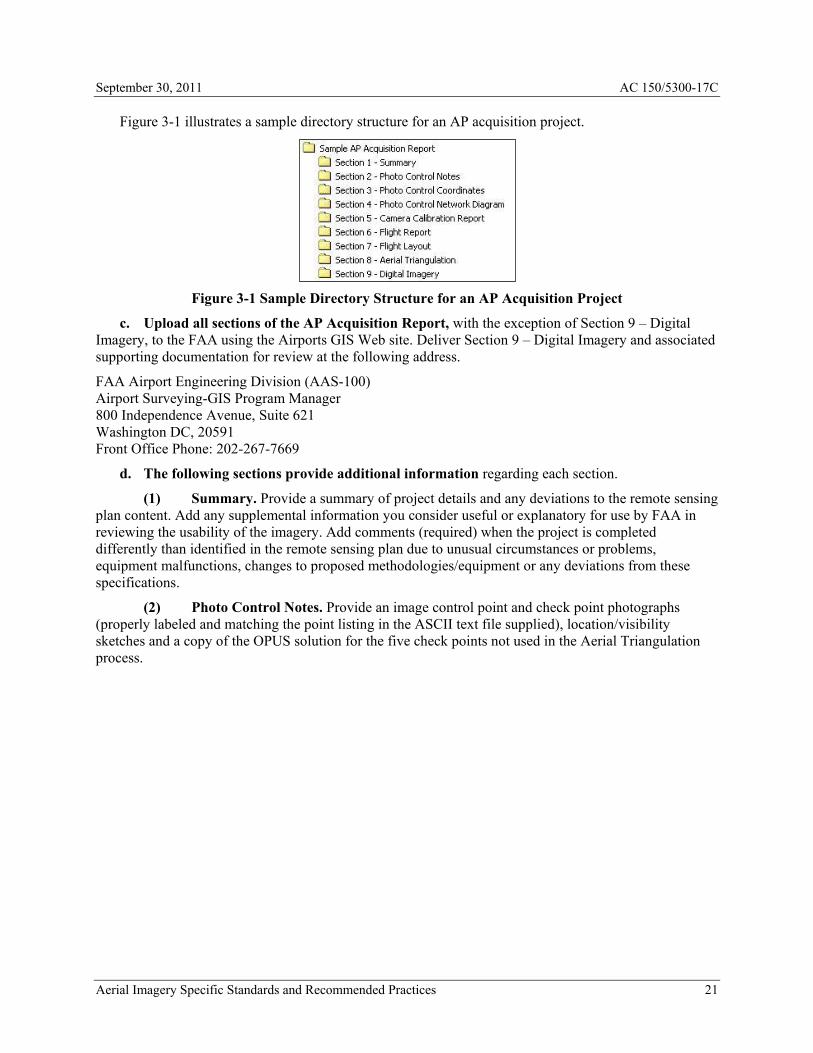
b. Establish the directory structure, (see Figure 3-1) so each folder contains pertinent information about each item. Name the root directory using the assigned FAA airport location identifier, for example, BOS AP Acquisition Report for Boston Logan International Airport. Develop and include a table of contents for each submission and store it in the root directory.
20 Aerial Imagery Specific Standards and Recommended Practices
September 30, 2011 AC 150/5300-17C
Figure 3-1 illustrates a sample directory structure for an AP acquisition project.
Figure 3-1 Sample Directory Structure for an AP Acquisition Project
c. Upload all sections of the AP Acquisition Report, with the exception of Section 9 – Digital Imagery, to the FAA using the Airports GIS Web site. Deliver Section 9 – Digital Imagery and associated supporting documentation for review at the following address.
FAA Airport Engineering Division (AAS-100) Airport Surveying-GIS Program Manager 800 Independence Avenue, Suite 621 Washington DC, 20591 Front Office Phone: 202-267-7669
d. The following sections provide additional information regarding each section.
(1) Summary. Provide a summary of project details and any deviations to the remote sensing plan content. Add any supplemental information you consider useful or explanatory for use by FAA in reviewing the usability of the imagery. Add comments (required) when the project is completed differently than identified in the remote sensing plan due to unusual circumstances or problems, equipment malfunctions, changes to proposed methodologies/equipment or any deviations from these specifications.
(2) Photo Control Notes. Provide an image control point and check point photographs (properly labeled and matching the point listing in the ASCII text file supplied), location/visibility sketches and a copy of the OPUS solution for the five check points not used in the Aerial Triangulation process.
Aerial Imagery Specific Standards and Recommended Practices 21
AC 150/5300-17C September 30, 2011
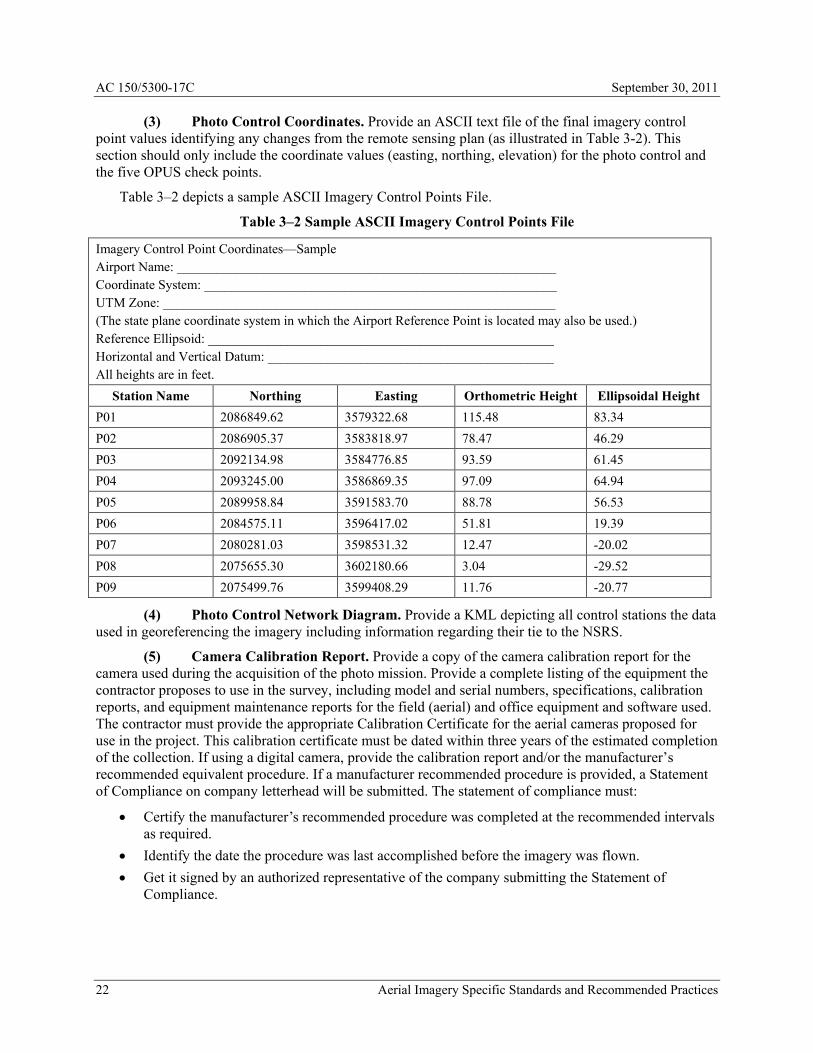
(3) Photo Control Coordinates. Provide an ASCII text file of the final imagery control point values identifying any changes from the remote sensing plan (as illustrated in Table 3-2). This section should only include the coordinate values (easting, northing, elevation) for the photo control and the five OPUS check points.
Table 3–2 depicts a sample ASCII Imagery Control Points File.
Table 3–2 Sample ASCII Imagery Control Points File
Imagery Control Point Coordinates—Sample Airport Name: _________________________________________________________ Coordinate System: _____________________________________________________ UTM Zone: ___________________________________________________________ (The state plane coordinate system in which the Airport Reference Point is located may also be used.) Reference Ellipsoid: ____________________________________________________ Horizontal and Vertical Datum: ___________________________________________ All heights are in feet.
Station Name Northing Easting Orthometric Height Ellipsoidal Height P01 2086849.62 3579322.68 115.48 83.34 P02 2086905.37 3583818.97 78.47 46.29 P03 2092134.98 3584776.85 93.59 61.45 P04 2093245.00 3586869.35 97.09 64.94 P05 2089958.84 3591583.70 88.78 56.53 P06 2084575.11 3596417.02 51.81 19.39 P07 2080281.03 3598531.32 12.47 -20.02 P08 2075655.30 3602180.66 3.04 -29.52 P09 2075499.76 3599408.29 11.76 -20.77
(4) Photo Control Network Diagram. Provide a KML depicting all control stations the data used in georeferencing the imagery including information regarding their tie to the NSRS.
(5) Camera Calibration Report. Provide a copy of the camera calibration report for the camera used during the acquisition of the photo mission. Provide a complete listing of the equipment the contractor proposes to use in the survey, including model and serial numbers, specifications, calibration reports, and equipment maintenance reports for the field (aerial) and office equipment and software used. The contractor must provide the appropriate Calibration Certificate for the aerial cameras proposed for use in the project. This calibration certificate must be dated within three years of the estimated completion of the collection. If using a digital camera, provide the calibration report and/or the manufacturer’s recommended equivalent procedure. If a manufacturer recommended procedure is provided, a Statement of Compliance on company letterhead will be submitted. The statement of compliance must:
• Certify the manufacturer’s recommended procedure was completed at the recommended intervals as required.
• Identify the date the procedure was last accomplished before the imagery was flown. • Get it signed by an authorized representative of the company submitting the Statement of
Compliance.
22 Aerial Imagery Specific Standards and Recommended Practices

September 30, 2011 AC 150/5300-17C
(6) Flight Report. Provide an Imagery Flight Report using the Photographic Flight Report form available at http://airports-gis.faa.gov. Figure 3-2 shows the form. Follow the instructions below to complete it.
Figure 3-2 Photographic Flight Report Form
• Date. Enter the date the film is first loaded into the cassette of magazine. Print “LOADED” and Date.
• Roll Number. Enter year, camera system designator, film type (CN = Color Negative), and sequential roll number for that calendar year.
• Emulsion Number. Enter the number taken directly from the film can upon loading. • Expiration Date. Enter the date taken from film can upon loading. • Sheet Number. Enter X of Y sheets. For example, 1 of 4, 2 of 4, and so on. • Film Type. Enter color, color negative, other. • ISO Index. Enter film speed actually used (not EAFS from film can). • Filter. Enter wavelength of filter used, in nanometers. • Cassette/Magazine. Enter feed and take-up cassettes or magazine identification number. • Camera/Drive Unit Numbers. Enter camera identification number or lens serial number/drive unit
number. • Mission Number. Enter aircraft type. For example, Cessna Citation II. • Aircraft. Enter aircraft tail number. For example, N52RF. • Pilot. Print the surname. • Copilot. Print the surname. • Photographer. Print the surname.
Aerial Imagery Specific Standards and Recommended Practices 23

AC 150/5300-17C September 30, 2011
• Date and Line Number. Enter date of photography (month, day, year), flight line number (30-002, indicating a scale of 1:30,000 and Line No. 2). Add note “NEW DAY” to indicate a date change. Place near the date entry.
• GMT/Local Time. Enter Coordinated Universal Time or GMT in hours and minutes and associated local time.
• Comp Head/Drift. Enter the magnetic heading in degrees/variances in degrees left or right of the path of the aircraft and ground tracking over the planned flight line.
• Add Numbers. Enter the first and last frame numbers of the line. • Number of Exposures. Leave blank. • Visibility. Enter distance in statute miles out from the aircraft, in the direction of the sun, at which
tree crowns are still separately discernable. • Clouds. Enter an estimate of cloud cover from choices at the end of the photographic flight report. • Temperature. Enter the temperature in degrees Celsius at the time of the photography. • Altitude. Enter feet above ground level (AGL) over airports. • Vacuum. Enter vacuum reading from gauge or from camera display panel (600 millimeter waves,
or nominally 64 MB standard). • Shutter. Enter speed of shutter during line of photography. Enter, if in automatic mode, variances
in shutter speeds (450-550). • Aperture. Enter the actual aperture used. Use the final adjustment from camera indicator, not the
base exposure from an automatic light meter. • Rheostat. Enter the rheostat setting as a function of the ISO. For example, “per xxx ISO.” • Endlap. Enter the planned percentage of endlap as a whole number: 60, 80, and so on. • Number of Blanks to Start of Roll. Enter. “6” is standard. • Meter Readings. Record the automatic light meter readings. For example, 4 @ 1000. • Crab. Provide the crab angle of the aircraft during acquisition. • Tilt. Provide the camera tilt (departure from vertical) during acquisition. • Sun Angle. Record the sun angle at the time of acquisition. • Overlap/Sidelap. Enter the planned percentage of overlap and sidelap as a whole number : 60, 80,
and so on. • Remarks. Describe the terrain, local ambient conditions, and any abnormalities.
(7) Flight Layout. Provide a Flight Layout diagram showing “actual” flight line length, direction of flight, flight line number, exposure numbers on the flight line and any deviations from original flight mission plan. Provide this as an active KML file.
(8) Aerial Triangulation. Provide an ASCII file (as in the Table 3–3) containing camera focal length and the X, Y, Z, omega, phi, and kappa of each image. Provide the information in the Universal Transverse Mercator (UTM) or State Plane Coordinate System, NAD-83. Specify the Zone used and include with the submitted file this information:
• Strip Number • Image Number • Easting specified in the coordinate system Unit of Measure (UoM) to the hundredth • Northing specified in the coordinate system UoM to the hundredth
24 Aerial Imagery Specific Standards and Recommended Practices

September 30, 2011 AC 150/5300-17C
• Orthometric Height specified in UoM to the hundredth • Omega specified in decimal degrees to six (6) decimal places • Phi specified in decimal degrees to six (6) decimal places • Kappa specified in decimal degrees to six (6) decimal places • Final adjusted Aerial Triangulation report showing RMSE
Table 3–3 shows the proper formatting for submission to NGS of the geo-referencing information for the imagery.
Table 3–3 Sample ASCII Image File
ASCII Image File (Results of the Geo referencing) —Sample
GEO-REFERENCING RESULTS Header Information:_____________________________________________________ Airport Name: _________________________________________________________ UTM Coordinate Zone: __________________________________________________ (Must match the system and zone used to report ground image control points) Reference Ellipsoid: ____________________________________________________ Horizontal and Vertical Datum: ___________________________________________ Camera Focal Length:___________________________________________________ Strip# Image# Easting
(Meters) Northing (Meters)
Ortho Height (NAVD 88)
Omega Phi Kappa (Angles are decimal degrees; ground to photo)
1 1 3579254.35 2089643.60 3824.12 -1.201358 1.010730 -68.873243 1 2 3580688.07 2087953.67 3823.95 -1.162651 2.000519 -68.884133 1 3 3582126.18 2086260.81 3829.93 -1.004605 1.100225 -68.882666 2 1 3582017.30 2092108.36 3821.09 -0.006452 0.003406 112.853920 2 2 3583490.60 2090446.64 3833.50 0.009585 1.006764 112.852786 2 3 3584965.37 2088806.15 3825.61 -1.219045 -1.003069 112.846104
(9) Digital Imagery. Provide digital stereo imagery (and supporting set up files) of the area of analysis. The extent of aerial imagery coverage depends on the type of survey the contractor is requested to perform.
(10) Imagery Captured on Film. Provide scanning pixel size value in dots per inch (DPI) or microns (µm). Include a summary of quality assurance test results.
(11) Stereo Imagery Deliverable. All Stereo Imagery must be free of abrasions, blemishes, scratches, tears, and irregularities and conform to the following requirements:
(a) Delivery medium. DVD.
(b) Stereo Image File Format. (Uncompressed) TIFF (Tagged Image File Format) or VITec Scanner Raster Format. Match the naming and numbering of images to listings in the aerial triangulation report.
(12) You must develop and provide a Station Location and Visibility Diagram for each control point using the form available in the Surveyors section of the Airports GIS Web site at http://airports-gis.faa.gov. Sketch on the form the area surrounding the control point.
Aerial Imagery Specific Standards and Recommended Practices 25

AC 150/5300-17C September 30, 2011
(13) Take a sufficient number of digital photos of the station as prepared to support the data acquisition, as in Figure 2-5. Electronically add to the photo a caption to uniquely identify it. Include the filenames of the digital images for the station in the sketch section of the appropriate Station Location and Visibility form.
26 Aerial Imagery Specific Standards and Recommended Practices
September 30, 2011 AC 150/5300-17C
Chapter 4. Digital Orthoimagery Standards and Recommended Practices
4.1 Data Content Standard.
Develop the orthoimagery using the specifications defined by the Federal Geographic Data Committee (FGDC) in FGDC-STD-008-1999, but do not resample the imagery. Provide FGDC standard FGDC-STD-008-1999 compliant metadata for the orthoimagery.
4.2 Coverage.
Create digital orthoimagery as individual tiles comprising a mosaic covering the extent of the entire project area. Use an appropriate tile size. The U.S. Geologic Survey requests 1500 x 1500 meters.
4.3 Ground Sample Distance.
Develop orthoimagery at the resolution of the original imagery used for analysis with a pixel ground sampled distance (GSD) between 0.25 feet and 1.0 feet (7.5 – 30 centimeters), as consistent with current industry practices. During the orthoimagery production process, the input GSD should be smaller than or equal to the final output GSD. DO NOT attempt to resample imagery to a smaller GSD.
4.4 Horizontal Positional Accuracy Testing and Reporting.
Horizontal accuracy of orthoimagery must, at a minimum, meet RMSE as outlined in Table 3-1 Map Accuracies as a Function of Photo/Map Scale in this AC at the 95 percent confidence level. Positional accuracy shall be tested and reported following the guidance in the National Standard for Spatial Data Accuracy (FGDC-STD-007.3-1998). NSSDA certification typically requires a minimum of 20 check points. FAA guidelines for Imagery Acquisition currently only require six checkpoints.
4.5 Deliverable Requirements.
You must develop and provide digital orthophotos for all projects using aerial or satellite imagery technologies. For projects using LIDAR technologies, supplying the point cloud fulfills this requirement.
4.6 Orthoimagery Delivery.
Provide digital orthoimagery conforming to the following requirements:
a. Delivery medium. DVD.
b. File Image Format. (Uncompressed) TIFF (Tagged Image File Format).
c. Submit orthoimagery to:
FAA Airport Engineering Division (AAS-100) Airport Surveying-GIS Program Manager 800 Independence Avenue, Suite 621 Washington DC, 20591 Front Office Phone: 202-267-7669
Digital Orthoimagery Standards and Recommended Practices 27

AC 150/5300-17C September 30, 2011
Intentionally Left Blank
28 Digital Orthoimagery Standards and Recommended Practices
September 30, 2011 AC 150/5300-17C
Chapter 5. Light Imaging Detection and Ranging (LIDAR) Specific Standards
5.1 What are the differences in LIDAR technologies in the collection of airport data?
Selecting which LIDAR technology to survey airports requires you consider a broad range of factors. The following are some considerations.
a. Using ATLM technologies. ATLM considerations include the following factors. There may be others, so use your best judgment.
(1) No details below 20 centimeters. Most LIDAR instrumentation has a limited ability to capture detail below 20 centimeters, but the method is relatively fast. So LIDAR airborne surveys are ideal for capturing large facilities and defining an accurate framework of airport-related features. However, some features may be below the level of detection for LIDAR.
(2) Limited Look Angle. Airborne LIDAR is also limited by the look angle, which may be up to 20 degrees from vertical, looking forward of the aircraft. Some instruments are limited to a strictly nadir view. So airborne surveys benefit from multiple survey passes with differing flight line trajectories and from the integration of ground-based, higher-resolution equipment.
(3) Unpredictable Point Cloud Data Sets. Airborne LIDAR scanner systems are subject to errors in pointing, range, and elevation, same as other surveying technologies. Elevation precision for most systems is less than 4 to ~10 inches. Planimetric precision is similar for most systems. However, the technology is limited in the maximum number of points it can collect along and across the flight track. Typical values along track point spacing are ~12 to 16 inches with the across track point spacing being ~12 to 20 inches. Given these values, expect accuracy in the decimeter range for airborne survey point clouds. Moreover, given the minimum spacing of points, a single pass can capture features on the ground where the largest dimension of the object is greater than 28 to 36 inches in size. Flying repeat surveys with multiple look angles can improve capture resolution, but it is difficult to predict the complete representation of features in the final point cloud data set.
(4) Local Conditions and Survey Size. Collection and processing times depend highly on the size of the survey area and the distance necessary to mobilize the equipment to the scanning site. Any request to survey an airport should seek a local consultant to minimize mobilization costs. Processing data also requires a precise GPS base station solution to reference the data. Such solutions are regionally available. When suitable and available, your mission plan should adopt solutions for nearby permanent GPS solutions.
b. Using MCLM technologies. MCLM considerations include the following factors. There may be others, so use your best judgment.
(1) Accuracy Standards. Your equipment to collect MCLM data, control the data, and maintain quality control validation points must meet accuracy standards. Most MCLM systems use a time-of-flight approach to make spatial measurements and are accurate to ~2 to 20 inches. These accuracies are sufficient for capturing most airport related features at resolutions of ~4 to 39 inches.
Light Imaging Detection and Ranging (LIDAR) Specific Standards 29

AC 150/5300-17C September 30, 2011
(2) Adequate compute time for large data sets.Collection and processing times depend on survey design (resolution) and the size of the survey. Resolution data can easily max out most standard desktop configurations. You may need to generate a processed data product for feature documentation. With such large data sets, processing can take days to weeks. For example using MCLM-acquired data, an eight-mile stretch of freeway can be expected to take approximately 1 week to process into a finished deliverable point cloud and associated CADD or mesh model representation. Many airports will have considerably more paved surface than this stretch of road. Be sure to include processing time into their schedule.
c. Using TLM technologies. TLM considerations include the following factors. There may be others, so use your best judgment.
(1) Single-Pulse or Multi-Pulse Averaging. Most TLM systems are highly programmable and operate between two end-member modes: single pulse, or multi-pulse averaging. Single pulse systems are faster but have a larger range error. Multi-pulse systems will make three or more measurements and report an average point value after rejecting any outlier values.
(2) Scanner Mountings. Scanners can be tripod-mounted or mounted on a truck or an elevated boom. However, it should be noted, the factory specified accuracies are valid when the equipment is tripod-mounted. Vehicle mounted and boom-mounted systems are subject to sway or mid-scan movement related to wind, tire expansion, engine vibration. Most systems are battery or AC powered and are highly portable, although some systems (scanner, power supply, tripod, and accessories) may weigh over 100 pounds. Some systems come with internal GPS receivers with antennas of varying quality.
(3) Scanner Accuracy. It is important to note systems with GPS are only accurate to the millimeter level when combined with a local base-station solution. All systems produce XYZ point clouds. Some provide tools for mapping Red, Green, Blue (RGB) values, but these are never as accurate as the LIDAR data itself, meaning some points may not have the correct RGB value assigned. Depending on the design of the instrument, TLM systems have millimeter-to-centimeter scale precision and accuracy and can generate point clouds with sub-millimeter point spacing. In general, more precise systems use a focused beam design, limiting their maximum range. You must provide statements of certified accuracy and environmental or setup conditions that may limit scanner accuracy. For example, wood or aluminum tripods tend to expand in sunlight and can change the position of the scanner during scan acquisition.
(4) Processing Times. Collection and processing time depends on survey specifications and deliverables. To scan a flat, featureless seven-acre bare earth site at a resolution of three inches typically requires 8 hours to acquire the data with a 3,000 points/second acquisition rate. Processing this same data may require up to 12 additional hours to provide a 6-inch contour digital elevation model based on 25 - 30 million points.
30 Light Imaging Detection and Ranging (LIDAR) Specific Standards

September 30, 2011 AC 150/5300-17C
5.2 What are the basic considerations in using LIDAR to collect airport data?
LIDAR scanning technologies, regardless of type, are line-of-sight instruments and unable to detect what is not visible to the sensor. Be aware of your scanner’s limitations and local terrain variations, and plan your mission to cover any potential gaps or shadows in data coverage.
a. Multiple Look Angles. For ATLM systems, you may need multiple flight line orientations to form a grid survey. For MCLM and TLM systems, you must reposition the sensor around the object to acquire data from multiple orientations.
b. Multiple Resolutions and Managing Multiple Data Sources. ATLM systems can scan geometries at the decimeter scale with centimeter scale precision. MCLM and TLM systems can typically capture data at centimeter scale resolution, and in some cases millimeter scale precision. Data from different sources produces a point cloud where resolution can be tailored based on the desired capture resolutions of individual features within a survey area. Therefore, plan your survey to combine the different data acquisition techniques. You must include common georeferenced control points to ensure alignment in the final data set.
c. GNSS Survey Planning. Both ATLM and MCLM depend on continuous high-quality GNSS position solutions for georeferencing during collection. As a result, plan your data acquisitions during periods of good satellite visibility and low solar and geophysical variability. Or include additional control surveys. TLM is more resilient to poor GNSS availability because they use additional control surveys before or after LIDAR data acquisition.
d. Point Cloud Processing. There are a variety of commercial and in-house applications to register, classify, feature-extract, and model data sets. This AC does not attempt a generic overview. Just be sure to record all details of the process as a final deliverable. In some cases, you may need to develop new tools and processes to meet specific project goals. Be sure to document their performance, testing, and quality assurance processes to ensure data quality.
5.3 Why must I calibrate LIDAR systems?
Inadequate calibration or incomplete calibration reports may cause the FAA to reject your data. Provide calibration reports for all LIDAR systems used from beginning to end.
Sensor calibration reduces or eliminates systematic errors in the LIDAR data. Specifically, the calibration procedures involve solving for a set of calibration parameters to minimize the mean square error using ground control and data in overlapping swaths. The specific calibration parameters are a function of the optical sensor model, but may include roll, pitch, and range offsets, scanner scale, offset, or higher order polynomial coefficients. If performed properly, calibration ensures the highest possible data accuracy and eliminates artifacts in the data such as discontinuities (vertical jumps) in swath overlap areas near the edges of scan lines, horizontal offsets between positions in data from opposing flight lines. Prepare and document the results of this calibration for each project, or every month, or as dictated by analysis of the data, whichever interval is shortest. Additionally, document any calibration procedure employing software and reports generated by the software. Include a basic description of the software.
Lab-calibrate the airborne LIDAR system if the manufacturer deems it necessary. System calibration in aircraft is needed whenever the sensor is removed/reinstalled, serviced, or whenever data indicates misalignment, range issues, or other errors.
Light Imaging Detection and Ranging (LIDAR) Specific Standards 31

AC 150/5300-17C September 30, 2011
Radiometric Performance/Certification is necessary for all LIDAR scanners. The system electronics process signals at the speed of light and are therefore very sensitive. The sensors commonly use mechanical systems to direct the laser light pulses and require stepper motors capable of changing mirror positions in microdegrees. Both systems can wear and require calibration or servicing on a regular basis. All LIDAR equipment must meet factory certification.
5.4 What are the system calibration requirements for using LIDAR to collect airport data?
a. ATLM Calibration. Factory calibration of the LIDAR system must address both radiometric and geometric performance and calibration. (It does not eliminate the need for the radiometric qualification test for obstruction surveying.) The following briefly describes the parameter testing according to the manufacturer’s test procedures. Some procedures and parameters may be unique to a manufacturer.
(1) Radiometric Calibration (Sensor Response).
(a) Ensure the output of the laser meets specifications for pulse energy, pulse width, rise time, frequency, and divergence for the model of LIDAR being tested against the manufacturer’s published specifications.
(b) Measure the receiver response from a reference target to ensure the response level of the receiver is within specification for the model of LIDAR system being tested against the manufacturer’s specifications.
(c) Check the alignment between transmitter and receiver and certify the alignment is optimized and within the manufacturer’s published specifications.
(d) Measure T0 response of receiver (that is, the response at the time the laser is fired) to ensure the T0 level meets the manufacturer’s published specifications.
(2) Geometric Calibration. Determine rangefinder calibrations, including first/last range offsets, temperature dependence, and frequency offset of rangefinder electronics, range dependence on return signal strength. Provide updated calibration values.
(3) Scanner Calibration. Verify the scanner passes accuracy and repeatability criteria. Provide updated scanner calibration values for scanner offset and scale.
(4) Position Orientation System (POS) - Laser Alignment. Check the alignment of the output beam and POS. Also, provide updated POS misalignment angles.
b. MCLM Calibration. Scanning equipment used for airport survey applications should have a current certificate of calibration provided from the scanner manufacturer or certified accuracy established by a locally licensed surveyor. Any certification documentation should not be dated older than 6 months prior to instrument deployment date. If a certificate of calibration is provided by a licensed surveyor, the certificate must be accompanied by a description of calibration method, scanner precision and accuracy capabilities, and a description of maximum usable range and related instrument error that is a function of range. Any scanner used for airport survey applications must have a maximum range error of 15 millimeters at 100-meter range and a maximum positional error of 20 millimeters. Errors tend to increase as a function of range: the larger the beam divergence, the shorter the effective range of the scanner instrument. Scanners used for mapping airports should have a maximum divergence of 0.001 degree.
32 Light Imaging Detection and Ranging (LIDAR) Specific Standards

September 30, 2011 AC 150/5300-17C
5.5 What are the specific requirements for Airborne Terrestrial LIDAR Mapping (ATLM) sensors?
a. Data Acquisition Standards.
(1) Position Dilution of Precision (PDOP) and Vertical Dilution of Precision (VDOP) must be less than 3.
(2) Horizontal along-track and across-track LIDAR point spacing must not exceed the limits specified in Table 5-1, which spells out the horizontal and vertical point spacing requirements for ATLM sensors.
Table 5–1 LIDAR Data Acquisition Point Spacing Parameters
Maximum Across-Track Horizontal Point Spacing 7 inches (18 centimeters) Maximum Along-Track Horizontal Point Spacing 7 inches (18 centimeters) Maximum Vertical Point Spacing (Tilted Sensor only) 18 inches (50 centimeters) Corresponding Point Density 30 points / square meter1 1 Use a helicopter to meet this specification. Flight line overlap should be a minimum of 50 percent each for adjacent flight lines. Parameters are based on aircraft altitude and aircraft speed.
(3) Vertical point spacing shall not exceed the limits specified in Table 5-1.
(4) Aircraft bank angle must not exceed 20 degrees.
(5) Ensure the flying height provides a high-probability of object detection, it is typically desirable to fly as low as possible, within the applicable eye-safety limits. Depending on the airport and the minimum eye-safe altitude, this may necessitate airspace coordination.
Light Imaging Detection and Ranging (LIDAR) Specific Standards 33
AC 150/5300-17C September 30, 2011
(6) Adjacent swaths must have a minimum overlap of 50 percent of the mean swath width. Overlap should be sufficient to fully capture tall objects within the proposed survey. Figure 5-1 illustrates a proposed flight plan failing to adequately capture Tower A. You could shift left of the flight line or increase the overlap between flight lines to provide a predictable maximum height of data capture.
Figure 5-1 Proposed Flight Plan Fails to Capture Tower A
(7) Fly flight lines in either direction. However, fly adjacent, parallel flight lines in opposite directions (reciprocal aircraft headings) to aid in eliminating systematic errors.
(8) Using LIDAR as a supporting tool in obstacle analysis, fly at least one cross-line (orthogonal to the “primary” flight lines) per runway approach. Cross flights are necessary to align the strips of data.
(9) Use a special test device within the survey area as a means of validating the system performance. The device will simulate real-world conditions of objects with the potential to intersect and protrude above the Obstacle Identification Surface and should be detectable by the LIDAR sensor. Point-cloud data of the object should appear in the complete data-set. See Figure 2-9 Field/Test Apparatus Deployed in Survey Area and Stabilized, for construction and installation details.
b. Waveform Digitization. Full-waveform data is highly recommended. Research by the National Geodetic Survey (NGS) shows full-waveform LIDAR data provides significantly more information about vertical structures. This extra definition helps detect and recognize objects in the project area. If you plan to acquire full-waveform data, submit a description of the waveform post-processing strategy to the FAA as part of the remote sensing plan.
34 Light Imaging Detection and Ranging (LIDAR) Specific Standards

September 30, 2011 AC 150/5300-17C
5.6 What are the specific requirements for MCLM sensors?
a. Redundancy. Conduct the MCLM data capture to ensure data redundancy. Collect the data with an overlap of at least 20 percent between scans. Allow sufficient time to elapse between successive runs to ensure the satellite constellation accesses at least three different satellites between runs.
b. Monitoring Acquisition. Monitoring various component operations during the scan session is an important step in the QA/QC process. The system operator should be aware and note when the system encountered the most difficulty and be prepared to take appropriate action in adverse circumstances.
Monitor the MCLM equipment throughout the data collection to track the following as well as any other factors requiring monitoring:
• Loss of GNSS reception • Distance traveled with, or time duration of, uncorrected Inertial Measurement Unit (IMU) drift • Proper functioning of the laser scanner • Vehicle Speed
c. Local Transformation Points and Control Points. Perform a local transformation of the point clouds to increase the accuracy of the collected and adjusted geospatial data. Most common is a least-squares adjustment of the horizontal and vertical residuals between established local transformation points and the corresponding values from the point clouds to produce the transformation parameters of translation, rotation, and scale for the horizontal values and an inclined plane for the vertical values. Apply these parameters to the point cloud for more accurate final geospatial data.
• Type A MCLM surveys require local transformation and control points to have positional accuracies of ≤ 0.03 feet horizontally and ≤ 0.02 feet vertically or better.
• Type B MCLM surveys require local transformation and control points to have horizontal and vertical positional accuracies of ≤ 0.10 feet or better.
Determine accuracies with field verification methods. The feature types and capture size should dictate the appropriate methodology.
d. Data Processing. Data processing for MCLM systems is similar to processing airborne LIDAR data. Clean and filter the data to remove errors. Georeference the data based on the Inertial Measurement Unit (IMU) and GPS data collected during acquisition. Then classify the data into applicable classes. As practicable, auto-classify buildings, bare earth, and vegetation. However, because the look angle is horizontal through vegetative cover, the signal may not successfully capture bare earth through thick vegetation.
e. Data Filtering and Clean-up. Objects passing through the survey generate isolated points. Remove them. Some errors are only detectable after multiple passes, so make as many passes as needed to ensure reliable error interpretation.
f. Georeferencing. MCLM systems come with processing tools to resolve vehicle motion using IMU data collected during acquisition. Record GPS positional data referenced to a base station near the survey area. Report relevant error sources that relate to GPS performance.
Light Imaging Detection and Ranging (LIDAR) Specific Standards 35

AC 150/5300-17C September 30, 2011
g. Data Integration. A range of commercial products are available to combine LIDAR data from MCLM sources with LIDAR data from other sources. Large surveys require more time to merge data. Report any data errors as root mean squared fit errors. Deviations should be within the error ranges for the instrument. For example, if TLM data has a range error of 2 - 3 centimeters, and MCLM data has an error range of 5 - 10 centimeters, then the error for combining the two datasets should not exceed 5 - 10 centimeters.
5.7 What are the specific requirements for TLM sensors?
a. Seasonal Considerations. TLM signal quality is negatively impacted by vegetation, birds, insects, and other agents passing through or moving within the scan target area. They produce noise in the data that can be filtered. TLM is a line-of-sight instrument. What is not visible to the naked eye is usually not visible to the scanner. Scanning of thick vegetation may not adequately capture survey data. Either remove vegetation or scan during seasonal “leaf-off.”
b. Establishing Useful Scanner Range. LIDAR scanners vary by design.
• Some scanners use a laser with focusing optics to improve range-finding precision, but have limited use beyond the designated focal point.
• Some scanners impart a cylindrical design to the laser beam, which improves long-range capability but sacrifices precision.
Both designs are subject to beam divergence, especially cylindrical lasers. As the pulse leaves the unit, the beam becomes wider with range. With an increased laser spot hitting the target, the noise within the return signal increases, resulting in lower intensity and precision. Most manufacturers quote maximum ranges of 250 – 4,000 meters, but outdoor conditions can lower the range by 25 - 50 percent. Be aware of the limitations of your scanner.
c. Scan Acquisition. Data acquisition requires you a) place the scanner at the desired station, b) set up the region of interest, c) execute the scan, and d) record metadata. With mobile stop-and-go systems or tripod-mounted systems, you may also need to collect the back-site orientation and/or GPS coordinates of the scanner. You may need to record additional metadata of the scanner orientation at instrument boot-up, and scan parameters for programming the scan execution.
d. Georeferenced Data Acquisition. Most TLM systems are not equipped with back-site telescopes for measuring the orientation of a scanner at instrument start-up (where the zero position for the scanner head at start-up faces the instrument toward the internal reference frame +y-axis).
e. Data Processing. Data processing generally begins by downloading data from the scanner and converting it to the proper format for the processing software. Some TLM scanners come with their own processing tools, while others rely on third-party software. Processing software helps you edit, clean, merge, and export data point clouds. Some vendors may also have in-house software.
f. Data Filtering and Clean-up. TLM data requires, or at least benefits from clean-up. You often need to remove errors from objects passing through the scan area during acquisition.
g. Scan Merging and Acceptable Error Standards. TLM data collected from multiple stations can be merged into a common reference frame if the scans overlap. Select scanning stations to account for adequate overlap. Generally 20 percent overlap is sufficient for coverage.
36 Light Imaging Detection and Ranging (LIDAR) Specific Standards
September 30, 2011 AC 150/5300-17C
h. Data Integration. Both MCLM and TLM scanner data can be merged with other types of data sets. The precision of differing resolutions is limited by the lower precision and accuracy scan of the two datasets. Although the higher resolution scan gives a more precise image of the scan area, inserting it into a more coarse dataset (for example, an ATLM survey) limits its precision to the coarse survey – unless you capture reference targets in both low- and high-resolution point clouds. When planning to combine TLM data with other data types, include targets in the TLM scan area that are also visible by other survey methods such as laser theodolite, ATLM, MCLM, and so on.
i. Applicability of RGB Point Clouds. Most TLM scanners can combine photographic color collected by an on-board camera with LIDAR point data. The output is an XYZ-RGB data file handy for feature recognition. The procedure for assigning RGB values to the point cloud varies from vendor to vendor; none report any errors in their models. At decimeter-to-meter scale resolutions, errors tend to be negligible. But the resolution of TLM systems may assign many points to a single pixel RGB value that may or may not represent reality. Thus TLM systems often have errors along the edges of objects.
5.8 What are the data processing standards and recommended practices for using LIDAR in airport obstruction data collection projects?
LIDAR has trouble capturing small or thin objects easily affected by wind or other movement such as antennas and branches. Take care to apply certain rules when using LIDAR data to analyze airport objects as potential obstructions.
Rule 1: Avoid Data Cleaning and Filtering. Do not pre-filter data. Using LIDAR to collect and post-process data for airport projects involves analyzing objects as potential obstructions. This process is very different than other end-user applications such as floodplain mapping. Bare-earth terrain modeling involves a lot of filtering/cleaning of LIDAR points very far up the processing chain, or even during data acquisition. Data clearing and filtering is not appropriate for airports, as it can easily remove points corresponding to reflections from obstructions, which might miss the obstructions altogether. This is why the FAA requires the collection and submission of complimentary imagery supporting the LIDAR. You must deliver the raw LIDAR point cloud (with absolutely no points removed either in the air or in post-processing) as a project deliverable. Be extremely careful about any cleaning or filtering done during data analysis. In general, it is best to leave all points from the LAS file and allow the Object Detection step to handle filtering. Any pre-cleaning/filtering you do must be described in the report. Additionally, do not remove these filtered points from the LAS file. Keep them attributed as “withheld” in the LAS file (classification bit encoding).
Rule 2: Adjust Your Data Analysis Workflow. Generating final obstruction data from the LIDAR point cloud is not a trivial task. It requires a tremendous amount of effort and planning. Do not use the raw point cloud as the only source of data for object analysis against an obstruction identification surface. Use it only as a supplementary means associated with aerial imagery. Completing an obstruction analysis in this manner complicates the following tasks:
(1) Distinguish between returns from real objects and those due to noise or clutter.
(2) Determine which points correspond to laser reflections from the same object.
(3) Attribute detected obstructions.
Integrate the steps in Figure 5-2 into your process to reduce or eliminate the possibility of missing objects and increase the probability of detecting objects. One critical aspect is to place the object detection step before the OIS analysis step, so the OIS analysis is run on extracted objects such as, trees, buildings, antennas, poles, towers, and others, rather than on the raw LIDAR points.
Figure 5-2 illustrates recommended steps for analyzing airport objects as obstructions. (Source:
Light Imaging Detection and Ranging (LIDAR) Specific Standards 37
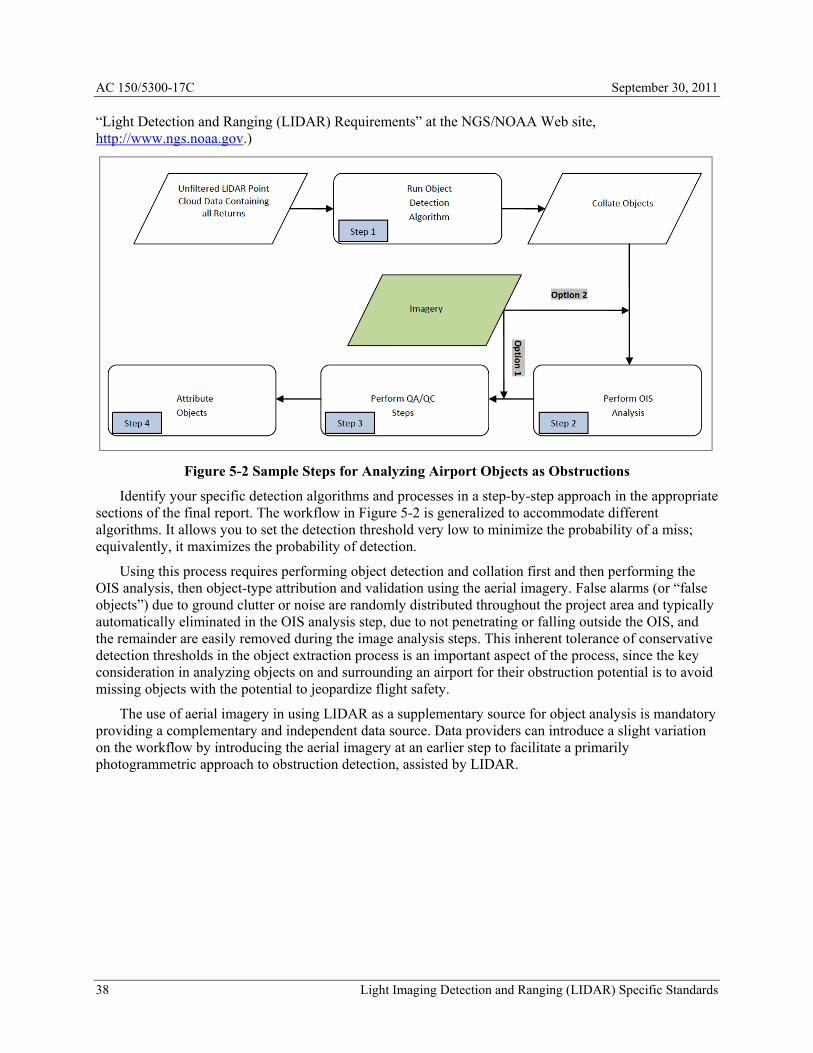
AC 150/5300-17C September 30, 2011
“Light Detection and Ranging (LIDAR) Requirements” at the NGS/NOAA Web site, http://www.ngs.noaa.gov.)
Figure 5-2 Sample Steps for Analyzing Airport Objects as Obstructions
Identify your specific detection algorithms and processes in a step-by-step approach in the appropriate sections of the final report. The workflow in Figure 5-2 is generalized to accommodate different algorithms. It allows you to set the detection threshold very low to minimize the probability of a miss; equivalently, it maximizes the probability of detection.
Using this process requires performing object detection and collation first and then performing the OIS analysis, then object-type attribution and validation using the aerial imagery. False alarms (or “false objects”) due to ground clutter or noise are randomly distributed throughout the project area and typically automatically eliminated in the OIS analysis step, due to not penetrating or falling outside the OIS, and the remainder are easily removed during the image analysis steps. This inherent tolerance of conservative detection thresholds in the object extraction process is an important aspect of the process, since the key consideration in analyzing objects on and surrounding an airport for their obstruction potential is to avoid missing objects with the potential to jeopardize flight safety.
The use of aerial imagery in using LIDAR as a supplementary source for object analysis is mandatory providing a complementary and independent data source. Data providers can introduce a slight variation on the workflow by introducing the aerial imagery at an earlier step to facilitate a primarily photogrammetric approach to obstruction detection, assisted by LIDAR.
38 Light Imaging Detection and Ranging (LIDAR) Specific Standards

September 30, 2011 AC 150/5300-17C
Chapter 6. Satellite Imagery Standards and Recommended Practices
6.1 Reserved.
Satellite Imagery Standards and Recommended Practices 39

AC 150/5300-17C September 30, 2011
Intentionally Left Blank
40 Satellite Imagery Standards and Recommended Practices

September 30, 2011 AC 150/5300-17C
Chapter 7. Required Project Deliverables
In general, submit all data captured in its original unedited format. Submit all supporting forms or documents in a non-editable format such as the Adobe PDF™ format.
7.1 What deliverables are required for all remote sensing projects?
a. Remote Sensing and Survey and Quality Control Plan.
b. Control Points Information.
c. Notification of Unusual Circumstances. Notify the FAA of any unusual circumstances occurring during the performance of this project that may potentially affect the deliverables or their quality. Particularly note any deviation from the project specifications or Statement of Work.
d. Remote Sensing Final Project Report.
7.2 What deliverables are required for projects incorporating aerial imagery technologies?
Aerial imagery projects require the submission of the following items:
(a) Control points and associated documentation
(b) Camera calibration certificate (as appropriate) or certificate of compliance with manufacturer’s procedures
(c) Photographic Flight Report
(d) Stereoscopic imagery for analysis
(e) Digital orthoimagery
7.3 What deliverables are required for projects incorporating LIDAR ATLM technologies?
a. Control Points Information. If using the test apparatus described earlier, report the proposed location of this target as well as ground control and validation points.
b. LIDAR Raw Data. Submit the completed data collection raw output. Formats should include proprietary raw data formats for archival purposes and standard formats that include unfiltered, filtered, and classified point clouds.
c. LIDAR Products. Required products include LIDAR point cloud files, intensity images, attributed objects/obstructions and other products described in the appropriate advisory circulars.
d. Imagery. Deliver imagery according to the standards outlined in Section 7.2.
e. Flight Reports. Submit the completed, original LIDAR Flight Logs with the data for FAA review.
f. GPS Files. For Global Positioning System (GPS) / Inertial Measurement Unit (IMU) files, submit the original, raw data files and processed trajectory files for FAA review.
g. Airborne Positioning and Orientation Report. Submit raw GPS and IMU data (in the manufacturer’s format) with the final processed GPS trajectory and post-processed IMU data. Also submit a report covering the positioning and orientation of the LIDAR.
h. Range and Scanner Angle Files. Submit the original, raw data files for FAA review.
i. GPS Check Points. Submit an organized list of all GPS points used for the project as base
Required Project Deliverables 41

AC 150/5300-17C September 30, 2011
stations and check points. Indicate which GPS points are pre-existing ground control and which stations are new and positioned relative to the NSRS.
j. Calibration Reports. There is no standard format for the calibration reports. However, they must contain, at a minimum, the following information:
• Date the calibration was performed • Name of the person, company, or organization responsible for performing the calibration • Methods used to perform the calibration • Final calibration parameters or corrections determined through the calibration procedures. • Discussion of the results • Sensor Maintenance Reports with maintenance history of the sensors used in data collection
7.4 What deliverables are required for projects incorporating LIDAR MCLM technologies?
Deliverables from a mobile scanning project should be specified in the contract with the provider.
• If delivering a point cloud, allow considerable office time to extract data in a CADD / DTM format. You must supply resources for data extraction such as computers, programs, and trained personnel.
• If delivering a finished CADD / DTM file, your client’s office time will be reduced to QA of the final product.
The simplest form of processed LIDAR data is a “point cloud” saved in a scanner-specific format or an ASCII file containing XYZI (X, Y, Z coordinates and return intensity (I) values) georeferenced data. If image overlay data is available, deliver the post-processed point cloud in an ASCII file containing XYZIRGB (X, Y, Z coordinates, return intensity (I), and red, green, and blue (RGB) color values).
Figure 7-1 shows an example of a point cloud dataset and the same data converted into a CADD model.
Figure 7-1 Sample Point Cloud Dataset and Same Data Converted to CADD
In addition, provide a readme file specifying the units and datum of the XYZ coordinates in ASCII point cloud files. And deliver the georeferenced image files (in common image format such as jpg, tiff, png) if available.
42 Required Project Deliverables

September 30, 2011 AC 150/5300-17C
Deliverables specific to MCLM surveys may include, but are not limited to:
• XYZI files in ASCII, CSV, or other specified format • Registered point clouds • Digital video or photo mosaic files • Survey narrative report and QA/QC files
a. Raw data formats. Raw data formats from mobile systems are generally in a proprietary format that can be exported into any portable format. Points can be processed into a classified point cloud stored in a LAS format (Log ASCII Standard, a commonly accepted public file format for storing and exchanging LIDAR point data).
b. Modeled data. Raw data from MCLM surveys are generally too cumbersome for client processing. Therefore, most vendors provide CADD or mesh model representations based on the raw data suitable for survey grade analysis. The maximum resolution of such models is around 200 percent of the survey resolution; however, accuracy may exceed or at least approach the measurement accuracy of the MCLM instrumentation. The latter requires sufficient laser spot overlap to generate models with minimum error.
c. Survey Properties. Document a mobile scanning project to show a clear data lineage from the published primary control to final deliverables. The data path of the entire process must be defined, documented, assessable, and allow for identifying adjustment or modification. 3D data without a documented lineage is susceptible to embedded mistakes. The survey narrative report, completed by the Party Chief, shall contain the following general information, the specific information required by each survey method, and any appropriate supplemental information.
• Project name and identification • Survey date, limits, and purpose • Datum, epoch, and units • Control found, held, and set for the survey • Personnel, equipment, and surveying methods used • Problems encountered • Any other pertinent information such as GNSS observation logs • Dated signature and seal of the Party Chief
d. Documentation for mobile terrestrial laser scanning surveys includes, but is not limited to:
(1) Adjustment Report.
(2) Control for Scanner Registration.
Control target points
Local transformation points
Validation points
GNSS Accuracy Report
IMU Accuracy Report
Adjustment report for control
Required Project Deliverables 43

AC 150/5300-17C September 30, 2011
(3) Registration Reports.
Results of target and cloud to cloud registration
QA/QC reports as described in Section 15-11.7
Results of finished products to validation points
MCLM survey narrative report
7.5 What are the deliverables for projects incorporating LIDAR TLM technologies?
Identify deliverables for scanning projects in the planning stage. However, TLM systems produce a great deal of data that may prove useful beyond the expected outcomes. In this context, send the FAA the raw data, registered data, filtered and processed data, and all related acquisition data including field notes and digital photographs. Additional deliverables should include QA/QC analysis, metadata, and useful definitions of procedures.
a. Deliverables specific to TLM surveys may include, but are not limited to:
• XYZI or XYZ RGB files in ASCII, CSV, XML, or other specified format. List all control points and targets with their coordinates and elevations, coordinate system, and units.
• Registered point clouds • Current roadway design software files • Current drafting software files • Digital photo mosaic files • 3D printing technology physical scale models of the subject • Survey narrative report and QA/QC files • FGDC-compliant metadata files conforming to the current FAA standard
b. Raw data formats. Most scanners export data in proprietary, compressed data formats and are only useful if the FAA can access these files. Because they are small, these raw data files are useful for archiving the data from any TLM survey. The most portable format (but least efficient) is ASCII files. These files will generally contain three to seven columns of data and include XYZ point position data, intensity (I), and red/green/blue (RGB) color assignments. Unlike airborne terrestrial LIDAR mapping, TLM data does not usually collect full waveform data collection. In those projects where TLM, full wave form technology is used, the raw point cloud should include:
• All returns, all collected points, fully calibrated and adjusted to ground, by swath • Fully compliant LAS V1.2 or V1.3, Point Record Format 1, 3, 4, or 5 • LAS V1.3 deliverables with waveform data are to use external “auxiliary” files with the extension
“.wdp” for the storage of waveform packet data. See the LAS V1.3 Specification for additional information.
• Georeference information included in all LAS file headers • GPS times recorded as Adjusted GPS Time, at a precision sufficient to allow unique timestamps
for each pulse • Intensity values (native radiometric resolution) • One file per swath, file size not to exceed 2 GB
Newer systems provide the option to collect the full waveform, which results in raw data formats similar to ATLM or MCLM systems.
44 Required Project Deliverables

September 30, 2011 AC 150/5300-17C
c. Modeled data. Similar to MCLM systems, TLM produces more data than most clients are prepared to computationally handle. Therefore, generating modeled meshes suitable for display in CADD systems or geographic information systems is a common data deliverable. In most cases, with sufficient sampling density and spot overlap, the modeled surface data can be more accurate than the original LIDAR data.
Required Project Deliverables 45

AC 150/5300-17C September 30, 2011
Intentionally Left Blank
46 Required Project Deliverables

September 30, 2011 AC 150/5300-17C
Chapter 8. Data Review and Acceptance
8.1 Data Review and Acceptance Requirement
The FAA Airport Surveying-GIS Program Manager is responsible for conducting the data validation and verification of work products performed in accordance with this advisory circular.
a. Review Process.
(1) Receipt Acknowledgment. The FAA will acknowledge the date the imagery and associated deliverables were received in the Airports GIS project file within two working days of receipt. They will include a note in the comments section of the project when they expect to start and finish the review for the information of the FAA, contractor and airport sponsor.
(2) Imagery Acceptance Criteria. The imagery will be evaluated by the criteria listed below:
• Ground Sample Distance (GSD). Between 0.25 feet and 1.0 feet (7.5 – 30 centimeters). • Stereo Coverage. Imagery must have sufficient overlap to permit stereo coverage of the entire
area for analysis. • Geometric Fidelity. Collection and processing of the image data will maintain, within accuracy
requirements, the relationship between measurements made in the image model and real world coordinates.
• Georeferencing. The imagery is georeferenced and the source data used for completing the georeferencing is provided.
• Positional Accuracy. As a minimum, positions of well-defined points determined from the stereo imagery must be within one meter relative to the National Spatial Reference System (NSRS) referenced to North American Datum of 1983 (NAD83) and the North American Vertical Datum of 1988 (NAVD88) at the 95 percent confidence level for Easting, Northing and Orthometric Height. Positional accuracies shall meet minimum requirements but should ultimately meet project defined positional accuracy requirements.
• Resolution. Imagery must be sufficiently sharp to allow identification, analysis, and measurement of airport features and obstructions.
• Image Quality. Imagery must be clear, sharp, and evenly exposed across the format. The imagery must be free from clouds, cloud shadows, smoke, haze, scratches, and other blemishes interfering with the intended use of the imagery.
• Acquisition Date. Imagery should be acquired within the 6-month period prior to the airport ground survey unless authorized by FAA (see Section 3.1.).
• Foliage. Imagery should be collected at time of full leaf foliage if appropriate.
(3) Imagery Acceptance Review. The FAA will formally accept the imagery by providing an imagery usability report in the project file of Airport GIS. This review typically is completed within five days of the start date, but could take longer depending on workload. Once a favorable usability determination is made by the FAA, you may then submit the airport ground survey data. If the FAA determines the imagery is unacceptable, you must re-submit new imagery as soon as possible for review. This is the primary reason for submitting the imagery well in advance of the airport ground survey portion.
Data Review and Acceptance 47

AC 150/5300-17C September 30, 2011
Intentionally Left Blank
48 Data Review and Acceptance

September 30, 2011 AC 150/5300-17C
Chapter 9. Points of Contact
9.1 Advisory Circular Questions/Comments
Contact the following offices for additional information or clarification.
• For questions regarding these specifications, contact: FAA Airport Surveying-GIS Program Manager Email: [email protected]
• For questions regarding imagery review, usability, or review times, contact: FAA Airport Engineering Division (AAS-100) Airport Surveying-GIS Program Manager 800 Independence Avenue, Suite 621 Washington DC, 20591 Front Office Phone: 202-267-7669
Points of Contact 49

AC 150/5300-17C September 30, 2011
Intentionally Left Blank
50 Points of Contact
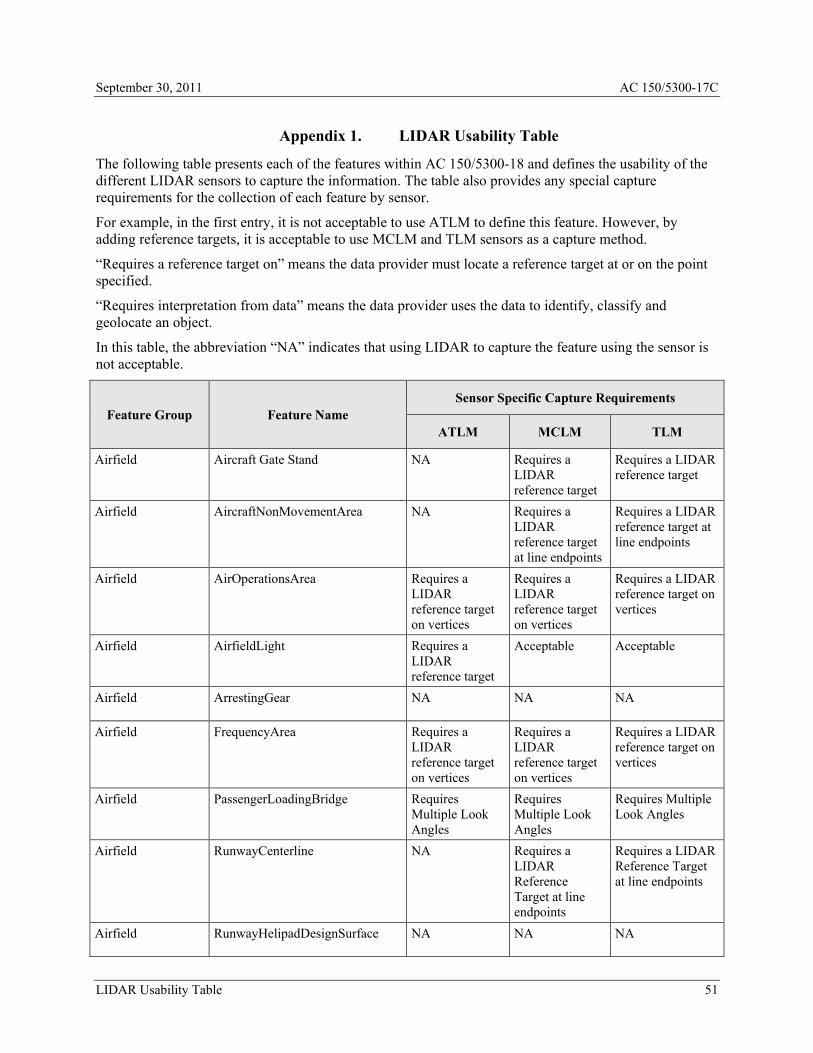
September 30, 2011 AC 150/5300-17C
Appendix 1. LIDAR Usability Table
The following table presents each of the features within AC 150/5300-18 and defines the usability of the different LIDAR sensors to capture the information. The table also provides any special capture requirements for the collection of each feature by sensor.
For example, in the first entry, it is not acceptable to use ATLM to define this feature. However, by adding reference targets, it is acceptable to use MCLM and TLM sensors as a capture method.
“Requires a reference target on” means the data provider must locate a reference target at or on the point specified.
“Requires interpretation from data” means the data provider uses the data to identify, classify and geolocate an object.
In this table, the abbreviation “NA” indicates that using LIDAR to capture the feature using the sensor is not acceptable.
Feature Group Feature Name Sensor Specific Capture Requirements
ATLM MCLM TLM
Airfield Aircraft Gate Stand NA Requires a LIDAR reference target
Requires a LIDAR reference target
Airfield AircraftNonMovementArea NA Requires a LIDAR reference target at line endpoints
Requires a LIDAR reference target at line endpoints
Airfield AirOperationsArea Requires a LIDAR reference target on vertices
Requires a LIDAR reference target on vertices
Requires a LIDAR reference target on vertices
Airfield AirfieldLight Requires a LIDAR reference target
Acceptable Acceptable
Airfield ArrestingGear NA NA NA
Airfield FrequencyArea Requires a LIDAR reference target on vertices
Requires a LIDAR reference target on vertices
Requires a LIDAR reference target on vertices
Airfield PassengerLoadingBridge Requires Multiple Look Angles
Requires Multiple Look Angles
Requires Multiple Look Angles
Airfield RunwayCenterline NA Requires a LIDAR Reference Target at line endpoints
Requires a LIDAR Reference Target at line endpoints
Airfield RunwayHelipadDesignSurface NA NA NA
LIDAR Usability Table 51
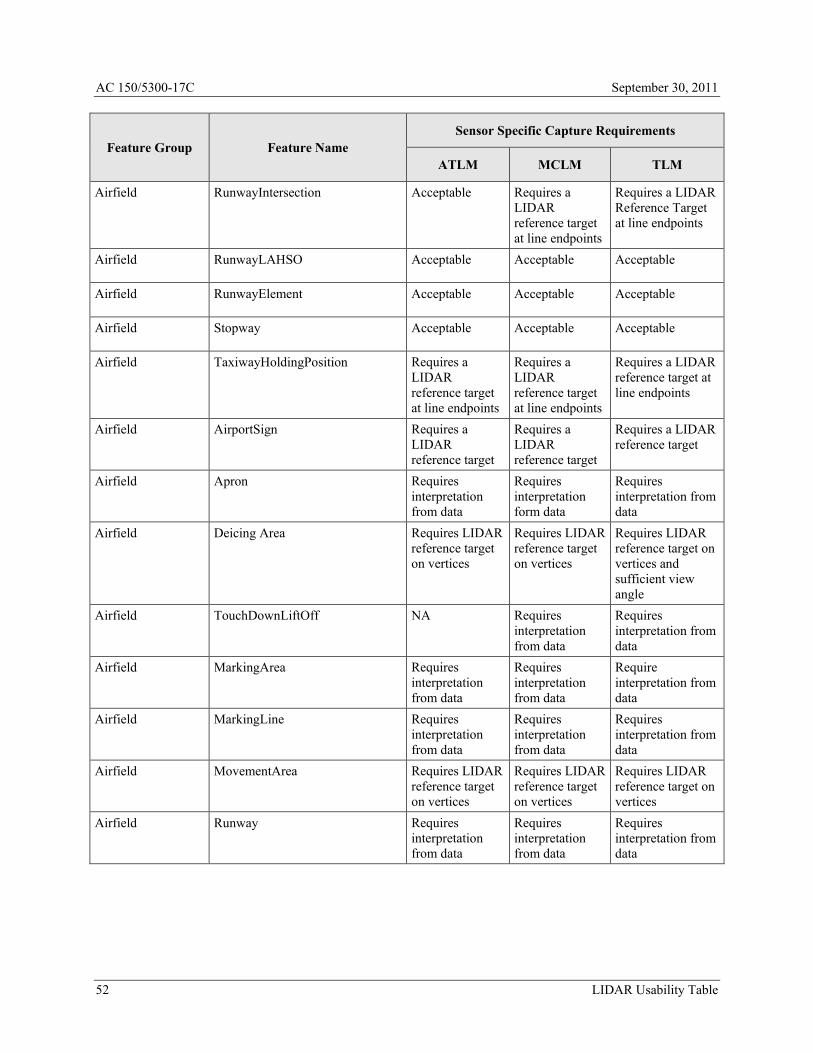
AC 150/5300-17C September 30, 2011
Feature Group Feature Name Sensor Specific Capture Requirements
ATLM MCLM TLM
Airfield RunwayIntersection Acceptable Requires a LIDAR reference target at line endpoints
Requires a LIDAR Reference Target at line endpoints
Airfield RunwayLAHSO Acceptable Acceptable Acceptable
Airfield RunwayElement Acceptable Acceptable Acceptable
Airfield Stopway Acceptable Acceptable Acceptable
Airfield TaxiwayHoldingPosition Requires a LIDAR reference target at line endpoints
Requires a LIDAR reference target at line endpoints
Requires a LIDAR reference target at line endpoints
Airfield AirportSign Requires a LIDAR reference target
Requires a LIDAR reference target
Requires a LIDAR reference target
Airfield Apron Requires interpretation from data
Requires interpretation form data
Requires interpretation from data
Airfield Deicing Area Requires LIDAR reference target on vertices
Requires LIDAR reference target on vertices
Requires LIDAR reference target on vertices and sufficient view angle
Airfield TouchDownLiftOff NA Requires interpretation from data
Requires interpretation from data
Airfield MarkingArea Requires interpretation from data
Requires interpretation from data
Require interpretation from data
Airfield MarkingLine Requires interpretation from data
Requires interpretation from data
Requires interpretation from data
Airfield MovementArea Requires LIDAR reference target on vertices
Requires LIDAR reference target on vertices
Requires LIDAR reference target on vertices
Airfield Runway Requires interpretation from data
Requires interpretation from data
Requires interpretation from data
52 LIDAR Usability Table

September 30, 2011 AC 150/5300-17C
Feature Group Feature Name Sensor Specific Capture Requirements
ATLM MCLM TLM
Airfield RestrictedAccessBoundary Requires LIDAR reference targets on line endpoints and interpretation from data
Requires LIDAR reference targets on line endpoints and interpretation from data
Requires LIDAR reference targets on endpoints and interpretation from data
Airfield RunwayArrestingArea Interpreted from data
Requires multiple look angles and interpretation from data
Requires multiple look angles and interpretation from data
Airfield RunwayBlastPad Requires interpretation from data
Requires interpretation from data
Requires interpretation from data
Airfield RunwayEnd Not acceptable Requires LIDAR reference target
Requires LIDAR reference target
Airfield RunwayLabel Requires LIDAR reference target at location
Requires LIDAR reference target at location
Requires LIDAR reference target at location
Airfield RunwaySafetyAreaBoundary Requires LIDAR reference targets on vertices
Requires LIDAR reference target on vertices
Requires LIDAR reference target on vertices
Airfield Shoulder Requires interpretation from data
Requires Interpretation from data
Requires interpretation from data
Airfield TaxiwayIntersection Requires interpretation from data
Requires interpretation from data
Requires sufficient look angle and interpretation from data
Airfield TaxiwayElement Requires interpretation from data
Requires interpretation from data
Requires sufficient look angle and interpretation from data
Airspace LandmarkSegment Requires interpretation from data
Requires interpretation from data
Requires multiple look angles
Airspace Obstacle Requires complimentary imagery, sufficient look angle and interpretation from data
Requires complimentary imagery and interpretation from data
Requires complimentary imagery and interpretation from data
LIDAR Usability Table 53
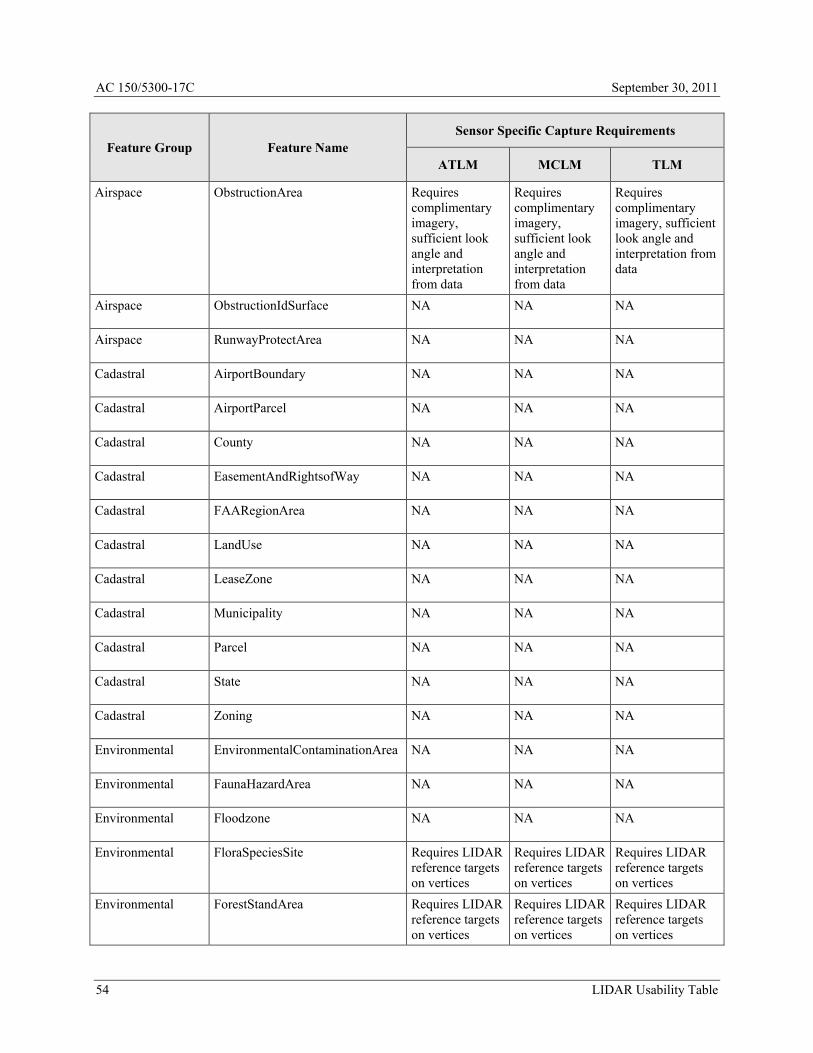
AC 150/5300-17C September 30, 2011
Feature Group Feature Name Sensor Specific Capture Requirements
ATLM MCLM TLM
Airspace ObstructionArea Requires complimentary imagery, sufficient look angle and interpretation from data
Requires complimentary imagery, sufficient look angle and interpretation from data
Requires complimentary imagery, sufficient look angle and interpretation from data
Airspace ObstructionIdSurface NA NA NA
Airspace RunwayProtectArea NA NA NA
Cadastral AirportBoundary NA NA NA
Cadastral AirportParcel NA NA NA
Cadastral County NA NA NA
Cadastral EasementAndRightsofWay NA NA NA
Cadastral FAARegionArea NA NA NA
Cadastral LandUse NA NA NA
Cadastral LeaseZone NA NA NA
Cadastral Municipality NA NA NA
Cadastral Parcel NA NA NA
Cadastral State NA NA NA
Cadastral Zoning NA NA NA
Environmental EnvironmentalContaminationArea NA NA NA
Environmental FaunaHazardArea NA NA NA
Environmental Floodzone NA NA NA
Environmental FloraSpeciesSite Requires LIDAR reference targets on vertices
Requires LIDAR reference targets on vertices
Requires LIDAR reference targets on vertices
Environmental ForestStandArea Requires LIDAR reference targets on vertices
Requires LIDAR reference targets on vertices
Requires LIDAR reference targets on vertices
54 LIDAR Usability Table

September 30, 2011 AC 150/5300-17C
Feature Group Feature Name Sensor Specific Capture Requirements
ATLM MCLM TLM
Environmental HazardousMaterialStorageSite NA NA NA
Environmental NoiseContour NA NA NA
Environmental NoiseIncident NA NA NA
Environmental NoiseMonitoringPoint NA NA NA
Environmental SampleCollectionPoint NA NA NA
Environmental Shoreline Requires interpretation from data
Requires interpretation from data
Requires interpretation from data
Environmental Wetland NA NA NA
Geospatial AirportControlPoint Requires LIDAR reference target on point and interpretation from data
Requires LIDAR reference target on point and interpretation from data
Requires LIDAR reference target on point and interpretation from data
Exception: Data providers may use any LIDAR sensor without targets in modeling the runway profile points, however it does requires data interpretation.
Geospatial CoordinateGridArea NA NA NA
Geospatial ElevationContour Requires interpretation from data
Requires interpretation from data
Requires interpretation from data
Geospatial ImageArea NA NA NA
Manmade Structures
Building Requires interpretation from data
Requires multiple look angles and interpretation from data
Requires multiple look angles and interpretation from data
Manmade Structures
ConstructionArea NA NA NA
Manmade Structures
Roof Requires interpretation from data
Requires multiple look angles and interpretation from data
Requires multiple look angles and interpretation from data
Manmade Structures
Fence NA Requires multiple look angles
Requires multiple look angles
LIDAR Usability Table 55
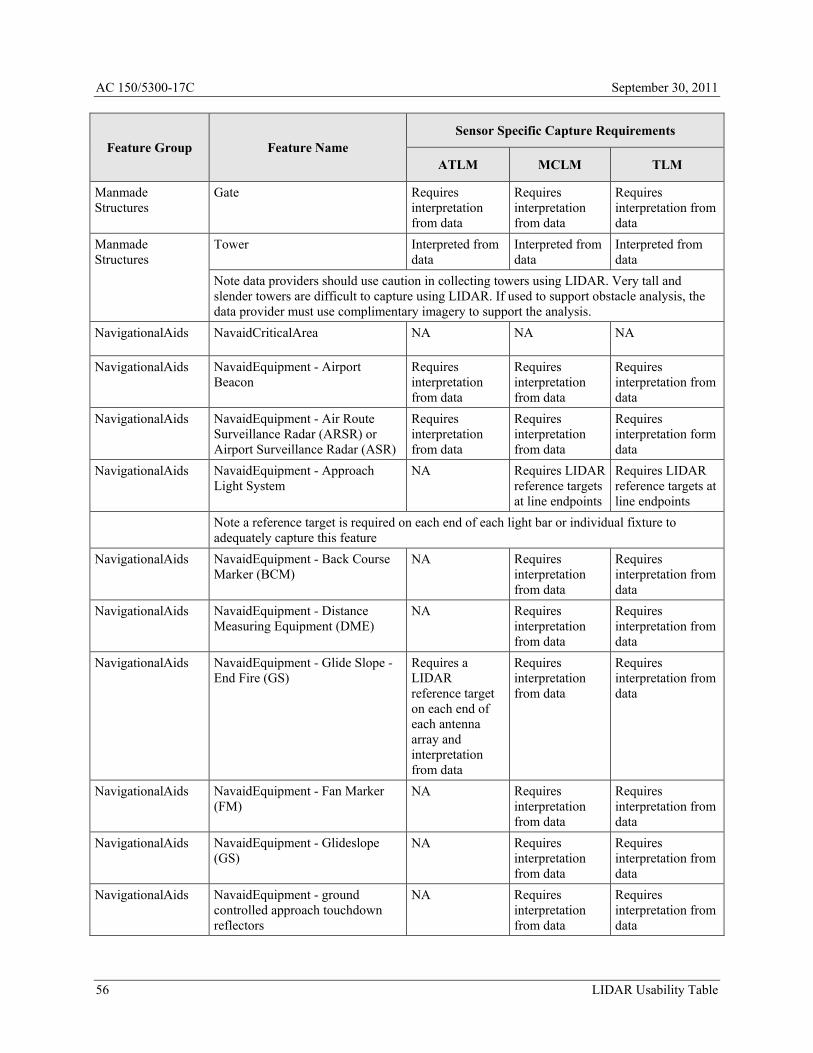
AC 150/5300-17C September 30, 2011
Feature Group Feature Name Sensor Specific Capture Requirements
ATLM MCLM TLM
Manmade Structures
Gate Requires interpretation from data
Requires interpretation from data
Requires interpretation from data
Manmade Structures
Tower Interpreted from data
Interpreted from data
Interpreted from data
Note data providers should use caution in collecting towers using LIDAR. Very tall and slender towers are difficult to capture using LIDAR. If used to support obstacle analysis, the data provider must use complimentary imagery to support the analysis.
NavigationalAids NavaidCriticalArea NA NA NA
NavigationalAids NavaidEquipment - Airport Beacon
Requires interpretation from data
Requires interpretation from data
Requires interpretation from data
NavigationalAids NavaidEquipment - Air Route Surveillance Radar (ARSR) or Airport Surveillance Radar (ASR)
Requires interpretation from data
Requires interpretation from data
Requires interpretation form data
NavigationalAids NavaidEquipment - Approach Light System
NA Requires LIDAR reference targets at line endpoints
Requires LIDAR reference targets at line endpoints
Note a reference target is required on each end of each light bar or individual fixture to adequately capture this feature
NavigationalAids NavaidEquipment - Back Course Marker (BCM)
NA Requires interpretation from data
Requires interpretation from data
NavigationalAids NavaidEquipment - Distance Measuring Equipment (DME)
NA Requires interpretation from data
Requires interpretation from data
NavigationalAids NavaidEquipment - Glide Slope - End Fire (GS)
Requires a LIDAR reference target on each end of each antenna array and interpretation from data
Requires interpretation from data
Requires interpretation from data
NavigationalAids NavaidEquipment - Fan Marker (FM)
NA Requires interpretation from data
Requires interpretation from data
NavigationalAids NavaidEquipment - Glideslope (GS)
NA Requires interpretation from data
Requires interpretation from data
NavigationalAids NavaidEquipment - ground controlled approach touchdown reflectors
NA Requires interpretation from data
Requires interpretation from data
56 LIDAR Usability Table

September 30, 2011 AC 150/5300-17C
Feature Group Feature Name Sensor Specific Capture Requirements
ATLM MCLM TLM
NavigationalAids NavaidEquipment - Inner Marker NA Requires interpretation from data
Requires interpretation from data
NavigationalAids NavaidEquipment - Localizer (LOC)
Requires a LIDAR reference target on each end of the antenna array, horizontal survey point and interpretation from data
Requires interpretation from data
Requires interpretation from data
NavigationalAids NavaidEquipment - Localizer Type Aid (LDA)
NA, insufficient resolution capabilities
Sufficient resolution, interpreted from data
Sufficient resolution, interpreted from data
NavigationalAids NavaidEquipment - Middle Marker
NA Requires interpretation from data
Requires interpretation from data
NavigationalAids NavaidEquipment -MLS Azimuth Antenna (MLSAZ)
NA Requires interpretation from data
Requires interpretation from data
NavigationalAids NavaidEquipment - MLS Elevation Antenna (MLSEZ)
NA Requires interpretation form data
Requires interpretation from data
NavigationalAids NavaidEquipment - Non-Directional Beacon (NDB)
NA Requires interpretation from data
Requires interpretation from data
NavigationalAids NavaidEquipment - Outer Marker (OM)
NA Requires interpretation from data
Requires interpretation from data
NavigationalAids NavaidEquipment - Precision Approach Path Indicator (PAPI) System
Requires interpretation from data
Requires interpretation from data
Requires interpretation from data
NavigationalAids NavaidEquipment - Precision Approach Radar (PAR) Touchdown Reflectors
NA Requires interpretation from data
Requires interpretation form data
NavigationalAids NavaidEquipment - Pulse Light Indicator (PLASI)
Requires interpretation from data
Requires interpretation from data
Requires interpretation from data
NavigationalAids NavaidEquipment - Pulsating Visual Approach Slope Indicator (PVASI)
Requires interpretation from data
Requires interpretation from data
Requires interpretation from data
LIDAR Usability Table 57

AC 150/5300-17C September 30, 2011
Feature Group Feature Name Sensor Specific Capture Requirements
ATLM MCLM TLM
NavigationalAids NavaidEquipment - Runway End Identifier Lights (REIL)
NA Requires interpretation of data
Requires interpretation of data
NavigationalAids NavaidEquipment - Simplified Directional Facility (SDF)
NA Requires interpretation of data
Requires interpretation of data
NavigationalAids NavaidEquipment - Tactical Air Navigation (TACAN)
Requires interpretation from data
Requires interpretation of data
Requires interpretation of data
NavigationalAids NavaidEquipment - Tricolor Visual Approach Slope Indicator System (TRCV)
NA Requires interpretation of data
Requires interpretation of data
NavigationalAids NavaidEquipment - “T” Visual Approach Slope Indicator System (T-VASI)
Requires interpretation of data
Requires interpretation of data
Requires interpretation of data
NavigationalAids NavaidEquipment - VHF Omni Directional Range (VOR)
Requires interpretation from data
Requires interpretation from data
Requires interpretation from data
NavigationalAids NavaidEquipment - Visual Approach Slope Indicator System (VASI)
Requires LIDAR reference target at horizontal reference point and interpretation from data
Requires LIDAR reference target at horizontal reference point and interpretation from data
Requires LIDAR reference target at horizontal reference point and interpretation from data
NavigationalAids NavaidEquipment - VOR/TACAN (VORTAC)
Requires interpretation from data
Requires interpretation from data
Requires interpretation from data
NavigationalAids NavaidSite Requires LIDAR reference targets on vertices
Requires LIDAR reference targets on vertices
Requires LIDAR reference targets on vertices
SeaPlane WaterOperatingArea NA NA NA
SeaPlane WaterLaneEnd NA NA NA
SeaPlane TaxiChannel NA NA NA
SeaPlane TurningBasin NA NA NA
SeaPlane NavigationBuoy NA NA NA
SeaPlane SeaplaneRampCenterline Requires interpretation from data
Requires interpretation from data
Requires sufficient look angle and interpretation from data
58 LIDAR Usability Table

September 30, 2011 AC 150/5300-17C
Feature Group Feature Name Sensor Specific Capture Requirements
ATLM MCLM TLM
SeaPlane SeaplaneRampSite Requires interpretation from data
Requires interpretation from data
Requires sufficient look angle and interpretation from data
SeaPlane DockArea Requires interpretation from data
Requires multiple look angles
Requires multiple look angles
SeaPlane AnchorageArea Water/buoy Water/buoy Water/buoy
Security SecurityArea NA NA NA
Security SecurityIdDisplayArea NA NA NA
Security SecurityPerimeterLine NA NA NA
Security SterileArea NA NA NA
Surface Transportation
Bridge NA Requires interpretation from data
Requires interpretation from data
Surface Transportation
DrivewayArea Requires LIDAR reference targets on vertices
Requires LIDAR reference targets on vertices or interpretation from data
Requires sufficient look angle, LIDAR reference targets on vertices, or interpretation from data
Surface Transportation
DrivewayCenterline NA NA NA
Surface Transportation
ParkingLot Requires LIDAR reference targets on vertices
Requires LIDAR reference targets on vertices or interpretation from data
Requires sufficient look angle, LIDAR reference targets on vertices, or interpretation from data
Surface Transportation
RailroadCenterline Requires interpretation from data
Requires interpretation from data
Requires sufficient look angle and interpretation from data
Surface Transportation
RailroadYard Requires interpretation from data
Requires multiple look angles
Requires multiple look angles
Surface Transportation
RoadCenterline Requires interpretation form data
Requires interpretation from data
Requires interpretation from data
LIDAR Usability Table 59

AC 150/5300-17C September 30, 2011
Feature Group Feature Name Sensor Specific Capture Requirements
ATLM MCLM TLM
Surface Transportation
RoadPoint Requires LIDAR reference target on point
Requires LIDAR reference target on point
Requires LIDAR reference target on point
Surface Transportation
RoadSegment Requires interpretation from data
Requires interpretation from data
Requires sufficient look angle and interpretation from data
Surface Transportation
Sidewalk Requires interpretation from data
Requires interpretation from data
Requires sufficient look angle and interpretation from data
Surface Transportation
Tunnel NA NA NA
Utilities TankSite Requires interpretation from data
Requires interpretation from data
Requires interpretation from data
Utilities UtilityLineA NA NA NA
UtilityLineB NA NA NA
UtilityLineC NA NA NA
UtilityLineD NA NA NA
Utilities UtilityPointA NA NA NA
UtilityPointB NA NA NA
UtilityPointC NA NA NA
UtilityPointD NA NA NA
Utilities UtilityPolygonA NA NA NA
UtilityPolygonB NA NA NA
UtilityPolygonC NA NA NA
UtilityPolygonD NA NA NA
60 LIDAR Usability Table
September 30, 2011 AC 150/5300-17C
Appendix 2. Glossary
The following terms are used in this AC and throughout the FAA.
Term Definition
3D Imaging System A non-contact measurement instrument used to produce a 3D representation (for example, a point cloud) of an object or site. (ASTM E 2544-09b)
AC Advisory Circular Accuracy The degree of conformity with a standard, or a value accepted as correct. Precision is the
degree of uniformity of repeated measurements or events. For example, repeat measurements of the distance between two points may exhibit a high degree of precision by virtue of the relative uniformity of the measurements. However, if a “short” tape were used in the measurements, accuracy would be poor in that the measured distance would not conform to the true distance between the points. Surveying and mapping accuracy standards should include three elements: (1) a stated variation from a true value or a value accepted as correct, (2) the point to which the new value is relative, and (3) the probability that the new value will be within the stated variation. For example, “Horizontal accuracy will be 10 centimeters relative to the nearest Continuously Operating Reference Station (CORS) at the 95 percent confidence level.” (AC 150/5300-18)
ADO Airport District Offices AGL Above Ground Level, flying height AIP Airport Improvement Program ALM Airborne LIDAR Mapping AP Aerial Photogrammetric ATLM Airborne Terrestrial LIDAR mapping AWAR Area-Weighted Average Resolution Beam Diameter (dσ) For a laser beam with a circular irradiance pattern, the beam diameter is the extent of the
irradiance distribution in a cross-section of the laser beam (in a plane orthogonal to its propagation path) at a distance z and is given by:
)(4)( zzd σσ =
where:
)z()z()z( Yx σσσ ==
σx(z), σy(z) = the square roots of the second order moments For a laser beam with a Gaussian distribution of irradiance, the beam diameter is often defined as the distance across the center of the beam for which the irradiance, I equals 1/e2 of the maximum irradiance (where e is the base of the natural logarithm. The area inside a circle with this diameter and centered at the beam center will contain 86.5 percent of the total beam irradiance. (ASTM E 2544-09b)
Glossary 61

AC 150/5300-17C September 30, 2011
Term Definition
Beam Divergence Angles (θσx, θσy)
Measure for the asymptotic increase of the beam widths, dσx(z) and dσx(z), with increasing distance, z, from the beam waist locations, z0x and z0y, given by:
x
xlimxx zz
)z(d)zz(
σ
σσθ −
∞→−= 0
y
ylimyy zz
)z(d)zz(
σ
σσθ −
∞→−= 0
(ASTM E 2544-09b) Bench Mark A relatively permanent natural or artificial material object bearing a marked point whose
elevation above or below an adopted surface (datum) is known. (AC 150/5300-18) CADD Computer-Aided Drafting and Design CN Color Negative film Consolidated Vertical Accuracy
The result of a test of the accuracy of 40 or more check points (z-values) consolidated for two or more of the major land cover categories, representing both the open terrain and other land cover categories. Computed using a nonparametric testing method (95th Percentile), a consolidated vertical accuracy is always accompanied by a fundamental vertical accuracy. (Refer to the sections “Fundamental Accuracy” and “Supplemental and Consolidated Vertical Accuracies” in “Guidelines for Digital Elevation Data” available at http://www.ndep.gov.)
Control Station A point on the ground whose position and/or elevation is used as a basis for obtaining positions and/or elevations of other points. (AC 150/5300-18)
Datum In general, a point, line, surface, or set of values used as a reference. A “geodetic datum” is a set of constants specifying the coordinate system and reference used for geodetic control (refer to Control Station), i.e. for calculating coordinates of points on the earth. At least eight constants are needed to form a complete datum: three to specify the location of the origin of the coordinate system; three to specify the orientation of the coordinate system; and two to specify the dimensions of the reference ellipsoid. Any point has a unique X, Y, Z datum coordinate which can be transformed into latitude, longitude, and ellipsoid height (height relative to the ellipsoid). A “horizontal control datum” is a geodetic datum specified by two coordinates (latitude and longitude) on the ellipsoid surface, to which horizontal control points are referenced. A “vertical datum” is a theoretical equipotential surface with an assigned value of zero to which elevations are referenced. (Refer to geoid.) (AC 150/5300-18)
DEM Digital Elevation Model. The digital cartographic representation of the elevation of the land at regularly spaced intervals in x and y directions, using z-values referenced to a common vertical datum. (Refer to “Guidelines for Digital Elevation Data” available at http://www.ndep.gov.)
DSM Digital Surface Model. Similar to DEM or DTM, except that they depict the elevations of the top surfaces of buildings, trees, towers, and other features elevated above the bare earth. DSM are especially relevant for telecommunications management, forest management, air safety, 3D modeling and simulation. (Refer to “Guidelines for Digital Elevation Data” available at http://www.ndep.gov.)
62 Glossary
September 30, 2011 AC 150/5300-17C
Term Definition
DTM Digital Terrain Model. DTM may be identical to DEM, but they may also incorporate the elevation of significant topographic features on the land and change points and break lines that are irregularly spaced so as to better characterize the true shape of the bare earth terrain. The net result of DTM is that the distinctive terrain features are more clearly defined, and contours generated from DTM more closely approximate the real shape of the terrain. Such DTM are normally more expensive and time consuming to produce than uniformly spaced DEM because break lines are ill suited for automation; but the DTM results are technically superior to standard DEM for many applications. (Refer to “Guidelines for Digital Elevation Data” available at http://www.ndep.gov.)
Ellipsoid Height The distance between a point and the reference ellipsoid taken along the perpendicular to the ellipsoid. Ellipsoid heights are the heights resulting from GPS observations. Ellipsoid heights are positive if the point is above the ellipsoid. Ellipsoid Height = Geoid Height + Orthometric Height. (AC 150/5300-18)
FAA Federal Aviation Administration Feature A manmade or natural object that appears in the real world such as a building, runway,
navigational aid or river. (AC 150/5300-18) Feature Type A collection of all features of a given type such as all runways or all buildings. Feature
Types are analogous to layers in many GIS applications and are also referred to as Entity Types and Feature Classes in other standards. (AC 150/5300-18)
Feature Instance A specific feature such as runway 10/28 at Baltimore Washington International Airport. (AC 150/5300-18)
FGDC Federal Geographic Data Committee First Return For a given emitted pulse, it is the first reflected signal that is detected by a 3D imaging
system, time-of-flight type (TOF), for a given sampling position, that is, azimuth and elevation angle. (ASTM E 2544-09b)
FOV Field of View Fundamental Vertical Accuracy
The fundamental vertical accuracy is the value by which vertical accuracy can be equitably assessed and compared among datasets. The fundamental vertical accuracy of a dataset must be determined with check points located only in open terrain where there is a very high probability that the sensor will have detected the ground surface. It is obtained utilizing standard tests for RMSE. (Refer to Consolidated and Supplemental Vertical Accuracies.) (Refer to “Guidelines for Digital Elevation Data” available at http://www.ndep.gov.)
GBL Ground Based LIDAR Geoid The theoretical surface of the earth that coincides everywhere with approximate mean sea-
level. The geoid is an equipotential surface to which, at every point, the plumb line is perpendicular. Because of local disturbances of gravity, the geoid is irregular in shape. (AC 150/5300-18)
Geoid Height The distance, taken along a perpendicular to the reference ellipsoid, between the reference ellipsoid and the geoid. The geoid height is positive if the geoid is above the reference ellipsoid. (Geoid height is negative for the conterminous United States.) Geoid Height = Ellipsoidal Height - Orthometric Height. (AC 150/5300-18)
GNSS Global Navigation Satellite System GPS Global Positioning System GSD Ground Sampled Distance IMU Inertial Measurement Unit
Glossary 63
AC 150/5300-17C September 30, 2011
Term Definition
Independent Source of Higher Accuracy
Data acquired independently of procedures to generate the dataset that is used to test the positional accuracy of a dataset. The independent source of higher accuracy shall be of the highest accuracy feasible and practicable to evaluate the accuracy of the dataset. (Refer to “Guidelines for Digital Elevation Data” available at http://www.ndep.gov.)
KML Keyhole Markup Language Last Return For a given emitted pulse, it is the last reflected signal that is detected by a 3D imaging
system, time-of-flight type (TOF), for a given sampling position, that is, azimuth and elevation angle. (ASTM E 2544-09b)
LIDAR Light Detection and Ranging. An instrument that measures distance to a reflecting object by emitting timed pulses of light and measuring the time between emission and reception of reflected pulses. The measured time interval is converted to distance. (Refer to “Guidelines for Digital Elevation Data” available at http://www.ndep.gov.)
Local Control A control station or network of control stations in a local area used for referencing local surveys. Local control may or may not be tied to the National Spatial Reference System. (See Control Station) (AC 150/5300-18)
MCLM Mobile Compensated LIDAR Mapping Metadata Information about the data itself such as source, accuracy, dates for which the data are valid,
security classification, etc. Metadata is essential in helping users determine the extent on which they can rely on a given data item to make decisions. (AC 150/5300-18)
Multiple Returns For a given emitted pulse, a laser beam hitting multiple objects separated in range is split and multiple signals are returned and detected. (ASTM E 2544-09b)
NAD North American Datum NAVD North American Vertical Datum NDEP National Digital Elevation Program NGS National Geodetic Survey NOAA National Oceanic and Atmospheric Administration NSRS National Spatial Reference System. A network of permanent survey monuments located
throughout the United States with accurately determined positions (horizontal network) and/or elevations (vertical network). Gravity values, not always monumented, are also part of NSRS. Responsibility for establishing and maintaining NSRS rests with the National Geodetic Survey under the U.S. Department of Commerce. Current authority is contained in United States Code, Title 33, USC 883a as amended, and specifically defined by Executive Directive, Bureau of the Budget (now Office of Management and Budget) Circular No. A-16 Revised. (AC 150/5300-18)
NSSDA National Standard for Spatial Data Accuracy OIS Obstruction Identification Surfaces OPUS Online Positioning User Service Orthometric Height The distance taken along the plumb line between a point and the geoid. Orthometric heights
are positive if the point is above the geoid. Orthometric Height = Ellipsoid Height - geoid Height. (AC 150/5300-18)
PDF Adobe’s Portable Document Format PDOP Position Dilution of Precision PFC Passenger Facility Charges
64 Glossary

September 30, 2011 AC 150/5300-17C
Term Definition
Point Cloud A collection of data points in 3D space (frequently in the hundreds of thousands), for example as obtained using a 3D imaging system. (ASTM E 2544-09b)
POS Position Orientation System Positional Accuracy The difference between a geospatial feature’s displayed position and its actual position.
Absolute positional accuracy is the difference between a geospatial feature’s displayed position and its actual position on the face of the earth. Relative positional accuracy is the difference between a geospatial feature’s displayed position and that of other geospatial features in the same data set. (AC 150/5300-18)
Post Spacing The smallest distance between two discrete points that can be explicitly represented in a gridded elevation dataset. It is important to note that features of a size equal to, or even greater than the post spacing, may not be detected or explicitly represented in a gridded model. For gridded elevation data, the horizontal post spacing may be referenced as the cell size, the grid spacing, the posting interval, or the ground sample distance. Horizontal post spacing should be documented in the metadata file. (Refer to “Guidelines for Digital Elevation Data” available at http://www.ndep.gov.)
Precision The smallest separation that can be represented by the method employed to make the positional statement which is the number of units or digits to which a measured or calculated value is expressed and used. (AC 150/5300-18)
PRF Pulse Repetition Frequency Reference Ellipsoid A geometric figure comprising one component of a geodetic datum, usually determined by
rotating an ellipse about its shorter (polar) axis, and used as a surface of reference for geodetic surveys. The reference ellipsoid closely approximates the dimensions of the geoid. Certain ellipsoids fit the geoid more closely for various areas of the earth. Elevations derived directly from satellite observations are relative to the ellipsoid and are called ellipsoid heights. (AC 150/5300-18)
Registration The process of determining and applying to two or more datasets the transformations that locate each dataset in a common coordinate system so that the datasets are aligned relative to each other. (ASTM E 2544-09b)
RGB Red, Green, Blue RMSE Root Mean Square Error. The square root of the mean of squared errors for a sample. (Refer
to “Guidelines for Digital Elevation Data” available at http://www.ndep.gov.) RTK Real Time Kinematic satellite navigation Second Order Moments (σx
2, σy2)
The second order moments of an irradiance distribution of a simple astigmatic laser beam at a given range, z, σx
2(z), σy2(z), along the principle axes, x and y, are defined as
∫ ∫∫ ∫
∞− ∞−
∞− ∞−−
= 0 0
0 0 22
dxdy)z,y,x(I
dxdy)xx)(z,y,x(I)z(xσ
∫ ∫∫ ∫
∞− ∞−
∞− ∞−−
= 0 0
0 0 22
dxdy)z,y,x(I
dxdy)yy)(z,y,x(I)z(yσ
Where I(x,y,z) is the irradiance or optical power per unit area at point (x,y,z), and x and y are the coordinates of the centroid (also referred to as the first order moments) of the beam in the x y plane, respectively. (ASTM E 2544-09b)
Glossary 65

AC 150/5300-17C September 30, 2011
Term Definition
Simple Astigmatic Beam
A beam having non-circular power density distributions and whose principle axes retain constant orientation under free propagation. (ASTM E 2544- 09b)
Supplemental Vertical Accuracy
The result of a test of the accuracy of z-values over areas with ground cover categories or combinations of categories other than open terrain. Obtained utilizing the 95th percentile method, a supplemental vertical accuracy is always accompanied by a fundamental vertical accuracy. (Refer to Fundamental and Consolidated Vertical Accuracies.)
TIFF Tagged Image File Format TLM Terrestrial LIDAR Mapping UoM Unit of Measure USGS U.S. Geologic Survey UTM Universal Transverse Mercator Well-Defined Point A point that represents a feature for which the horizontal position is known to a high degree
of accuracy and position with respect to the geodetic datum. (Refer to “Guidelines for Digital Elevation Data” available at http://www.ndep.gov.)
66 Glossary