15 signals - world wildlife fund
TRANSCRIPT

15 SIGNALS EVIDENCE THE ENERGY TRANSITION IS UNDERWAY
© G
LOB
AL W
AR
MIN
G IM
AG
ES
/ WW
F

FOREWORDWorld leaders approved a universal climate agreement in Paris last year, drawing a line in the sand for the transformation of the world’s energy system into a clean and sustainable form.
Signs that a global energy transition is happening are everywhere to be seen: in the growth of renewables, the rise of city-level climate actions, the stagnation of CO2 emissions and in companies who are committing to science based targets as the foundation of their climate actions, to name just a few.
We felt it important to highlight 15 key signs or “signals” of the energy transition, to help raise awareness that the transition to a new, sustainable, equitable, just and fair global energy system has irrevocably begun.
What is needed now is to accelerate the transition and scale it up to have a chance of keeping global temperature rise to well below 2°C, trying for 1.5°C, as countries committed to in the Paris Agreement just eight months ago.
Global meetings – such as the G20 meeting taking place in China on 4-5th September; and the next UN climate talks starting in Marrakech on 7th November – gives opportunity to all stakeholders to say how and what they can contribute to accelerating the transition.
Ending fossil fuel subsidies, supporting the deployment of renewables and energy effi ciency, increasing green fi nance and putting a just price on carbon are just some of the actions that can be taken right now to put pace into the transition.
As 2016 heads into the record books as likely the hottest year ever recorded in history, it is a reminder that we have precious little time left to act to keep global temperatures well below 2°C.
We have the Paris Agreement to guide our way. Now we need to implement it. Now is the time for action.
September 2016

SIGNALS OF THE ENERGY TRANSITION
3

© N
ATUR
EP
L.CO
M / S
TEV
EN
KA
ZLOW
SK
I / WW
F-CA
NO
N©
GLO
BA
L WA
RM
ING
IMA
GE
S / W
WF

100%
75%
50%
25%
0%2001 2002 2003 2004 2005 2006 2007 2008 2009 2010 2011 2012 2013 2014 2015
Expansion in renewable power generation capacity worldwide
RENEWABLE ENERGYRenewables accounted for 90 per cent new electricity generation globally in 2015, while contributing to half of it the year before.(Source : Share of new electricity generation by renewables in the world, estimated by IEA.)
Based on its analysis of preliminary data for the global CO2 energy emissions data for 2015, the International Energy Agency showed that power generated by renewables is playing a growing role in slowing down energy related CO2 emissions as they accounted for around 90 per cent of new electricity generation in 2015. Wind power alone produced more than half of it. This share by renewables has seen an exponential increase in the last years, from 50 per cent in 2014, to 90 per cent of new power nowadays. On the road through COP21, renewables are known to be a tipping point that needs to be amplifi ed, especially by replacing old fossil fuel power plants with renewables.
5
(Source: IRENA, 2015)

© G
LOB
AL W
AR
MIN
G IM
AG
ES
/ WW
F
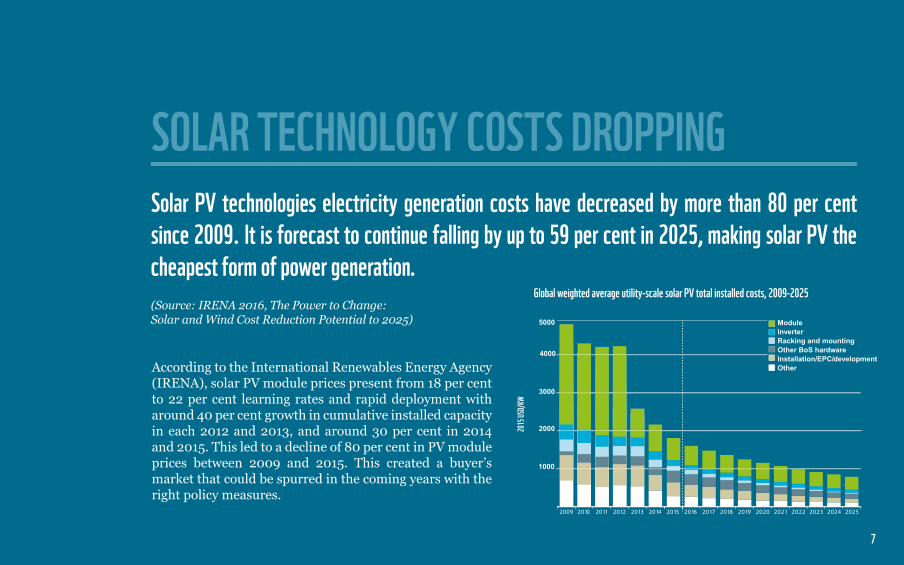
Solar PV technologies electricity generation costs have decreased by more than 80 per cent since 2009. It is forecast to continue falling by up to 59 per cent in 2025, making solar PV the cheapest form of power generation. (Source: IRENA 2016, The Power to Change: Solar and Wind Cost Reduction Potential to 2025)
SOLAR TECHNOLOGY COSTS DROPPING
2009 2010 2011 2012 2013 2014 2015 2016 2017 2018 2019 2020 2021 2022 2023 2024 2025
ModuleInverterRacking and mountingOther BoS hardwareInstallation/EPC/developmentOther
5000
4000
3000
2000
1000
Global weighted average utility-scale solar PV total installed costs, 2009-2025
2015
USD/
KW
According to the International Renewables Energy Agency (IRENA), solar PV module prices present from 18 per cent to 22 per cent learning rates and rapid deployment with around 40 per cent growth in cumulative installed capacity in each 2012 and 2013, and around 30 per cent in 2014 and 2015. This led to a decline of 80 per cent in PV module prices between 2009 and 2015. This created a buyer’s market that could be spurred in the coming years with the right policy measures.
7

in
© N
INA M
UN
N©
SH
UTTE
RS
TOC
K / IS
AK
55 / WW
F
in
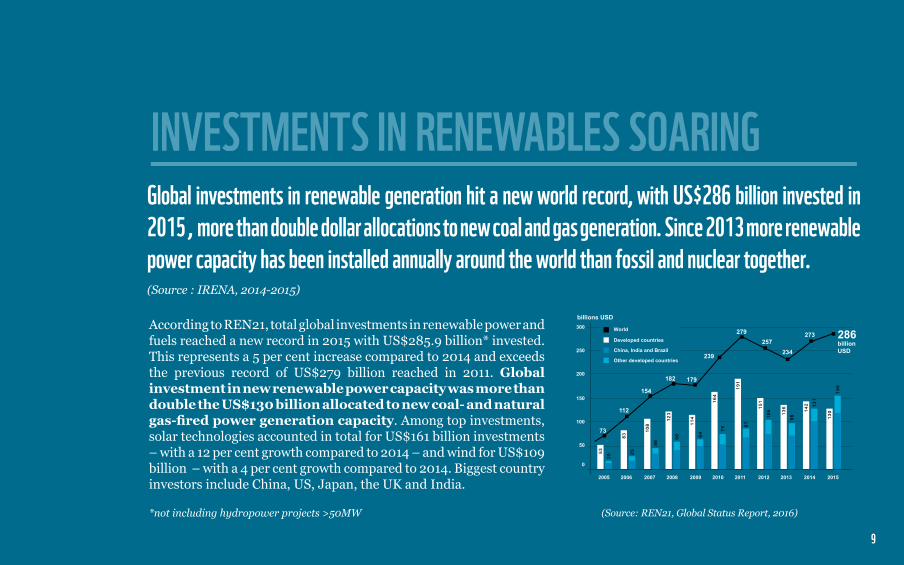
Global investments in renewable generation hit a new world record, with US$286 billion invested in 2015 , more than double dollar allocations to new coal and gas generation. Since 2013 more renewable power capacity has been installed annually around the world than fossil and nuclear together.(Source : IRENA, 2014-2015)
INVESTMENTS IN RENEWABLES SOARING
According to REN21, total global investments in renewable power and fuels reached a new record in 2015 with US$285.9 billion* invested. This represents a 5 per cent increase compared to 2014 and exceeds the previous record of US$279 billion reached in 2011. Global investment in new renewable power capacity was more than double the US$130 billion allocated to new coal- and natural gas-fi red power generation capacity. Among top investments, solar technologies accounted in total for US$161 billion investments – with a 12 per cent growth compared to 2014 – and wind for US$109 billion – with a 4 per cent growth compared to 2014. Biggest country investors include China, US, Japan, the UK and India.
*not including hydropower projects >50MW
2005 2006 2007 2008 2009 2010 2011 2012 2013 2014 2015
World
Developed countries
China, India and Brazil
Other developed countries
300
250
200
150
100
50
0
73
112
154
182 179
239
279257
234
273 286billion USD
billions USD
53
20
83
108
46
123
60
114
64
164
75
191
87
151
106 136
98
142 13
1
130
156
29
(Source: REN21, Global Status Report, 2016)
9

© G
LOB
AL W
AR
MIN
G IM
AG
ES
/ WW
F

On the 8th of May 2016, renewables supplied Germany almost all its power demand, marking a milestone in its “energiewende”.
87,6 %On the 8th of May 2016, renewable energies supplied almost full power demand in Germany
In 2015, renewables in Germany accounted for 32.6 per cent of gross domestic power consumption. The country targets a minimum of 50 per cent renewables in this fi eld by 2030. As the current level of coal in the mix remains a problem to be solved for Germany, the country ranks among world champions in the deployment of renewable technologies, being the second country in the world with total renewable power capacity per capita. On the 8th of May 2016, renewables supplied 87.6 per cent of domestic electricity consumption due to extremely favourable weather conditions leading to negative electricity prices. This symbolic moment illustrates the powerful energy transition happening in Germany: ‘‘Agora Energiewende’’. Other countries with a high share of renewables such as Portugal, Denmark and Cost Rica have also succeeded in reaching almost a full supply power demand from renewables. In Portugal, all renewables provided 48% of its electricity in 2015 according the Portuguese renewable energy association.
(Sources: German Federal Ministry for Economic Affairs and Energy)
INCREASING NUMBER OF COUNTRIES RUNNING INCREASING NUMBER OF COUNTRIES RUNNING TOTALLY ON RENEWABLE ENERGYTOTALLY ON RENEWABLE ENERGYTOTALLY ON RENEWABLE ENERGY
11

© G
LOB
AL W
AR
MIN
G IM
AG
ES
/ WW
F
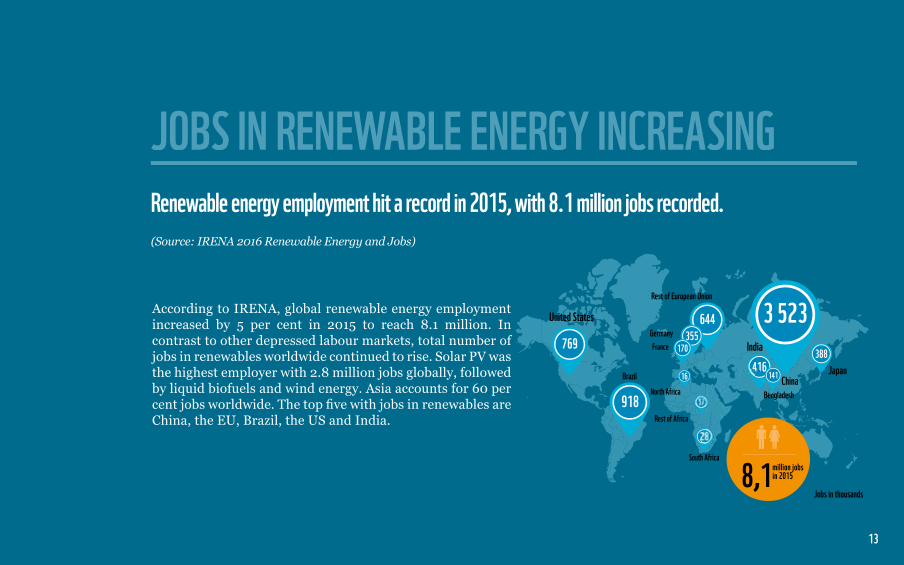
Renewable energy employment hit a record in 2015, with 8.1 million jobs recorded.(Source: IRENA 2016 Renewable Energy and Jobs)
JOBS IN RENEWABLE ENERGY INCREASING
769
918
28
17
16
644355
170
416141
3 523388
United States
Brazil
GermanyFrance
Rest of European Union
North Africa
Rest of Africa
South Africa
India
Bengladesh
JapanChina
8,1million jobs in 2015
Jobs in thousands
According to IRENA, global renewable energy employment increased by 5 per cent in 2015 to reach 8.1 million. In contrast to other depressed labour markets, total number of jobs in renewables worldwide continued to rise. Solar PV was the highest employer with 2.8 million jobs globally, followed by liquid biofuels and wind energy. Asia accounts for 60 per cent jobs worldwide. The top fi ve with jobs in renewables are China, the EU, Brazil, the US and India.
13

© N
ATION
AL G
EO
GR
AP
HIC
STO
CK
/ SA
RA
H LE
EN
/ WW
F

CHINA IS THE WORLD’S LARGEST INVESTOR IN RENEWABLES
China100
60
40
20
80
2005 2006 2007 2008 2009 2010 2011 2012 2013 2014 2015
Billion USD
8.3 11
.2 16.7 25
.6
38.8
39.6 47
.4
61.7
62.0
87.8
102.
9
Total New Investments in China in Renewable Power and Fuels from 2005-2015” - Source: BNEF and REN21, Global Status Report, 2016
Chinese investments in renewables increased by 17 per cent to US$103 billion – making it again world’s leading champion in renewables. (Sources: REN21 Global Status Report 2016)
China ranks as the world’s leader in total renewables capacity, according to the REN21 annual report; in investment in renewables capacity (topping US$102.9 billion by 2015) and in solar PV, solar water heating, wind and geothermal power. It is also the largest employer in renewables, with a total of 3.5 million jobs. Denmark, Germany, Sweden, Spain and Portugal are the top fi ve countries in terms of renewables if we look the numbers in terms of total renewable power capacity per capita.
However, in 2015, the annual wind power curtailment in China reached 33.9 billion kilowatts-hour, with an average rate of 15 per cent. In the fi rst half of 2016, it reached a record high level of 21 per cent, which shows that the current managing mechanism and infrastructure of China’s power sector does not match the speedy investment in renewable energy. 15

© B
RE
NT S
TIRTO
N / G
ETTY IM
AG
ES
/ WW
F-UK
((
© N
ATUR
EP
L.CO
M / TO
M G
ILKS
/ WW
F

((
Sub-Saharan Africa was the largest market for off grid solar products in the world with 1.37 million units.(Sources: REN21, Global Status Report, 2016)
AFRICA IS THE WORLD’S LARGEST MARKET FOR OFF GRID SOLAR PRODUCTS
Sub-Saharan Africa hit 1.37 million units sold in off grid solar in 2015. Despite this record, access to clean energy remains one of the main challenges for the region in the next year. 53 per cent of sub-Saharan Africa lacks access to electricity.
Meanwhile, the African region is part of the Africa Renewables Energy Initiative (AREI) that aims to target a 10GW renewables capacity by 2020 and 300GW by 2030.
As the end of 2014, four sub-Saharan countries were particularly leading in the global top fi ve countries with their number of solar lighting systems: Tanzania, Kenya, Ethiopia, Uganda.
India
Tanzania
Kenya
Ethiopia
Uganda
960,000
790,038
764,900
661,630
84,352
Solar Lighting Systems
17

© W
ELC
OM
IA / SH
UTTE
RS
TOC
K.C
OM

GREEN BONDS GROWING
$40 bn
$30 bn
$20 bn
$10 bn
$0 bn
Bank
Corporate
ABSMuniDevelopment Bank
2012 2013 2014 2015 2016YTD
2016
est
imat
e: $
100
bn
The green bonds market grew at an impressive compound growth rate, from close to zero in 2007 to an outstanding US$118 billion by mid-2016.(Sources: WWF, Green Bonds must keep the green promise!, June 2016; and Speech of MA Jun, Chief Economist of People’s Bank of China; Climate Bond Initiative; Bloomberg New Energy Finance)
Green bonds are attractively simple structures, offering investors additional disclosure and accountability and providing a means to ring fence funds for investments in sustainable agriculture, energy-effi cient buildings, clean energy, industry and transportation, water and waste, even biodiversity conservation, to name just a few investment fi elds. By mid-2016 the market amounted to US$118 billion of outstanding bonds labelled as green or climate aligned. More recently, China adding signifi cant momentum to this global trend. In December 2015, the People’s Bank of China released “Green Financial Bonds Bulletin”, which defi nes the fi rst standard for green bond in China and helped unlock the potential of the Chinese market. During the fi rst quarter of 2016 alone, China had issued US$ 8.2 billion of green bonds, which accounts for half of new issuances of green bonds worldwide. The green bond market bears great potential for the future and can help to accelerate the energy transition to keep global temperature increase well below 2°C, but still needs standards to address all major and sustainability challenges. 19

© B
RE
NT S
TIRTO
N / G
ETTY IM
AG
ES
/ WW
F-UK
© B
RE
NT S
TIRTO
N / G
ETTY IM
AG
ES
/ WW
F-UK
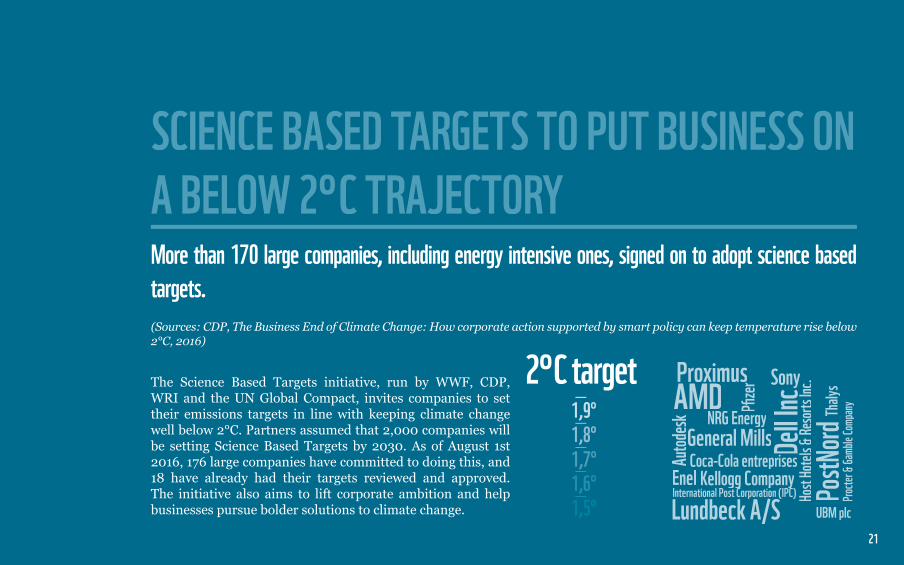
More than 170 large companies, including energy intensive ones, signed on to adopt science based targets.(Sources: CDP, The Business End of Climate Change: How corporate action supported by smart policy can keep temperature rise below 2°C, 2016)
SCIENCE BASED TARGETS TO PUT BUSINESS ON A BELOW 2°C TRAJECTORY
The Science Based Targets initiative, run by WWF, CDP, WRI and the UN Global Compact, invites companies to set their emissions targets in line with keeping climate change well below 2°C. Partners assumed that 2,000 companies will be setting Science Based Targets by 2030. As of August 1st 2016, 176 large companies have committed to doing this, and 18 have already had their targets reviewed and approved. The initiative also aims to lift corporate ambition and help businesses pursue bolder solutions to climate change.
21
UBM plc
AMD
Autod
esk
Coca-Cola entreprisesDell
Inc
Coca-Cola entreprisesDell
Inc
Coca-Cola entreprisesEnel
General Mills
Host H
otels &
Resor
ts Inc.
International Post Corporation (IPC)Kellogg Company
International Post Corporation (IPC)Kellogg Company
International Post Corporation (IPC)
Lundbeck A/SInternational Post Corporation (IPC)
Lundbeck A/SInternational Post Corporation (IPC)
NRG EnergyPfizer
NRG EnergyPfizer
NRG Energy
PostN
ordPro
cter &
Gamb
le Com
pany
Proximus Sony
Host H
otels &
Resor
ts Inc.Sony
Host H
otels &
Resor
ts Inc.
Thaly
s

© B
RE
NT S
TIRTO
N / G
ETTY IM
AG
ES
/ WW
F-UK
© TH
OM
AS
HA
UG
ER
SV
EE
N / W
WF-N
OR
WAY

2015201420132012201120102009200820072006200520042003200220012000
270528092844
27992767
24722268
21632105
19301767
15311312
10971008
9640 500 1000 1500 2000 2500 3000
million tce
China may have already reached a coal consumption peak.(Sources : China Energy Statistical Yearbook 2014China National Economic and Social Development Statistics Bulletin 2015)
China accounts for nearly half of the world’s coal consumption, the coal dependence makes China the biggest carbon emitter globally. This has caused severe air pollution and other environmental problems domestically. Along with the slowing down of China’s economic growth and the Chinese government’s effort to restructure its industries, China’s coal consumption has been in decline since 2014 with a 3.7 per cent drop in 2015.
CHINA’S COAL CONSUMPTION MAY BE PEAKINGCHINA’S COAL CONSUMPTION MAY BE PEAKING
23
China’s coal consumption (2000-2015)

© G
LOB
AL W
AR
MIN
G IM
AG
ES
/ WW
F

The coal industry faces declining prices and higher costs leading to some bankruptcies.(Sources: WWF, Megatrends in the global energy transition, December 2015Sierra Club and CoalSwarm, Boom and Bust: Tracking the global coal plant pipeline, 2015 and 2016 reports)
COAL INDUSTRY DECLINING
In order to hold temperature increase below 2°C, two thirds of fossil fuels proven reserves must stay in the ground. There are increasing signs that the unrestricted burning of environmentally damaging fuels is also reaching its limits in the real world. Since 2010, two out of three planned coal power plants have been put on the back burner or completely abandoned and only one fi nally completed. The parallel collapse in the use of coal in China, Europe and the USA in recent years combined with signs of coal market decline will soon have global impact, on emissions as well as on the industry. In 2016, US mining giant Peabody Energy, which used to be the world largest private coal company, fi led for bankruptcy. In total, coal-based US companies which fi led for bankruptcy in 2016 lost $30 billion USD in stock-market-value since 2010.In 2015, a report by Wood Mackezie found that 33 per cent of coal mines in Queensland (Australia) were running at a loss, including 50 per cent of thermal coal mines. In China, coal production dropped dramatically by 9.7 per cent in the fi rst half of 2016. 25
(Sources:Index Mudi)
Coal, Australian thermal coal
140.00
120.00
100.00
80.00
Jan-
2010
Jan-
2011
Jan-
2012
Month
Jan-
2013
Jan-
2014
Jan-
2015
Us
Dol
lars
per
Met
ric to
n
Newcastle Coal Benchmark Coal Price, January 2010 - January 2015

© W
WF / R
ICH
AR
D S
TON
EH
OU
SE

Global energy related carbon dioxide emissions stalled for the second year in a row in 2015, despite a 3 per cent economic growth.
GLOBAL CO2 EMISSIONS FROM ENERGY STALLING
1975 1980 1985 1990 1995 2000 2005 2010 2015
5
10
15
20
25
30
35
Secondoil shock
Dissolution of Soviet Union
Global economicdownturnIn its preliminary global CO2 energy emissions data in
2016, the International Energy Agency (IEA) showed that global emissions from energy stood at 32.1 billion tons in 2015, following a fl at trend for the second year in a row. The link between the global economy, which continued to grow, and energy related emissions growth is therefore weakening. Improvements in energy effi ciency, a spur in renewables led by wind as well as the decline of coal use in the two biggest world emitters are advanced by IEA as the main drivers of this trend.
(Source: International Energy Agency, Global energy-related CO2 emissions data, 2016.)
27

© N
ATION
AL G
EO
GR
AP
HIC
STO
CK
/ JIM R
ICH
AR
DS
ON
/ WW
F

The decline in annual global energy intensity accelerated to more than 1.7 per cent on 2010 to 2012, but needs to go much faster to meet 2030 sustainable development goals.(Sources: Sustainable Energy for All 2015: Progress Toward Sustainable Energy)
ENERGY INTENSITY IMPROVING
The improvement of energy effi ciency and energy savings constitute a critical pillar of the energy transition. Global efforts on this matter can be tracked through energy intensity which connects economic growth with energy use. According to Sustainable Energy for All, progress in improving primary energy intensity (units of energy per unit of GDP) has led to a 1.7 per cent decline a year over 2010-2012 (World Bank 2013). It is a better rate than the previous decade but it is still not enough to meet the Sustainable Energy for All goal of 2.6 per cent a year. This recent trend was primarily driven by high-income countries (from 1.5 per cent a year from 2000 to 2010 to 2.6 percent from 2010 to 2012).
0
-1
-2
-31990-2000 2000-2010 2010-2012
BASE PERIOD TRACKING PERIOD
Compound annual growth rate (%)
-1.5 -1.2 -1.7
29

© N
IGE
L DIC
KIN
SO
N / W
WF

(Sources: UNEP, Climate commitment of subnational actors and business, 2015)
CITIES RISING TO CLIMATE CHALLENGE
Cities are at the forefront of climate action. Towards COP21, hundreds of local governments joined their forces to launch initiatives and networks to advance their contribution to fi ght climate change and accelerate action: like the C40, the Covenant of Mayors (CoM) or the Carbonn Climate Registry (cCR). According to UNEP, the total achievements of additional emission reductions of these three city level initiatives is expected to reach 1.08GtCO2e by 2020 as compared to a current policy scenario. In addition, cities networks and 700 mayors declared their intention to strengthen their efforts to reach a 3.7GtCO2 annual reduction by 2030 in urban areas.
From 2010 to 2015, the ICLEI Carbonn Climate Registery reporting plateform recorded 1 681 actions on concrete action plans already implemented by 600 cities and regions in 62 countries to fi ght climate change. These communities represent 8 per cent of the world population.
700 citiescommit to reduce their emissions by 3.7GtCO2e per yearby 2030
31
Categorization of methods of climate action
Policy / Strategies / Action Plans
Technical / Infrastructure Investment
Assessment / Research
Education / Awareness Raising
Fiscal / Financial Mechanism
Organization / Governance
Public Participation / stakeholder engagement
Regulatory
Other
26%
37%
4%
4%
2%
2%
6%
5%
40% 30% 20% 10% 0%
Mitigation
14%
34%
24%
10%
3%
1%
8%
5%
4%
11%
0% 10% 20% 30%
Adaptation
(Sources: ICLEI e.V. 2015)

© G
LOB
AL W
AR
MIN
G IM
AG
ES
/ WW
F

Overachievements: comparing projections done by international energy outlooks for global expansion of renewables with reality shows that international agencies have underestimated the potential of these technologies.
FORECASTS AND REALITY
So far, institutional outlooks have totally underestimated the deployment of renewables and their future spread. For instance, the International Energy Agency (IEA) has missed in its projections the renewables boom for decades, only being able to adjust its forecasts on the expansion of renewables in relation to the existing developments. These misleading results have been shown in a recent WWF report (Megatrends in the global energy transition, 2015). Greenpeace and Global Wind Energy Council forecasts were the only one close to reality for renewables. Renewables can be seen as disruptive innovations with the potential to completely replace established products in existing markets or even whole sectors of industry.
(Sources: WWF, Megatrends in the global energy transition, 2015Matthieu Metayer, Christian Breyer, Hans-Josef Fell, The projections for the future and quality in the past of the World Energy Outlook for solar PV and other renewable energy technologies, 22.09.2015)
33
0
500
1000
1500
2000
GW 2500
1997 2000 2005 2010 2015 2020 2025
IEA-WEO 2000 IEA-WEO 2003 IEA-WEO 2006 IEA-WEO 2008 IEA-WEO 2010
GREENPEACE 2010 - ENERGY REVOLUTION REALITY OF GLOBAL EXPANSION
Forecasts and reality of global expansion in renewable energies

© G
LOB
AL W
AR
MIN
G IM
AG
ES
/ WW
F©
CLIM
ATE W
AR
MIN
G

A just, fair and equitable energy transitionWhy does WWF advocate for a just energy transition? The energy transition is happening – this report shows some signs of this change – and is an unstoppable long-term trend. This energy transition, as many other historical transitions, is based in the change in market forces due to technological innovations. We witness a destructive creation, new adopted and adapted technologies shaping a key market for the economy: the energy market. The energy transition has multiple effects. As energy is a basic input for all production processes, this change impacts many other fields of the economy and is reshaping our societies.
WWF advocates for this transition to be accelerated to avoid dangerous global warming that could have huge impacts in nature and humankind. In a creative destruction process there are always winners and losers and accelerating this process might increase the transition tensions. Addressing the transition negative impacts, particularly those in the most vulnerable sectors of society is a must, in line with the recently adopted UN Sustainable Development Goals (SDGs).
Current global energy systems are not just. First, billions of people live without access to clean and reliable sources of energy. Second, low income households spend a larger proportion of their income on energy services [than higher income households] hindering opportunities to accumulate the needed wealth to escape from poverty. These two elements of energy poverty subsequently bring about other serious problems such as gender inequity, social injustice and environmental degradation.
WWF’s mission ‘‘to stop the degratation of the planet’s natural environment and to build a future in which humans live in harmony with nature’’ embraces the spirit behind the SDGs to align the human footprint with what science dictates for sustainability. Making the energy transition equitable and fair contributes to build up human harmony with nature. However, our approach is not only about making just the transition, but enhancing the possibilities of transforming the future energy system in one that founds a more equitable society. The characteristics of the innovative energy technologies allow the new energy system to be more distributed, interdependent, less centralized and interactive. These features open the alternative to a more economically balanced system. The just energy transition cannot be just about the transition.
35

WWF ASKS ON CLIMATE AND ENERGY FOR G20The G20 Heads of State have committed to stronger engagement and cooperation to fi ght climate change in several declarations since 2008, notably by eliminating subsidies for fossil fuels. The adoption of the Paris Agreement and decisions and of the UN 2030 Agenda for Sustainable Development in 2015 offer unique opportunities to align G20 actions with commitments under the Paris Agreement and integrate climate related goals and targets of the 2030 Agenda in G20 work streams.
WWF welcomes the G20’s efforts to implement climate pledges, notably through the activity of the study group on Climate Finance, and other groups working on stronger consensus among G20 members to integrate environmental aspects in their deliberations, such as the G20 Task Force on Climate-related Financial Disclosures and the Green Finance Study Group (GFSG). WWF also strongly supports efforts at eliminating fossil fuels subsidies, welcomes progress to date and urges elimination by 2020.
WWF fully supports the Chinese Presidency’s call for G20 members to “take active measures to implement the outcomes of the COP21 on climate fi nancing and others”. WWF also welcomes the Chinese Presidency’s call to “strengthen cooperation on energy access, renewable energy and energy effi ciency to ensure green, balanced and sustainable development”.

At the G20 Hangzhou Summit, WWF asks the G20 to help the global transition to renewables energy by:
• Recognizing the COP21 outcomes, including the Paris Agreement and decisions and connecting commitments with G20 work on infrastructure, investment and financial sector reform and energy access;
• Supporting the ongoing work by the FSB Task Force on Climate-related Financial Disclosures and integrate the upcoming outcomes with the aim to detail further steps on how the financial sector can take account of climate change risks;
• Recognizing that environmental and social risk impact economic and financial stability;
• Recognizing the need for credible, fully developed and widely accepted standards for green bonds so as ensure consistency and comparability of such standards, including standardised terms and definitions, standardised disclosure, standardised certification requirements, the integration of green considerations into credit ratings, and credible dispute-resolution mechanisms
• Ensuring all possible support including fiscal and economic tools to reliable, safe, sustainable and clean energy access for all by 2030, notably by:
z Developing an inventory of fossil fuel subsidies of all G20 member states with harmonised metrics and agreeing ambitious phase-out road-maps by 2018 in order to completely and equitably phase out fossil fuel subsidies by 2020 and reinforce this process by ‘third country’ peer-reviews;
z Making energy efficiency and renewable energy an infrastructure investment priority for the Investment and Infrastructure Working Group;
z Upgrading the Green Finance Study Group to a permanent Working Group to help green financial investments globally;
z Speeding up efforts under the Action Plan on Energy Access to bring renewable, affordable and modern energy to the more than one billion people who lack energy access.
37

• 15 SIGNALS: EVIDENCE THE ENERGY TRANSITION IS UNDERWAY
© 1986 Panda Symbol WWF - World Wide Fund For nature (Formerly World Wildlife Fund) ® “WWF” & “living planet” are WWF Registered Trademarks/ “WWF” & “Pour une planète vivante” sont des marques déposées. WWF France. 1, carrefour de Longchamp, 75016 Paris.
100
5 MILLION
MORE THAN 12 000 1961
a global network active in over 100 countries
programmes implemented globally
When WWF was founded, making it one of the fi rst global conservation organisations established.
supporters
Why we are here
www.wwf.fr
To stop the degradation of the planet’s natural environment andto build a future in which humans live in harmony with nature.