15: atmospheric profiles, clouds, and the evolution of sea ... · pdf fileforecast experiments...
TRANSCRIPT

1
DISTRIBUTION STATEMENT A. Approved for public release; distribution is unlimited.
Atmospheric Profiles, Clouds, and the Evolution of Sea Ice Cover in the Beaufort and Chukchi Seas:
Atmospheric Observations and Modeling as Part of the Seasonal Ice Zone Reconnaissance Surveys
Axel Schweiger
Applied Physics Laboratory University of Washington
1013 NE 40th St. Seattle, WA 98105
phone: (206) 543-1312 fax: (206) 616-3142 email: [email protected]
Ron Lindsay, Applied Physics Laboratory, University of Washington Jinlun Zhang, Applied Physics Laboratory, University of Washington
Zheng Liu, Applied Physics Laboratory, University of Washington Dale A. Lawrence, Department of Aerospace Engineering, University of Colorado James Maslanik, Department of Aerospace Engineering, University of Colorado
Award Number: N00014-12-1-0232
http://psc.apl.washington.edu LONG-TERM GOALS The goal of this project is to examine the role of sea-ice and atmospheric interactions in the retreat of the SIZ. As sea ice retreats further, changes in lower atmospheric temperature, humidity, winds, and clouds are likely to result from changed sea ice concentrations and ocean temperatures. These changes in turn will affect the evolution of the SIZ. An appropriate representation of this feedback loop in models is critical if we want to advance prediction skill in the SIZ. To do so, we will conduct a combination of targeted measurements and modeling experiments as part of the atmospheric component of the Seasonal Ice Zone Reconnaissance Survey project (SIZRS). Combined with oceanographic and sea ice components of the SIZRS project, this project provides a multi-year observational and modeling framework that will advance our understanding of the variability of the seasonal ice zone and which is needed to improve predictions from daily to climate time scales. OBJECTIVES
• Assess the ability of global atmospheric reanalyses and forecast models to reflect the details of the seasonal evolution of atmosphere-ice-ocean interactions in the Beaufort Sea SIZ through the use coordinated multi-year atmospheric, ice, ocean measurements,
• investigate how regional meso-scale models can improve the representation of atmosphere-ice interactions in the SIZ spring through fall,
• determine how changes in sea ice and sea surface conditions in the SIZ affect changes in cloud properties and cover,

2
• develop novel instrumentation including low cost, expendable, air-deployed micro-aircraft to obtain temperature and humidity profiles and cloud top and base heights
• Integrate atmospheric, oceanographic, and sea ice measurements and models to advance our understanding of seasonal ice zone variability.
APPROACH To achieve these long-term objectives we are conducting observation and model experiments. The SIZRS project is an integrated observation and modeling program aimed at understanding the interplay of atmosphere, ice, and ocean in the SIZ of the Beaufort and Chukchi seas (BCSIZ). Seasonally changing surface conditions are expected to provide a present day analog for expected future ice retreat. SIZRS takes advantage of routine Coast Guard C-130 domain awareness missions that take place at bi-weekly intervals from May through November. As the atmospheric observation component of SIZRS, this project deploys dropsondes during SIZRS flights planned at least monthly from June through October to obtain atmospheric profiles of temperature, humidity, and winds from the time of ice edge retreat in spring to advance in fall. Transects following 150W and 140W from 72N to 77N are typically obtained. Cloud top heights will be retrieved using infrared imagers and a LIDAR provided by other SIZRS projects. In addition, we are contributing to technology development by adapting and deploying a new generation of truly expendable (<$700) micro-aerial vehicles (Glidersonde, SmartSonde) designed to obtain detailed high-vertical-resolution temperature, humidity and wind profiles and cloud layering information that cannot be obtained with traditional dropsondes.. In addition a dropsonde (IR dropsonde) capable of detecting cloud tops and bases is being developed. Satellite data from MODIS, CloudSat-Calipso as well as high resolution passive microwave and visible band optical images are utilized. Ship-based observations (Radiosonde and Cloud Ceilometer) are coordinated with SIZRS. Land based station data from the Department of Energy Atmospheric Radiation Program (ARM) are utilized to validate instrumentation. Sea surface temperatures, ice concentrations, and floe size distributions are measured by other components of the SIZRS project. Our atmospheric observations are being examined in the context of varying surface and weather conditions (sea ice concentration, ice thickness, and SST, synoptic type) to increase our understanding of atmosphere-ice-ocean interactions and to initialize, validate, and improve our meso-scale atmospheric model. Forecast experiments to assess our current ability to forecast sea ice variability at different time scales are conducted. WORK COMPLETED Observations: • We adapted a commercial GPS-based radiosonde system to operate in a dropsonde mode that can
be launched from aircraft. This provides an inexpensive alternative to a very limited choice in commercial suppliers of dropsonde systems.
• We completed the Aircraft Configuration Control Board (ACCB) process including safety of flight test (SOFT) and obtained approval for deploying dropsondes during ADA flights.
• We conducted successful deployments of dropsondes during 21 flights fom June –2013 – September 2015, with a total of ca. 120 profiles collected.

3
• We compared satellite retrievals of cloud fraction and cloud top height with observer estimates from C-130 cockpit.
• We helped advance the dropsonde design with the commercial vendor. Initial deployments were made using a converted radiosonde which now has been transitioned into a dropsonde design that is suitable for tube launches. We helped develop a simple parachute system that achieves 5 m/sec descent rates and yield high-resolution vertical profiles.
• We utilized IR-camera images obtained through the C-130 ramp during launches to obtain cloud top temperatures. Use of CUPLIS-X system (PI, Mark Tschudi, University of Colorado) with IR and LIDAR instrumentation to provide cloud top information was recently approved for flight (First flight originally planned for Oct-6, 2015 was cancelled due to aircraft problems).
• We optimized our dropsonde launch procedure to increase the horizontal density of dropsondes.
• We conducted comparisons of dropsondes and radiosondes launched from ship by a separately funded ONR project (Overland).
Fig. 1. Synoptic maps over the SIZRS domain for the June 19 (left), July 16 (middle) and August 16
(right) fights. The nested domain boundaries are shown in thick black lines. The 850-1000 hPa thickness is shown in color shading, surface pressure contours in thin gray lines and the surface
winds in green vectors. The 15% sea ice concentration contours are shown in thick blue lines. The locations of dropsondes for the June, July, and August SIZRS fights are shown as light green dots
in left panel, middle panel, and right panel respectively. Modeling: • A post-doctoral research associate, Zheng Liu, was hired to conduct WRF model experiments.
• We conducted Weather Research and Forecast (WRF) model simulations for the summer of 2014 and compared with the NCEP Global Forecast System (GFS) and ERA-Interim reanalysis data. The results are consistent with our previous study of the 2013 simulations (Liu et al., 2015). .

4
• We constructed a k-mean clustering synoptic classification algorithm using ERA-Interim reanalysis data to investigate the role of synoptic conditions on the vertical structure of atmosphere, cloud, and their interactions with sea ice.
• We applied the synoptic classification algorithm to determine the synoptic conditions of the SIZRS flights and studied the relationship between synoptic conditions and the observed atmospheric profiles
• We conducted forecast experiments with the Marginal Ice Zone Modeling and Assimilation System (MIZMAS) and assessed the quality of sea ice drift forecasts from 6 hours to 9 days. We examined the role of wind forcing.
Advanced Observation Platforms (IR Dropsonde, GliderSonde, SmartSonde): • Work on a SmartSonde development to obtain detailed atmospheric parameters and cloud top and
base and can be launched from C-130 is progressing. In order to accelerate approval we modified the initial design from a motorized SmartSonde to a GliderSonde concept. We conducted SOFT tests for “GliderSonde” systems. ACCB approval is reportedly imminent. A more detailed report is submitted separately by Co-Investigators Lawrence and Maslanik.
• In collaboration with the vendor (MeteoModem) we modified the standard dropsonde platform to host an additional set of IR radiometers (IR dropsonde). These sensors are designed to provide cloud top and base heights. We validated the methodology using a balloon launched sensor package in Colorado and have conducted several field deployments with overflights of ice-breaker based and land-based ceilometers. Initial results indicate a good agreement of cloud top and base heights visually retrieved from air craft (See also separate project report by Co-Investigators Lawrence and Maslanik)
RESULTS To better understand the atmospheric profiles observed from the SIZRS flights and their relationship to the synoptic weather conditions and the interaction with sea ice in the BCSIZ domain, we constructed four distinct synoptic mean states from the ERA-Interim reanalysis using the k-mean clustering algorithm.

5
Fig. 2. Synoptic maps of the 700 hPa temperature (color shading, in °C), geopotential height (in solid gray lines, darker for higher values), and horizontal winds of the four synoptic regimes mean state of June, July, August, and September. The mean states are generated using the ERA-Interim
6-hourly data between 2007 and 2011. The dashed red lines in upper left panel outline the boundaries of the BCSIZ domain used for the synoptic classification.
The map of temperature, winds, and geopotential height of the mean states of the four regimes at 700 hPa level are shown in Fig. 2 as an example. Both the BCSIZ domain (outlined by the dashed red lines in the upper left panel) and the larger domain are presented to more clearly demonstrate the ambient synoptic conditions of the four mean states. The first state (S01) is associated with a high pressure over the western part of the BCSIZ domain and northerly winds to the east, where there is strong

6
baroclinicity and cold advection from the central Arctic. The baroclinicity is shown in Fig. 2 by the gradient of geopotential height and temperature, and the crossing angle between the geopotential height contours and temperature contours. The second state (S02) is associated with low pressure over the northeastern part of the BCSIZ domain and is dominated by easterly and northeasterly winds. Compared to S01, S02 has much weaker baroclinicity and weaker cold advection from the Siberian side of the Arctic Ocean. The third state (S03) is associated with a high pressure system to the southeast, far into the North America continent and the low pressure system is also far to the northeast over the Siberian side of the Arctic Ocean. The fourth state (S04) is characterized by a high pressure centered over the Beaufort Sea, which results in very strong warm advection in the western half of the BCSIZ domain and cold advection to the east, close to the eastern edge of the BCSIZ domain. Similar to S01, S03 is also a state with strong baroclinicity. The conditions of S03 are more equivalent barotropic (“barotropic” hereafter for simplicity) over Alaska and more baroclinic over the BCSIZ domain, although not as strong as in S01 and S04. In addition to the weaker baroclinicity compared S04, the warmest air mass in S03 resides deep inland, while in S04 the warmest air mass is over Alaska and very close to the strongest southerly winds. The combined effect is a much stronger warm advection and warmer atmosphere in S04 than in S03.
Fig. 3. The vertical profiles of the ERA-Interim mean temperature, water vapor mixing ratio, relative humidity, and horizontal wind speed during JJAS in the BCSIZ domain.
The vertical profiles of domain mean temperature, moisture, and winds of the mean states are shown in Fig. 3. The two states associated with cold advection (S01 and S02) are colder and hold less water vapor than the other two state associated with warm advection (S03 and S04). The state S04 is not only the warmest state but also strongly stratified in the lower levels, with a 4 K mean inversion around 750 m. Although the water vapor mixing ratio is highest in S04, its relative humidity is lowest. This is likely due to the continental origin of the air mass in the BCSIZ domain and the downslope warming and drying over the Brooks Range. Both S01 and S04 have much stronger mean winds in the lower 500 m and more evident low-level jets (LLJ) than the other two states, which is likely due to their stronger baroclinicity. The other two states (S02 and S03) have weaker near surface wind than higher up at 2.5 km.
7
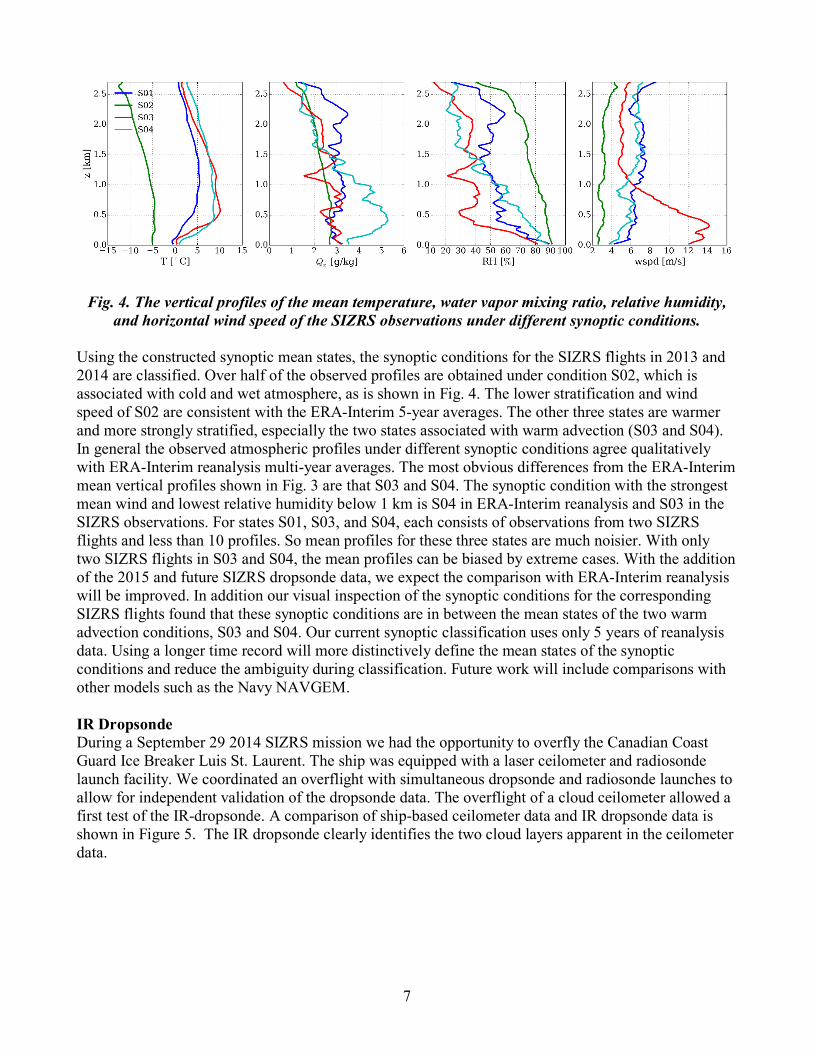
Fig. 4. The vertical profiles of the mean temperature, water vapor mixing ratio, relative humidity, and horizontal wind speed of the SIZRS observations under different synoptic conditions.
Using the constructed synoptic mean states, the synoptic conditions for the SIZRS flights in 2013 and 2014 are classified. Over half of the observed profiles are obtained under condition S02, which is associated with cold and wet atmosphere, as is shown in Fig. 4. The lower stratification and wind speed of S02 are consistent with the ERA-Interim 5-year averages. The other three states are warmer and more strongly stratified, especially the two states associated with warm advection (S03 and S04). In general the observed atmospheric profiles under different synoptic conditions agree qualitatively with ERA-Interim reanalysis multi-year averages. The most obvious differences from the ERA-Interim mean vertical profiles shown in Fig. 3 are that S03 and S04. The synoptic condition with the strongest mean wind and lowest relative humidity below 1 km is S04 in ERA-Interim reanalysis and S03 in the SIZRS observations. For states S01, S03, and S04, each consists of observations from two SIZRS flights and less than 10 profiles. So mean profiles for these three states are much noisier. With only two SIZRS flights in S03 and S04, the mean profiles can be biased by extreme cases. With the addition of the 2015 and future SIZRS dropsonde data, we expect the comparison with ERA-Interim reanalysis will be improved. In addition our visual inspection of the synoptic conditions for the corresponding SIZRS flights found that these synoptic conditions are in between the mean states of the two warm advection conditions, S03 and S04. Our current synoptic classification uses only 5 years of reanalysis data. Using a longer time record will more distinctively define the mean states of the synoptic conditions and reduce the ambiguity during classification. Future work will include comparisons with other models such as the Navy NAVGEM. IR Dropsonde During a September 29 2014 SIZRS mission we had the opportunity to overfly the Canadian Coast Guard Ice Breaker Luis St. Laurent. The ship was equipped with a laser ceilometer and radiosonde launch facility. We coordinated an overflight with simultaneous dropsonde and radiosonde launches to allow for independent validation of the dropsonde data. The overflight of a cloud ceilometer allowed a first test of the IR-dropsonde. A comparison of ship-based ceilometer data and IR dropsonde data is shown in Figure 5. The IR dropsonde clearly identifies the two cloud layers apparent in the ceilometer data.

8
Figure 5 Time (bottom x-axis) height (y-axis) section of lidar backscatter from the ship-based ceilometer. Red to blue show backscatter values with increasing magnitude. The IR sonde
profile is shown in white relative to the top x axis (IR units) with a smoothed version overplotted in red, The ceilometer backscatter data shows two distinct cloud layers which are clearly
identified by the IR dropsonde Sea Ice Forecast Experiments We tested our ability to forecast sea ice motion. Sea ice motion is strongly influenced by the surface wind and our ability to forecast winds accurately will likely be the key towards improvement in predicting the movement of sea ice. This in turn is tied to the ability to provide the sea ice model with accurate atmospheric forcings. So far, relatively little is published on how well we can forecast sea ice motion with the current generation of atmospheric forecast and sea ice models. To fill this gap we conducted a forecast experiment in which the Marginal Ice Zone Modeling and Assimilation System (MIZMAS), currently being developed under separate ONR funding, was forced with atmospheric forcings from the NOAA Climate Forecast System (CFS). Forecast ice motion for 1-9 days was compared with observed ice motion from buoys and other platforms (e.g. assets deployed during the ONR MIZ experiment). Forecast errors for speed and position are compared with reference forecasts generated using an ice velocity climatology driven by multi-year integrations of the same model. The results are examined in the context of a practical application: The scheduling of the acquisition of high-resolution images that need to follow buoys or scientific research platforms. RMS errors for ice speed are on the order of 5 km/day for 24 hr to 48 hr since forecast using the sea ice model compared with 9 km/day using climatology. Predicted buoy position RMS errors are 6.3 km for 24 hr and 14 km for 72 hr since forecast. Model biases in ice speed and direction can be reduced by adjusting the air drag coefficient and water turning angle, but the adjustments do not affect verification statistics. This suggests that improved atmospheric forecast forcing may further reduce the forecast errors. The model remains skillful for 8 days. Using the forecast model increases the probability of tracking a target drifting in sea ice with a 10x10 km image from 60% to 95% for a 24-hr forecast and from 27% to 73% for a 48-hr forecast (Figure 6). An initial assessment of drift error sources suggests that improvements in wind forecasts will likely yield the most immediate improvement in sea ice motion forecasts. Figure

9
7 shows the decorrelation of wind velocity between forecast (CFS) and analysis (NCEP) which shows a sharp drop over the initial 48 hours.
a)
b)
Figure 6 Histogram of position errors for the forecast model and for positions predicted using
climatology for a) 24 hr since forecast and b) 48 hr since forecast. Solid curves indicate cumulative probabilities. Vertical lines show median errors for forecast and climatology, respectively
Figure 7 Correlation coefficient between wind velocity between CFS-V2 forecast and NCEP/NCAR reanalysis.
IMPACT/APPLICATIONS The vertical structure of the atmospheric profiles and cloud are regulated by the synoptic conditions. Using our k-mean classification algorithm, we are able to investigate the interactions between atmosphere, cloud, and the underlying sea ice under similar synoptic conditions. This approach allows us to focus on the different physical processes involved in these interactions. For example, under synoptic conditions S02, the weak stratification and wet conditions favor the cloud formation and maintenance. The cloud and radiative processes might be more important for the underlying sea ice. Under synoptic condition S04, the warm, dry, and strongly stratified atmosphere suppress the cloud formation. The associated stronger low level winds might be more important forcing for sea ice. In addition, evaluation of Polar-WRF simulations under different synoptic conditions will help to more
10
clearly identify the deficiencies in the representation of these processes and identify the pathway to improve the weather and sea ice forecast in the BCSIZ region. New technology developments such as the IR dropsonde and the GliderSonder will provide opportunities to inexpensively obtain data that is otherwise not available (i.e. cloud base) and allow more detailed data collection across the ice-edge. Our evaluation of sea ice drift forecasts skills provides a baseline from which improvements in the future can be measured. As a multi-year integrated observation and modeling study, SIZRS is well positioned to advance our predictive capabilities in the BCSIZ. RELATED PROJECTS Zhang (PI) MIZMAS: Modeling the Evolution of Ice Thickness and Floe Size Distributions in the Marginal Ice Zone of the Chukchi and Beaufort Sea (ONR, MIZ DRI)
Morison (PI) Ocean Profile Measurements During the SIZRS (ONR Core)
Steele (PI). UptempO buoys for understanding and prediction (ONR-Core)
Lindsay (PI). Visible and Thermal Images of Sea Ice and Open Water from the Coast Guard Arctic Domain Awareness Flights (ONR-Core) Rigor (PI). International Arctic Buoy Program (ONR-Core)
Morison (PI). SIZRS Coordination (ONR-Core) Tschudi (PI). CUPLIS-X (ONR-Core) Overland (PI). (ONR-Core)
PUBLICATIONS Schweiger, A, and J.L. Zhang (2015). Accuracy of short-term sea ice drift forecasts using a coupled
ice-ocean model. Journal of Geophysical research [submitted, refereed] Lindsay, R., and A. Schweiger (2015), Arctic sea ice thickness loss determined using subsurface,
aircraft, and satellite observations, The Cryosphere, 9(1), 269-283, doi: 10.5194/tc-9-269-2015. [published, refereed]
Liu, Z., A. Schweiger, and R. Lindsay (2014), Observations and modeling of atmospheric profiles in the Arctic Seasonal Ice Zone, submitted to Mon. Wea. Rev [published, refereed].
Zhang, J., R. Lindsay, A. Schweiger, and M. Steele (2013), The impact of an intense summer cyclone on 2012 Arctic sea ice retreat, Geophys. Res. Lett, n/a-n/a, doi: 10.1002/grl.50190 [published, refereed].
Zhang, J. L., R. Lindsay, A. Schweiger, and I. Rigor (2012), Recent changes in the dynamic properties of declining Arctic sea ice: A model study, Geophys. Res. Lett, 39 [published, refereed].
Lindsay, R., M. Wensnahan, A. Schweiger, and J. Zhang, Evaluation of seven different atmospheric reanalysis products in the Arctic, J. Climate, 27, 2588-2606, doi: http://dx.doi.org/10.1175/JCLI-D-13-00014.s1, 2014 [published, refereed].
Zhang, J., A. Schweiger, M. Steele, and H. Stern, Sea ice floe size distribution in the marginal ice zone: Theory and numerical experiments, J. Geophys. Res., 120, doi:10.1002/2015JC010770, 2015 [published, refereed].