14 esri india user conference 2013 vulnerability to fire...
TRANSCRIPT

14
th Esri India User Conference 2013
Page 1 of 12
Vulnerability to Fire Hazard and capacity assessment Case study of Delhi
Dr.Mukta Girdhar 1, Shri Sanjay Tomer2
1
Assistant Professor in the GGSIP University; 2
Divisional Officer in the Org, Delhi fire Service
Abstract: Fires cause the greatest loss of life and property whether it is the case of forest fires, urban fires or rural fires. Urban fires have devastating impacts on communities. Unplanned urbanization and uncontrolled population has intensified the problem further. The number of fire incidents in Delhi is increasing day after day. Community participation is imperative to mitigate such disasters at community level. In order to strengthen the resilience of a community towards fire hazards, before they become disasters, a comprehensive risk and vulnerability assessment of fire Hazard is essential to assess structural, non-structural and community capacity. In this study, medium and serious incidences of fire outbreaks over last three years have been selected and plotted on a Map of Delhi to know which zone is highly vulnerable and then to analyze the existing fire control capacity . Firstly, a hazard map was created on the basis of attributes such as fire scenario, type of building and location of risk prone fire sources in the study area. Each of them was assigned a value using The Analytic Hierarchy Process. Then the following vulnerability analyses were conducted namely Fire vulnerability and critical facilities vulnerability. To accomplish these vulnerability analyses, data from various sources has been collected from Delhi Fire Service. Each of the vulnerability analysis includes certain specific steps which ultimately lead to a vulnerability map using ESRI ARCGIS technology, the data was processed and maps were prepared. After preparing the hazard map, it was overlaid with each of the maps like, maps of critical facilities, economic activities, etc. On the basis of some parameters and attributes, it was evaluated that which areas are highly vulnerable to fire in various aspects from every intersected map. Finally the overall vulnerability to fire hazard and capacity was assessed.
About the Author:
Dr.Mukta Girdhar Asstt. Professor Centre for disaster Guru Gobind singh Indraprasth University Dwarka, Sector-16-C, New Dehi-78 Mo-9818851737
Email: Mukta_Girdhar @ hotmail.com
Dr. Mukta Girdhar specializes in Disaster
Management, Geographic Information System and
Remote Sensing. She has over twelve years of
experience in imparting education in the field of
Disaster Management and GIS. She has guided
several dissertation related to disasters besides
publishing and presenting many research papers in
national and International Journals. She has
undergone many training courses at national and
International levels and is familiar with ArcGIS,
MapInfo, Erdas Imagine, and Illwis softwares.
Recent
Photograph
14
th Esri India User Conference 2013
Page 2 of 12
Introduction and Background
Delhi’s fourteen million residents live in a brewing crucible of hazards. In the city, road accidents and
fires occur each day. This is not the terminus of hazards faced by the residents of the city. Cinema halls char
the spectators, while industrial gas leakages poison already polluted lungs of the residents, houses collapse
burying families and bomb blasts and train accidents make frequent news headlines. Scientists have made an
addition to this by confirming that the city falls in a vulnerable seismic zone and is prone to floods as well. It is
very rarely realized that these hazards are characteristics of decaying urban processes.
Hazards are a process. They can be variable, worse, and mild or less offensive, their condition may
thus deteriorate, improve or acquire a whole lot of new features. Urban areas are the seed-beds of new and
complex socio-environmental arenas fostering unprecedented permutations and combinations of old and
new hazards. The city is not a static or homogeneous entity because it’s land use, population density, civic
amenities and other features show a sharp change and contrast. These processes are also not random in
space. Floods and other hazards take place at particular places, as they have specific origins. Fires erupt only
where the areas provide an opportunity to blaze. Hazards thus, are not distributed evenly.
In Delhi, the economies are concentrated and the teeming sea of millions are getting crammed up in overly
congested areas. Such a concentration of humans in numbers as well as activities make the common man
vulnerable to various kinds of risks arising from any kind of emergency situation out of the complicated urban
life. Emergency situations require a quick and focused response as human life and property may be involved.
It is recognized now that the greater proportion of poor quality housing, inadequate planning, monitoring
and control in metropolitan cities, which become overpopulated, lead to a greater number of fires and other
urban disasters.
In the past, the absence of proper regulations, legislation and planning particularly in the matter of fire
protection and related activities resulted in an increase in losses due to fire. Due to the rapid increase in
population, industrialization, rapid rise in new colonies, construction of high rise buildings, the fire risk in the
cities has been tremendously increasing. With the cities growing in size and complexity day by day they need
to be managed more and more efficiently. Aspects like planning and management of fire services should form
a part of Urban Management as a whole. To combat such a dangerous and widespread challenge, technology
can become a powerful ally in the fight against fire and can help combat any kind of emergency

14
th Esri India User Conference 2013
Page 3 of 12
Data Collection
Station wise fire incident reports and other calls in Delhi Fire Service year 2013
Station Name Apr-13 May-13 Jun-13 Total
Connaught Circus 82 115 78 275
SPM Marg 34 53 37 124
Moti Nagar 44 73 47 164
Rani Jhansi Road 33 67 41 141
Safdar Jung 62 91 64 217
Mathura Road 63 91 64 218
Shahdara 28 66 26 120
Roop Nagar 87 179 147 413
Shanker Road 15 30 19 64
Laxmi Nagar 15 50 27 92
Chanakya Puri 67 89 44 200
Bhikaiji Cama Palace 82 108 59 249
Nehru Place 102 147 112 361
Parshad Nagar 43 50 54 147
Kirti Nagar 17 27 13 57
Teliwara 8 10 10 28
Wazir Pur 28 59 34 121
Darya Ganj 12 19 9 40
Geeta Colony 61 121 84 266
Rakab Ganj 28 20 16 64
Keshav Puram 71 119 90 280
Naraina 20 22 16 58
Janak Puri 80 156 103 339
Okhla 7 8 5 20
Narela 16 41 23 80
Jwala Puri 54 80 44 178
Rastrapati Bhawan 3 1 0 4
Sector-16 Rohini 43 67 41 151
Najafgarh 73 118 55 246
Sector-5 Rohini 82 141 102 325
Bhorgarh 64 80 25 169
Bawana 84 84 22 190
Jahangir Puri 86 156 77 319
Gokul Pur 50 67 53 170
Shastri Park 39 63 42 144
Paschim Vihar 11 27 20 58

14
th Esri India User Conference 2013
Page 4 of 12
Analysis and Interpretation
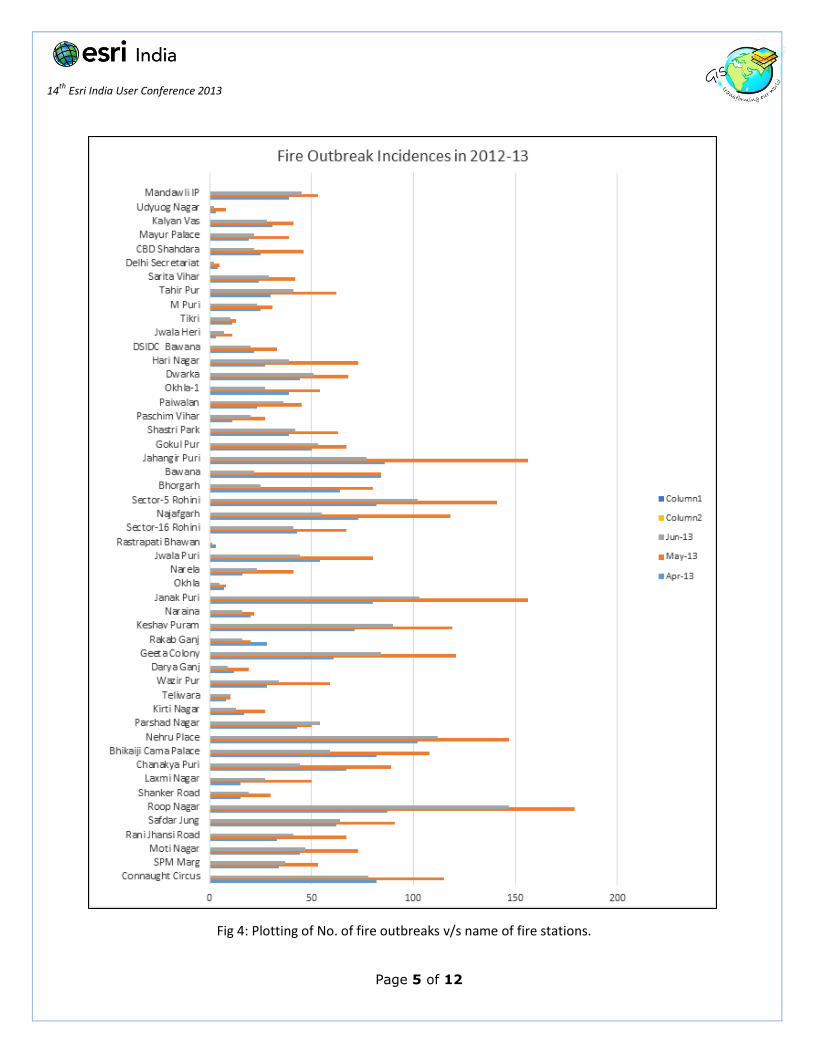
Data is plotted with fire outbreak incidences along x-axis and name of the fire stations along y-axis. The data
is plotted for the months in which number of fire outbreaks have been highest, namely April, May and June of
2013. After plotting the data we were able to conclude that;
Fire outbreaks in the month of May were almost 40 percent more than April and June.
The highest number of calls were recorded in the following fire stations, namely, Roop Nagar,
Jahangir Puri, Janak Puri, Nehru Placee, Rohini Sector-5, Geeta Colony, Keshav Puram, Najafgarh,
Cannaught Place and Bhikaji Cama.
Study also shows that the above areas are also industrially and officially oriented.
Paiwalan 23 45 36 104
Okhla-1 39 54 27 120
Dwarka 44 68 51 163
Hari Nagar 27 73 39 139
DSIDC Bawana 22 33 20 75
Jwala Heri 3 11 7 21
Tikri 11 13 10 34
M Puri 25 31 23 79
Tahir Pur 30 62 41 133
Sarita Vihar 24 42 29 95
Delhi Secretariat 4 5 2 11
CBD Shahdara 25 46 22 93
Mayur Palace 19 39 22 80
Kalyan Vas 31 41 28 100
Udyuog Nagar 3 8 2 13
Mandawli IP 39 53 45 137
HQ Total 2063 3319 2107 7489
14
th Esri India User Conference 2013
Page 5 of 12
Fig 4: Plotting of No. of fire outbreaks v/s name of fire stations.

14
th Esri India User Conference 2013
Page 6 of 12
Fig 5: Detailed plot of the highly prone areas.
The data for the highly prone areas has been re-plotted with names of fire stations along x axis and number
of incidences along y axis. From the above data plotting, we conclude that;
Roop Nagar fire station has recorded the highest number of fire outbreaks.
On the basis of incidences recorded, the above highly incidence prone fire stations can be classified
as:
Category 1 (More than 160 incidents reported):- Roop Nagar
Category 2 (No. of incidents between 140 to 160):- Jahangir Puri, Janak Puri and Nehru Place
Category 3 (No. of incidents reported less than 140):- Rohin Sector-5, Geeta Colony, Keshav Puram,
Najaf Garh, Cannaught Place and Bhikaji Cama Place.
0
20
40
60
80
100
120
140
160
180
200
Plot of Fire outbreaks in highly risk prone areas
Apr-13 May-13 Jun-13

14
th Esri India User Conference 2013
Page 7 of 12
Cumulative Analysis and Interpretation for 2010-2013
The Average data for each month from 2010 to 2013:
FIRE STATION NAME APRIL MAY JUNE
Connaught Circus 86.33333 104.3333 61.66667
SPM Marg 40.33333 54.66667 39.66667
Moti Nagar 50 76.33333 42
Rani Jhansi Road 52 59.33333 42.33333
Safdar Jung 72.66667 66.66667 59.33333
Mathura Road 72.66667 82.33333 57.66667
Shahdara 38.33333 58.33333 32.66667
Roop Nagar 85.33333 149.3333 112.3333
Shanker Road 23.66667 28.66667 24.33333
Laxmi Nagar 34 56 33
Chanakya Puri 73 74 51.66667
Bhikaiji Cama Palace 93.66667 111.3333 59.66667
Nehru Place 126 149 103.3333
Parshad Nagar 45.66667 58.33333 54
Kirti Nagar 20.66667 24 20.33333
Teliwara 9.666667 10.33333 11
Wazir Pur 38.66667 58.33333 34
Darya Ganj 13.66667 19 11.66667
Geeta Colony 62 96.66667 64.33333
Rakab Ganj 25 15.33333 11.33333
Keshav Puram 69 108.6667 80
Naraina 22.66667 24.66667 16
Janak Puri 98.33333 143.6667 92.33333
Okhla 9 11.33333 7.666667
Narela 24.33333 34 20.33333
Jwala Puri 54 70 40.33333
Rastrapati Bhawan 3.333333 1 0
Sector-16 Rohini 46 60 36.66667
Najafgarh 87.66667 93.66667 55.33333
Sector-5 Rohini 97.66667 119.3333 94
Bhorgarh 59.66667 52.66667 27.66667
Bawana 63.66667 65.33333 24.33333
Jahangir Puri 82.66667 108.6667 61
Gokul Pur 52.33333 58.66667 39.66667
14
th Esri India User Conference 2013
Page 8 of 12
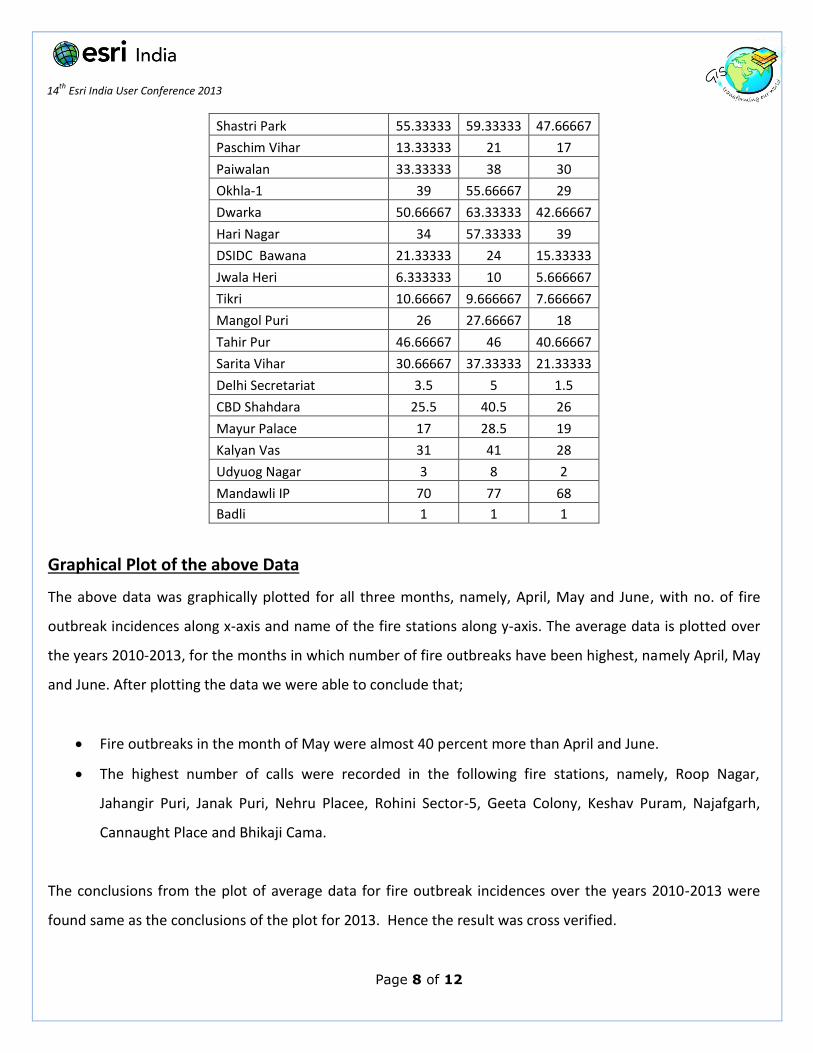
Shastri Park 55.33333 59.33333 47.66667
Paschim Vihar 13.33333 21 17
Paiwalan 33.33333 38 30
Okhla-1 39 55.66667 29
Dwarka 50.66667 63.33333 42.66667
Hari Nagar 34 57.33333 39
DSIDC Bawana 21.33333 24 15.33333
Jwala Heri 6.333333 10 5.666667
Tikri 10.66667 9.666667 7.666667
Mangol Puri 26 27.66667 18
Tahir Pur 46.66667 46 40.66667
Sarita Vihar 30.66667 37.33333 21.33333
Delhi Secretariat 3.5 5 1.5
CBD Shahdara 25.5 40.5 26
Mayur Palace 17 28.5 19
Kalyan Vas 31 41 28
Udyuog Nagar 3 8 2
Mandawli IP 70 77 68
Badli 1 1 1
Graphical Plot of the above Data
The above data was graphically plotted for all three months, namely, April, May and June, with no. of fire
outbreak incidences along x-axis and name of the fire stations along y-axis. The average data is plotted over
the years 2010-2013, for the months in which number of fire outbreaks have been highest, namely April, May
and June. After plotting the data we were able to conclude that;
Fire outbreaks in the month of May were almost 40 percent more than April and June.
The highest number of calls were recorded in the following fire stations, namely, Roop Nagar,
Jahangir Puri, Janak Puri, Nehru Placee, Rohini Sector-5, Geeta Colony, Keshav Puram, Najafgarh,
Cannaught Place and Bhikaji Cama.
The conclusions from the plot of average data for fire outbreak incidences over the years 2010-2013 were
found same as the conclusions of the plot for 2013. Hence the result was cross verified.

14
th Esri India User Conference 2013
Page 9 of 12
14
th Esri India User Conference 2013
Page 10 of 12
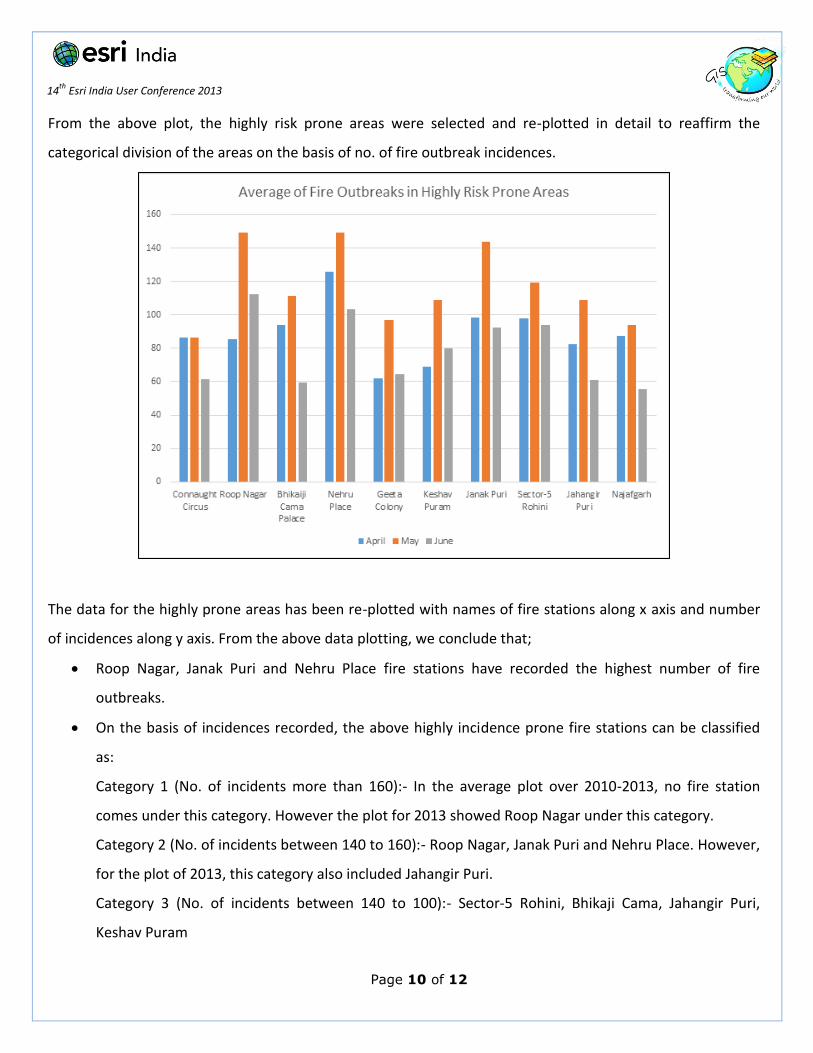
From the above plot, the highly risk prone areas were selected and re-plotted in detail to reaffirm the
categorical division of the areas on the basis of no. of fire outbreak incidences.
The data for the highly prone areas has been re-plotted with names of fire stations along x axis and number
of incidences along y axis. From the above data plotting, we conclude that;
Roop Nagar, Janak Puri and Nehru Place fire stations have recorded the highest number of fire
outbreaks.
On the basis of incidences recorded, the above highly incidence prone fire stations can be classified
as:
Category 1 (No. of incidents more than 160):- In the average plot over 2010-2013, no fire station
comes under this category. However the plot for 2013 showed Roop Nagar under this category.
Category 2 (No. of incidents between 140 to 160):- Roop Nagar, Janak Puri and Nehru Place. However,
for the plot of 2013, this category also included Jahangir Puri.
Category 3 (No. of incidents between 140 to 100):- Sector-5 Rohini, Bhikaji Cama, Jahangir Puri,
Keshav Puram
14
th Esri India User Conference 2013
Page 11 of 12
Category 4 (No. of incidents reported less than 100):- Geeta Colony, Najaf Garh and Cannaught Place.
Hence, from the graphical interpretation, it is observed that the above highly risk prone areas need special
attention in the context that their fire handling capacity needs to be improved. Moreover, there is a lot that
can be learned from the above data. By assessing the above data, we were able to pin point the risk prone
areas. This study can help us take preventive measures from beforehand and be prepared with mitigative
strategies. Also, by understanding the main factors causing these fire outbreaks, we can take steps to control
those factors. For example, if an area is affected due to shot circuits and other such electricity oriented
issues, or at industrial places, mock drills and informative sessions can be conducted to help at these places.
Moreover, by understanding the traffic situations of an area, the area can be equipped with a greater number
of small mobile fire stations at lesser distances. So that in advent of a fire outbreak, the nearest mobile van
can reach the place as soon as possible without getting caught in traffic so that it can prevent the fire from
becoming serious.
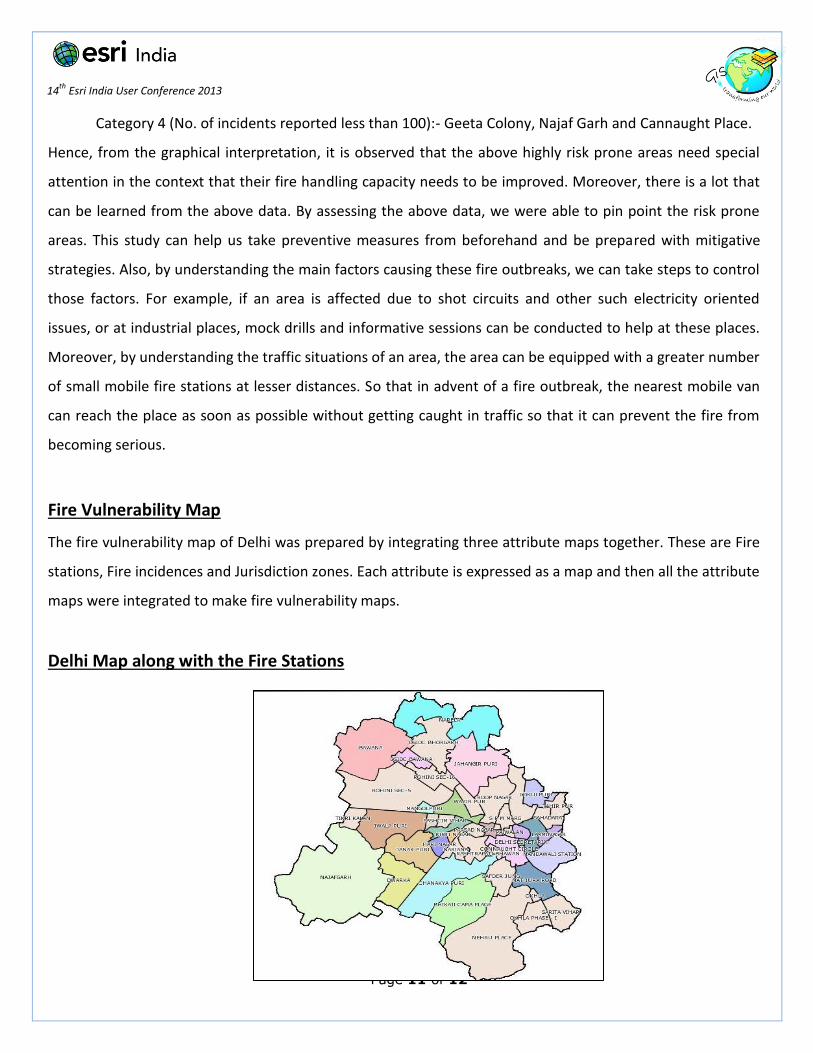
Fire Vulnerability Map
The fire vulnerability map of Delhi was prepared by integrating three attribute maps together. These are Fire
stations, Fire incidences and Jurisdiction zones. Each attribute is expressed as a map and then all the attribute
maps were integrated to make fire vulnerability maps.
Delhi Map along with the Fire Stations
Fig 6: The fire stations in Delhi.
14
th Esri India User Conference 2013
Page 12 of 12
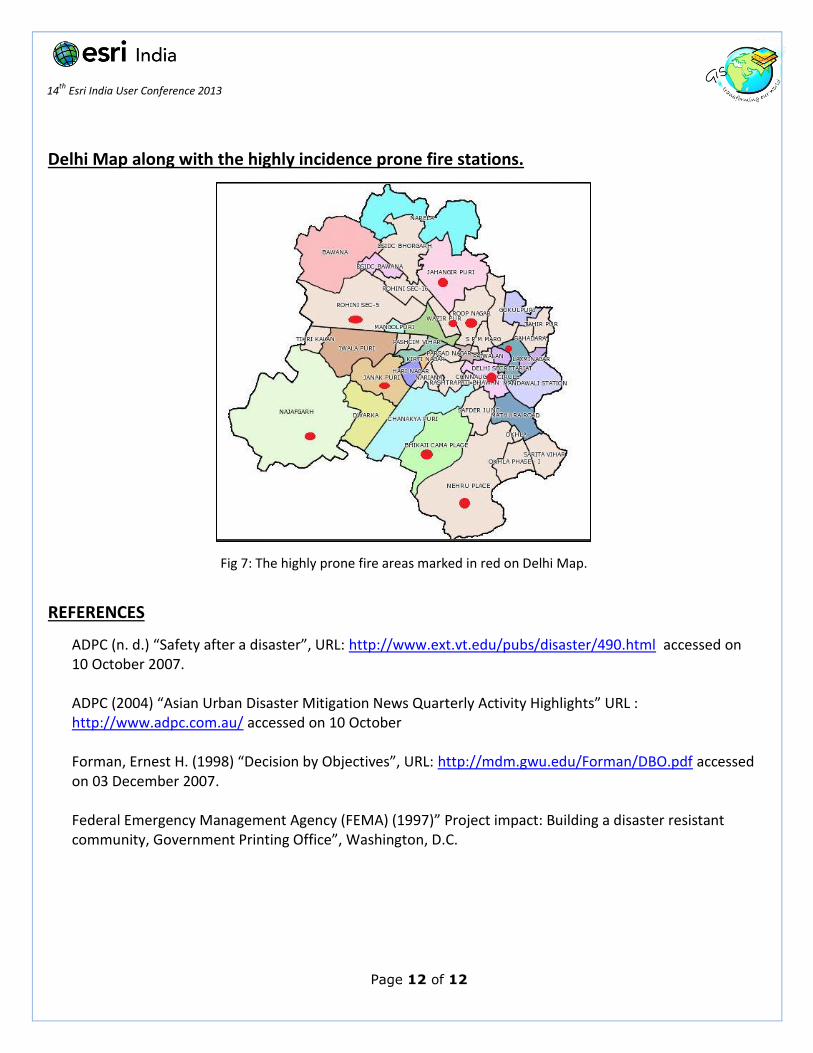
Delhi Map along with the highly incidence prone fire stations.
Fig 7: The highly prone fire areas marked in red on Delhi Map.
REFERENCES
ADPC (n. d.) “Safety after a disaster”, URL: http://www.ext.vt.edu/pubs/disaster/490.html accessed on 10 October 2007. ADPC (2004) “Asian Urban Disaster Mitigation News Quarterly Activity Highlights” URL : http://www.adpc.com.au/ accessed on 10 October Forman, Ernest H. (1998) “Decision by Objectives”, URL: http://mdm.gwu.edu/Forman/DBO.pdf accessed on 03 December 2007. Federal Emergency Management Agency (FEMA) (1997)” Project impact: Building a disaster resistant community, Government Printing Office”, Washington, D.C.