13f0026mie proposal for an asset and debt survey
TRANSCRIPT

13F0026MIE
Proposal for anAsset and Debt Surv ey
Prepared by Statistics Canada in pa rtnership with :Applied Resea rch BranchHuman Resou rces Development Canada
September 1997

Data in many forms
Statistics Canada disseminates data in a variety of forms. In addition to publications, both standard and special tabulations areoffered. Data are available on the Internet, compact disc, diskette, computer printouts, microfiche and microfilm, and magnetic tape.Maps and other geographic reference materials are available for some types of data. Direct online access to aggregated informationis possible through CANSIM, Statistics Canada’s machine-readable database and retrieval system.
How to obtain more information
Inquiries about this product and related statistics or services should be directed to: Client Services, Income Statistics Division,Statistics Canada, Ottawa, Ontario, K1A 0T6 (telephone: (613) 951-7355 or 1 888 297-7355 or by internet: [email protected] to the Statistics Canada Regional Reference Centre in:
Halifax (902) 426-5331 Regina (306) 780-5405Montréal (514) 283-5725 Edmonton (403) 495-3027Ottawa (613) 951-8116 Calgary (403) 292-6717Toronto (416) 973-6586 Vancouver (604) 666-3691Winnipeg (204) 983-4020
You can also visit our World Wide Web site: http://www.statcan.ca
Toll-free access is provided for all users who reside outside the local dialing area of any of the Regional Reference Centres.
National enquiries line 1 800 263-1136
National telecommunications device for the hearing impaired 1 800 363-7629
Order-only line (Canada and United States) 1 800 267-6677
Ordering/Subscription information
Catalogue no. 13F0026MIE, is available on Internet free.
The paper version can be ordered through Client Services, Income Statistics Division.
Standards of service to the public
Statistics Canada is committed to serving its clients in a prompt, reliable and courteous manner and in the official language of theirchoice. To this end, the agency has developed standards of service which its employees observe in serving its clients. To obtaina copy of these service standards, please contact your nearest Statistics Canada Regional Reference Centre.

Statistics CanadaIncome Statistics Division
Proposal for anAsset and Debt Survey
Note of appreciation
Canada owes the success of its statistical system to a long-standing partnership betweenStatistics Canada, the citizens of Canada, its businesses, governments and other institutions.Accurate and timely statistical information could not be produced without their continuedcooperation and goodwill.
Published by authority of the Minister responsible for Statistics Canada
© Minister of Industry, 1999
All rights reserved. No part of this publication may be reproduced, stored in a retrieval system ortransmitted in any form or by any means, electronic, mechanical, photocopying, recording orotherwise without prior written permission from Licence Services, Marketing Division, StatisticsCanada, Ottawa, Ontario, Canada K1A 0T6.
March 1999
Catalogue no. 13F0026MIE
Ottawa
La version française de cette publication est disponible sur demande (no 13F0026MIF au catalogue).

Proposal for an Asset and Debt Survey 3
Statistics Canada 13F0026MIE - 99003
NOTE:
Change the name of survey: Since this report was completed, the name of the survey has been changedfrom the Asset and Debt Survey to the Survey of Financial Security. This was done to better reflect the factthat the survey, as well as aiming to develop a balance sheet for different types of Canadian families, is alsoseeking to examine issues such as financial vulnerability and the extent of which Canadians are able to savefor the future.
Change to timing of survey: Because of funding considerations, the survey is now planned for May andJune of 1999. A field test (using about 1,000 households) will be done in May and June of 1998.
Questions or comments about this document and / or about the survey can be directed to:
Karen Maser,Project Manager,Asset and Debt Survey / Survey of Financial Security,Income Statistics DivisionPhone: 613-951-0793Fax: 613-951-3253E-mail: [email protected]

Proposal for an Asset and Debt Survey 4
Statistics Canada 13F0026MIE - 99003
Acknowledgements
This document was edited by Karen Maser from the contributions of a number of people in Statistics Canada,including:
Helene BerardTed HuttonSylvie MichaudMargot ShieldsHelen SmithMyles Zyblock
The content of this paper has also been influenced by the work of several other people, whose role has beenvery important to the development of this survey. They include:
Christine ArsenaultJonathan EllisonGreg HaymesMichel PilloudCarl SarazinMarc St.-Denis
The input of Satya Brink from Human Resources Development Canada has been most helpful and is gratefullyacknowledged.
Proposal for an Asset and Debt Survey 5
Statistics Canada 13F0026MIE - 99003
Acronyms used in this document
ADS Asset and Debt SurveyCAI Computer-assisted interviewingC/QPP Canada and Québec Pension PlansDB Defined benefitDC Defined contributionDPSP Deferred Profit Sharing PlanEF Economic family EI Employment InsuranceFAMEX Family Expenditure Survey (now called Survey of Household Spending)GIC Guaranteed Investment CertificateGIS Guaranteed Income SupplementGST Goods and Services TaxLFS Labour Force SurveyLIF Life Income FundLIRA Locked-in Retirement AccountLRIF Locked-in Retirement Income FundMBS Mortgage-backed securitiesMRC Microdata Release CommitteeOAS Old Age SecurityPAPI Pen and paper interviewingPPIC Pension Plans in CanadaRESP Registered Education Savings PlanRHOSP Registered Home Ownership Savings PlanRP Reference personRPP Registered Pension PlanRRIF Registered Retirement Income FundRRSP Registered Retirement Savings PlanSA Social AssistanceSCF Survey of Consumer FinancesSHS Survey of Household Spending (previously FAMEX)SLID Survey of Labour and Income DynamicsSNA System of National AccountsSPA Spouse’s Allowance

Proposal for an Asset and Debt Survey 6
Statistics Canada 13F0026MIE - 99003
TABLE OF CONTENTS
Acknowledgements 4
Acronyms 5
1. Introduction 9
2. Background 10
2.1 Previous asset and debt surveys 10
2.2 Proposed enhancements for the 1998 survey 10
3. Survey objectives 11
4. Conceptual framework for a new asset and debt survey 13
4.1 Relationship to other Statistics Canada data 13
4.2 Defining and accumulating wealth 13
4.3 A potential asset and debt accounting framework 14
4.4 Principle for valuing assets and debts 18
4.5 Reference period for data 18
4.6 Unit of observation 19
4.7 Challenges with surveying wealth 19
5. Data requirements 21
5.1 Process for determining content 21
5.2 Overview of content 21
5.3 Valuing pensions from RPPs and the C/QPP 30
5.4 Data from other sources 32
6. Survey design 33
6.1 Survey frame 33
6.1.1 LFS frame 33
6.1.2 Tax filer frame 34
6.1.3 Random digit dialling sample 34

Proposal for an Asset and Debt Survey 7
Statistics Canada 13F0026MIE - 99003
6.2 Response rate 35
6.3 Sample size 35
6.4 Level of precision 35
7. Collection methodology 37
7.1 Informing respondents 37
7.2 Collection method 37
7.3 Interviewer training 38
7.4 Proxy response 38
7.5 Computer assisted interviewing (CAI) versus paper questionnaire 38
7.6 Voluntary versus mandatory survey 38
7.7 Incentives 38
7.8 Required authorization from respondent 39
8. Testing 40
8.1 Issues to be resolved by testing 40
8.2 Timing of testing 40
9. An overview of system development 41
9.1 Introduction 41
9.2 Core system description 41
10. Analysis and dissemination 44
10.1 Staging of release of data 44
10.2 Data / analytical products 44
10.3 Other means of disseminating data 45
11. Survey costs and major milestones 46

Proposal for an Asset and Debt Survey 8
Statistics Canada 13F0026MIE - 99003
12. Management / co-ordination approach 48
12.1 Project team approach 48
12.2 Steering Committee 48
Appendix A Estimates of CVs assuming sample size of 15,000 and 30,000 49
References 51

Proposal for an Asset and Debt Survey 9
Statistics Canada 13F0026MIE - 99003
1. Introduction
This paper presents a proposal for conducting an Asset and Debt Survey (ADS). The data from the last suchsurvey carried out by Statistics Canada are well over a decade old, and the need for more up-to-dateinformation is growing.
The first step in preparing this proposal was the release, in February, 1997, of a document entitled "Towardsa New Canadian Asset and Debt Survey: A Content Discussion Paper". That paper, and this proposal, wereprepared in partnership with Human Resources Development Canada. The intent of the discussion paperwas to elicit feedback on the initial thinking regarding the content of the survey. We are grateful to those whoresponded to that document and have attempted to incorporate their comments and suggestions whereverpossible.
Data collection will take place in May and June of 1998. Although this requires a very tight implementationschedule, comments on this proposal are still welcome. In fact, there are some issues that have not yet beenfully resolved.
The response to the content discussion paper demonstrated the wide range of needs for this information.Although there was recognition of the burden on respondents in providing this information, many suggestionswere made to expand on the proposed content. It is very tempting to look upon this survey as the opportunityto meet all long unfulfilled needs for this type of information. However, a priority in designing the survey mustbe the concerns of respondents, given they will be asked to entrust us with very sensitive information. Thequality of the data will depend largely on our ability to keep those concerns in mind.
Proposal for an Asset and Debt Survey 10
Statistics Canada 13F0026MIE - 99003
2. Background
2.1 Previous asset and debt surveys
The last Canadian survey capturing detailed information on family and individual asset and debt holdings wasconducted in 1984. From 1955 to 1984, Statistics Canada collected asset and debt data on six separateoccasions, using the Survey of Consumer Finances (SCF). Over time, these surveys broadened in coveragefrom non-farm private households to all private households in Canada. Also, the categories of assets theycovered gradually expanded. The 1955 survey focused mainly on liquid asset holdings; by 1984, coverage hadincreased to include holdings of fixed and longer term assets. The most recent survey to include a separatesample of high wealth individuals was conducted in 1977. This was thought necessary to improve the incomeand wealth estimates at the upper end of the distributions. This practice, however, was not continued in the1984 survey. Information on participation in pension plans was collected in previous surveys; however, thevalue of these pensions was not included in publicly released information from any past survey, including the1984 survey.
To provide a point of comparison for the proposal that follows, a brief description of the 1984 survey would beuseful. That survey was conducted as a supplement to the May 1984 Survey of Consumer Finances. Thesample was selected from the Labour Force Survey (LFS) sampling frame; as stated above, it was notsupplemented with a sample of high-income earners, as was done in the 1977 survey.
In 1984, about 72% of the 14,155 sampled family units provided all of the supplementary data on which wealthestimates were based. In addition to the information collected for the Labour Force Survey, all family members15 years of age and over were asked to provide information on their income and their asset and debt position.Given the length and complexity of the information required, trained interviewers collected the data. Interviewers attempted to contact those members of the family most knowledgeable about the family's financialaffairs.
The income data collected were for the year 1983, whereas the asset and debt detail was reported as of thetime of the survey (May, 1984). The published data (see, for example, The distribution of wealth in Canada,catalogue 13-570) presented information for family units, which included economic families (a group ofindividuals sharing a common dwelling and related by blood, marriage or adoption) and unattached individuals.Geographic detail was provided for five economic regions.
2.2 Proposed enhancements for the 1998 survey
It is proposed that the current survey be as consistent as possible with former surveys, in order to generate atime-series on wealth categories and compositions embracing three decades of change. However, thefollowing enhancements are proposed for the current survey:
1) Valuing pensions - The value of the benefit received, or to be received, from pension plans(bothemployer pension plans and the C/QPP) constitute one of the largest assets of many individuals. In thissurvey, it is intended to estimate the value of both pensions currently being received and pensions peoplewill receive when they retire. This estimate must be made using a common set of assumptions appliedto all individuals.
2) High income sample - This survey will include a high income sample, to improve the wealth estimatesat the high end of the distribution.
3) Examining indebtedness - To allow for the examination of the dynamics of indebtedness, the surveywill collect additional information on behaviour and attitudes with respect to debt.

Proposal for an Asset and Debt Survey 11
Statistics Canada 13F0026MIE - 99003
3. Survey Objectives
Given the dated nature of information on the asset and debt position of Canadians, there is a growing needto update the information last collected in 1984. Many changes have taken place in Canada since that time.Some of these changes include:
• an increase in the incidence of non-standard work arrangements;
• an aging population, and changing retirement patterns;
• a flattening out in the growth of the number of dual-earner families;
• an expansion in the proportion of households now owning mutual funds and investing in RegisteredRetirement Savings Plans;
• nominal interest rates, and inflation, at their lowest levels in decades;
• an increase in the proportion of lone-parent families (from 1984 to 1994, the number of non-elderly lone-parent families increased nearly 30 percent, compared with an increase of just 19 percent for all non-elderly families);
• a recession in the early 1990s.
These events, taken together, signal that the distribution and composition of wealth in Canada must havechanged, and perhaps quite dramatically, since 1984. (In this paper the terms wealth and net worth are usedsynonymously. Although wealth suggests positive net worth it is important to note that these values can beeither positive or negative.) As a result of the changes listed above, many important policy issues need to beaddressed. Data from 1984 can no longer be used for this purpose.
Judging from the response to the discussion paper on the content of this survey, many groups have a keeninterest in the development of a new Asset and Debt Survey. Two broad collectives expected to takeadvantage of this information are governments and communities (e.g., special interest groups). Uses to whichthey can put the information include the following:
1) As part of the public policy process, income and wealth distribution data can be used:
• to design and implement new social and retirement income policies;
• to conduct analysis on a range of issues relating to equity and efficiency in the areas of taxation andincome maintenance.
2) As part of the community information process, this information can be used by government, media andcommunity organizations:
• to help keep the public informed about social and economic conditions;
• to provide individuals and organizations with the opportunity to keep governments accountable fortheir actions.

Proposal for an Asset and Debt Survey 12
Statistics Canada 13F0026MIE - 99003
As well, the survey can provide the business community with information to aid in analysing their markets.
What types of important information can be extracted from the statistics of a wealth survey? Outlined here arefour broad themes. Below each theme, a few possibilities are briefly described.
Expected Future Consumption - Net worth (i.e., assets less debts) is a better indicator of future consumptionpossibilities than current income. Thus, asset and debt data can provide an indication of the ability of familiesand individuals to adjust to unanticipated events, for example, job loss, extended periods of illness, or theeconomic consequences of marital dissolution. Moreover, net worth of the income-poor can be explicitlyexamined to uncover hardship and lifestyle implications.
Accumulation of Wealth over the Life Cycle - The accumulation of wealth is expected to increase rapidly upto one's prime-earning years. In retirement, a person's wealth declines as current consumption is financedprimarily by accumulated savings since current income is, most likely, comparatively quite small. With acollection of wealth data, one can estimate the shape of this wealth profile, if it has shifted, and how it hasshifted over time.'
Intergenerational Transfers - Estimates of assets and debts by age groupings could be used to estimatewealth that is potentially available for transfer from one age cohort to another.
Wealth Distribution - Estimates of the level (e.g., median) and dispersion (e.g., gini coefficient) of thedistribution, frequently related to income distribution studies in Canada, could be constructed to describe thedistribution of Canadian net worth. Using data from both the last detailed wealth survey in Canada and a newADS, one could determine how the distribution of net worth has changed over time.1
In summary, the main objectives of a new Canadian survey measuring asset and debt holdings of families andunattached individuals would be to:
1) provide a description of the nature and types of assets and debts held by Canadian individuals andfamilies, including the changes in the composition of assets and debts over the past few decades;
2) determine the manner in which wealth is distributed among the Canadian population:
3) develop a profile of Canadians holding different types of assets and debts;
4) examine the changes in asset and debt holdings over the life-cycle;
5) assess the future consumption capabilities of Canadians and their potential financial vulnerability,particularly if facing unforeseen events such as a reduction in income;
1
From cross-sectional data, one can only make informed guesses about the shape of this profile. Longitudinal data are neededto calculate the life-cycle wealth process for an individual or family.
6) assess the extent to which individuals' current assets will provide them with an income in retirement;
7) further study the relationship between income and wealth;
8) provide information on the extent to which assets are being, or could be, transferred from one generationto the next.

Proposal for an Asset and Debt Survey 13
Statistics Canada 13F0026MIE - 99003
Wealth (Net Worth) = Total Assets - Total Debts
4. Conceptual Framework for a New Asset and Debt Survey
4.1 Relationship to other Statistics Canada data
The conceptual model that guides the thinking for a new Asset and Debt Survey is based upon theexpectation that the proposed survey data will, in general, be comparable with those of its 1984 predecessor.The enhancements to content mentioned in the Background section will not preclude that comparison.
An important use of asset and debt data would be as input to Canada's national accounts balance sheet data;the ADS data can potentially be used to improve the balance sheet information. For example, StatisticsCanada currently publishes financial flow and wealth information for the personal sector. However, it isrecognized that the wealth information contained in the personal sector accounts also includes that ofunincorporated business. A household asset and debt survey would provide the information necessary toremove the wealth of unincorporated business from the personal sector of national wealth accounts. Ingeneral, a household asset and debt survey could be a primary benchmarking device for wealth data at thenational accounts level, a practice adopted in the United States. In other words, the development of theconceptual framework for an ADS should also, wherever possible, be based on national accountingconsiderations.
By the same token, national accounts data will serve as an important means of verifying the accuracy of theasset and debt information collected directly from households. Wherever possible, aggregate measuresavailable from other Statistics Canada sources will be used to measure the quality of the estimates producedby the ADS.
Statistics Canada conducts a number of other surveys that can be used to complement the data from anAsset and Debt Survey. Two are the Survey of Labour and Income Dynamics (SLID) and the Survey ofHousehold Spending (SHS, formerly FAMEX). Conducting the Asset and Debt Survey as a supplement toone of these surveys would maximize the amount of information available for analysis. But, because ofrespondent burden, which is significant for each of these surveys, such an option is not possible. Everyattempt will, however, be made to keep the concepts used in these surveys similar, so that the data from eachcan be interrelated (by looking at those in similar age and income groups, for example).
4.2 Defining and accumulating wealth
Wealth, commonly referred to as net worth, is a stock concept defined as the net asset position (total assetsless total debts) of a family or individual at a particular point in time. An individual's or a family's net worth canbe either positive or negative. It is based on the following accounting identity:
Assets are the resources that a family can use to fulfill its economic functions (including the generation ofincome and cash flow). Debts are the obligations of a family at a particular date used to acquire the assets orsatisfy current consumption. Both relate to a particular point in time but reflect past events leading up to thatpoint. Although conceptually simple to describe, there are serious practical issues in the measurement ofwealth, which will be discussed later.
Information on net worth is important because income (e.g., total income, disposable income) does notmeasure long-term, sustainable resources that can be considered the logical point of departure for assessingfuture income or consumption possibilities. Net worth, on the other hand, does capture the idea of futureconsumption possibilities by providing a money link between different periods of the wealth holder's life. It is

Proposal for an Asset and Debt Survey 14
Statistics Canada 13F0026MIE - 99003
important to understand the relationships between income and net worth; the former is a flow, the latter is astock, and they are interconnected through the function of savings.
To describe the idea of access to economic resources, the following simple characterization may be useful.First, it is helpful to distinguish between income, expenditure and wealth. In any given year, a person receivesresources from many different sources, including: earnings, investment income, and transfers fromgovernment. After allowing for direct and indirect taxes and any investment losses, a person can dispose ofthe remaining resources, if any, in three main ways: pass them on to others as a transfer, spend them, oraugment the existing stock of assets, adding to wealth (i.e., through savings or purchase of assets such as ahome). Savings would affect a person's investment income in the following year.
4.3 A potential asset and debt accounting framework
There are many ways to account for assets and debts. The framework used for this survey is, to some extent,influenced by the constraints of the surveying procedure. For example, it would be useful to adopt theconventional financial statement accounting framework of the balance sheet for an enterprise since, in theory,one can view the family in an analogous fashion to a business enterprise. This framework breaks out assetsand liabilities into a current portion and a long term, or fixed, portion providing a rich body of information toassess liquidity and solvency. However, in a survey setting this framework is impractical. 2 Moreover, there aremany definitions of wealth. For example, wealth can be defined to include only marketable assets over whichthe individual family has control, or can be expanded to incorporate non-marketable assets as well. As is shownin the following table, this survey will attempt to define assets in the broader sense. (This is not an exhaustivelist of all assets and debts, as it is presented primarily for illustrative purposes.)
2
For example, if it were possible to accurately break total debts into a current portion (i.e. the amount of total debt due within one year)and a long term portion (i.e. that portion of total debt that is not current), we would be able to appropriately assess the solvencyposition of families. However, this is an extremely difficult task in a household survey setting, and greatly increases the possibilityof double counting some components of net worth.

Proposal for an Asset and Debt Survey 15
Statistics Canada 13F0026MIE - 99003
Classification of Individual / Family Assets and Debts
Marketable (assetsover which controlexists, i.e. they can besold, spent, re-invested or exchangedfor other assets)
Financial assets such as:- chequing and savings accounts- term deposits, investment certificates- bonds (savings and other types)- stocks, mutual funds- non-locked-in pension savings in RRSPs,
RRIFs , DPSPsNon-financial assets such as:- owner occupied real estate- vacation home and other real estate- durables (e.g. vehicles - see discussion
below)Equity in business
Semi-marketable(assets over whichsome investmentcontrol exists but whichcannot be sold)
Locked-in pension savings in certain definedcontribution RPPs, locked-in RRSPs (LIRAs),LIFs, LRIFs, annuitiesCash value of permanent life insurance
Assets
Non-marketable(assets over whichlittle or no investmentcontrol exists andwhich cannot be sold)
Locked-in pension savings in most RPPs Face value of term life insurance policy
Debts Amount owing on:- credit cards- charge cards- loansMortgage debt on:- owner occupied real estate- vacation home and other real estate
Certain items referred to, either explicitly or otherwise, in the table above warrant additional comment:
1) Pensions / retirement savings
These savings can constitute one of the largest assets of many individuals / families and for that reason mustfall within the scope of the survey. That being said, establishing a value for certain types of pension savingsis not a straight-forward task. Pension savings can take the following forms:
i - Non-locked-in Registered Retirement Savings Plans (RRSPs), Registered Retirement Income Funds(RRIFs). Savings in RRSPs are made voluntarily by the contributor; contributions and investment earningsare tax-sheltered. (Contributions can also be made by a person to their spouse's RRSP.) The current valueof RRSPs should be known, from statements received from financial institutions or brokers. The individualcan, with a few exceptions, withdraw the money from their RRSP and use it for other purposes, althoughthere are tax implications for doing so. Once the individual reaches 69, the amount in an RRSP must beconverted to an RRIF or an annuity and payments must begin. The individual has a good deal of controlover the money in an RRIF, both in deciding how it will be invested and determining the pay out amount.
Proposal for an Asset and Debt Survey 16
Statistics Canada 13F0026MIE - 99003
In addition, amounts remaining in an RRIF at the time of death become part of the person's estate. It istherefore proposed that the value of RRSPs and RRIFs be considered marketable assets.
ii - Locked-in RRSPs (often called Locked-in Retirement Accounts (LIRAs)), Life Income Funds (LIFs),Locked-in Retirement Income Funds (LRIFS) and annuities. Conceptually, a LIRA is similar to anRRSP and both the LIF and LRIF are similar to an RRIF, with one important difference: the moneygenerally originates from an employer pension plan and is locked-in. For that reason, the person has lesscontrol over this money. These assets cannot be cashed in but the individual has some control over theinvestment of the money. Any money remaining in these plans at the time of death would become part ofthe individual's estate. It is proposed, therefore, that they be considered semi-marketable. In fact, therespondent may not be able to differentiate the amounts from those in (i) above. An individual has muchless control over the amount in an annuity. The investment of the money is determined by the insurancecompany from which it was purchased. Also, when the annuitant dies, the money reverts to the insurancecompany (except any amount that was guaranteed in the annuity). The amount in annuities will also beconsidered semi-marketable, although they do not precisely fit that definition. They are, however,identifiable amounts that can be associated with an individual.
iii - Registered (employer-sponsored) Pension Plans (RPPs). These plans are generally not voluntary; theyare often provided as a condition of employment. There are two types of RPPs: defined benefit (DB) anddefined contribution (DC). After a specified period of plan participation (generally two years), these assetsare locked-in and must be used to provide a stream of income at retirement. Depending upon the type ofpension an individual chooses, a spouse's benefit may or may not be provided. As well, there may or maynot be money remaining at the time of death to become part of the individual's estate. It is proposed thatthese monies be considered non-marketable wealth. For certain DC plans (which cover about 10% of allRPP members), the individual may have some control over the investment of the money, but this is notalways the case. The amounts in these plans would more appropriately be considered semi-marketable.
iv - Canada/Quebec Pension Plans (C/QPP). These plans provide an important source of retirement incometo all eligible, working Canadians. Individuals/families do not have access to these forms of wealth untilretirement or death (other than in the event of disability) and cannot exchange them for other forms ofwealth. As well, the value of the pension an individual receives from the C/QPP is dependent on theprovisions of existing legislation. If those provisions should change, the value of the benefit could alsochange. It is propose that this value be considered non-marketable wealth.
Issues related to the valuing of RPP and C/QPP benefits will be discussed in more detail later.
2) Equity in business
Another important issue to consider is the valuation of equity ownership, especially in light of the rising incidenceof self-employment. The value of equity ownership in corporations is simply the value of the voting shares. Shareholders of a corporation have no liability for the corporation's debts and there can be no additional levyon shareholders if the debts of a bankrupt corporation exceed the realizable value of its assets. In contrast,ownership in partnerships and sole proprietorships carries unlimited personal risk: these owners are personallyliable to the creditors for all debts of the business. Thus, the value of ownership in these unincorporatedbusinesses is the pro rata share of the businesses' net worth. A special case of the partnership is a limitedpartnership. Limited partners are not liable for the debts of the corporation beyond the capital contributed bythem to the partnership. Thus, the value of ownership in a limited partnership is the value of the shares heldby the owner.

Proposal for an Asset and Debt Survey 17
Statistics Canada 13F0026MIE - 99003
Although it should be possible for persons to isolate the assets they have in incorporated businesses, this maynot be as easily done in the case of unincorporated businesses. Frequently these assets are for bothbusiness and personal use, for example, a car. We will need to establish rules to ensure that, as much aspossible, respondents report these assets in a consistent manner,
3) Durables
Durables, such as jewellery, art and collectibles, can represent a significant portion of a household's assets.In fact, certain individuals/families may choose to hold much of their wealth in this manner. Other durables,such as furniture and household appliances and equipment may well constitute the largest asset for the lowerincome group, particularly if they are renters and do not belong to a registered pension plan. As importantas these items are conceptually, a substantial degree of subjectivity is required to value these items. Thereis no standard measure of their worth as there is for the current value of mutual funds or of used vehicles.Moreover, they could present extensive recall problems for respondents as these items can be numerous.The extent to which we are able to capture information on durables, other than motorized vehicles, requiresfurther investigation. One measure of the value of other durable goods could be the insured value ofhousehold effects; unfortunately this is often calculated as a standard percentage of the value of the propertyand would, therefore, not be an accurate measure of the value of those goods.
4) Leased items
The issue of leasing (for example, leasing of automobiles) is important to consider for several reasons:
i - leases are becoming, for many Canadians, an increasingly important method of acquiring goods / assets;
ii - leases constitute an ongoing debt for the lessee;
iii - national accounting practices in Canada account for specific personal sector leases on the nationalbalance sheets; and,
iv - other countries, such as the United States, capture certain leases on their household wealth surveys.
Some leases are correctly treated as expenses (i.e. operating leases) while for others, it may be moreappropriate to treat them as assets (i.e. capitalized leases). This treatment depends on the characteristics ofthe lease contract.
The Asset and Debt Survey will take into consideration the method used by the Canadian System of NationalAccounts (SNA) to account for leased items - this method is still under discussion at this time. This wouldmean, at a minimum, the determination of the number of major assets (specifically, vehicles) that are acquiredthrough leasing arrangements. All other leased items would be considered expenses, akin to rent, and wouldnot be captured by the survey. Why is it justified to treat certain leased items as assets? A long-term leaseoften contains the presence of a purchase option which essentially transfers property rights and the risks ofownership to the lessee.3 In essence, capitalizing a lease treats the asset as if it were purchased on credit. Thus, an equal amount of debt should be recorded on the balance sheet. All other leases would be consideredexpenses.
3
A lease contract containing a bargain purchase option allows the lessee to purchase the leased asset for a stated, and usuallydiscounted, price at the end of the lease term.

Proposal for an Asset and Debt Survey 18
Statistics Canada 13F0026MIE - 99003
5) Value of life insurance policies
The value of a life insurance policy is not an asset in the same sense as a home or a bank account. It can,however, have important implications for the beneficiaries of the policy. For that reason, it is proposed toinclude insurance within the contents of the survey. There are two types of life insurance:
i - Term insurance: It pays a death benefit to the beneficiary on the policy, if the person dies within the termof the policy. Except for participating policies, it has no other value. It is therefore proposed that it beconsidered a form of non-marketable wealth.
ii - Permanent insurance: It is also called whole life or straight life. It remains in effect for life and is usuallyused to provide dependants with death protection; it can also be used to provide retirement income. Thistype of policy builds up a cash value; it is possible to borrow against this value or to acquire it, bysurrendering the policy. As the individual has some control over the use of these funds, it is proposed thisbe considered a semi-marketable asset.
Acquiring reliable information on the value of life insurance policies, however, may be difficult. There is littleevidence to confirm whether people can accurately report information on the details of their insurance policy.
6) Inherited assets / debts
The extent to which assets and debts are passed from one generation to the next has important implicationsfor the transfer and acquisition of wealth. It is proposed that, for major items such as owner-occupied realestate, a question be included to determine whether the asset was inherited. As well, the survey, by producinginformation on the net worth of different age cohorts, can be used to estimate the amount potentially availablefor transfer to the next generation(s). The extent to which the survey will include specific questions oninheritances - received or expected - will depend on cost and response burden considerations.
4.4 Principle for valuing assets and debts
Whenever possible, assets and debts should be valued based on the realization principle. It suggests that therealization value of wealth is based on the amount obtained if assets were sold on the open market. Employingthe realization principle to value many assets is relatively straight forward. For example, to value holdings ofpublicly traded equities based on the realization principle, all one would need to do is consult any businesssection of a daily newspaper and find the price at which the stock traded on a particular day. However, someassets, such as real estate holdings, cannot be as easily valued using this principle as there is no readilyavailable liquid market for the asset. In the case of owner occupied real estate, which is often the largest assetowned, it will be particularly important to consider any additional information that can be used to verify the valuereported (e.g. value established for municipal tax purposes).
For assets that cannot be sold (e.g., the value of RPP and C/QPP benefits), valuation must take intoconsideration guidelines recommended by such groups as the Canadian Institute of Actuaries.
4.5 Reference period for data
The survey will take place in May and June of 1998. Although the income data collected will be for the mostrecent calendar year (1997), it will be very difficult to collect information on the value of assets and debts for thatsame period (i.e., December 31), because of the additional demand it places on respondents. Previous assetand debt surveys conducted by Statistics Canada, and the asset and debt survey carried out by the FederalReserve Board in the United States, all had similar lags between the timing of the income and the asset/debt

Proposal for an Asset and Debt Survey 19
Statistics Canada 13F0026MIE - 99003
data. These surveys did not adjust assets and debts because of this lag, primarily because the increasedprocessing costs would not warrant what, in most cases, would be a small adjustment to assets / debts. Unfortunately, it is not possible to conduct the survey in January or even February due to the heavy workloadof Statistics Canada's interviewers. In any event, income data, also an important part of this survey, wouldnot be readily available then, as income tax returns need not be filed until the end of April. It is, in part, for thatreason that collection will take place beginning in May.
4.6 The unit of observation
The 1984 SCF produced net worth information for the family unit, which included both unattached individualsand families. Families were defined much as economic families are today, that is, as a group of individualssharing a common dwelling and related by blood, marriage, common-law union or adoption. The UnitedStates SCF also produces information for economic units. They are termed "primary economic units" andare defined as "the economically dominant single individual or pair of individuals (who may be married or livingas partners) and all other persons who are financially dependent on that person or those persons"(Kennickell, Arthur B., Martha Starr-McCluer and Annika E. Sunden, 1997).
It is proposed that this survey also produce information by family unit, which would include both unattachedindividuals and economic families. The economic family was selected because it was the unit preferred bymost people who commented on the content discussion paper and because it permits comparability with anumber of other Statistics Canada surveys.
Response to the content discussion paper also suggested that there is considerable interest in producinginformation by individuals, particularly to permit the analysis of the situation of men versus women. Althoughit was hoped that this would be possible, further research and reflection has demonstrated the problems withthis approach. For one thing, ownership of an asset/debt is often affected by tax legislation or by practicalitiesand may have little to do with the way in which the asset is used/shared or the debt is paid. As well, legalownership of an asset/debt may bear little relationship to the way in which these items would be divided uponseparation or divorce. To establish this, a series of questions would be required on the date of acquisition ofassets/debts and the date of the union. Although such matters are not insignificant, they are considered beyondthe primary objectives of this survey. Consideration can be given to changing this approach, if this survey isrepeated.
Other considerations in selecting the unit of observation relate to data collection. In family situations where itmay be most important to determine the ownership of assets/debts by each individual, the designation of suchownership may have undesirable consequences for respondent relations, thereby jeopardizing the surveyresponse rate.
These family definitions do not address how one is to capture economic links with related persons in otherdwellings. In practice, it is extremely difficult to trace the flow of financial resources between family members.However, the survey will identify the incidence of family units either receiving financial support from or providingit to persons outside the household.
4.7 Challenges with surveying wealth
There are several challenges/problems associated with surveying wealth. They are briefly discussed below,together with the proposed method of dealing with each.

Proposal for an Asset and Debt Survey 20
Statistics Canada 13F0026MIE - 99003
Non-response - Past experience with Canadian surveys and with the United States SCF indicate that theexpected response rate is approximately 75% for a general sample of households and as low as 33% for a highincome/wealth sample. The sample will be selected with that in mind. Data collection documents for the surveywill be designed so that respondents can, if they desire, be left with a statement of their financial situation. Inthat way the survey can be promoted not just on the basis of the need for this information, but also byemphasizing the advantages to the respondents themselves. It is hoped that this will help to increase responserate.
Inaccurate valuing of assets/debts - One important source of bias is due to under- or over reporting ofassets, although under-reporting is a more commonly reported problem in wealth reconciliation studies. Basedon Canada's 1984 survey of assets and debts, Oja (1986) reports that the survey data represent about fiftypercent of the aggregate estimates of wealth based on comparable national balance sheet data. Under-reporting was most severe for stock holdings where the survey data comprised thirteen percent of Canadiannational balance sheet estimates. Under- or over-reporting of assets / debts may be due to poor recall, anunwillingness to consult records or a tendency to over-estimate assets to present a brighter picture than mayactually be the case. Two methods will be used to deal with this problem. Firstly, wherever possible, for thelarger assets, information will be requested to help confirm the value reported. This was already mentionedwith respect to owner-occupied real estate. Secondly, respondents must be encouraged to consult recordsand be given the opportunity to report in the manner most comfortable for them (e.g., without the necessity ofhaving an interviewer in the home). As an aid to respondents, prior to the interview they will receive, in the mail,a guide to the survey which can be used to locate and record the required information.
Underestimation of assets for high wealth group - Some of the apparent under-reporting on householdsurveys may be due to the failure of these surveys to adequately capture the holdings of the wealthiest few, whoby all indications hold a very large and disproportionate share of wealth in most developed nations. To combatthis problem the 1977 Canadian survey and the United States SCF over-sampled the top of the incomedistribution. By most accounts, this significantly improved the reconciliation between national accounts andhousehold survey values of net worth in the United States. For example, the agreement between survey andFlow of Funds (FOF) accounts rises from about fifty percent to ninety-three percent for all stocks, when the high-income group is over-sampled. Avery and Elliehausen (1986) argue that the inclusion of the high incomesample, appropriately weighted, significantly reduces differences between survey-based and FOF accountestimates of many wealth aggregates. It is planned, therefore, that a separate high-income sample be usedfor this survey.

Proposal for an Asset and Debt Survey 21
Statistics Canada 13F0026MIE - 99003
5. Data requirements
5.1 Process for determining content
To a large extent, the thinking in developing the content of this survey was guided by the content of theprevious asset and debt surveys conducted by Statistics Canada, as well as the Survey of Consumer Financescarried out by the Federal Reserve Board in the United States.4
As was mentioned in the Introduction, the first step in the development of this proposal was the preparationof a content discussion paper containing the initial thinking on the information that this survey should generate.The feedback from this discussion paper has helped to refine our thoughts on content. This section describesthe proposed content.
5.2 Overview of content
Before outlining the information that this survey will collect, it would help to describe the survey respondentsand the general approach to data collection. The survey will seek information from a sample of Canadianhouseholds. It will be conducted as a voluntary survey. Requiring mandatory participation, although it mightimprove the response rate, could have a negative effect on data quality. The first step in the data collectionprocess will be the determination of household composition, followed by the selection of the economic familyto be included in the survey. Specifically. the steps involved are:
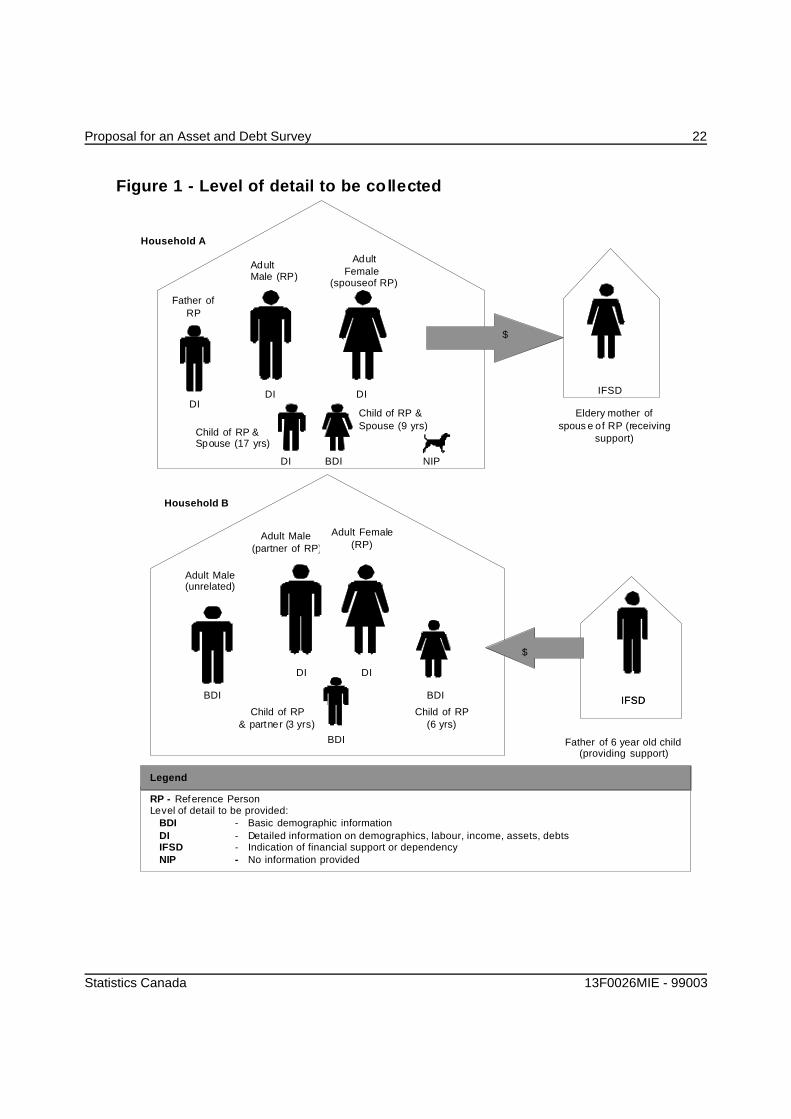
a) listing, and collecting basic demographic information on, all household members. This would includeidentifying a reference person for each economic family and establishing the relationship of other familymembers to that reference person. The reference person would be defined as in SHS (previouslyFAMEX), i.e., the member of the household mainly responsible for its financial maintenance.
b) selection of one economic family or unattached individual per household, if there is more than one. (Only4% of households contain more than one economic family.) This would be done randomly. Detailedinformation will be collected only for the selected economic family.
c) collection of detailed demographic, labour market and income information from members of theeconomic family 15 years of age or older as of December 31, 1997. Asset and debt data will berequested for the economic family as a whole.
An illustration of who, in each household, will provide information and the level of detail required can be foundin Figure 1.
4
The co-operation of those involved with the United States SCF in providing information on the content and operation of theirsurvey is very gratefully acknowledged.
Proposal for an Asset and Debt Survey 22
Statistics Canada 13F0026MIE - 99003
Figure 1 - Level of detail to be collected
Household A
Eldery mother ofspous e of RP (receiving
support)
DIDI DI
DI BDI
$
AdultMale (RP)
AdultFemale
(spouseof RP)
Father ofRP
Child of RP &Spouse (9 yrs)Child of RP &
Spouse (17 yrs)
IFSD
Household B
DI DI
BDI
BDI
BDI
$
IFSD
Adult Male(partner of RP)
Adult Female(RP)
Child of RP(6 yrs)
Child of RP& partner (3 yrs)
Adult Male(unrelated)
Father of 6 year old child(providing support)
RP - Reference PersonLevel of detail to be provided: BDI - Basic demographic information DI - Detailed information on demographics, labour, income, assets, debts IFSD - Indication of financial support or dependency NIP - No information provided
Legend
NIP
IFSD

Proposal for an Asset and Debt Survey 23
Statistics Canada 13F0026MIE - 99003
The following briefly outlines the information that we propose to collect. Income would be for the latestreference year (1997). All other information would be as of the time of the survey (May and June, 1998) orfor the most recent period available. (The reasons for this were explained previously in section 4.5.) Cost andrespondent burden considerations require that we collect this information in an interview lasting, on average,not much more than one hour. A test of the content and interview process scheduled for the Fall of 1997 willprovide feedback in this regard. If necessary, content will have to be somewhat streamlined.
Demographic Information
Collected for all household members
Data Elements Use
Basic DemographicInformation
NameAgeSexMarital statusFamily Composition
(e.g., number of persons in family,presence of children, lone-parents)
To provide a basic description of thefamily members to place the surveydata in context.
Collected for all members of selected economic family 15 years and over
Data Elements Use
Other DemographicInformation
Aboriginal statusVisible minority statusImmigrant statusYear of immigrationMother tongueHighest level of educationCurrent school attendance (full-timeversus part-time)Activity limitationsDisability status
To provide opportunities for furtheranalysis on factors that mayinfluence wealth differences.To provide a social and culturalprofile by level of net worth.

Proposal for an Asset and Debt Survey 24
Statistics Canada 13F0026MIE - 99003
Labour Market Characteristics
Collected for all members of selected economic family 15 years and over
Data Elements Use
Current employment Reason not working -or-Employer nameType of jobIndustryOccupationDate beganClass of workerUsual weekly hours workedParticipation in DPSPRPP member / numberInterruptions in RPPmembershipPast service purchasedAmount of RPP benefit split withformer spouse/ partner, ifapplicable
To establish current labour forcecharacteristics. To permit theanalysis of net worth position forpersons with different labourmarket characteristics.
To identify self-employed.To identify part-time / full-time.
Information on RPPs will beused to estimate the value ofthese benefits (together withother information on the plan).
Employment History 1997 employment:Number of weeks workedWeeks not employedWeeks not looking for workWeeks worked full-timeNumber of employers
Long-term participation:Year last in school full-timein past 10 years or since last inschool full-time:- Years working- Number of employers
To identify employment situationduring the income referenceperiod of 1997.
To determine workforce stability.To study work patterns and theirimpact on pension accumulation.

Proposal for an Asset and Debt Survey 25
Statistics Canada 13F0026MIE - 99003
Pension Plan Benefits
Collected for all members of selected economic family 15 years and over
RPPs from prioremployment
Detail for up to two previousemployments (only if respondentbelonged to an RPP through thatemployment and employment lastedat least two years):Disposition of accumulated pensionmoney / creditsPlan numberEmployer nameIndustryOccupationDate beganDate endedInterruption in RPP membershipPast service purchasedEarnings in last yearAmount of RPP benefit split withformer spouse / partner, if applicable
Number of other previousemployments
To calculate the value of RPPbenefits from previous employment(together with other information aboutthe plan).
To derive length of time withemployer and period covered byplan.
RPP benefits in pay Detail for up to two pensions:Type of pension (own / survivor)Bridge benefit includedOrphan’s pension includedMonthly amountIndexation of benefit
Number of other pensions in pay
To estimate the value of RPPbenefits in pay. Interest rate and lifeexpectancy assumptions must alsobe established.
RPP credits receivedfollowing divorce /separation
Any benefits split?Money already received?
To identify incidence of receipt ofpension credits followingdivorce/separation.

Proposal for an Asset and Debt Survey 26
Statistics Canada 13F0026MIE - 99003
Income
Collected for all members of selected economic family 15 years and over for the reference year 1997.Respondents may provide information through the interviewing process or authorize access to their incometax data.
Data Elements Use
Employment Earnings Wages / salariesSelf-employmentFarm self-employment
Investment InterestDividendsTaxable capital gainsOther
Government transfers Child tax benefitsOAS / GIS / SPAC/QPPEmployment insurance benefitsWorker’s CompensationSocial assistanceGST creditsProvincial tax creditsOther
Pension income Retirement pensions, annuitiesMatured RRSP/RRIF income
Other RRSP withdrawalsAlimony, child supportOther
Total income
To establish relationshipbetween income andaccumulated wealth. Togenerate income informationcompatible with SLID, SCF andSHS (FAMEX) to permit studiesof the relationship of wealth toother variables not collected bythis survey (e.g., householdexpenditures).
Other tax form data Income tax (federal and provincial)Pension adjustmentRPP contributionsRRSP contributions
To establish net income.To identify those in RPPs andcontributing to RRSPs.

Proposal for an Asset and Debt Survey 27
Statistics Canada 13F0026MIE - 99003
Intra-household transfers / Behaviours and Attitudes
Collected for economic family as a whole
Data Elements Use
Intra-householdtransfers
Financial support provided to personsoutside household during past 12 months- relationship of recipient- frequency of support- amountFinancial support received from personoutside household during past 12 months- relationship of supporter- frequency of support- amount
To determine the extent to whichmoney is transferred betweenfamily members and others livingin different households.
Collected for economic family as a whole
Data Elements Use
Behaviours andAttitudes
Pay off credit cards monthlyDebt payments missed by two months ormoreSale of assets to pay debts in last threeyearsWithdrawal of money from RRSP (otherthan for retirement)Use of pawn brokerDeclaration of bankruptcyGuarantor for any loansAccess to financial assistanceUse of financial budget/planPlanning periodMethod of financing purchases >$500Method of financing purchases >$5000Adequacy of government pensionsAdequacy of other sources of retirementincomeSpending in relation to income last year
To identify types of familiespotentially having difficultypaying their debts.
To measure attitudes andbehaviours and to correlate thisinformation with net worth profile.
To determine expectation ofhaving adequate income inretirement.

Proposal for an Asset and Debt Survey 28
Statistics Canada 13F0026MIE - 99003
Net Worth
Collected for economic family as a whole
Data Elements Use
Financial:Registered Savings Plans:- RRSPs (not locked-in)- LIRAs (locked-in RRSPs)- RRIFs, LIFs, LRIFs- DPSPs- RHOSP- RESPDeposit accountsTerm deposits/GICsSavings bondsBonds / debenturesTreasury billsMortgaged-backed securitiesStocksMutual fundsAnnuitiesTrust FundsOther- futures, brokerage accounts, etc- money owing to respondent- cash on hand, uncashed chequesRPP and C/QPP benefits
Non-financial:Principal residence (for owners)- dwelling typeOther real estateLicensed vehicles (cars, trucks, vans)Other motorized vehiclesHousehold contents
To value a comprehensiveportfolio of family assets.
To identify the asset distribution offamilies and unattachedindividuals.
To determine how assetcomposition differs for differentsub-populations.
To determine extent to whichfamilies and unattachedindividuals are prepared for or aresaving for retirement.
Assets(current market valueor balance)
Equity in businesses:Legal status of business% of business ownedValue of business assetsSale valueAmount of business debts and liabilitiesWhether business debt secured bypersonal assets
To identify the amount of personalnet worth associated with theownership of incorporated andunincorporated businesses.

Proposal for an Asset and Debt Survey 29
Statistics Canada 13F0026MIE - 99003
Collected for economic family as a whole
Data Elements Use
Mortgages and major loansMortgages / loans on principal residenceAmount owing to RRSP used forpurchase of homeMortgages / loans for other real estateVehicle loansLoans for other motorized vehicles
Debts(amount owed on)
Credit Cards and LoansCredit cards (amount owing after lastpayment)Charge accountsLines of creditStudent loansLoans from financial institutions (nototherwise mentioned)Loans on life insurance policyLoans from family, friends (outsidehousehold)Other loans
To determine the amount of totalliability in the calculation of networth. To determine the numberand characteristics of families whoare heavily indebted. To examinenon-productive debt (notassociated with an asset).

Proposal for an Asset and Debt Survey 30
Statistics Canada 13F0026MIE - 99003
Ongoing expenses / income protection
Collected for economic family as a whole
Data Elements Use
Ongoing expenses
Principal residence expensesRentCondominium feesProperty taxesInsuranceFuels (for residence)ElectricityWater
Leased vehiclesLease payment
To determine the ongoingfinancial obligations of familiesand unattached individualsassociated with their principalresidence and with leasedvehicles, to aid in assessingpotential financial vulnerability.Leased vehicles are includedbecause leasing is becoming anincreasingly common way ofobtaining the use of this asset.
Collected for economic family as a whole
Data Elements Use
Life insurancepolicies
Number of policiesType of policyFace valueCash value
To determine the extent to whichfamilies will be protected in theevent of the death of a familymember.
5.3 Valuing pensions from RPPs and the C/QPP
For many of the assets and debts listed on the preceding pages, respondents will be able to provide therequired information from statements they have received from different institutions. This is not the case,however, for the value associated with registered pension plan (RPP) and Canada and Quebec Pension Plan(C/QPP) benefits. In almost all cases, respondents will not be able to provide this value and it must thereforebe estimated. This section will discuss the process for generating this value.
Given that generating the value of RPP benefits was considered to be a priority for this survey, considerationwas given to a two-staged collection process. During the respondent's interview those belonging to RPPs wouldbe asked for their authorization to obtain the value of their benefit from their employer. This would addconsiderably to both the cost and the time required to conduct the survey. Although plan sponsors are requiredto monitor the liability of the plan as a whole, they would not have to calculate the value of the benefit of aparticular individual, except under special circumstances (such as divorce or termination of employment). Asthis will be a voluntary survey, requesting additional information from other parties could further reduceresponse rate, or necessitate the development of an estimation procedure to be used as a backup measure.As well, if information were requested from employers, it would be necessary to ask them to derive the estimateof the value of the benefit using a common set of assumptions for the survey; this may present a problem forsome employers. It was concluded that such a strategy for valuing benefits would not be effective. The valueof the benefit will therefore be estimated as described below.

Proposal for an Asset and Debt Survey 31
Statistics Canada 13F0026MIE - 99003
Several different types of benefits can be valued; each will be dealt with in turn.
1) Accrued benefit of current member of RPP - Currently employed respondents will be asked if theyparticipate in an RPP. If they do, they will be asked for the registration number of the plan (which appearson their T4). Using this number a match will be made to Statistics Canada's Pension Plans in Canada(PPIC) database, which contains information on the contribution and benefit rates of all RPPS, as well asother information on the plan. This plan data, together with survey information about the respondent'scurrent salary, years of service and age, will be used to generate an estimate of the value of the accruedbenefit. Assumptions must be made about life expectancy, interest and inflation rates in order to makethese estimates. In generating the estimate, only pension benefits accrued up to the time of the survey willbe considered; no assumptions would be made about future service. The process of deriving the estimatefor members of defined benefit plans is more difficult than for members of defined contribution plans; thelatter, however, constitute only 10% of all RPP members.
2) Deferred benefit from prior participation in an RPP - This is the value of the benefit resulting from prioremployment. To determine this value, questions on employment history must be included in the survey,to determine, firstly, if the respondent belonged to an RPP and, secondly, if the value of the benefit wastransferred to a locked-in RRSP, left in the plan to be paid at a later date or transferred to a new plan. Ifthe money was transferred to a locked-in RRSP, no further questions are required, as the respondentwould report that amount with their RRSP holdings. If the money was either left in the plan or transferredto a new plan, a process similar to the one described above for current members would have to be done.Unfortunately, there is no information available to estimate the magnitude of this amount. It can beassumed to be small, relative to the work required to generate it.
3) Pension benefits split on divorce / separation - Estimating the value of these benefits would require aseries of questions on marital history and the employment of an ex-spouse; this would add to the alreadysensitive nature of the information required for this survey. It is recommended that the survey attempt todetermine the extent to which respondents report sharing RPP benefits on divorce but, for those receivingsuch pension credits, not attempt to collect the information required to generate the actual value.
4) Value of RPP benefit in pay - The amount of income received from an RPP will be requested. Thepresent value of this stream of income can be estimated using assumptions about life expectancy andinterest rates. As well, it will be necessary to make assumptions about certain characteristics of thepension if the respondent does not have this information, for example, whether the pension benefit isindexed or a subsidized survivor benefit is provided.
5) Value of benefit from the C/QPP not yet in pay - The C/QPP is a mandatory program to which allworkers, whether paid or self employed, must contribute. To estimate this value, it would be necessary tohave information on the respondents' entire work history. This would significantly add to response burdenand potentially jeopardize response rate. The required information is available from files maintained bythe administrators of the two plans. With the respondents' authorization, and that of the administrators ofthese plans, links could be made to these files and the present value of the benefit estimated. Without thisauthorization, it may not be possible to do this estimation.
6) Value of C/QPP in pay - In theory, this value could be estimated in the same way as RPPs in pay.
Proposal for an Asset and Debt Survey 32
Statistics Canada 13F0026MIE - 99003
5.4 Data from other sources
To minimize response burden, data from other sources will be used wherever possible. For example, ratherthan reporting income data, respondents will be given the option of authorizing the use of their tax data. SLIDnow provides respondents with this alternative; about 75% choose this option. This does have an impact ondata processing. The survey will be conducted in May and June of 1998, and 1997 income data will berequested. For those who authorize the use of their tax data, this information will not be available until October1998.
As mentioned above, respondents will also be asked for their permission to link to information on the C/QPPfiles.

Proposal for an Asset and Debt Survey 33
Statistics Canada 13F0026MIE - 99003
6. Sample design
6.1 Survey frame
One of the major objectives of the Asset and Debt Survey will be to determine how wealth is distributedamong the Canadian population. Because a disproportionate amount of wealth is held by the higher-incomeearners5, it is crucial that the sample for this survey not under represent that group. Multi-stage clustersampling of the type used by the Labour Force Survey (LFS) tends to result in the under-coverage of the high-income population. A comparison of 1990 data from tax filers and from the Survey of Consumer Finances(which relies on the LFS frame) indicates an 84% under coverage of people with an income of $250,000 ormore. (This income group represented just .2% of the population.) The LFS was redesigned in 1994; thereare now strata with higher income groups. Although this should improve the coverage of high-income people,there is still likely to be under-coverage at the high end.
Table 1. Comparison of SCF and tax filer data in four provinces, 1990
(In thousands ofdollars)
# respondents insample (SCF)
weighted estimate(SCF)
# tax filers difference
$100k + 302 141,591 197,162 -28.2%
$150k + 76 34,153 83,430 -59.1%
$250k + 12 4,744 29,388 -83.9%
To solve this problem it is proposed that a dual-frame approach be used. The main component of the samplewould be drawn from an area frame (using the LFS sample design). However, this sample would besupplemented by a second one, intended to target the high-income group. For this purpose the tax file fromRevenue Canada would be used. These two frames are discussed briefly, as is another frame option whichwas considered.
6.1.1 LFS frame
The LFS frame excludes residents of Indian reserves and Crown lands, inmates of institutions and full-timemembers of the Canadian Armed Forces. As well it excludes from its coverage the Northwest Territories andthe Yukon. The frame could be used in one of the following ways:
a) conducting the survey as a supplement to the LFS. The advantage of this alternative is that muchof the background demographic and employment data would be available from the LFS. However,because of the heavy response burden associated with the Asset and Debt Survey, and the possibleaffect this might have on the response rate to the LFS, this alternative was immediately rejected.
5
Results of the 1984 survey indicate that 30% of wealth was held by the highest income decile.
b) selecting a sample of groups that have rotated-out of the LFS. The LFS sample consists of six rotationgroups; each remains in the sample for six consecutive months. Every month one rotation group isdropped and replaced by a fresh one. This option would involve the use of the groups that have beendropped from the LFS sample, the ones that have “rotated-out”. Once again, the advantage of drawing

Proposal for an Asset and Debt Survey 34
Statistics Canada 13F0026MIE - 99003
the sample from “rotates-out” is that much of the background demographic and employment data wouldbe available. It would have to be updated, however. Another possible advantage is that these householdswould be familiar with Statistics Canada surveys and hopefully have established some “trust” in ourinterviewers. The significant disadvantage in using “rotates-out” is response burden; not only had theybeen a part of the LFS for six consecutive months, most of them would also have participated in at leasttwo supplementary surveys.
c) selecting a “fresh” sample from the LFS frame. This would involve sampling dwellings that have notparticipated in the LFS. It requires, first, selecting geographic clusters from which the actual sample willbe drawn and, then, for some of these clusters, listing the addresses in the cluster. Using a “fresh” samplemeans that, in addition to collecting the asset and debt detail, it is also necessary to collect thebackground demographic and employment detail. The major advantage in selecting a “fresh” sample isthat, overall, it minimizes the response burden for these households, and should therefore improveresponse rates. There are additional costs involved in selecting the sample and listing addresses but thesecosts are estimated at less than $50,000.
The importance of minimizing response burden, particularly to ensure that the response rate is notcompromised, leads to the conclusion that the Asset and Debt Survey should be conducted using “new”respondents. Approach “c”, above, is therefore recommended.
6.1.2 Tax filer frame
The tax file will be used to select a high income sample. As previously stated, this is necessary both becauseof the under representation of the high income group in a multi-stage sampling design of the type used by theLFS and because of the importance of adequately representing this group, given they hold a disproportionateamount of the country’s wealth.
The tax filer frame could not be used as the sole frame, because it tends to under represent other importantgroups, i.e., those whose income is very low and, therefore, may not file a tax return. (This is becoming less ofan issue, as low income people would in most cases file to obtain tax credits.) As the tax-filer frame is a frameof individuals6 it will be necessary to make certain adjustments, as the main sample (from the LFS frame) wouldbe a sample of households, not individuals. The tax file would be used only to identify high income people forthe survey sample; it would be critical to reassure respondents of the confidentiality of their tax data.
6
Consideration was given to using the family file (T1FF) generated from individual tax filer data (T1 file). This file is prepared andmaintained by Statistics Canada?s Small Area and Administrative Data Division. However, this file is available 18 months after thedata on individual tax filers and would therefore require substantially more updating.
The intent in using a high-income sample is to ensure that the sample properly represents the high wealthgroup. Can it be assumed that selecting those with high income would accomplish that aim? Using 1984 asset,debt and income data from the Survey of Consumer Finances indicates that 84% of heads of households withhigh income ($100,000 or more) also had high wealth ($200,000 or more: the 90th wealth percentile).
6.1.3 Random Digit Dialling (RDD) sample
Random Digit Dialling surveys are done using banks of valid telephone numbers. These banks provide excellentcoverage of the population with telephones. The technique has been accused of having potential bias forcertain kinds of estimates, if the population of people that have a telephone is different from the one that does

Proposal for an Asset and Debt Survey 35
Statistics Canada 13F0026MIE - 99003
not. This option can be much less costly than using the LFS frame because the phone number provides arelatively cheap means of access to the household. (Using the LFS frame would provide only an address, nota phone number.) However, if personal visits are required to collect the information, this option provides nocost savings and could potentially lower the response rate, given it can be much more difficult to persuadepeople to co-operate on the telephone. For the Asset and Debt Survey, it is felt that personal visits will helpboth to improve response rates and to aid respondents in providing the required information. This will bediscussed more fully in the next section. The option of RDD was therefore not considered to be a practicalone.
6.2 Response rate
In the 1984 asset and debt survey, the response rate for net worth information was approximately 72%. Thisis very similar to the response rate achieved in the 1995 U.S. Survey of Consumer Finances. In that survey,about 70% of families in the area-probability sample (the LFS frame would constitute the area frame for theCanadian survey) completed interviews. Only about 34% of their list sample (their high wealth sample drawnfrom tax records) did. (The 1977 Canadian survey included a high-income sample; a similar response ratewas achieved from that sample.)
Two things are worthy of note in considering the extent to which we can expect similar response rates. Firstly,the 1984 Canadian survey was a mandatory survey; the current survey will be voluntary. Secondly, the U.S.survey, although voluntary, provided small cash incentives to respondents.
Clearly it would be desirable to exceed these historical response rates. This can be done only by placingconsiderable emphasis on respondent relations, and by designing the survey in such a way that therespondent also feels that he/she has benefited. (Focus group testing will be used, among other things, todetermine how this can best be done.)
6.3 Sample size
Two sample sizes were considered: a responding sample of 15,000 (option 1) and 30,000 (option 2)households. These numbers are net of non-respondents and include the high-income sample. In the 1995U.S. survey, the responding sample contained approximately 4,400 households, 66% from the area sampleand 33% from the tax sample. For the purposes of this survey a similarly skewed high-income sample is notrequired; approximately 2,000 high-income individuals will be selected for the ADS.
As a point of comparison, in the 1984 Canadian survey, there were 14,155 sampled family units; this allowedfor the provision of data for five geographic regions, but not for each of the provinces.
6.4 Level of precision
The precision of the estimates that can be expected from a sample of 15,000 and 30,000 households ispresented in Appendix A. The estimates presented are a crude approximation of the expected co-efficients ofvariation (CVs).7 These were calculated using data from the 1984 survey.
7
The CV is a measure commonly used to express the precision of survey estimates. It is the standard error expressed as apercentage of the actual estimate. If an estimate has a coefficient of variation of 16.5% it means that the 95% confidence intervalfor the estimate is +/- 33%. For example, if the estimate of the percentage of families owning stocks is 10% and this estimate hasa CV of 16.5, it means that the 95% confidence interval for this estimate would be 6.7/13.3. Estimates with a CV of 16.5% areflagged and users are instructed to treat the estimates with caution. Estimates with a CV of less than 16.5 can be released withoutsuch a warning.

Proposal for an Asset and Debt Survey 36
Statistics Canada 13F0026MIE - 99003
To produce provincial data, a sample of 30,000 households will likely be required. No provincial estimates werereleased from the 1984 survey. Table 5 in Appendix A presents the CVs for the five geographic regions. Theyrange between 5% and 8% for the variable average wealth. Further breakdown in any subgroup of variableswould likely yield CVs higher than those that can be released without restriction (i.e., 16.5).
The additional cost of conducting the ADS with a sample of 30,000 rather than 15,000 has been estimated atapproximately $1,000,000. In order to keep survey costs to as close as possible to $3,000,000, it will benecessary to opt for the smaller sample size. Wherever possible, gross estimates of wealth will be producedat the provincial level. Detailed analysis by smaller sub-populations, however, will likely not be possible byprovince.

Proposal for an Asset and Debt Survey 37
Statistics Canada 13F0026MIE - 99003
7. Collection methodology
7.1 Informing respondents
One of the biggest challenges in conducting the Asset and Debt Survey (ADS) will be gaining the trust andco-operation of respondents. The survey is demanding; it requires respondents to provide detailed informationthat may not readily be available. It also asks for information that most regard as highly private. Respondentswill likely need some coaching to ensure they are providing the correct information and much reassurancethat the information is strictly confidential. It will be very important to indicate to the respondent why theinformation is needed.
The sampled households will be sent an introductory package that spells out the reasons for conducting thesurvey and the information required. It will be important to provide the respondent with sufficient informationto allow them to prepare for the interview but not so much that it will discourage them from participating.Material used by other Statistics Canada surveys such as SLID and SHS (previously FAMEX) will be used asmodels, when appropriate. SHS in particular has many of the same collection challenges as the ADS in thatit requires both a long and demanding interview. Methods of gaining co-operation that have been successfullyemployed by that survey will be adopted wherever possible.
7.2 Collection method
It is recommended that SHS interviewers collect the ADS information. The survey is to be conducted in Mayand June of 1998; these interviewers would have completed collection for SHS by the end of March, allowingtime for training on the ADS in April. Another advantage in using these interviewers is that they are familiarwith very demanding interview situations.
To help gain the co-operation of respondents it will be important to allow them to report the information in themanner in which they are most comfortable. Because the sample selection process will, in many cases,provide an address and not a telephone number, the first contact with those respondents must be a personalvisit. A personal visit adds substantially to the cost of conducting the survey, but it is considered essential. Asurvey of this type could not be done by mail; the questionnaire would be sufficiently daunting to seriouslyaffect the response rate. At the first visit it is possible the interview could be completed in full. It is more likelythat some of the information would be collected and the remainder provided at a subsequent visit or bytelephone. The respondent should also be given the option of completing the questionnaire without theinterviewer being present. This option is considered necessary as many families may prefer to report theinformation in private. The survey questionnaire must be designed with this possibility in mind.
For those respondents for whom we can obtain a telephone number, the first contact following the receipt ofthe introductory package would be by telephone. Either an appointment would be made for a personalinterview or, if possible, the information would be collected on the telephone. Although it should be feasibleto obtain the background demographic and employment data in this manner, the asset and debt data couldonly be reported on the telephone if the individual’s / family’s income and wealth picture were not complexor if the respondent had prepared the information in advance.
Respondents will be encouraged to consult records when reporting this information. To provide accurate datait would be necessary to refer to completed tax forms (unless authorization is given to use the informationreported to Revenue Canada) and statements from financial institutions on outstanding mortgage debt, bankbalances, credit card balances, etc..

Proposal for an Asset and Debt Survey 38
Statistics Canada 13F0026MIE - 99003
For budgeting purposes, it will be assumed that it will be necessary to make, on average, 1.5 visits to eachrespondent and that it will take, on average, 70 minutes to acquire the information. This includes unsuccessfulattempts to reach the respondent, telephone follow-up, follow-up with other family members, etc .. Theseassumptions are similar to those used by other Statistics Canada surveys of comparable complexity / length.
7.3 Interviewer training
The success of the survey will, to a large extent, depend on the ability of the interviewers to persuade therespondent of the importance of the survey and to assist them in reporting the information. Training willtherefore constitute a very important part of the data collection strategy. Training for the 1996 FAMEX surveywas three days, plus one additional day for senior interviewers and for new interviewers. It is expected that asimilar amount of training will be required for this survey. The senior interviewers will need additional trainingon methods for approaching the high-income group, as this group’s financial situation will be more complexand, in many cases, the interviewers may be referred to the family’s accountant.
7.4 Proxy response
Households will be required to provide basic demographic information on all household members and moredetail, for persons in the selected economic family, on education, employment, income, assets and debts. Theperson asked to report on behalf of the household will be the person most knowledgeable about the family’sfinancial situation. If, however, that person is unaware of the financial situation of another family member, theinterviewer will attempt to contact that other person directly. If it can be determined that the income, assets anddebts of the person are not significant, this follow-up may not be necessary.
7.5 Computer-assisted interviewing (CAI) versus paper questionnaire
The preferred option for the ADS, given the data are to be collected in May and June of 1998, is the use of apaper questionnaire, called paper and pencil interviewing (PAPI). There are several reasons for this. There isinsufficient time to develop and properly test a full-scale CAI application of the type required for this survey. Inaddition, the SHS interviewers are not trained in CAI; the data for that survey are also collected using PAPI.There would be a significant added expense in conducting CAI training and in supplying the interviewers withthe required hardware.
If the ADS is repeated, it is recommended that a CAI approach be used, even if the need exists, in some cases,to leave the questionnaire with the respondent for completion. Evidence from the U.S. SCF survey indicatesthat data quality was considerably improved by the move from PAPI to CAI.
7.6 Voluntary versus mandatory survey
This survey will be a voluntary survey. Although there is the risk that this will somewhat lower the response rate,there is a greater risk of jeopardizing the respondents’ goodwill if they are told they must co-operate.
7.7 Incentives
In the past, Statistics Canada has periodically used incentives to both encourage and thank respondents. Theseincentives have most often taken the form of items such as clip-boards, a Statistics Canada publication, etc..Studies have found that such incentives have not had a significant effect on response rates (Kumar and Durning,1992). By the very nature of the information that respondents are required to report, the ADS may be in aposition to provide an incentive that relates directly to the family (or unattached individual) being interviewed.It is unlikely that most families would have taken the time to do a full accounting of their asset and debt situation,as will be required for ADS. Several possibilities exist; one is to provide the respondent with a notebook in whichthey can record their responses, and which they can keep. In this way, the survey would help the respondent

Proposal for an Asset and Debt Survey 39
Statistics Canada 13F0026MIE - 99003
to develop a much more complete picture of their financial situation than they are likely to have. There is arisk that this would not be suitable for families whose debts greatly exceed their assets. This would have tobe taken into account in planning the survey.
7.8 Required authorization from respondent
Both to minimize response burden and to improve the quality of the data, it may be preferable to seek therespondent’s authorization to acquire the information from another source. Examples of the need for suchauthorization are:
- Respondents will be asked if they wish to authorize the use of their tax data, rather than providing theincome information at the time of the interview.
- In order to estimate the value of C/QPP benefits, respondents will be asked to authorize access to theirC/QPP files. In fact, without this authorization, the only way to make such an estimate would be to askeach respondent to provide detailed information on employment history. This both adds to responseburden and presents significant recall demands on the respondent.
- Certain individuals/families may prefer to authorize the interviewer to seek the asset and debt informationfrom their accountant, who might be better able to provide some of the required detail.
The interview process must be designed to allow for such authorization to be acquired.

Proposal for an Asset and Debt Survey 40
Statistics Canada 13F0026MIE - 99003
8. Testing
8.1 Issues to be resolved by testing
Testing of the collection methods and the questionnaire itself will be a critical part of the survey developmentprocess. In addition, testing will be needed to better understand if/how respondents keep their financial records.This will help the interviewers to guide respondents to the appropriate records, if required.
Some of the questions that need to be answered through testing are:
Collection related:
- how do respondents prefer to report: by telephone, personal interview or completing the questionnaire ontheir own?
- what type of introductory material is mostly likely to encourage respondents to participate in the survey?- how much information should be given to respondents to aid them in preparing for the interview?- what incentives are most likely to have a positive impact?- how long does it take to complete the interview or report the information?- is a different approach required for the high-income group? What type of additional interviewer training is
needed for this group?- what is the best order in which to ask the questions?
Content related:
- are the questions clearly understood?- how frequently would respondents have to consult records to provide the required information? Are these
records readily available?- how much are respondents likely to know about their employer pension plan, if they belong to one? What
records have they kept on the plan?
8.2 Timing of testing
Testing will be done in the fall, using the focus group approach. Participants in the focus groups will be askedto go through the entire interview process. That means they will first be sent the introductory survey material.The questionnaire will then be administered to them, either in person or on the telephone. Where possible, SHSinterviewers will be used to conduct these interviews. Both the focus group participants and the interviewer willthen participate in focus group sessions. Both the survey content and the interview process will be tested. It willprovide feedback on the clarity of the questions, the length of the interview, the flow of the questions, the utilityof the respondent relations material, the extent to which households keep their financial records, etc..

Proposal for an Asset and Debt Survey 41
Statistics Canada 13F0026MIE - 99003
9. An Overview of System Development
9.1 Introduction
This chapter provides an overview of the system development activity associated with the Asset and DebtSurvey. System development will be concentrated on 6 major functional components. These are:
• Sample Selection
• Capture and Edit
• Edit and Imputation
• Reweighting and Variance Estimation
• Creation of Confidential and Public Use Microdata Files
• Dissemination
Figure 1 provides a high level schematic of the Asset and Debt (ADS) System. Short descriptions of eachfunctional component (i.e., circle) accompany the diagram. Detail is also provided on services which provideclients with access to public-use microdata files and which facilitate analyses of confidential microdata files.Development costs for the ADS System are based on the schematic presented in Figure 1 and on systemswith similar functionality which have been developed previously in Statistics Canada.
9.2 Core System Description
Sample Selection will be carried out using two different sampling frames. First, the T1 Tax File will beused as the source for identifying the high wealth component of the sample. Functionality for identifyingpersons living in the same dwelling will prevent a dwelling from being selected more than once. The LabourForce Survey sampling frame will be used as the source of dwellings for the remainder of the Asset and DebtSurvey sample.
Capture and Edit of the questionnaires will be carried out at Head Office (i.e., in Statistics Canada’soffices in Ottawa, not in the Regional Offices). This will minimize the amount of follow-up that can be donewith respondents. Scanning is being considered as a method of capturing the data.

Proposal for an Asset and Debt Survey 42
Statistics Canada 13F0026MIE - 99003
Figure 1 - A High Level Schematic of the Asset and Debt Survey System

Proposal for an Asset and Debt Survey 43
Statistics Canada 13F0026MIE - 99003
The primary objective of the Edit and Imputation System is to produce a completely edited and cleanmicrodata file at the Economic Family level. The first step is to further update the Captured ADS Data Fileby matching it with a variety of administrative data files (i.e., the T1 Tax File, the Pension Plans in Canada File,the Canada and Quebec Pension Plan Files). This will make each return as complete as possible. Edit andimputation of the resulting ADS Data File will produce a clean microdata file. Finally, a variety of counts willbe developed at the stratum level and recorded on the Stratum Control File. These counts will be used tomodify the sampling weights assigned to microdata records.
Reweighting and Variance Estimation consists of the following major functions:
• Each microdata record will be assigned modified weights.
• Variance estimates are produced.
The output of this function is an edited and weighted ADS Master File of microdata records which representcomplete returns.
The Creation of Confidential and Public-Use Microdata Files function will create both confidential and public-use microdata files. Derived variables will be created. The public-use version of the microdata file will havea variety of transformations (e.g., suppression of values, collapsing of category values, rounding ofquantitative data values) applied which prevent the identification of any one person or family. Finally, theremay be a need to provide a shared master file for some clients which is a hybrid of the confidential and public-use microdata file types. A shared master file is one containing a mixture of confidential and public-usemicrodata records. In this case respondents would have agreed to share their confidential data.
The Dissemination function will provide two distinct user groups with access to ADS microdata. First, externalclients will purchase the public use microdata file itself and conduct their initial analyses on flat files derivedfrom this dataset. User friendly interface software which uses the ADS Data Dictionary will be provided withthe purchased microdata file. It will enable clients to easily create flat file outputs which can be processedby a variety of software (e.g., SAS, SPSS) packages. These flat files will be customised to a client’s specificneeds. Subsequently, external clients may wish to forward their customised tabulation software and retrievalspecification to Statistics Canada and have tabular outputs produced from the confidential microdata file. Second, internal Statistics Canada personnel will be provided with the same interface software, but will beable to access the confidential microdata file directly.

Proposal for an Asset and Debt Survey 44
Statistics Canada 13F0026MIE - 99003
10. Analysis and dissemination
10.1 Staging of release of data
The data from this survey will very likely be released in several stages. Some of the variables require significantadditional processing and estimation; this work should not prevent the rest of the information from beingreleased. The estimation of the value of pension wealth held in registered pension plans (RPPs) and in theC/QPP would most likely not be made available in the first release of the survey data.
10.2 Data/analytical products
Two different types of output will be produced from this survey. They are:
1) Analytical products
Statistics Canada, and the other partners in this survey, would analyse the results of the data. In some casesthis output would be produced jointly and, in others, independently. This would depend on the nature of theanalysis being done. In all cases, the partners in this process would be recognized.
Several analytical/descriptive outputs should be prepared in the early stages of data release. They are:
- an evaluation and assessment of the data. This would involve a look at response rates, magnitude ofimputation of missing data, comparison of survey estimates with their counterparts from other sources, etc..A reasonable assessment of the data would be necessary prior to releasing the financial estimates.
- highlights of the data and detailed statistical tables in paper and electronic form. Such a product couldbuild on those produced from the earlier asset and debt surveys conducted by Statistics Canada in 1984and 1977. It would also contain a description of the survey methodology and definitions of the conceptsused.
These products would be followed by issue-oriented analytical products which could be prepared by one ormore of the survey partners. Issues could range from an analysis of RRSP holders and holdings, debt loadcarried by post-secondary students, variation in wealth holdings by families in different provinces/areas,indebtedness of Canadians, wealth of the growing self-employed community, and so on.
2) Microdata files
A screened or public-use microdata file will be produced and made available to the public on a cost recoverybasis. Purchasers of microdata products must sign a licensing agreement with Statistics Canada.
The information on this file will be screened to ensure that no individuals can be identified, either directly orindirectly. Approval for the release of such files must be given by Statistics Canada's Microdata ReleaseCommittee (MRC). Variables which directly identify a respondent, such as name, address and telephonenumber, are suppressed on all files. Other variables, such as demographics, labour force activity or language,must be reviewed to ensure that unique combinations or rare characteristics will not directly or indirectly identifyany individual. The most problematic variables in terms of data confidentiality are geographic identifiers andsocio-demographic variables.

Proposal for an Asset and Debt Survey 45
Statistics Canada 13F0026MIE - 99003
10.3 Other means of disseminating data
1) Custom-retrieval service
Statistics Canada would have the capability of generating, from the data flies, custom tabulations or productsin response to requests for this information. It is expected that such a service would be of interest to a widerange of users, including social policy analysts/researchers, federal / provincial government departments,educational institutions, consulting/brokerage firms, financial institutions such as banks and trust companies,etc.. This service would be provided on a cost recovery basis.
2) Remote access
A facility called remote access is also available to users. If the public-use microdata file will not provide therequired information, a description of the contents of the confidential master file can be provided to users whocan then generate their own computer code for producing custom tabulations directly from the confidentialmaster file. This code can be submitted to Statistics Canada via the lnternet. The results of the tabulation mustof course be vetted for confidentiality. This procedure is available on a cost recovery basis but has theadvantage of saving both the user and Statistics Canada time and resources.

Proposal for an Asset and Debt Survey 46
Statistics Canada 13F0026MIE - 99003
11. Survey costs and major milestones
The cost to conduct the survey described in this proposal have been estimated to be between $3,200,000 and$3,400,000. These costs assume the following:
- a responding sample of about 15,000 households;- data collection in most cases by personal interview (every effort will be made to accommodate respondents
who prefer to complete this information on their own or to report it on the telephone);- interview length of about 70 minutes;- output to be made available: standard publication and tables (in hard copy or electronic form), microdata files,
custom tabulation service. These are described more fully in the previous section.
Major milestones for this survey are:
Activity Completion date
Development
Draft questionnaire / respondent relations material August 29, 1997
Focus group testing October 31, 1997
Refine questionnaire / respondent relations material/ content frozen
November 14, 1997
Define sampling requirements August 29, 1997
Listing new clusters for sample November to February 28, 1998
Forms design and printing February 28, 1998
Collection
Interviewer training material March 15, 1998
Interviewer training April 30 , 1998
Data collection April 27 to June 20, 1998
Processing
Capture system (including testing) April 30, 1998
Edit / imputation system May 30, 1998
Data processing June 1, 1998 to January 31, 1999
Incorporate tax data November 30, 1998
Output systems October 31, 1998

Proposal for an Asset and Debt Survey 47
Statistics Canada 13F0026MIE - 99003
Output
Initial data release April 30, 1999
Release of public-use microdata file April 30, 1999
Release of publication August 31, 1999

Proposal for an Asset and Debt Survey 48
Statistics Canada 13F0026MIE - 99003
12. Management co-ordination approach
12.1 Project team approach
Household Surveys Division will be responsible for conducting the survey, using an interdisciplinary teamapproach. Apart from the sponsoring agencies, the team would also consist of Statistics Canada fieldoperations, survey methodology, survey management, system development and analysis divisions.
Representatives from the sponsoring agencies would work together with the project team to reviewquestionnaire content, wording and other aspects of the project.
12.2 Steering Committee
The overall direction of the project team would be guided by a Steering Committee of managers from StatisticsCanada and senior representatives from the other agencies participating as survey partners. The SteeringCommittee would meet periodically to approve survey schedule, cost estimates and design details.

Proposal for an Asset and Debt Survey 49
Statistics Canada 13F0026MIE - 99003
Appendix A - Estimates of CVs assuming sample size of 15,000 and 30,000
Table 1. Coefficient of variation for average wealth by income groups
Sample size: 14,029Based on SCF 1984
Sample size: 30,000Income groups(in thousands ofdollars)
All familiesandunattached
Families Unattached All familiesandunattached
Families Unattached
<5k 20.11% 27.42% 13.79% 13.75% 18.75% 9.43%
5 - 9 8.36% 11.00% 9.79% 5.71% 7.52% 6.69%
10 - 14 4.55% 5.58% 6.11% 3.11% 3.82% 4.18%
15 - 24 3.51% 4.06% 8.61% 2.40% 2.78% 5.89%
25 - 34 3.70% 3.97% 11.03% 2.53% 2.72% 7.54%
35 - 44 4.12% 4.21% 16.58% 2.82% 2.88% 11.34%
45 - 59 3.02% 2.96% 18.85% 2.06% 2.02% 12.89%
60 + 8.10% 8.40% 5.54% 5.74%
Total 2.99% 2.96% 5.83% 2.04% 2.03% 3.99%
Table 2. Coefficient of variation for average income by wealth groups
Sample size: 14,029Based on SCF 1984
Sample size: 30,000Wealth groups(in thousands ofdollars)
All familiesandunattached
Families Unattached All familiesandunattached
Families Unattached
Negative 1.81% 3.12% 3.19% 1.24% 2.14% 2.18%
0 - 0.9 k 2.51% 2.55% 5.59% 1.71% 1.74% 3.82%
1 - 4 k 2.10% 2.30% 3.31% 1.44% 1.57% 2.26%
5 - 14 k 1.49% 1.73% 2.24% 1.02% 1.18% 1.53%
15 - 29 k 1.87% 1.46% 3.86% 1.28% 1.00% 2.64%
30 - 49 k 1.56% 1.47% 4.79% 1.07% 1.01% 3.28%
50 - 74 k 1.25% 1.20% 4.65% 0.85% 0.82% 3.18%
75 - 99 k 1.61% 1.31% 5.80% 1.10% 0.90% 3.97%
100 - 149 k 2.69% 2.16% 10.41% 1.84% 1.48% 7.12%
150 - 199 k 2.03% 1.89% 6.76% 1.39% 1.29% 4.63%
200 - 299 k 2.43% 2.62% 1.66% 1.79%
300 k + 5.17% 5.14% 3.54% 3.52%
Total 0.74% 0.68% 1.74% 0.50% 0.46% 1.19%

Proposal for an Asset and Debt Survey 50
Statistics Canada 13F0026MIE - 99003
Table 3. Coefficient of variation for average wealth by age of the head of the family.
Sample size: 14,029Based on SCF 1984
Sample size: 30,000Age of head
All familiesandunattached
Families Unattached All familiesandunattached
Families Unattached
=24 15.42% 17.41% 24.17% 10.55% 11.91% 16.53%
25 - 34 4.00% 4.91% 7.60% 2.74% 3.36% 5.20%
35 - 44 3.94% 3.69% 24.37% 2.70% 2.52% 16.66%
45 - 54 6.93% 6.87% 22.36% 4.74% 4.70% 15.29%
55 - 64 4.30% 4.69% 8.45% 2.94% 3.21% 5.78%
65 + 4.83% 5.30% 6.67% 3.30% 3.63% 4.56%
Total 2.99% 2.96% 5.83% 2.04% 2.03% 3.99%
Table 4. Coefficient of variation for average wealth by sources of income.
Sample size: 14,029Based on SCF 1984
Sample size: 30,000Sources of income
All families and unattached All families and unattached
Wages and salaries 2.90% 1.98%
Self employed 6.56% 4.47%
Transfer 4.40% 3.00%
Other 9.69% 6.61%
Total 2.98% 2.04%
Table 5. Coefficient of variation for average wealth by regions
Sample size: 14,029Based on SCF 1984
Sample size: 30,000Regions
All families and unattached All families and unattached
Atlantic 5.31% 3.63%
Québec 4.95% 3.38%
Ontario 6.22% 4.25%
Prairies 6.86% 4.69%
British Columbia 5.48% 3.75%
Canada 2.99% 2.04%

Proposal for an Asset and Debt Survey 51
Statistics Canada 13F0026MIE - 99003
References
Atkinson, A.B.(1989). The Economics of Inequality, 2nd ed., Oxford University Press, New York.
Avery, Robert B., and Gregory E. Elliehausen, and Arthur B. Kennicke (1988). “Measuring wealth with SurveyData: An Evaluation of the 1983 Survey of Consumer Finances”, Review of Income and Wealth, 34(4).
Avery, Robert B. and Gregory E. Elliehausen (1986). “Financial Characteristics of High-Income Families”,Federal Reserve Bulletin, pp.163-177.
Beach, C.M., D.E Card and F. Flatters (1981). Distribution of Income and Wealth in Ontario: Theory andEvidence, University of Toronto Press, Ontario Economic Council.
Boskin, Michael J. (1988). “Issues in the Measurement and Interpretation of Savings and Wealth”, WorkingPaper #2633, National Bureau of Economic Research.
Canadian Securities Institute (1993). The Canadian Securities Course, Toronto, Ontario.
Davies, James B. (1979). “The 1970 Survey of Consumer Finance, Non-Sampling Error, and The PersonalDistribution of Wealth in Canada”, in Reflections on Canadian Incomes, Economic Council of Canada.
Department of Statistics (1991). Income and Wealth Statistics, Wellington, New Zealand.
Heeringa, Steve G. And F. Thomas Juster and R. Louise Woodburn (1989). “The 1989 Survey of ConsumerFinances: A Survey Design for Wealth Estimation”, presented at the International Association forResearch in Income and Wealth, Lahnstein, West Germany, August.
Juster, F. Thomas and Kathleen A. Kuester (1991). “Differences in the Measurement of Wealth, WealthInequality and Wealth Composition Obtained from Alternative U.S. Wealth Surveys”, Review of Incomeand Wealth, 37(1).
Kennickell, Arthur B., Martha Starr-McCluer and Annika E. Sunden (1997). “Family Finances in the U.S.:Recent Evidence from the Survey of Consumer Finances”, Federal Reserve Bulletin, January 1997.
Kennickell, Arthur B. (1997). “Using Range Techniques with CAPI in the 1995 Survey of Consumer Finances”,Federal Reserve Board, Washington, D.C.
Knight, Ian (1975). “The Feasibility of Conducting a National Wealth Survey in Britain”, New MethodologySeries #NM6, Office of the Population Censuses and Surveys, London.
Kumar, S. And Durning, A. (1992). “The Impact of Incentives on the Reponse Rates for FAMEX 1990: AnEvaluation”, Working Paper No. SSMD 92-001E, Statistics Canada.
Oja, Gail (1986). “The Wealth of Canadians: A Comparison of the Survey of Consumer Finances withNational Balance Sheet Estimates”, Staff Report #86-3, Statistics Canada, December.
Oja, Gail (1987). “Changes in the Distribution of Wealth in Canada, 1970-84", Income Analytic Report #1,Statistics Canada, June.
Rushbrook, T. And J. Wells (1987). “National and Sector Balance Sheets in Concept and Practice”, Reviewof Income and Wealth, 33(1).

Proposal for an Asset and Debt Survey 52
Statistics Canada 13F0026MIE - 99003
Statistics Canada. The Distribution of Wealth in Canada, 1984, Cat. #13-580 (occasional).
Statistics Canada. Census Dictionary, Cat. #92-301E.
Statistics Canada (1992). “Content of the Survey of Labour and Income Dynamics, Part B - Income and WealthComponent”, Cat. #92-01B, December.
Wolff, Edward N, and Marcia Marley (1987). “Introduction and Overview”, in International Comparisons of theDistribution of Household Wealth, ed. Edward N. Wolff, Claredon Press, Oxford.