12.8 implementing terminal doppler weather radar …
TRANSCRIPT

12.8 IMPLEMENTING TERMINAL DOPPLER WEATHER RADAR DATA FOR WFO OPERATIONS
Andrew D. Stern*
Mitretek Systems, Inc., Falls Church, VA
Michael J. Istok, Warren M. Blanchard and Robert E. Saffle National Weather Service, Office of Science and Technology, Silver Spring, MD
Bill Bumgarner
BAE Systems, Washington, DC
1. INTRODUCTION
For the last several years, the National Weather Service (NWS) has been exploring the utility of bringing weather radar data from Federal Aviation Administration (FAA) radars into Warning and Forecast Office (WFO) operations (DiVecchio, 2003). Demonstration radar data ingest and display systems have been created with several being tested at field offices and at NWS Headquarters. These systems include the Terminal Doppler Weather Radar (TDWR), the Air Route Surveillance Radar, model 4 (ARSR-4) and the Airport Surveillance Radar, Model 11 (ASR-11) (Stern, 2003).
As a first step toward the development
and deployment of an operational system, the NWS has embarked upon the development of a Linux-based data ingest and processing system using data from the TDWR. This system will provide images of base reflectivity and base velocity data directly to forecasters at Advanced Weather Information Processing System (AWIPS) consoles. A description of the system capabilities, comparisons of data sets between the TDWR and a nearby Weather Surveillance Radar, 1988D (WSR-88D), and updated plans for future development will be discussed.
2. TDWR Web Server Overview
The concept of a web server for the processing and display of TDWR data was developed by the Massachusetts Institute of Technology, Lincoln Laboratory during the 1990s. The original invocation of the software resided on an HP (HPUX) platform and relied heavily on Common Gateway Interface (CGI) scripting for its web interaction and dynamic creation of images. The NWS subsequently ported the server to a Sun (Solaris) system.
As the NWS increasingly looks toward Linux as its operating system of choice, it was decided that a Linux-based web server would be implemented as a first phase in a more permanent TDWR processing solution. Since the main TDWR processors use big Endian ordering, changing the web server from Solaris to Linux required a translation in byte ordering. However, switching to an Intel-based platform brought advantages such as easier and less expensive maintenance and significant processing power.
The following sections describe the
capabilities, architecture, and metrics of the new web server for TDWR processing.
2.1 Web Server Capabilities
The TDWR web server is capable of ingesting and processing any of the elevations within the radar volume in either monitor (clear air) or hazardous weather (precipitation) mode. The system is fully configurable and customizable so that its installation at different sites requires only changes to text configuration files.
* Corresponding author address: Andrew D. Stern Mitretek Systems, Inc.; 3150 Fairview Park Drive South, Falls Church, Virginia 22042-4519; Email: [email protected] The views expressed are those of the author(s) and do not necessarily represent those of the National Weather Service.

Figure 1 The TDWR web server main display customized for the Baltimore/Washington International Airport (BWI) TDWR. A short range (48 nm) base reflectivity at 0.3 degree elevation angle is shown in the main display window.
The web server allows the forecaster to
display and interrogate TDWR images in several ways. First, the default display (shown in Figure 1) provides the most current GIF image within the main viewing window. This image can be automatically refreshed each volume. There is also a zoom capability to greatly magnify any portion of the radar screen.
The small “system status” window at the top right provides the forecaster with a real-time display (updated once per minute) of the status of the ingest processor, the weather mode of the radar and the date and time stamp of the current volume being processed. If data were to stop being processed by the server, forecasters would be alerted to this change with large red letters displaying an off- line condition.

The three columns on the left side of the display (under TDWR Products) can be customized so that a subset of the 20-30 available elevations in each TDWR volume are processed and made displayable.
The reflectivity (REFL) elevations are
grouped at the top of the column. The short range (SR) images provide (displayed) 300 meter resolution to 90 km (48 nm). The long range (LR) images provide 600 meter range resolution to 185 km (100 nm).
The base velocity images can be
displayed as dealiased (Deal) or as unconditioned (Raw).
Selecting any of the links in the central
column invokes the image query mode. In query mode, information about the relative location of the cursor and the magnitude of
the data displayed can be presented in the bottom frame of the browser (Figure 2).
Selecting a link from the rightmost
column invokes the animation display. Figure 3 shows the controls that are available to manipulate the animation.
The control section offers buttons to
start and stop the looping, perform a rocking motion loop or skip individual frames in the loop. There are controls to change the loop rate, advance or reverse the direction and skip to the beginning or the end.
In addition to auto refresh (and auto
decay) of the 10 frame loop, the display has the capability to animate the images at any zoom level.
Figure 2 The query screen provides a real-time readout of the cursor bearing (degrees), range (nm), altitude (ft) and magnitude of the interrogated pixel. For reflectivity, the value presented is in dBZ. For velocity, the value presented is in positive or minus knots.

Figure 3 Animation Controls available for animation on the TDWR web server
The real-time looping capability of the
TDWR web server maintains an auto refreshed loop containing 10 images. The system also has the ability to display older images.
The TDWR web server has an automatic
archive capability that allows the system to store and retrieve images for up to 31 days. Invoking the archive display capability is straight forward. Clicking the “show archive menu” link on the main page (Figure 1) generates an image similar to Figure 4.
Figure 4 contains two menus to the left of
the main display. The top menu is a selector screen to allow the operator to pick from which day the archived images should be displayed. The numbers in the menu correspond directly with the date that the images were created (e.g., Figure 4 shows that images will be selected from the 27th of the most recent month).
Once a selection is made from the date selector, the lower menu is populated. A listing of every image created with product ID, elevation angle and generation time is displayed in a scrolling window. Individual images or a range of images can be selected. The loop size can be as large as the system memory can handle with the limitation that network throughput may slow down very large animations.
Once a loop range has been made, and
the “View Scans” button has been selected, a second browser window will open with animation controls displayed at the top rather than the typical Netscape or Internet Explorer controls. This second window has auto refresh capability. Hence, if a current animation is selected, it is possible to create two simultaneously updating animations of different products.

Figure 4 Archive retrieval and display system of the TDWR web server
The TDWR web server contains a status
page which is updated each volume scan. This page contains system identifying information (e.g., Radar ID, latitude/longitude, magnetic declination) as well as current volume scan specifics. The system administrator also has the ability to add informational messages to the bottom of the status page.
Several tools have been created to support the web server customization. A map generation program was developed so that map backgrounds could be easily created for any site in the continental United States. An HTML file generator was developed to assist in the customization of web pages and to change links to individual images or animations.

Figure 5 TDWR web server process flow
2.2 Web Server Architecture
The heart of the TDWR web server is a program called the “TDWR Ingestor” (Figure 5). The ingestor plays the complex role of communications processor, radial assembler and algorithm queue control.
The ingestor accepts UDP data packets from the FAA transmitter. The process continues until a whole radial has been received and assembled. The radial consists of a header and data section, typically about 6144 bytes long.
A completed radial is then passed to the
processor for byte swapping, quality control and inclusion in an elevation structure. Once a whole elevation has been assembled, elements within the product generation file are compared with the current data and if one or more products are requested from this elevation, the structure is stored to disk, a product specific script is written and the
program spawns a process to generate the desired image.
Each algorithm is queued once for each
product desired. A library of common commands has been created so that the only unique parts of base data algorithms deals with the actual image generation. Once an image has been created, it is stored in the current daily archive. At the end of each day (based on Universal Time or UTC), the images are moved to the directory associated with their day date by a script generated and invoked by the “cron” scheduler.
Under normal operations, the web server
only keeps raw (base) data from the current volume. If a significant weather event is expected, one field in a text-based configuration file can be changed to cause all elevations of base data to be archived.
Default color tables are provided for both reflectivity and velocity images.

2.3 System Metrics
Without base data archive invoked, the TDWR web server requires 5 GB of disk space for both the operational files and the storage of 31 days worth of GIF images.
GIF image size can vary according to the
amount of echoes and ground clutter that is detected around the radar. Typical images can range from 25 KB to 80 KB. Close to 3500 GIF images can be generated daily if just 16 products are generated from five elevations.
Base data storage is much more
demanding on hard drive storage capacity. Base data size range from 1.7 MB per
elevation for short range scans to 2.2 MB per elevation for long range scans. Hence, for a configuration that archives 5 elevations per volume (1 long range and 4 short range), it would require 9 MB per volume, 108 MB per hour or 2.21 GB per day. 2.4 Web Server Examples
The test and development facility for the TDWR web server is located at the NWS Headquarters Systems Engineering Center in Silver Spring, MD. Real-time data from both the BWI TDWR and LWX (NWS Sterling, VA) WSR-88D are available for comparison.
Figure 6 WSR-88D from LWX (Sterling, VA) showing approach of Hurricane Isabel. L shows location of LWX. B shows the relative location of the BWI TDWR. Range = 125 nm

On September 18 and 19, 2003, the
circulation associated with Hurricane Isabel moved northwestward over central Virginia. This trajectory took the core circulation to the southwest of both radars.
Figure 6 shows the base reflectivity image from the LWX WSR-88D from 18 September
2003, 22:46 UTC. An outer band from Isabel extended east to west over both the Washington and Baltimore metro areas. The circle with the “L” shows the location of the WSR-88D antenna. The “B” indicates the location of the BWI TDWR.
Figure 7 TDWR from BWI (Baltimore/Washington International) showing the outer rain band of Hurricane Isabel. The B shows the location of the BWI TDWR. The L shows the relative location of the LWX WSR-88D. Range=100 nm

Figure 7 shows an image from nearly the same time as Figure 6 (22:42 UTC 18 September 2003). The image from S-band (10 cm) WSR-88D has a range of 125 nm with a bin resolution of 1000 meters. The image from the C-band (5 cm) TDWR has a range of 100 nm with a bin resolution of 300 meters.
Both images clearly show the core tropical
circulation to the southwest. The difference in the reflectivity intensities in the core is likely from attenuation from the radar’s different wavelengths. Closer to both radars, the small
scale definition of the outer rain band is clear in both images. The higher resolution of the TDWR may even provide a slightly higher definition to the smaller features.
Figures 8 and 9 compare the base velocity images from the WSR-88D and TDWR. The WSR-88D in Figure 8 has a range of 125 nm with a bin resolution of 250 meters. The TDWR in Figure 9 has a range of 48 nm with a (displayed) bin resolution of 300 meters.
Figure 8 LWX WSR-88D base velocity from 22:46 UTC 18 September 2003

Figure 9 BWI TDWR (dealiased) base velocity from 22:43 UTC 18 September 2003
Both base velocity images clearly show the strong easterly flow associated with the tropical rain band. The TDWR image shows near hurricane force winds reaching near the surface (light blue area northeast of the radar). There is also implied turbulence in the display by the choppy texture depicted along the zero degree azimuth line.
2.5 Additional Features
Some additional features may be added to the TDWR web server as the field gains more experience with the system. Initial development of a four panel capability has begun. Figure 10 provides an example showing a long range (100 nm) reflectivity (0.3 degrees) on the top left, a short range (48 nm) reflectivity (1.0 degrees) on the top right, a base velocity (0.3 degrees) on the lower left and a base velocity (3.4 degrees) on the lower right.
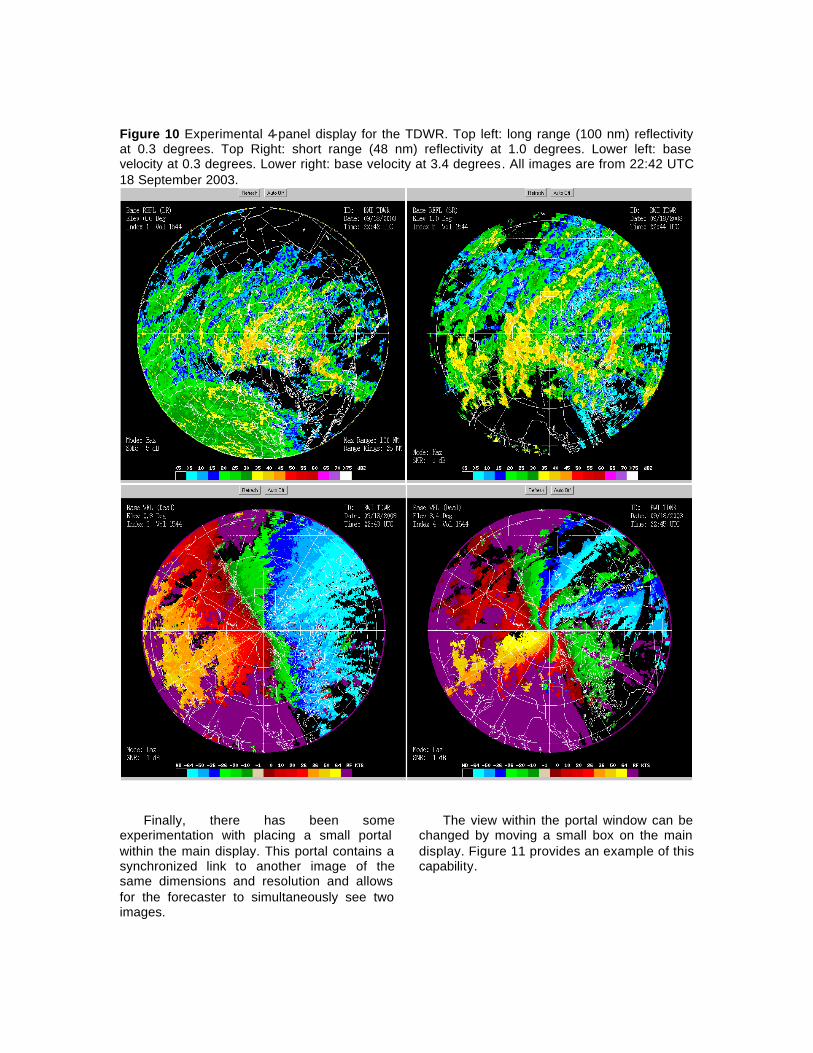
Figure 10 Experimental 4-panel display for the TDWR. Top left: long range (100 nm) reflectivity at 0.3 degrees. Top Right: short range (48 nm) reflectivity at 1.0 degrees. Lower left: base velocity at 0.3 degrees. Lower right: base velocity at 3.4 degrees. All images are from 22:42 UTC 18 September 2003.
Finally, there has been some experimentation with placing a small portal within the main display. This portal contains a synchronized link to another image of the same dimensions and resolution and allows for the forecaster to simultaneously see two images.
The view within the portal window can be changed by moving a small box on the main display. Figure 11 provides an example of this capability.

Figure 11 Experimenting with a portal on the main TDWR display. As the forecaster moves the small box (pointed to by the arrow in the main display), the image within the portal changes to show a corresponding data set. In this example, the main display shows base reflectivity. The portal has the corresponding base velocity.
3.0 Future Plans
Consideration for initial deployment of the TDWR web server will be to those sites that
have participated in prototype testing and development (Stern, 2002). These sites include:
Web Servers Associated with these TDWRs Serving These Associated NOAA/NWS Offices Baltimore/Washington International WFO Sterling, VA
WFO Mt. Holly, NJ NWS Headquarters, Silver Spring, MD
Salt Lake City International WFO Salt Lake City, UT Western Region HQ, Salt Lake City, UT
Boston Logan International WFO Taunton, MA Will Rogers World Airport, Oklahoma City National Severe Storms Laboratory, Norman
WFO Norman, OK Sky Harbor International, Phoenix WFO Phoenix, AZ
Software development and expertise gained in the use and interpretation of TDWR data has laid the groundwork for a much more comprehensive solution. Engineering has begun on the development of a Supplemental Product Generator (SPG) which may serve as the platform for the acquisition and integration of non-NWS weather radar data in the future.
The SPG will likely be built on the
framework of the NWS Open Systems Radar Product Generator (ORPG) (Istok, 2004). A minimum number of components will be modified so that supplemental radar data can be processed in a similar fashion as is done for the WSR-88D. This means that, if implemented, supplemental radar data can have similar algorithms, storage, formatting and communications as the WSR-88D. 4.0 Summary
The NWS has developed a server-based tool for the FAA TDWR. The TDWR web server is able to receive base data, assemble and process the radials into elevations and queue algorithms to generate GIF images for display. Tools have been created to support the web server to allow for the customized map background generation and the creation of HTML web pages.
The web server runs on an inexpensive
PC platform using the Linux operating system. It gives forecasters the ability to animate, zoom and query real-time imagery as well as display loops of archived data.
The NWS is looking into a more
permanent and robust solution called the Supplemental Product Generator (SPG). The SPG will likely be built upon the framework of the current NWS Open Systems Radar Product Generator. 5.0 Acknowledgment
The authors would like to thank Tom Passin of Mitretek Systems for his assistance in creating the JavaScript portion of the web server archive page.
Many thanks to Tom Whittaker of the University of Wisconsin, Madison, Space Science Engineering Center for his work on developing and maintaining the AniS
(AnimationS applet) which was used in a portion of the web server implementation. 6.0 References DiVecchio, M.D., R.E. Saffle, M.J. Istok, P.K.
Pickard, W.M. Blanchard, S. Shema, L.D. Johnson, and A.D. Stern, 2003: Utilizing FAA Radar Weather Data in the National Weather Service: Progress and Plans, 19th Conf. On Interactive Information and Processing Systems, Long Beach, CA, Amer. Meteor. Soc., Paper P1.25
Istok, M.J., W.M. Blanchard, T.J. Ganger and
A.D. Stern, 2004: Radar Information Enhancements for the NWS Operational User, 20th Conf. On Interactive Information Processing Systems, Seattle, WA, Amer. Meteor. Soc., Paper 5.3
TDWR Server Users’ Guide, MIT Lincoln
Laboratory, 244 Wood Street, Lexington, MA 02173
Stern, A.D., 2003: Terminal Doppler Weather
Radar Web Server Documentation and Installation Instructions, Mitretek Systems, Inc, Falls Church, VA
Stern, A.D., P.K. Pickard, W.M. Blanchard,
M.J. Istok, B. Bungarner, D.L. Estes, S. Shema, 2002: Analysis and Plans for Using FAA Radar Weather Data in the WSR-88D, 18th Conf. On Interactive Processing Systems, Orlando, FL, Amer. Meteor. Soc., Paper 5.6
Stern, A.D., W.M. Blanchard, P.K. Pickard,
R.E. Saffle, M.J. Istok, M.D. DiVecchio, B. Bumgarner, 2003: Exploring the use of FAA Radar Weather Data by the NWS: Comparisons and Observations Between the WSR-88D and FAA Weather Radars, 19th Conf. On Interactive Information Processing Systems, Long Beach, CA, Amer. Meteor. Soc., Paper P1.32