1/23unece work session on gender statistics. geneva, 12-14 march 2012 value of non-market labour...
TRANSCRIPT
1/23UNECE work session on gender statistics. Geneva, 12-14 March 2012
Value of non-market labour production of Spanish households in 2010 and its
comparison with 2003
Raquel del ValCarlos Angulo
INE (Spain)
2/23UNECE work session on gender statistics. Geneva, 12-14 March 2012
- Background
- Value of non-market labour production of
households: basic methodology
- Time spent on labour production
- Which wage?
- Comparison of the values of non-market labour
production of households between 2003 and 2010
- Concluding remarks
Presentation
3/23UNECE work session on gender statistics. Geneva, 12-14 March 2012
Background (1)
– Spanish TUS 2002-2003 and 2009-2010– Eurostat Manual on a Satellite Account of
household production– The Spanish satellite account (by Casero &
Angulo)– María Luisa Moltó, Ezequiel Uriel– María Ángeles Durán
4/23UNECE work session on gender statistics. Geneva, 12-14 March 2012
Background (2)
Spanish TUS: highlights• Carried out by INE• Follows the guidelines of Eurostat• Population scope: people aged 10 years
and older residing in family dwellings
5/23UNECE work session on gender statistics. Geneva, 12-14 March 2012
Background (3)
In the “household questionnaire” a module was introduced about household domestic service in order to find out the number of employees, their working hours and the wages paid to them.
This information was not available in 2003.
6/23UNECE work session on gender statistics. Geneva, 12-14 March 2012
Background (4)
In 2003 we used the wages reported in the “individual questionnaire” by the people who
themselves work in domestic service. This information is also available in the 2010 survey.
Problem: People tend to report lower income than actually received. Therefore it is possible
that the 2003 satellite accounts are undervalued.
For the new satellite account we have to decide the source of information that we use and we hope this work will help us to make the right
decision.
7/23UNECE work session on gender statistics. Geneva, 12-14 March 2012
Value of the labour production (1)
• Input-based method (time used in household production estimated by time use surveys)
• An appropiate wage to value the time spent on these activities.
TIME X WAGE = Net Added Value of non- market labour production of households
8/23UNECE work session on gender statistics. Geneva, 12-14 March 2012
• Principal functions of the non-market productive activities of households
-Housing
-Nutrition
-Clothing
-Care services
-Transport
-Volunteer work
Value of the labour production (2)
9/23UNECE work session on gender statistics. Geneva, 12-14 March 2012
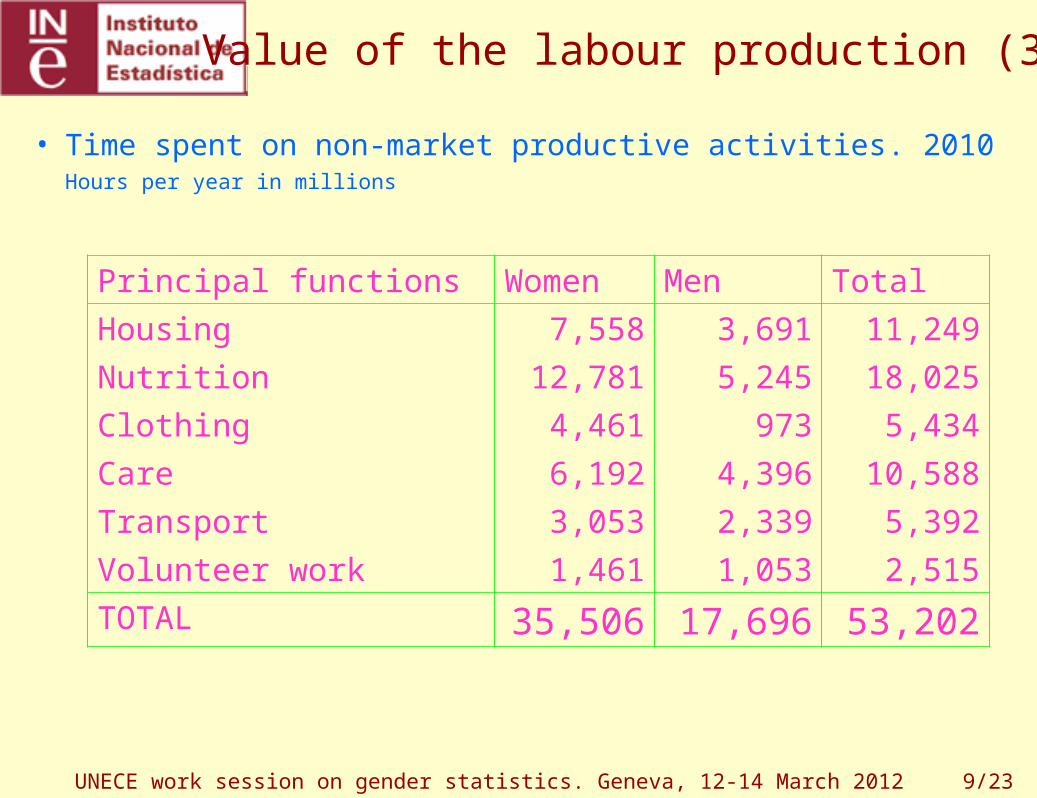
• Time spent on non-market productive activities. 2010 Hours per year in millions
Principal functions Women Men Total
Housing 7,558 3,691 11,249
Nutrition 12,781 5,245 18,025
Clothing 4,461 973 5,434
Care 6,192 4,396 10,588
Transport 3,053 2,339 5,392
Volunteer work 1,461 1,053 2,515
TOTAL 35,506 17,696 53,202
Value of the labour production (3)
10/23UNECE work session on gender statistics. Geneva, 12-14 March 2012
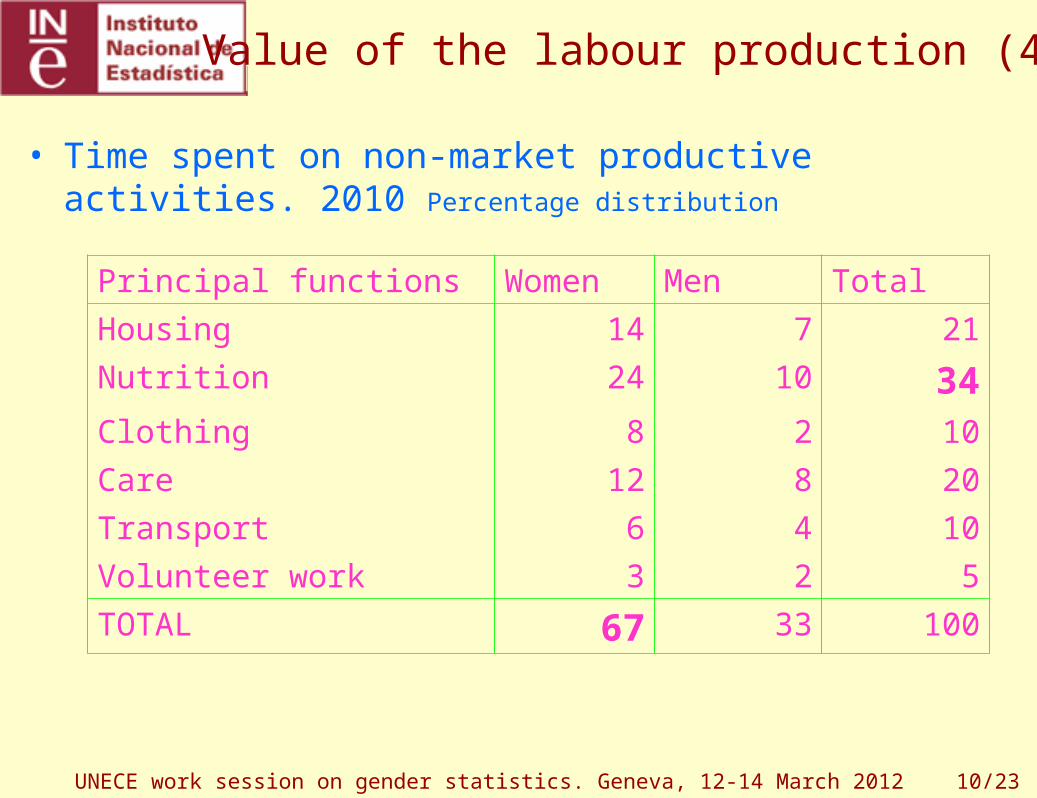
• Time spent on non-market productive activities. 2010 Percentage distribution
Principal functions Women Men Total
Housing 14 7 21
Nutrition 24 10 34Clothing 8 2 10
Care 12 8 20
Transport 6 4 10
Volunteer work 3 2 5
TOTAL 67 33 100
Value of the labour production (4)
11/23UNECE work session on gender statistics. Geneva, 12-14 March 2012
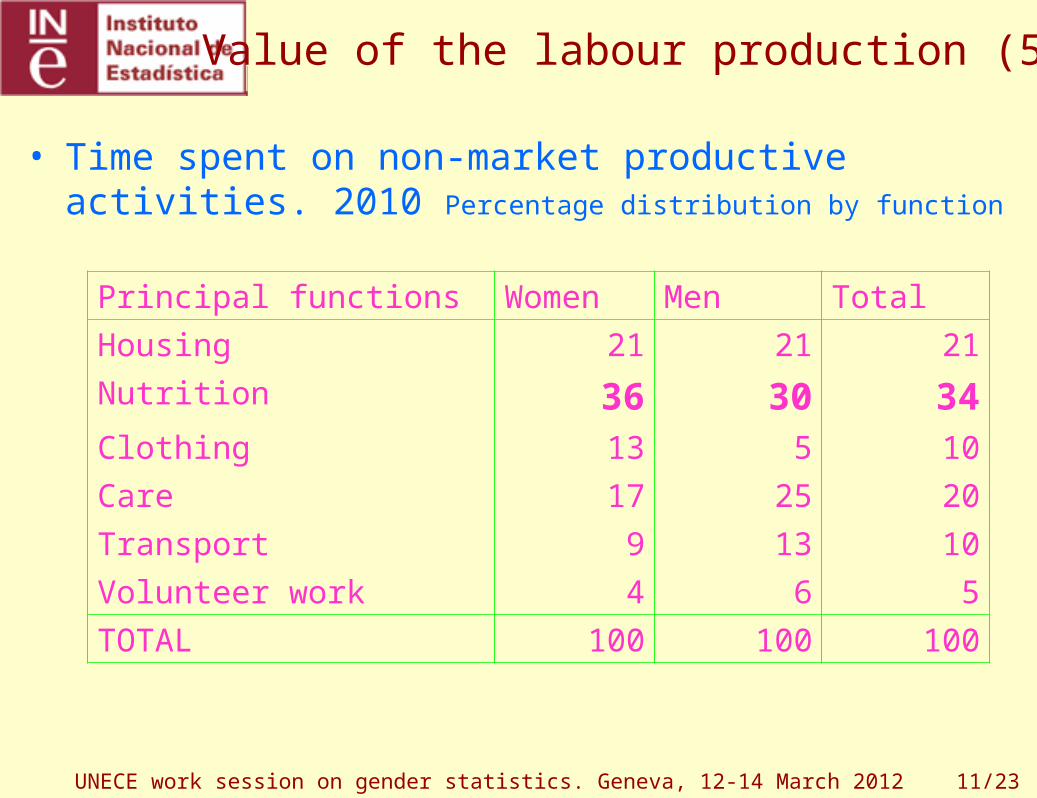
Principal functions Women Men Total
Housing 21 21 21
Nutrition 36 30 34Clothing 13 5 10
Care 17 25 20
Transport 9 13 10
Volunteer work 4 6 5
TOTAL 100 100 100
• Time spent on non-market productive activities. 2010 Percentage distribution by function
Value of the labour production (5)

12/23UNECE work session on gender statistics. Geneva, 12-14 March 2012
Principal functions Women Men Total
Housing 67 33 100
Nutrition 71 29 100
Clothing 82 18 100
Care 58 42 100
Transport 57 43 100
Volunteer work 58 42 100
TOTAL 67 33 100
• Time spent on non-market productive activities. 2010 Percentage distribution by sex
Value of the labour production (6)
13/23UNECE work session on gender statistics. Geneva, 12-14 March 2012
•Wages
– We chose the “replacement cost” using the general wage for domestic workers paid by households, obtained from the results of the time use survey.
– The net wage per hour worked amounts to €8.22.
Value of the labour production (7)
14/23UNECE work session on gender statistics. Geneva, 12-14 March 2012
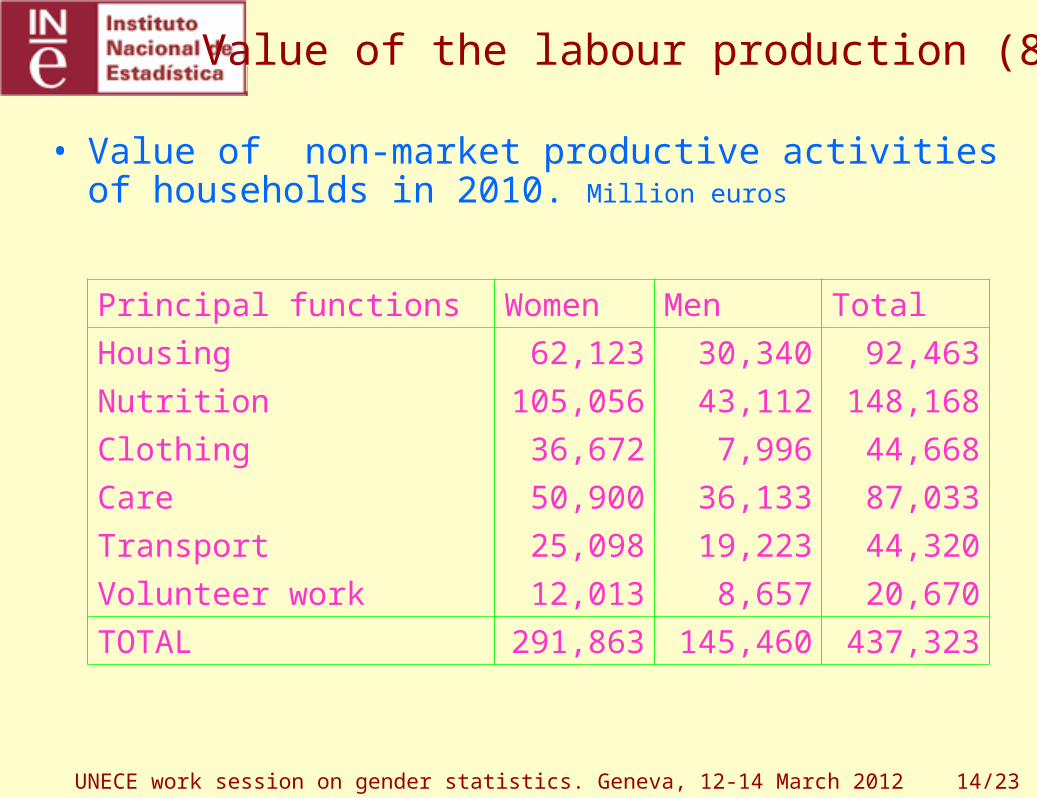
• Value of non-market productive activities of households in 2010. Million euros
Principal functions Women Men Total
Housing 62,123 30,340 92,463
Nutrition 105,056 43,112 148,168
Clothing 36,672 7,996 44,668
Care 50,900 36,133 87,033
Transport 25,098 19,223 44,320
Volunteer work 12,013 8,657 20,670
TOTAL 291,863 145,460 437,323
Value of the labour production (8)
15/23UNECE work session on gender statistics. Geneva, 12-14 March 2012
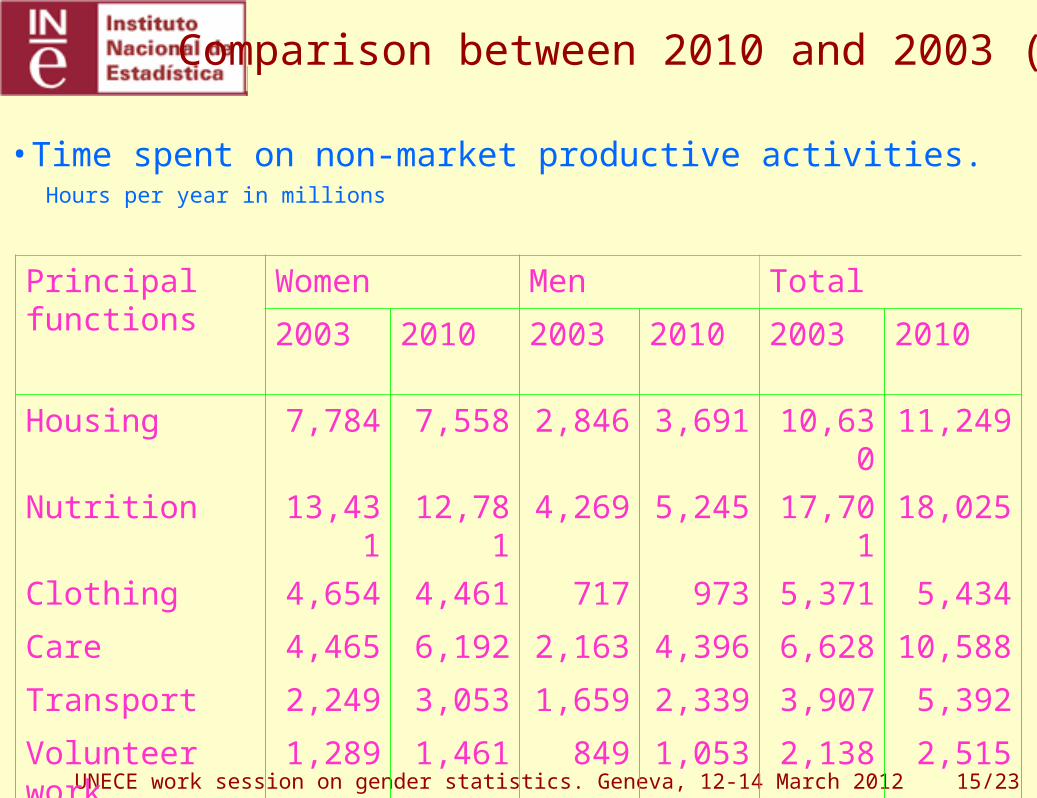
•Time spent on non-market productive activities. Hours per year in millions
Principal functions
Women Men Total
2003 2010 2003 2010 2003 2010
Housing 7,784 7,558 2,846 3,691 10,630
11,249
Nutrition 13,431
12,781
4,269 5,245 17,701
18,025
Clothing 4,654 4,461 717 973 5,371 5,434
Care 4,465 6,192 2,163 4,396 6,628 10,588
Transport 2,249 3,053 1,659 2,339 3,907 5,392
Volunteer work
1,289 1,461 849 1,053 2,138 2,515
TOTAL 33,872
35,506
12,503
17,696
46,375
53,202
Comparison between 2010 and 2003 (1)
16/23UNECE work session on gender statistics. Geneva, 12-14 March 2012
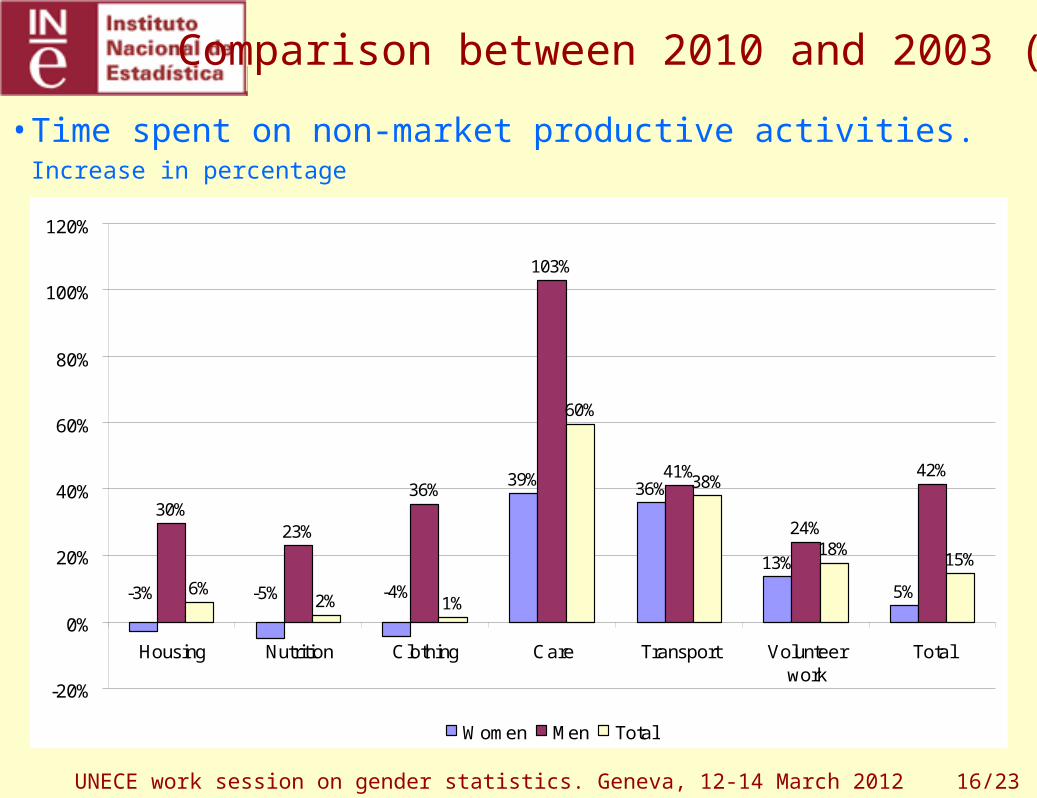
•Time spent on non-market productive activities. Increase in percentage
Comparison between 2010 and 2003 (2)
39% 36%
13%
5%
30%23%
36%
103%
41%
24%
42%
6%2% 1%
60%
38%
18%15%
-3% -5% -4%
-20%
0%
20%
40%
60%
80%
100%
120%
Housing Nutrition Clothing Care Transport Volunteerwork
Total
Women Men Total
17/23UNECE work session on gender statistics. Geneva, 12-14 March 2012
First remarks (1)
• Two-thirds of non-market activities are carried out by women.
• In the last 7 years, the time spent on activities of non-market production of women has grown less than the time spent on these activities by men.
18/23UNECE work session on gender statistics. Geneva, 12-14 March 2012
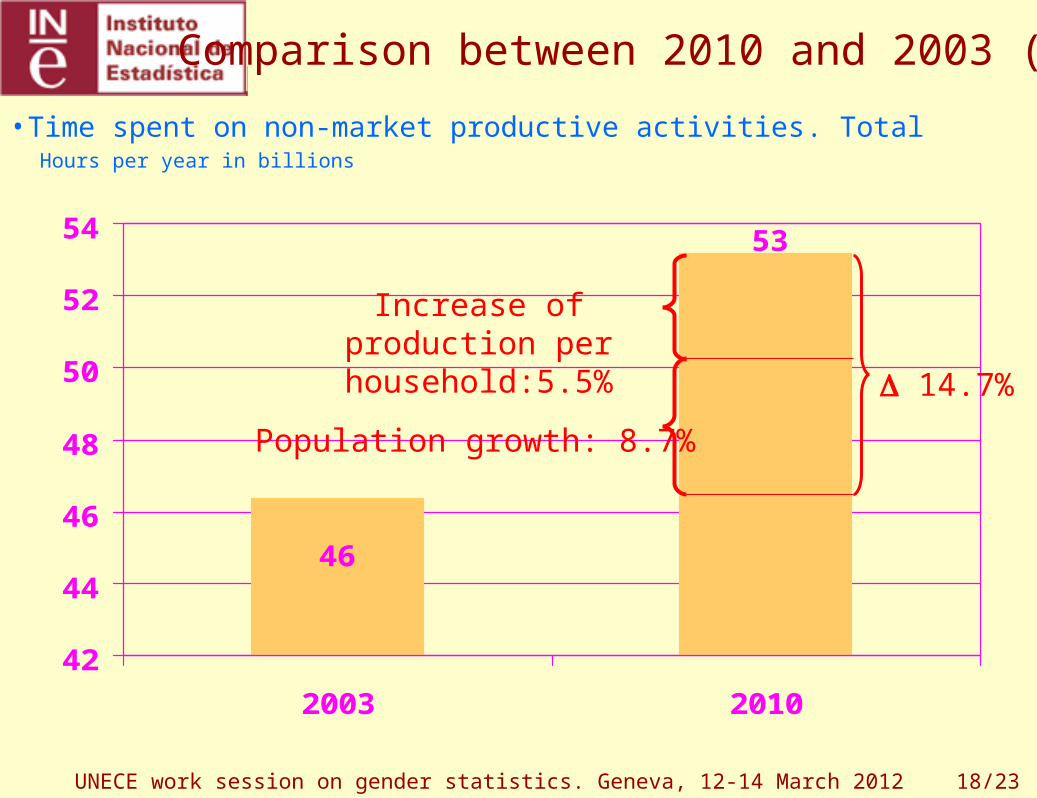
•Time spent on non-market productive activities. Total Hours per year in billions
Comparison between 2010 and 2003 (3)
53
46
42
44
46
48
50
52
54
2003 2010
Population growth: 8.7%
Increase of production per household:5.5%
14.7%
19/23UNECE work session on gender statistics. Geneva, 12-14 March 2012
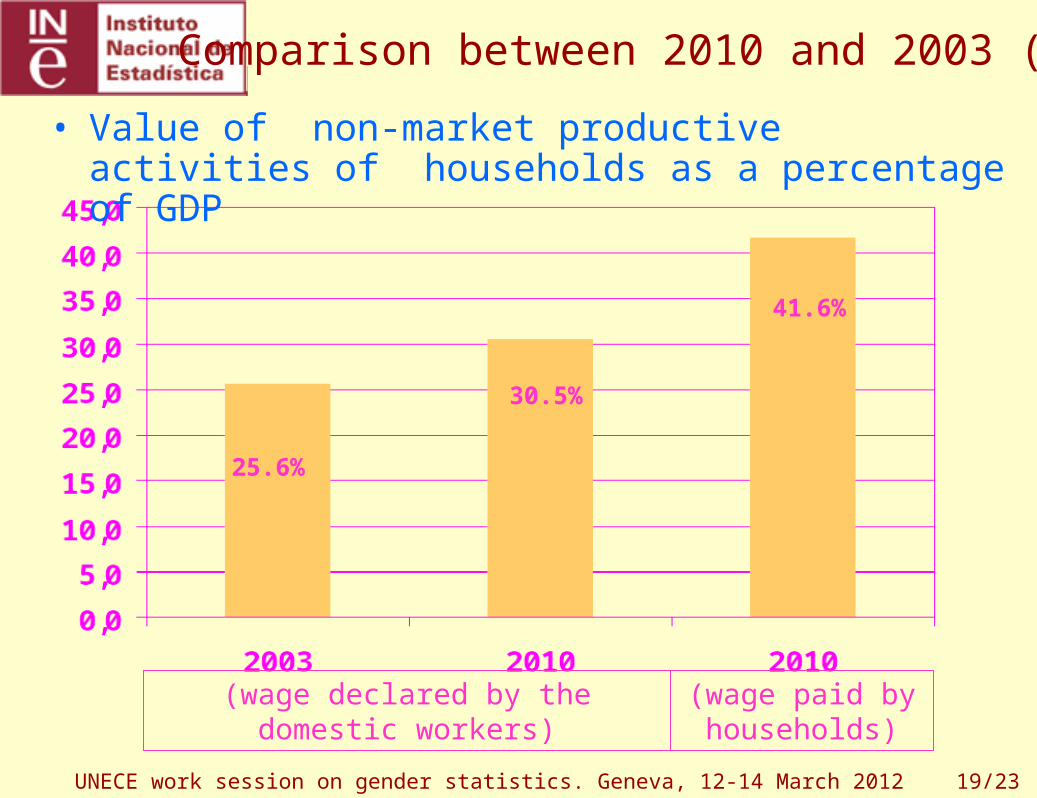
Comparison between 2010 and 2003 (4)
• Value of non-market productive activities of households as a percentage of GDP
(wage declared by the domestic workers)
(wage paid by households)
25.6%
30.5%
41.6%
20/23UNECE work session on gender statistics. Geneva, 12-14 March 2012
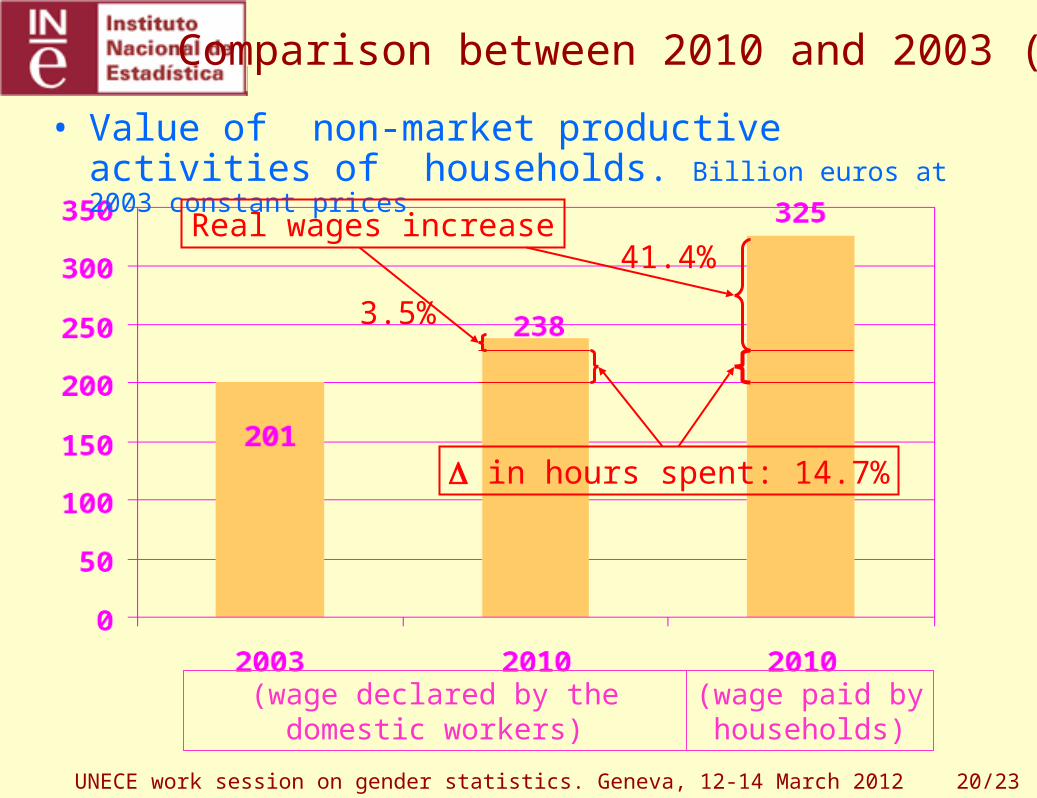
Comparison between 2010 and 2003 (5)
• Value of non-market productive activities of households. Billion euros at 2003 constant prices
(wage declared by the domestic workers)
(wage paid by households)
in hours spent: 14.7%
Real wages increase
3.5%
41.4%
21/23UNECE work session on gender statistics. Geneva, 12-14 March 2012
Concluding remarks (1)
• The wages of domestic workers have only risen in real terms by 3.5%. This is probably due to an oversupply of foreign workers, both before and after the economic crisis. It is more realistic than an increase of 41%.
• However the optimum way to perform this assessment is to use a net wage calculated from the wages reported by the employers, because if we use the net wage declared by the recipients (who tend to declare a lower wage), we obtain an underestimated value of non-market production in 2010, as it occurred in 2003.
• Therefore we have to re-estimate the production of households of 2003.

22/23UNECE work session on gender statistics. Geneva, 12-14 March 2012
Concluding remarks (2)
• It is considered good practice to include in surveys of time use a specific module focused on domestic workers, in order to obtain the necessary information to estimate the satellite accounts of household production: wages paid, extra pay, hours work, etc..
• The time use surveys could become an important tool for the estimation of these accounts, because they not only provide the time spent on these activities, but also wages that might be applied.
23/23UNECE work session on gender statistics. Geneva, 12-14 March 2012
For more information:www.ine.es