120327-dioxin - welcome to ices reports/techniques in marine... · toxic dioxin congener,...
TRANSCRIPT

ICES TECHNIQUES IN MARINE ENVIRONMENTAL SCIENCES
NO. 50
MAY 2012
Determination of polychlorinated dibenzo-p-dioxins, polychlorinated
dibenzofurans, and dioxin-like polychlorinated biphenyls
in biota and sediment
Katrin Vorkamp ● Patrick Roose ● Philippe Bersuder
Lynda Webster ● Peter Lepom ● Catherine Munschy
Rossana Bossi ● Jacek Tronczynski ● Jacob de Boer

International Council for the Exploration of the Sea
Conseil International pour l’Exploration de la Mer
H. C. Andersens Boulevard 44–46
DK‐1553 Copenhagen V
Denmark
Telephone (+45) 33 38 67 00
Telefax (+45) 33 93 42 15
www.ices.dk
Recommended format for purposes of citation:
Vorkamp, K., Roose, P., Bersuder, P., Webster, L., Lepom, P., Munschy, C., Bossi, R.,
Tronczynski, J., and de Boer, J. 2012. Determination of polychlorinated dibenzo‐p‐
dioxins, polychlorinated dibenzofurans, and dioxin‐like polychlorinated biphenyls in
biota and sediment. ICES Techniques in Marine Environmental Sciences No. 50. 23 pp.
Series Editor: Paul D. Keizer
For permission to reproduce material from this publication, please apply directly to
the General Secretary. Correspondence concerning the details of any method or
procedure should be directed to the author(s).
This series presents detailed descriptions of methods and procedures relating to
chemical and biological measurements in the marine environment. Most techniques
described have been selected for documentation based on performance in ICES or
other intercalibration or intercomparison exercises: they have been carefully
evaluated and shown to yield good results when correctly applied. They have also
been subject to review by relevant ICES working groups, but this is not to be
construed as constituting official recommendation by the Council.
ISBN 978‐87‐7482‐109‐0
ISSN 0903‐2606
© 2012 International Council for the Exploration of the Sea
https://doi.org/10.17895/ices.pub.5075

Polychlorinated dibenzo-p-dioxins, dibenzofurans and dioxin-like biphenyls | i
Contents
1 Introduction .................................................................................................................... 2
2 Analytes ........................................................................................................................... 3
3 Sampling and sample handling .................................................................................. 5
3.1 Biota samples ......................................................................................................... 5
3.2 Sediment samples ................................................................................................. 5
3.3 Lipid and organic carbon content ....................................................................... 6
4 Analytical methods ........................................................................................................ 7
4.1 Preparatory steps .................................................................................................. 8
4.2 Extraction ............................................................................................................... 9
4.3 Clean‐up ............................................................................................................... 10
4.4 Concentration ...................................................................................................... 11
5 Instrumental analysis .................................................................................................. 12
5.1 GC analysis .......................................................................................................... 12
5.2 Compound identification .................................................................................. 13
5.3 GC‐HRMS quantification .................................................................................. 13
5.4 GC‐LRMS and GC‐MS/MS ................................................................................ 14
6 Quality assurance and quality control ..................................................................... 16
7 Screening methods based on bioassays ................................................................... 17
8 Safety ............................................................................................................................. 18
9 Data reporting .............................................................................................................. 18
10 References ..................................................................................................................... 19
11 Author contact information ....................................................................................... 23


Polychlorinated dibenzo-p-dioxins, dibenzofurans and dioxin-like biphenyls | 1
Abstract
Polychlorinated dibenzo‐p‐dioxins, polychlorinated dibenzofurans (PCDD/Fs) and
polychlorinated biphenyls (PCBs) are environmental contaminants regulated by the
Stockholm Convention of Persistent Organic Pollutants. Being hydrophobic and
lipophilic, these compounds accumulate in the marine environment in sediments and
lipid‐rich tissue of marine organisms, making these matrices preferred media for
environmental monitoring. This document focuses on the analysis of PCDD/Fs and
dioxin‐like PCBs (i.e. non‐ortho and mono‐ortho PCBs), which have a similar planar
molecular structure to PCDD/Fs and, therefore, exhibit similar toxic effects. Because
concentrations in the environment are low and common analytical methods result in
co‐extractions of a large variety of potentially interfering compounds, analytical
procedures are complex. This document includes comments and advice on sampling
and sample pretreatment steps, suitable extraction and clean‐up procedures as well
as preconcentration methods. It highlights the importance of extract clean‐up and the
risk of contamination. Furthermore, suitable methods for instrumental analysis are
discussed for gas chromatographic separation, compound identification, and
quantification and detection methods. Although high‐resolution mass spectrometry
often is the method of choice, low‐resolution mass spectrometry can also provide
sufficiently sensitive analyses, in particular for screening purposes. In this context,
bioassays can also play a role, reflecting a cumulative toxicity rather than
concentrations of individual congeners. The paper also discusses general aspects of
good laboratory practice, quality assurance/quality control, and laboratory safety.
2 | ICES Techniques in Marine Environmental Sciences No. 50
1 Introduction
Polychlorinated dibenzo‐p‐dioxins and polychlorinated dibenzofurans
[dioxins/furans (PCDD/Fs)] are ubiquitous in the environment, primarily as
unintentional byproducts of combustion and industrial processes. Because they are
strongly hydrophobic compounds, sediments are the eventual sink in the aquatic
environment, providing a source of potential exposure to aquatic organisms (Hurst et
al., 2004). Generally highly resistant to metabolism, PCDD/Fs bioaccumulate and
biomagnify and have reached relatively high concentrations in e.g. fish from the
Baltic Sea, which resulted in recommendations to restrict the use of those fish for
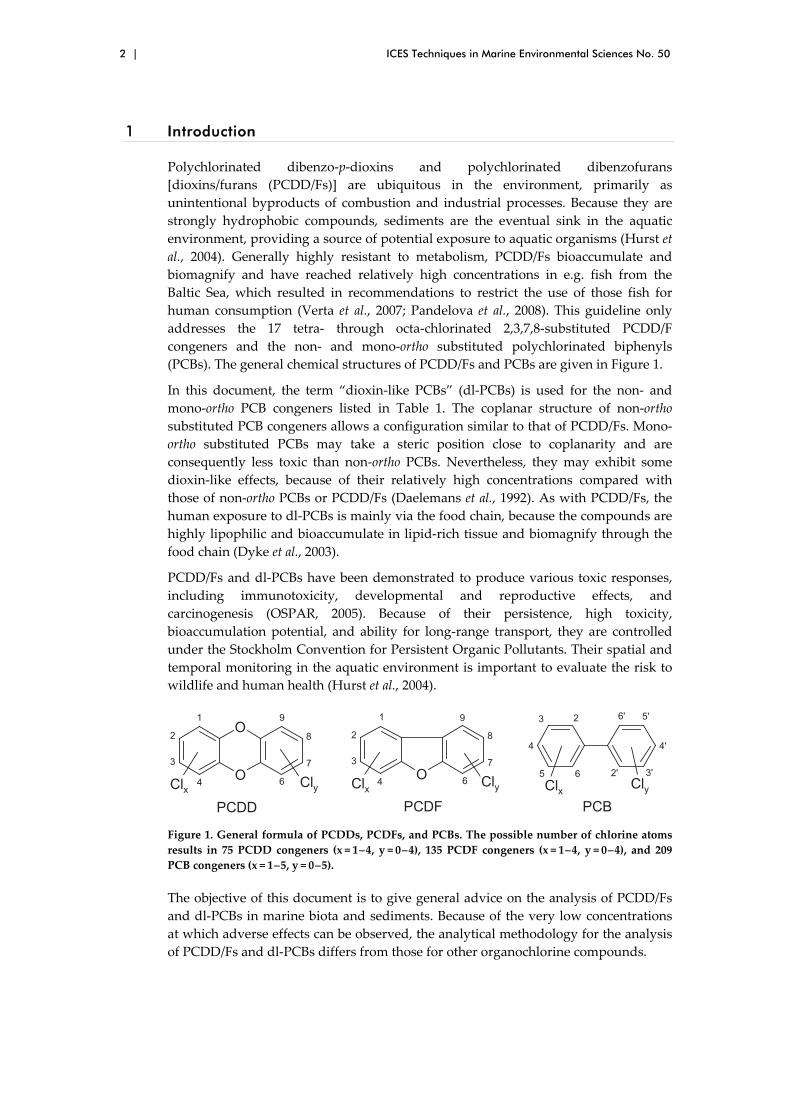
human consumption (Verta et al., 2007; Pandelova et al., 2008). This guideline only
addresses the 17 tetra‐ through octa‐chlorinated 2,3,7,8‐substituted PCDD/F
congeners and the non‐ and mono‐ortho substituted polychlorinated biphenyls
(PCBs). The general chemical structures of PCDD/Fs and PCBs are given in Figure 1.
In this document, the term “dioxin‐like PCBs” (dl‐PCBs) is used for the non‐ and
mono‐ortho PCB congeners listed in Table 1. The coplanar structure of non‐ortho
substituted PCB congeners allows a configuration similar to that of PCDD/Fs. Mono‐
ortho substituted PCBs may take a steric position close to coplanarity and are
consequently less toxic than non‐ortho PCBs. Nevertheless, they may exhibit some
dioxin‐like effects, because of their relatively high concentrations compared with
those of non‐ortho PCBs or PCDD/Fs (Daelemans et al., 1992). As with PCDD/Fs, the
human exposure to dl‐PCBs is mainly via the food chain, because the compounds are
highly lipophilic and bioaccumulate in lipid‐rich tissue and biomagnify through the
food chain (Dyke et al., 2003).
PCDD/Fs and dl‐PCBs have been demonstrated to produce various toxic responses,
including immunotoxicity, developmental and reproductive effects, and
carcinogenesis (OSPAR, 2005). Because of their persistence, high toxicity,
bioaccumulation potential, and ability for long‐range transport, they are controlled
under the Stockholm Convention for Persistent Organic Pollutants. Their spatial and
temporal monitoring in the aquatic environment is important to evaluate the risk to
wildlife and human health (Hurst et al., 2004).
Figure 1. General formula of PCDDs, PCDFs, and PCBs. The possible number of chlorine atoms
results in 75 PCDD congeners (x = 1 – 4, y = 0 – 4), 135 PCDF congeners (x = 1 – 4, y = 0 – 4), and 209
PCB congeners (x = 1 – 5, y = 0 – 5).
The objective of this document is to give general advice on the analysis of PCDD/Fs
and dl‐PCBs in marine biota and sediments. Because of the very low concentrations
at which adverse effects can be observed, the analytical methodology for the analysis
of PCDD/Fs and dl‐PCBs differs from those for other organochlorine compounds.

Polychlorinated dibenzo-p-dioxins, dibenzofurans and dioxin-like biphenyls | 3
2 Analytes
Table 1 provides a list of the 17 tetra‐ through octa‐chlorinated 2,3,7,8‐substituted
PCDD/Fs and the dl‐PCBs congeners that are of highest environmental relevance and
typically included in environmental monitoring. In this context, results should be
reported as concentrations of individual PCDD/Fs and dl‐PCB congeners in biota and
sediment, i.e. in units of mass/mass, with relevant additional information on e.g. dry
matter content of the sample (see Section 9 “Data reporting”).
In the context of food and feed analysis and compliance checks with maximum
residue limits, the concept of TCDD (2,3,7,8‐tetrachlorodibenzo‐p‐dioxin) toxicity
equivalency factors (TEFs) is commonly used, to account for the combined toxicity of
mixtures of PCDD/Fs and other compounds with dioxin‐like activity usually present
in these samples. Each congener has been assigned a TEF relative to that of the most
toxic dioxin congener, 2,3,7,8‐TCDD, which was given a TEF of 1.0. The
concentrations of the individual congeners are multiplied with their respective TEFs,
and the sum of this gives the total concentration of dioxin‐like compounds, expressed
in TCDD equivalents (TEQs). Thus, concentrations of mixtures can be expressed
through their dioxin‐like activity in TEQs, relative to the most potent 2,3,7,8‐TCDD.
The most commonly used TEF system is that of the World Health Organization
(WHO‐TEF/TEQ). It is reviewed regularly, and Table 1 presents the most recent
values (Van den Berg et al., 2006).
According to OSPAR (2005), the scientific relevance of using TEQs to express results
is greater for human exposure than for evaluation of pollution sources and emissions,
for which information on congener patterns can be of more importance. For sediment
samples in particular, the use of TEQs is of limited relevance (Van den Berg et al.,
2006). If appropriate, the TEF concept can be applied in a risk assessment of
environmental concentrations. In this context, it will be important to state how
concentrations below limits of quantification (LoQ) have been handled. To maximize
information, results expressed as TEQ values should be reported as both upper
bound and lower bound values (i.e. non‐quantifiable concentrations have been
replaced by LoQ and zero, respectively).

4 | ICES Techniques in Marine Environmental Sciences No. 50
Table 1. Polychlorinated dibenzo‐p‐dioxins (PCDDs), polychlorinated dibenzofurans (PCDFs),
and dl‐PCBs with their toxicity equivalency factors (TEFs) according to the systems developed by
the World Health Organization (WHO2005‐TEF; Van den Berg et al., 2006) and NATO/CCMS (I‐
TEF).
Homologue group Congener WHO2005-TEF I-TEF IUPAC no.
PCDDs
Tetra-CDD 2,3,7,8 1.0 1.0
Penta-CDD 1,2,3,7,8 1.0 0.5
Hexa-CDD 1,2,3,4,7,8 0.1 0.1
1,2,3,6,7,8 0.1 0.1
1,2,3,7,8,9 0.1 0.1
Hepta-CDD 1,2,3,4,6,7,8 0.01 0.01
Octa-CDD 1,2,3,4,6,7,8,9 0.0003 0.001
PCDFs
Tetra-CDF 2,3,7,8 0.1 0.1
Penta-CDF 1,2,3,7,8 0.03 0.05
2,3,4,7,8 0.3 0.5
Hexa-CDF 1,2,3,4,7,8 0.1 0.1
1,2,3,6,7,8 0.1 0.1
1,2,3,7,8,9 0.1 0.1
2,3,4,6,7,8 0.1 0.1
Hepta-CDF 1,2,3,4,6,7,8 0.01 0.01
1,2,3,4,7,8,9 0.01 0.01
Octa-CDF 1,2,3,4,6,7,8,9 0.0003 0.001
Non-ortho PCBs
Tetra-CB 3,3',4,4' 0.0001 77
3,4,4’,5 0.0003 81
Penta-CB 3,3',4,4',5 0.1 126
Hexa-CB 3,3',4,4',5,5' 0.03 169
Mono-ortho PCBs
Penta-CB 2,3,3',4,4' 0.00003 105
2,3,4,4',5 0.00003 114
2,3',4,4',5 0.00003 118
2',3,4,4',5 0.00003 123
Hexa-CB 2,3,3’,4,4’,5 0.00003 156
2,3,3',4,4',5 0.00003 157
2,3',4,4',5,5' 0.00003 167
Hepta-CB 2,3,3',4,4',5,5' 0.00003 189

Polychlorinated dibenzo-p-dioxins, dibenzofurans and dioxin-like biphenyls | 5
3 Sampling and sample handling
OSPAR (2005) presented a monitoring strategy for PCDD/Fs, which identified biota
and sediment as important matrices for environmental monitoring, as a consequence
of their accumulation. Generally, the same recommendations are valid as described
for other organochlorine compounds (OSPAR, 2010a, 2010b). Details on sample
handling and preparation as described for the chemical analysis of polybrominated
diphenyl ethers (PBDEs) will also be valid for PCDD/Fs and dl‐PCBs (Webster et al.,
2009). However, particular attention should be paid to the risk of sample
contamination, given the lower concentrations of PCDD/Fs and dl‐PCBs in most
environmental samples.
3.1 Biota samples
Aquatic organisms can accumulate hydrophobic compounds like PCDD/Fs and dl‐
PCBs and reach concentrations considerably above those of the surrounding waters.
The ratio between the concentration in biota and in the water is the bioconcentration
factor (BCF), which is between 2000 and 9000 for PCDD/Fs (OSPAR, 2005). Because
the BCF varies with species and compound, it is important to design a biota‐sampling
programme that minimizes confounding factors, i.e. to choose the same species of the
same age and the same time of year for sampling.
The species selected for monitoring of biota should fulfil the following requirements.
Reflect concentration changes in the sampling area, i.e. ensure a link
between exposure and concentration in the organisms;
Accumulate compounds without being severely affected;
Be representative of and abundant in the area (to ensure sufficient sample
material for analysis);
Be relatively easy to handle.
Analogous to the monitoring of other organohalogen compounds, mussels and fish
are suitable and commonly used for monitoring of PCDD/Fs and dl‐PCBs (OSPAR,
2005). The highest PCDD/F fresh‐weight concentrations are found in muscle tissue of
fatty fish, such as herring and salmon or in fatty liver of some fish, such as cod or
haddock. National food agencies often analyse PCDD/Fs and dl‐PCBs in commercial
fish and fish products, to monitor compliance with EU limit values. Although
different approaches will be necessary in environmental analyses, OSPAR (2005) also
recommends the monitoring of fish and shellfish as part of the environmental
monitoring strategy for dioxins.
Mussel samples must not be frozen prior to dissection, but should be transported at
temperatures between 5 and 15 °C, similar to those of the area of origin, in a clean
container. It is important to remove any sediment particles from their intestinal
system, by depuration in a glass aquarium with filtered water, preferably from the
sampling location, for approximately 24 h. After dissection, all samples should be
stored in the dark at <– 20 °C prior to analysis. Under these conditions, long‐term
storage of tissue samples is possible (de Boer and Smedes, 1997).
3.2 Sediment samples
The sampling strategy for sediments depends on the purpose of the monitoring
programme and the natural conditions of the region to be monitored and includes

6 | ICES Techniques in Marine Environmental Sciences No. 50
fixed‐station sampling, stratified random sampling, stratified fixed sampling, or
sediment cores. PCDD/Fs and dl‐PCBs accumulate in the organic carbon fraction of
the sediment. Therefore, sediments containing a large proportion of fine material are
preferable for organic contaminant monitoring. Sediment samples consisting of
coarse sandy material may require sieving (OSPAR, 2010b). Because sediments may
often display a rather heterogeneous distribution of contaminants and organic carbon
content, pooling of a number of subsamples from a specific area per sampling
location is recommended.
3.3 Lipid and organic carbon content
The lipid content of biota samples should be determined to allow normalization of
PCDD/F concentrations to lipids. Suitable methods have been described for the
chemical analysis of PBDEs (Webster et al., 2009) and include the methods by Bligh
and Dyer (1959; modified by Hanson and Olley (1963)) and Smedes (1999).
Extractable lipid determinations may be used as well, particularly for small sample
sizes and high lipid contents. For both biota and sediment samples, dry weight
should also be determined for normalization purposes, for instance by drying at
105 °C until constant weight.
Total organic carbon (TOC) should be determined for characterization of sediments
and for use as a possible normalization parameter (Schumacher, 2002; Leach et al.,
2008).
Polychlorinated dibenzo-p-dioxins, dibenzofurans and dioxin-like biphenyls | 7
4 Analytical methods
Prior to systematic monitoring, an initial screening for PCDD/Fs and dl‐PCBs may be
undertaken in the area under consideration. Several methods are available for
screening purposes. In particular, bioassays and fast semi‐quantitative screening
methods, based on gas chromatography (GC)–mass spectrometry (MS), can give an
indication of the extent of the contamination (Schrock et al., 2009).
For a full quantitative analysis of individual congeners, state‐of‐the‐art GC with high‐
resolution MS (HRMS) is the preferred analytical method. Comprehensive
multidimensional gas chromatography (GCxGC) could be an alternative for PCDD/F
and dl‐PCB analysis, even in combination with electron capture detection (ECD),
because this will offer enough sensitivity and the selectivity will exceed that of single‐
column GC analysis, if a proper orthogonal combination of columns is selected
(Haglund et al., 2008). GCxGC can also be used in combination with low‐resolution
(LR) MS or time‐of‐flight (ToF)‐MS (Skoczynska et al., 2008). Modern GC tandem
mass spectrometry (GC‐MS‐MS) systems based on ion traps and triple stage
quadrupoles also provide the necessary selectivity and sensitivity (Malavia et al.,
2008; Onwudili et al., 2011).
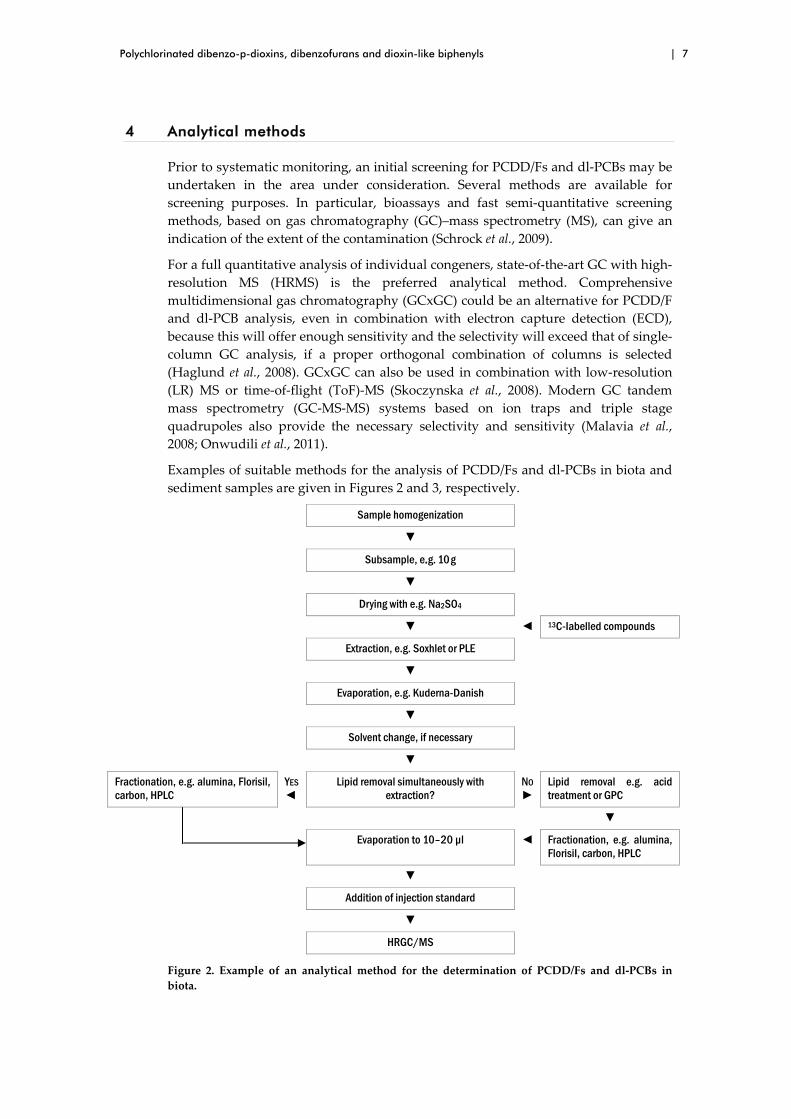
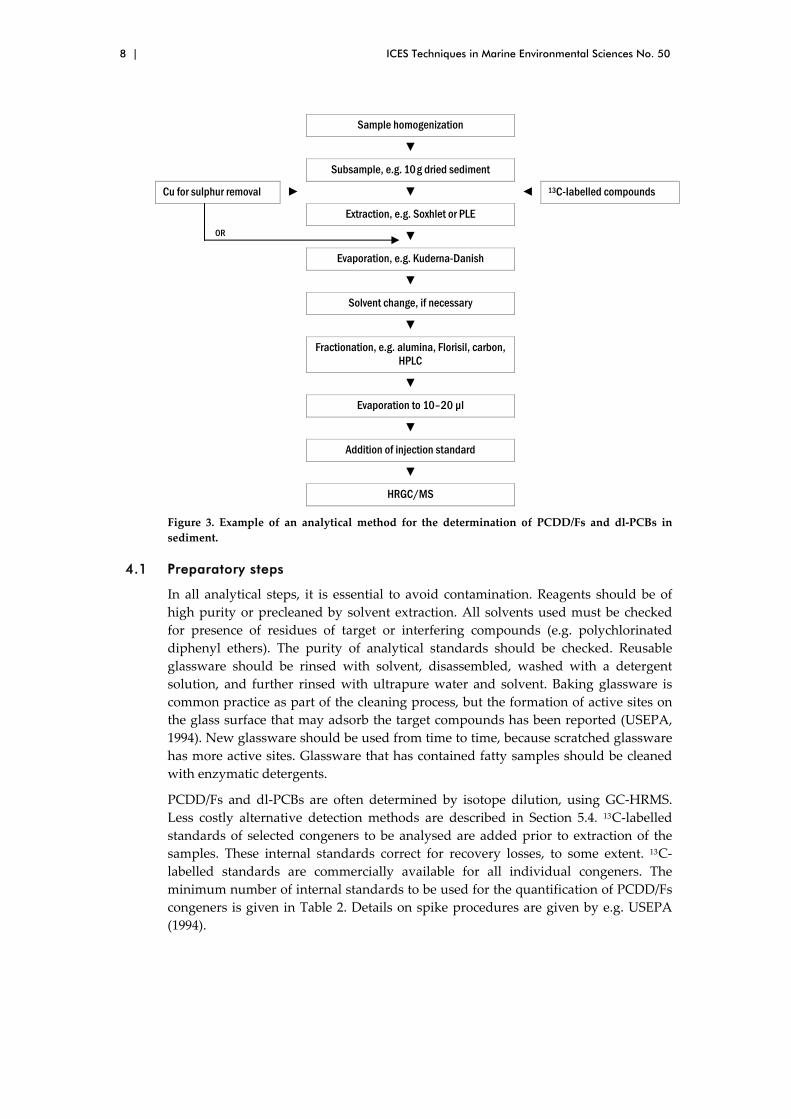
Examples of suitable methods for the analysis of PCDD/Fs and dl‐PCBs in biota and
sediment samples are given in Figures 2 and 3, respectively.
Sample homogenization
▼
Subsample, e.g. 10 g
▼
Drying with e.g. Na2SO4
▼ ◄ 13C-Iabelled compounds
Extraction, e.g. Soxhlet or PLE
▼
Evaporation, e.g. Kuderna-Danish
▼
Solvent change, if necessary
▼
Fractionation, e.g. alumina, Florisil, carbon, HPLC
YES ◄
Lipid removal simultaneously with extraction?
NO ►
Lipid removal e.g. acid treatment or GPC
▼
Evaporation to 10–20 µl ◄ Fractionation, e.g. alumina, Florisil, carbon, HPLC
▼
Addition of injection standard
▼
HRGC/MS
Figure 2. Example of an analytical method for the determination of PCDD/Fs and dl‐PCBs in
biota.
8 | ICES Techniques in Marine Environmental Sciences No. 50
Sample homogenization
▼
Subsample, e.g. 10 g dried sediment
Cu for sulphur removal ► ▼ ◄ 13C-Iabelled compounds
Extraction, e.g. Soxhlet or PLE
OR ▼
Evaporation, e.g. Kuderna-Danish
▼
Solvent change, if necessary
▼
Fractionation, e.g. alumina, Florisil, carbon, HPLC
▼
Evaporation to 10–20 µl
▼
Addition of injection standard
▼
HRGC/MS
Figure 3. Example of an analytical method for the determination of PCDD/Fs and dl‐PCBs in
sediment.
4.1 Preparatory steps
In all analytical steps, it is essential to avoid contamination. Reagents should be of
high purity or precleaned by solvent extraction. All solvents used must be checked
for presence of residues of target or interfering compounds (e.g. polychlorinated
diphenyl ethers). The purity of analytical standards should be checked. Reusable
glassware should be rinsed with solvent, disassembled, washed with a detergent
solution, and further rinsed with ultrapure water and solvent. Baking glassware is
common practice as part of the cleaning process, but the formation of active sites on
the glass surface that may adsorb the target compounds has been reported (USEPA,
1994). New glassware should be used from time to time, because scratched glassware
has more active sites. Glassware that has contained fatty samples should be cleaned
with enzymatic detergents.
PCDD/Fs and dl‐PCBs are often determined by isotope dilution, using GC‐HRMS.
Less costly alternative detection methods are described in Section 5.4. 13 C‐labelled
standards of selected congeners to be analysed are added prior to extraction of the
samples. These internal standards correct for recovery losses, to some extent. 13 C‐
labelled standards are commercially available for all individual congeners. The
minimum number of internal standards to be used for the quantification of PCDD/Fs
congeners is given in Table 2. Details on spike procedures are given by e.g. USEPA
(1994).

Polychlorinated dibenzo-p-dioxins, dibenzofurans and dioxin-like biphenyls | 9
Table 2. Native and minimum number of isotopically labelled PCDD/Fs to be used for
calibration.
Substance PCDD-Homologues PCDF-Homologues
Native 13C12-labelled Native 13C12-labelled
Tetra-CDD/F 2,3,7,8 2,3,7,8 2,3,7,8 2,3,7,8
Penta-CDD/F 1,2,3,7,8 1,2,3,7,8 1,2,3,7,8 2,3,4,7,8
1,2,3,7,8 2,3,4,7,8
Hexa-CDD/F
1,2,3,4,7,8 1,2,3,6,7,8 1,2,3,7,8,9
1,2,3,6,7,8
1,2,3,4,7,8 1,2,3,6,7,8 1,2,3,7,8,9 2,3,4,6,7,8
2,3,4,6,7,8
Hepta-CDD/F 1,2,3,4,6,7,8 1,2,3,4,6,7,8 1,2,3,4,6,7,8 1,2,3,4,7,8,9
1,2,3,4,6,7,8
Octa-CDD/F 1,2,3,4,6,7,8,9 1,2,3,4,6,7,8,9 1,2,3,4,6,7,8,9 1,2,3,4,6,7,8,9
4.2 Extraction
The sample intake used for the extraction must be sufficient to fulfil the requirements
with respect to sensitivity. For instance, 10 g of dried sediment is typically used to
measure accurately PCDD/Fs and dl‐PCBs by GC‐HRMS (USEPA, 1994). For biota,
even higher sample amounts (up to 50 g) may be required. The samples are typically
dried, for instance using sodium sulphate, and, as described above, spiked with the 13 C‐labelled standards. Wet sediment samples have also been extracted using toluene
in a Soxhlet‐Dean‐Stark system (Lamparski and Nestrick, 1989; Kjeller and Rappe,
1998).
For extraction of solid samples, Soxhlet is widely accepted as a robust liquid – solid
extraction technique. Immediately prior to use, the Soxhlet apparatus should be pre‐
cleaned with e.g. dichloromethane : hexane (1 : 1 v/v) for approximately 3 h (USEPA,
1994). The sample should be rehomogenized prior to transfer to a glass Soxhlet
thimble. Soxhlet extraction of biota samples proceeds for 18 – 24 h using, e.g.
dichloromethane:hexane (1 : 1 v/v; USEPA, 1994; Liu et al., 2006). The USEPA method
1613B recommends to Soxhlet extract sediment samples with toluene for 16 – 24 h
(USEPA, 1994). Other typical solvents for Soxhlet extraction in the literature are
dichloromethane (Koh et al., 2004) and toluene : acetone (4 : 1 v/v; Stern et al., 2005),
applicable to both biota and sediment samples. To remove sulphur compounds from
sediment samples, copper granules can be either mixed with sediment during
extraction or added to the extract. Sulphur can also be removed by gel permeation
chromatography, see Section 4.3.
More recently, pressurized liquid extraction (PLE) has become a common and faster
alternative to Soxhlet extraction (Focant et al., 2004; Antunes et al., 2008; Kishida et al.,
2010). PLE uses organic solvents at temperatures above their boiling point
maintained in the liquid phase under high pressure. The extraction cell, which
contains the sample, is filled with an appropriate solvent (e.g. toluene,
dichloromethane) and heated (e.g. 100 – 150 °C) up to a pressure of 140 bars. Several
extraction cycles are recommended (n = 2 – 3).
To reduce analysis time further, PLE can be combined with inline clean‐up
procedures. For biota samples, sulphuric acid impregnated silica has been used as a
fat retainer (Björklund et al., 2006). Proper fat – fat retainer ratios are important to
avoid fat remaining in the sample extract, and the solvent should be selected
accordingly. Sulphur removal from sediments can also be achieved as part of the
inline clean‐up (Chuang et al., 2009).

10 | ICES Techniques in Marine Environmental Sciences No. 50
4.3 Clean-up
The extracts are concentrated using suitable evaporation devices, e.g. rotary
evaporation, Turbovap, Syncore, or Kuderna‐Danish. The risk of cross‐contamination
is fairly high for rotary evaporation, therefore the evaporator should be precleaned,
e.g. by 100 ml of clean solvent.
Because of the very low levels of PCDD/Fs in environmental samples, the elimination
of interferences is essential, both with regard to matrix effects and coeluting
compounds. Often, a sequence of clean‐up steps will be required. The European
research project DIFFERENCE recommended at least three clean‐up or fractionation
steps to ensure that sufficiently clean extracts are obtained (Van Loco et al., 2004).
These steps should ensure the removal of bulk co‐extracted material, such as lipids
and other natural organic matter, the removal of polar interferences and the
fractionation of the analytes according to planarity.
Concentrated sulphuric acid is commonly applied for bulk matrix removal (including
lipids), either in combination with a column chromatography clean‐up or by direct
addition of silica impregnated with sulphuric acid to the extracts. The column
chromatography clean‐up suggested by USEPA (1994) for lipid removal in biota
extracts includes silica gel, potassium silicate, anhydrous Na2SO4, and silica gel
(impregnated with sulphuric acid). The column is eluted with hexane. Ready‐to‐use,
multilayer clean‐up columns are also available commercially. Alternatively,
approximately 30 – 100 g of sulphuric acid impregnated silica gel can be added to the
extract, while stirring for 2 – 3 h. The treatment with sulphuric acid impregnated silica
requires strict safety procedures, because the small particles can cause serious health
damage after inhalation. Gel permeation chromatography (GPC) has also been
applied for lipid removal, but often a series of GPC columns is needed to ensure a
100 % fat removal. Alternatively, an additional clean‐up step using concentrated
sulphuric acid might be applied after GPC to remove residual lipids from samples
with high lipid contents.
Open column adsorption chromatographic techniques (preferably with Florisil or
alumina columns) are frequently used for removal of polar compounds, followed by
planarity fractionation using e.g. carbon columns, resulting in clean dl‐PCB and/or
PCDD/Fs fractions for HRGC‐MS analysis. The most common solvents used in this
step are hexane and/or dichloromethane and toluene. If the extracts are to be cleaned
by adsorption chromatography, on e.g. silica gel, a solvent change to a non‐polar
solvent is essential.
High‐performance liquid chromatography (HPLC) can also be used for planarity
fractionation of the extracts, using two columns in series. Nitrophenylpropylsilica
(Nucleosil, 5 μm particles, 250 × 4.6 mm) and 2‐(1‐pyrenyl)ethyldimethylsilylated
silica (PYE; Cosmosil, 5 μm particles, 150 × 4.6 mm) columns allow the separation
according to the number of aromatic rings and planarity, i.e. non‐ortho and mono‐
ortho PCBs can be separated from each other, as well as from PCDD/Fs (Bandh et al.,
1996). Coupled with a fraction collector, the use of an HPLC system allows the
automatic clean‐up of a considerable number of samples. Alternatively, HPLC
systems equipped with porous graphitized carbon can be used. Column dimensions
are e.g. 50 × 4.7 mm, and care has to be taken that the column is not overloaded.
Similar to PYE columns, they will separate non‐ortho PCBs from other PCBs and from
PCDD/Fs. Fully automated cleanup systems are also available commercially (e.g.
PowerPrep system).

Polychlorinated dibenzo-p-dioxins, dibenzofurans and dioxin-like biphenyls | 11
4.4 Concentration
After clean‐up, a solvent of low volatility (e.g. an n‐alkane in the nonane to
tetradecane range) should be added as keeper, which will allow the evaporation of
the extracts to near dryness, i.e. 10 – 20 μl. An injection standard should be added just
before injection to evaluate the recovery of labelled internal standards. For example, 13 C12‐1,2,3,4‐TCDD can be used for recovery determinations of TCDD/Fs and
PeCDD/Fs internal standards, whereas 13 C12‐1,2,3,7,8,9‐HxCDD can be used for
recovery determinations of HxCDD/Fs, HpCDD/Fs, and OCDD/F internal standards.
Additional 13 C12‐non‐2,3,7,8‐PCDD/Fs injection standards will be suitable as well.

12 | ICES Techniques in Marine Environmental Sciences No. 50
5 Instrumental analysis
PCDD/F concentrations of environmental samples are commonly monitored using
HRGC/HRMS, but low resolution mass spectrometry (LRMS) may be a suitable
alternative if the required minimum performance criteria are met.
5.1 GC analysis
GC analysis should be optimized with regard to separation and sensitivity. Gas
chromatographic separation of isomers must be sufficient (< 25 % peak‐to‐peak
between 1,2,3,4,7,8‐HxCDF and 1,2,3,6,7,8‐HxCDF). Fishman et al. (2007, 2011)
provided a comprehensive review of GC columns available for dioxin analysis.
Generally 50 – 60 m, 5 % diphenyl 95 % dimethylpolysiloxane columns are a common
choice. However, these columns could exhibit multiple coelutions for both PCBs and
PCDD/Fs (Reiner et al., 2006), depending on the matrix to be analysed. For complete
separation of all seventeen 2,3,7,8‐PCDD/Fs, DB‐5 type columns have been combined
with more polar cyanopropyl columns (Fishman et al., 2011).
The use of an RTx‐Dioxin 2 column has been reported as a suitable alternative to DB‐
5 columns. Combining this phase with reduced inner diameter and film thickness (for
example, a 40 m × 0.18 mm × 0.18 μm) allowed the analysis of the seventeen PCDD/F
congeners in 40 min, fulfilling QA/QC requirements and providing sufficient
selectivity, especially for 2,3,7,8‐TCDD and 2,3,7,8‐TCDF (Robinson et al., 2004; Reiner
et al., 2006; Cochran et al., 2007a, 2007b). However, Cochran et al. (2007a, 2007b)
reported on coelutions on this column, the most significant one being that of 1,2,3,6,7‐
and 1,2,3,7,8‐PeCDDs. Promising results with few coelutions have been obtained for
Si‐Arylene GC stationary phases (Fishman et al., 2011).
Potential interferences for dl‐PCBs on a commonly used GC‐column are summarized
in Table 3 (Reiner et al., 2006). Complete separation can be achieved by multiple
analyses on columns of different polarity, but has also been demonstrated for
relevant PCB congeners on one column, e.g. on an SGE HT8‐PCB capillary column
(Larsen et al., 1995). A full separation of all PCB congeners is also possible using
GCxGC (Haglund et al., 2008; Skoczynska et al., 2008).
Table 3. Possible interferences for selected dl‐PCBs using a 5 % phenyl column (Reiner et al.,
2006).
PCB congener Potential interference
CB–81 CB–87
CB–77 CB–110
CB–123 CB–149
CB–126 CB–178 and CB–129
CB–156 CB–171
CB–157 CB–201
Various injection techniques are possible, e.g. on‐column injection, splitless injection,
pressure‐pulsed splitless injection, and programmed temperature vaporizing (PTV)
injection. The most suitable injection volume depends on the analyte concentrations
in the sample and the sensitivity of the instrumental analysis. In HRGC/HRMS
analysis, 1 – 2 μl are common injection volumes. With PTV, injection volumes of up to
50 μl can be achieved. This may significantly lower detection limits, which is
particularly helpful for LRMS techniques. Helium is usually used as carrier gas. The
Polychlorinated dibenzo-p-dioxins, dibenzofurans and dioxin-like biphenyls | 13
initial oven temperature is linked to the keeper solvent and the injection technique
and should ensure that no peak discrimination occurs.
5.2 Compound identification
The individual PCDD/Fs, dl‐PCBs, or labelled compounds are identified by
comparing the GC retention time and ion abundance ratio of two exact masses
monitored (Tables 4 and 5) with the corresponding retention time of an authentic
labelled internal standard and the theoretical or acquired ion abundance ratio of the
two exact masses. The congeners for which there are no labelled analogues are
identified when relative retention time and ion abundance ratios agree within
predefined limits. The following criteria should be met for identification of an
individual dl‐PCB, PCDD/F, or labelled compound in a standard, blank, or sample:
The signal for the two exact masses specified in Tables 4 and 5 should be
present and within 2 s.
The signal‐to‐noise ratio (S/N) for the GC peak at each exact mass has to be
at least 3 for each congener detected in a sample extract and at least 10 for
all congeners in the calibration standard.
The ratio of the integrated areas of the two exact masses specified in Tables
4 and 5 has to be within 15 % of the theoretical value displayed in Table 6.
The relative retention time of a native PCDD/F and dl‐PCB has to be within
a time window of 0.003, based on the retention time of the corresponding 13 C12‐labelled standard. The relative retention time of congeners for which
there are no labelled analogues has to be within 0.002.
If interferences preclude identification, a new aliquot should be extracted, cleaned up
further, and analysed again. If interferences cannot be removed, the data should be
flagged to indicate that results are maximum concentrations.
5.3 GC-HRMS quantification
The HRMS system should be operated at a minimum resolution of 10 000 throughout
all runs, and resolution should be checked regularly during the sequence of runs.
Quantitative analysis is performed using selected ion monitoring (SIM), in one of the
following ways:
For the PCDD/Fs and dl‐PCBs for which labelled analogues have been
added to the sample, the GC/MS system is calibrated, and the
concentration of each compound is determined using the isotope dilution
technique.
For the PCDD/Fs and dl‐PCBs for which labelled analogues are not added
to the sample (Table 2), the GC/MS system is calibrated for each compound
using a labelled isomer with the most similar structure, and the
concentration of each compound is determined using the internal standard
technique.
Calibration curves should be based on a minimum of five calibration points. Mass
drift correction is mandatory, usually based on a lock‐mass m/z of perfluorokerosene
(PFK) or perfluorotributylamine (PFTBA, FC43).

14 | ICES Techniques in Marine Environmental Sciences No. 50
Table 4. Masses for the detection and quantification of PCDD/Fs.
Substance
Dibenzofurans Dibenzo-p-dioxins
Native 13C12-labelled Native 13C12-labelled
Tetra-CDD/F 303.9016 315.9419 319.8965 331.9368
305.8987 317.9389 321.8937 333.9339
Penta-CDD/F 339.8598 351.9000 355.8547 367.8949
341.8569 353.8970 357.8518 369.8919
Hexa-CDD/F 373.8208 385.8610 389.8157 401.8559
375.8179 387.8580 391.8128 403.8529
Hepta-CDD/F 407.7818 419.8220 423.7767 435.8169
409.7789 421.8190 425.7738 437.8140
Octa-CDD/F 441.7428 453.7830 457.7377 469.7779
443.7399 455.7801 459.7348 471.7750
Table 5. Masses for the detection and quantification of PCBs.
Homologue group Native CBs 13C12-labeled CBs
Tetra-CB 289.9223 301.9626
291.9194 303.9597
Penta-CB 325.8804 337.9207
327.8775 339.9177
Hexa-CB 359.8415 371.8817
361.8385 373.8788
Hepta-CB 393.8025 405.8427
395.7995 407.8398
Table 6. Tolerance limits of isotope ratios for PCDD/Fs and dl‐PCBs.
Chlorine atoms Isotope Ratio Lower Limit Isotope Ratio Theoretical Value Isotope Ratio Upper Limit
4 0.65 0.77 (M/M + 2) 0.89
5 0.55 0.64 (M + 4/M + 2) 0.75
6 0.69 0.81 (M + 4/M + 2) 0.94
7 0.83 0.96 (M + 4/M + 2) 1.10
8 0.76 0.89 (M + 2/M + 4) 1.02
5.4 GC-LRMS and GC-MS/MS
LRMS has also been applied to the analysis of PCDD/Fs and/or dl‐PCBs. Limits of
detection are higher than those obtained with HRMS detectors, but can be
compensated by e.g. larger injection volumes. Identification can be less clear than for
HRMS analysis, and a very efficient extract clean‐up is important to avoid
interferences. A technique commonly applied is GC‐LRMS using ion trap mass
analysers working in tandem mode (Eppe et al., 2004; Focant et al., 2005; Malavia et al.,
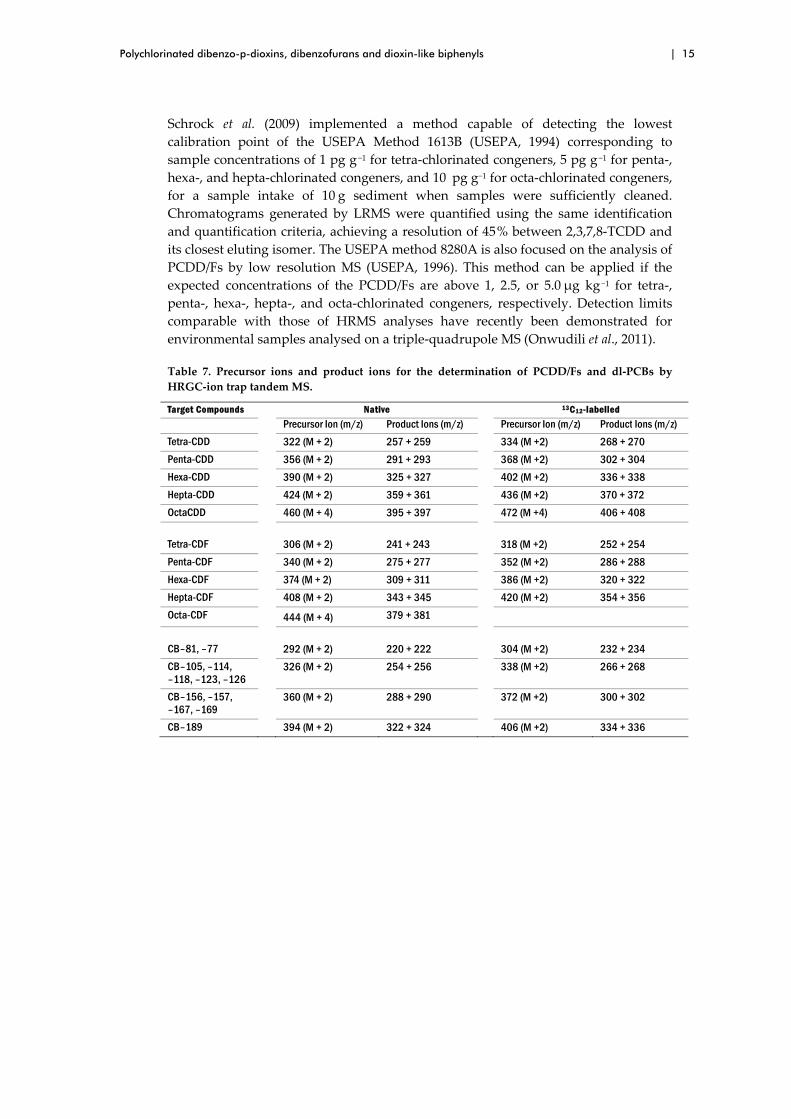
2008). Table 7 provides information on precursor and product ions obtained by GC‐
ion trap MS. GC‐LRMS (quadrupole) can be an option for dl‐PCBs in particular;
however, the maintenance of the instrument could be time consuming (e.g. frequent
cleaning of the ion source). Triple‐quadrupole instruments are becoming a common
technique and offer a suitable alternative to GC‐ion trap MS (March et al., 2000;
Onwudili et al., 2011).
Polychlorinated dibenzo-p-dioxins, dibenzofurans and dioxin-like biphenyls | 15
Schrock et al. (2009) implemented a method capable of detecting the lowest
calibration point of the USEPA Method 1613B (USEPA, 1994) corresponding to
sample concentrations of 1 pg g −1 for tetra‐chlorinated congeners, 5 pg g −1 for penta‐,
hexa‐, and hepta‐chlorinated congeners, and 10 pg g−1 for octa‐chlorinated congeners,
for a sample intake of 10 g sediment when samples were sufficiently cleaned.
Chromatograms generated by LRMS were quantified using the same identification
and quantification criteria, achieving a resolution of 45 % between 2,3,7,8‐TCDD and
its closest eluting isomer. The USEPA method 8280A is also focused on the analysis of
PCDD/Fs by low resolution MS (USEPA, 1996). This method can be applied if the
expected concentrations of the PCDD/Fs are above 1, 2.5, or 5.0 μg kg −1 for tetra‐,
penta‐, hexa‐, hepta‐, and octa‐chlorinated congeners, respectively. Detection limits
comparable with those of HRMS analyses have recently been demonstrated for
environmental samples analysed on a triple‐quadrupole MS (Onwudili et al., 2011).
Table 7. Precursor ions and product ions for the determination of PCDD/Fs and dl‐PCBs by
HRGC‐ion trap tandem MS.
Target Compounds Native 13C12-labelled
Precursor Ion (m/z) Product Ions (m/z) Precursor Ion (m/z) Product Ions (m/z)
Tetra-CDD 322 (M + 2) 257 + 259 334 (M +2) 268 + 270
Penta-CDD 356 (M + 2) 291 + 293 368 (M +2) 302 + 304
Hexa-CDD 390 (M + 2) 325 + 327 402 (M +2) 336 + 338
Hepta-CDD 424 (M + 2) 359 + 361 436 (M +2) 370 + 372
OctaCDD 460 (M + 4) 395 + 397 472 (M +4) 406 + 408
Tetra-CDF 306 (M + 2) 241 + 243 318 (M +2) 252 + 254
Penta-CDF 340 (M + 2) 275 + 277 352 (M +2) 286 + 288
Hexa-CDF 374 (M + 2) 309 + 311 386 (M +2) 320 + 322
Hepta-CDF 408 (M + 2) 343 + 345 420 (M +2) 354 + 356
Octa-CDF 444 (M + 4) 379 + 381
CB–81, –77 292 (M + 2) 220 + 222 304 (M +2) 232 + 234
CB–105, –114, –118, –123, –126
326 (M + 2) 254 + 256 338 (M +2) 266 + 268
CB–156, –157, –167, –169
360 (M + 2) 288 + 290 372 (M +2) 300 + 302
CB–189 394 (M + 2) 322 + 324 406 (M +2) 334 + 336
16 | ICES Techniques in Marine Environmental Sciences No. 50
6 Quality assurance and quality control
The analytical method requires low detection limits, usually in the pg g−1‐range, for
both PCDD/Fs and dl‐PCB congeners (OSPAR, 2005) and should meet the
requirements for LoQ and measurement uncertainty specified in the monitoring
programme. The selectivity of the method should be sufficient to avoid interfering
compounds, i.e. the individual congeners should be separated from each other and
any interferences present. The recovery of the individual internal standards added
prior to extraction should be between 60 and 120 %.
All sample series should include procedural blanks and measurements of
certified/laboratory reference materials. Blanks should be as low as possible, at least
below 20 % of the lowest concentration of interest. Certified reference materials
should be analysed regularly, although only few are available for the determination
of PCDD/Fs and dl‐PCBs in biota, as summarized by de Boer and McGovern (2001).
Examples for biota include certified reference materials from Cambridge Isotope
Laboratories (EDF‐2524, ‐2525, ‐2526, and ‐5463 with PCDD/Fs and dl‐PCBs at
varying concentrations), Wellington Laboratories (WMF‐01), and the National
Research Council of Canada (CARP‐2). Examples of certified reference materials for
sediment include a marine sediment from the National Institute of Standards and
Technology (NIST 1944) and lake sediments from Wellington Laboratories (WMS‐01)
and Environment Canada (DX‐1,‐2,‐3).
The laboratory should regularly prove its competence in relevant laboratory
proficiency tests. It is essential that the matrix and concentration range of the
proficiency testing samples are comparable with the samples routinely analysed
within the monitoring programme (de Boer, 2001; Wells and de Boer, 2006).

Polychlorinated dibenzo-p-dioxins, dibenzofurans and dioxin-like biphenyls | 17
7 Screening methods based on bioassays
EC (2002) suggested bioassays as screening tools for monitoring PCDD/Fs and dl‐
PCBs in foodstuffs, with the requirement to meet the criteria given in Table 8. In
environmental monitoring, screening tools might be useful in, for instance, selecting
suitable sampling sites. Hurst et al. (2004) also emphasized that monitoring
programmes were moving towards effect‐based monitoring, with biological
relevance becoming more important. The tool must be capable of rapid, inexpensive,
and high‐throughput screening, producing interpretable and meaningful results
(Hurst et al., 2004).
Table 8. Quality criteria for screening and verification methods (EC, 2002).
Screening method Verification method
False negatives < 1 %
Accuracy 20 %
Precision (expressed as the coefficient of variation between repeated measurements)
< 30 % < 15 %
The dioxin‐responsive chemically activated luciferase (DR‐CALUX or DR‐lux) assay
is mechanism‐specific and utilizes the interaction with the Ah Receptor (AhR).
However, this cell line is not compound‐specific and produces a response with all
compounds capable of interactions with the AhR. EC (2002) demands that the TEQ‐
values determined by bioassays should be the sum of PCDD/Fs and dl‐PCBs in the
sample. However, Hurst et al. (2004) and Van Leeuwen et al. (2007) demonstrated
some disagreement between the results of the bioassay and the conventional targeted
HRGC/HRMS analysis. The differences may be caused by unknown compounds
producing a dioxin‐like response in the CALUX assay (e.g. brominated or mixed
halogenated dioxin analogues, polychlorinated naphthalenes, polycyclic aromatic
hydrocarbons), or compounds antagonising the AhR (e.g. di‐ortho‐substituted PCBs).
These deviations from the results of chemical analysis were also considered as an
advantage by Hurst et al. (2004), because the assay allows a more accurate assessment
of the true potency of dioxin‐like toxicity present in the samples. To obtain specific
responses to PCDD/Fs and dl‐PCBs in the sample, the extracts require specific clean‐
up methods to exclude interferences from other dioxin‐like compounds. As
mentioned above, environmental monitoring aims at presenting concentrations of
individual compounds in the respective samples, rather than toxicity assessments.

18 | ICES Techniques in Marine Environmental Sciences No. 50
8 Safety
The chemical compounds dealt with in this guideline are hazardous and must only
be handled by trained personnel familiar with the handling of PCDD/F and dl‐PCBs
and associated risks as well as precautionary measures. USEPA (1994) recommends
that laboratories purchase diluted standard solutions instead of preparing primary
solutions.
9 Data reporting
For biota analysis, results are typically reported in pg g−1 wet weight (ww). The lipid
content and water content of the samples should be reported as well. For normalizing
purposes, the total lipid content should be determined, rather than the extractable
lipid content (de Boer, 1988).
For sediment analysis, results are typically reported in pg g−1 dry weight (dw),
equivalent to ng kg−1 dw. The water and organic carbon content of the samples
should be reported as well, the latter being used for normalizing purposes.
Concentrations are reported to two significant figures. Minimum performance
criteria, such as LoQ and measurement uncertainty, along with information on blanks
and reference materials should be included in the report.
Polychlorinated dibenzo-p-dioxins, dibenzofurans and dioxin-like biphenyls | 19
10 References
Antunes, P., Viana, P., Vinhas, T., Capelo, J. L., Rivera, J., and Gaspar, E. M. S. M. 2008.
Optimization of pressurized liquid extraction (PLE) of dioxin‐furans and dioxin‐like PCBs
from environmental samples. Talanta, 75: 916–925.
Bandh, C., Ishaq, R., Broman, D., Näf, C., Rönquist‐Nii, Y., and Zebühr, Y. 1996. Separation for
subsequent analysis of PCBs, PCDD/Fs, and PAHs according to aromaticity and planarity
using a two‐dimensional HPLC system. Environmental Science and Technology, 30: 214–
219.
Björklund, E., Sporring, S., Wiberg, K., Haglund, P., and von Holst, C. 2006. New strategies for
extraction and clean‐up of persistent organic pollutants from food and feed samples using
selective pressurized liquid extraction. Trends in Analytical Chemistry, 25: 318–325.
Bligh, E. G., and Dyer, W. J. 1959. A rapid method of total lipid extraction and purification.
Canadian Journal of Biochemistry and Physiology, 37: 911–917.
Chuang, J. C., Van Emon, J. M., and Schrock, M. E. 2009. High‐throughput screening of dioxins
in sediment and soil using selective pressurized liquid extraction with immunochemical
detection. Chemosphere, 77: 1217–1223.
Cochran, J., Dorman, F., Stidsen, G., Reese, S., MacPherson, K., Kolic, T., Reiner, E., et al. 2007a.
Retention time profiling for all 136 tetra‐ through octa‐chlorinated dioxins and furans on a
unique, low‐bleed, thermally‐stable gas chromatography column. Organohalogen
Compounds, 69: 477–480.
Cochran, J., Dorman, F., Stidsen, G., Reese, S., MacPherson, K., Kolic, T., Reiner, E., et al. 2007b.
Retention times and coelutions for all 136 tetra‐ through octa‐chlorinated dioxins and
furans on a unique, low‐bleed thermally‐stable gas chromatography column.
Organohalogen Compounds, 69: 1146–1149.
Daelemans, F. F., Mehlum F., and Schepens, P. J. C. 1992. Polychlorinated biphenyls in two
species of Arctic seabirds from the Svalbard Area. B. Environmental Contamination and
Toxicology, 48: 828–834.
de Boer, J. 1988. Chlorobiphenyls in bound and non‐bound lipids of fishes; comparison of
different extraction methods. Chemosphere, 17: 1803–1810.
de Boer, J. 2001. Fresh materials. In Reference materials for chemical analysis: certification,
availability and proper usage, pp. 121–127. Ed. by M. Stoeppler, W. R. Wolf, and P. J.
Jenks. J. Wiley and Sons, New York, USA.
de Boer, J., and McGovern, E. 2001. Certified reference materials for organic contaminants for
use in monitoring of the aquatic environment. Trends in Analytical Chemistry, 20: 140–
159.
de Boer, J., and Smedes, F. 1997. Effects of storage conditions of biological reference materials
on the contents of organochlorine compounds and mercury. Marine Pollution Bulletin, 35:
93–108.
Dyke, P. H., Foan, C., and Fiedler, H. 2003. PCB and PAH releases from power stations and
waste incineration processes in the UK. Chemosphere, 50: 469–480.
EC. 2002. Commission Directive 2002/69/EC of 26 July 2002. Laying down the sampling
methods and the methods of analysis for the official control of dioxins and the
determination of dioxin‐like PCBs in foodstuffs. Official Journal of the European
Commission, L 209: 5–14, 06.08.2002, Brussels, Belgium.
Eppe, G., Focant, J‐F., Pirard, C., and De Pauw, E. 2004. PTV‐LV‐GC/MS/MS as screening and
complementary method to HRMS for the monitoring of dioxin levels in food and feed.
Talanta, 63: 1135–1146.

20 | ICES Techniques in Marine Environmental Sciences No. 50
Fishman, V. N., Martin G. D., and Lamparski, L. L. 2007. Comparison of a variety of gas
chromatographic columns with different polarities for the separation of chlorinated
dibenzo‐p‐dioxins and dibenzofurans by high‐resolution mass spectrometry. Journal of
Chromatography A, 1139: 285–300.
Fishman, V. N., Martin, G. D., and Wilken, M. 2011. Retention time profiling of all 136 tetra‐
through octa‐chlorinated dibenzo‐p‐dioxins and dibenzofurans on a variety of Si‐Arylene
gas chromatographic stationary phases. Chemosphere, 84: 913–922.
Focant, J‐F., Picard, C., and De Pauw, E. 2004. Automated sample preparation‐fractionation for
the measurement of dioxins and related compounds in biological matrices: a review.
Talanta, 63: 1101–1113.
Focant, J‐F., Picard, C., Eppe, G., and De Pauw, E. 2005. Recent advances in mass spectrometric
measurement of dioxins. Journal of Chromatography A, 1067: 265–275.
Haglund, P., Korytár, P., Danielsson, C., Diaz, J., Wiberg, K., Leonards, P., Brinkman, U. A. T.,
et al. 2008. GCxGC‐ECD: a promising method for determination of dioxins and dioxin‐like
PCBs in food and feed. Analytical and Bioanalytical Chemistry, 390: 1815–1827.
Hanson, S. W. F., and Olley, J. 1963. Application of the Bligh and Dyer method of lipid
extraction to tissue homogenates. Biochemistry Journal, 89(3): 101–102.
Hurst, M. R., Balaam, J., Chan‐Man, Y. L., Thain, J. E., and Thomas, K. V. 2004. Determination
of dioxin and dioxin‐like compounds in sediments from UK estuaries using a bio‐
analytical approach: chemical‐activated luciferase expression (CALUX) assay. Marine
Pollution Bulletin, 49: 548–658.
Kishida, M., Maekawa, T., and Bandow, H. 2010. Effect of extraction temperature on
pressurized liquid extraction of polychlorinated dibenzo‐p‐dioxins, polychlorinated
dibenzofurans, and dioxin‐like polychlorinated biphenyls from a sediment sample using
polar and non‐polar solvents. Analytica Chimica Acta, 659: 186–193.
Kjeller, L‐O., and Rappe, C. 1998. Extraction of a quality assurance sediment sample for
polychlorinated dibenzo‐p‐dioxins and dibenzofurans (PCDD/F). Fresenius Journal of
Analytical Chemistry, 361: 811–816.
Koh, C‐H., Khim, J. S., and Kannan, K. 2004. Polychlorinated dibenzo‐p‐dioxins (PCDDs),
dibenzofurans (PCDFs), biphenyls (PCBs), and polycyclic aromatic hydrocarbons (PAHs)
and 2, 3, 7, 8‐TCDD equivalents (TEQs) in sediment from the Hyeongsan River, Korea.
Environmental Pollution, 132(3): 489–501.
Lamparski, L. L., and Nestrick, T. J. 1989. Novel extraction device for the determination of
chlorinated dibenzo‐p‐dioxins (CDDs) and dibenzofurans (CDFs) in matrices containing
water. Chemosphere, 19(1–6): 27–31.
Larsen, B., Cont, M., Montanarella, L., and Platzner, N. 1995. Enhanced selectivity in the
analysis of chlorobiphenyls on a carborane phenylmethylsiloxane copolymer gas
chromatography phase (HT‐8). Journal of Chromatography A, 708: 115–129.
Leach, C. J., Wagner, T., Jones, M., Juggins, S., and Stevenson, A. C. 2008. Rapid determination
of total organic carbon concentration in marine sediments using Fourier transform near‐
infrared spectroscopy (FT‐NIRS). Organic Geochemistry, 39(8): 910–914.
Liu, H., Zhang, Q., Song, M., Jiang, G., and Cai, Z. 2006. Method development for the analysis
of polybrominated diphenyl ethers, polychlorinated biphenyls, polychlorinated dibenzo‐p‐
dioxins and dibenzo‐furans in single extract of sediment samples. Talanta, 70: 20–25.
Malavia, J., Santos, F. J., and Galceran, M. T. 2008. Comparison of gas chromatography‐ion trap
tandem mass spectrometry systems for the determination of polychlorinated dibenzo‐p‐
dioxins, dibenzofurans and dioxin‐like polychlorinated biphenyls. Journal of
Chromatography A, 1186: 302–311.
Polychlorinated dibenzo-p-dioxins, dibenzofurans and dioxin-like biphenyls | 21
March, R. E., Splendore, M., Reiner, E. J., Mercer, R. S., Plomley, J. B., Waddell, D. S., and
MacPherson, K. A. 2000. A comparison of three mass spectrometric methods for the
determination of dioxins/furans. International Journal of Mass Spectrometry, 194: 235–246.
Onwudili, J. A., Hajizadeh, Y., Zainal, S., Upton, J., and Williams, P. T. 2011. Application of
low‐temperature CP‐Sil 88 column for the isomeric analysis of toxic 2378‐substituted
PCDD/Fs in incinerator flyash and sewage sludge using a triple quadrupole GC‐MS/MS.
Talanta, 87: 143–151.
OSPAR. 2005. Background document on dioxins. Hazardous Substances Series. OSPAR
Commission, update 2005, London, UK.
OSPAR. 2010a. JAMP Guidelines for Monitoring Contaminants in Biota. OSPAR Commission.
Monitoring guidelines, ref. no. 1999‐2, revised in 2010, London, UK. 98 pp.
OSPAR. 2010b. JAMP Guidelines for Monitoring Contaminants in Sediments. OSPAR
Commission. Monitoring guidelines, ref. no. 2002‐16, revised in 2010, London, UK. 84 pp.
Pandelova, M., Henkelmann, B., Roots, O., Simm, M., Järv, L., Benfenati, E., and Schramm, K‐
W. 2008. Levels of PCDD/F and dioxin‐like PCB in Baltic fish of different age and gender.
Chemosphere, 71: 369–378.
Reiner, E. J., Clement, R. E., Okey, A. B., and Marvin, C. H. 2006. Advances in analytical
techniques for polychlorinated dibenzo‐p‐dioxins, polychlorinated dibenzofurans and
dioxin‐like PCBs. Analytical and Bioanalytical Chemistry, 386: 791–806.
Robinson, C., Blow, P., and Dorman, F. 2004. Rapid dioxin analysis using accelerated solvent
extraction (ASE), multi‐column sample cleanup and Rtx‐Dioxin2 gas chromatography
column. Organohalogen Compounds, 66: 100–105.
Schumacher, B. 2002. Methods for the determination of total organic carbon (TOC) in soils and
sediments. Ecological Risk Assessment Support Center. US Environmental Protection
Agency. NCEA‐C‐1282; EMASC‐001.
Schrock, M., Dindal, A., and Billets, S. 2009. Evaluation of alternative approaches for screening
contaminated sediments and soils for polychlorinated dibenzo‐p‐dioxins and
polychlorinated dibenzofurans. Journal of Environmental Management, 90: 1289–1295.
Skoczynska, E., Korytár, P., and de Boer, J. 2008. Maximizing chromatographic information
from environmental extracts by GCxGC‐ToF‐MS. Environmental Science and Technology,
42: 6611–6618.
Smedes, F. 1999. Determination of total lipid using non‐chlorinated solvents. Analyst, 124:
1711–1718.
Stern, G. A., Braekevelt, T. W., Helm, P. A., Bidleman, T. F., Outdidge, P. M., Lockhart, W. L.,
McNeeley, R., et al. 2005. Modern and historical fluxes of halogenated organic
contaminants to a lake in the Canadian Arctic, as determined from annually laminated
sediment cores. Science of the Total Environment, 342: 223–243.
USEPA. 1994. Tetra‐ through Octa‐chlorinated dioxins and furans by isotope dilution
HRGC/HRMS. Method 1613. Revision B. US Environmental Protection Agency. Office of
Water, Engineering and Analysis Division (4304), October 1994, Washington DC, USA.
USEPA. 1996. The analysis of polychlorinated dibenzo‐p‐dioxins and polychlorinated
dibenzofurans by high resolution gas chromatography/low resolution mass spectrometry
(HRGC/LRMS). Method 8280A. Revision 1. US Environmental Protection Agency,
December 1996, Washington DC, USA.
Van den Berg, M., Birnbaum, L. S., Denison, M., De Vito, M., Farland, W., Feeley, M., Fiedler,
H., et al. 2006. The 2005 World Health Organization reevaluation of human and
mammalian toxic equivalency factors for dioxins and dioxin‐like compounds.
Toxicological Sciences, 93: 223–241.

22 | ICES Techniques in Marine Environmental Sciences No. 50
Van Leeuwen, S. P. J., Leonards, P. E. G., Traag, W. A., Hoogenboom, L. A. P., and de Boer, J.
2007. Polychlorinated dibenzo‐p‐dioxins, dibenzofurans and biphenyls in fish from the
Netherlands: concentrations, profiles and comparison with DR CALUX bioassay results.
Analytical and Bioanalytical Chemistry, 216: 1352–1356.
Van Loco, J., Van Leeuwen, S., Roos, P., Carbonelle, S., de Boer, J., Goeyens, L., and Beernaert,
H. 2004. The international validation of bio and chemical screening methods for dioxins
and dioxin‐like PCBs: The DIFFERENCE project round 1 and 2. Talanta, 63: 1169–1182.
Verta, M., Salo, S., Korhonen, M., Assmuth, T., Kiviranta, H., Koistinen, J., Ruokojärvi, P., et al.
2007. Dioxin concentrations in sediments of the Baltic Sea – a survey of existing data.
Chemosphere, 67: 1762–1775.
Webster, L., Tronczynski, J., Bersuder, P., Vorkamp, K., and Lepom, P. 2009. Determination of
polybrominated diphenyl ethers (PBDEs) in sediment and biota. ICES Techniques in
Marine Environmental Sciences, 46. 16 pp.
Wells, D. E., and de Boer, J. 2006. Evaluation of the quality of measurement of organochlorine
contaminants in the marine environment: the QUASIMEME experience. Trends in
Analytical Chemistry, 25: 350–363.

Polychlorinated dibenzo-p-dioxins, dibenzofurans and dioxin-like biphenyls | 23
11 Author contact information
Katrin Vorkamp
Aarhus University
Department of Environmental Sciences
Frederiksborgvej 399
4000 Roskilde, Denmark
Patrick Roose
Management Unit of the North Sea
Mathematical Models
3de en 23ste Linieregimentsplein
8400 Oostende, Belgium
Philippe Bersuder
Centre for Environment, Fisheries and
Aquaculture Sciences (Cefas)
Pakefield Road
Lowestoft,
Suffolk NR33 0HT, UK
Lynda Webster
Marine Scotland–Science
PO Box 101
375 Victoria Road
Aberdeen AB11 9DB, UK
Peter Lepom
Federal Environment Agency
Laboratory for Water Analysis
Bismarckplatz 1
14193 Berlin, Germany
Catherine Munschy
Ifremer
Rue de l’Ile d’Yeu
BP21105
44311 Nantes Cedex 03, France
Rossana Bossi
Aarhus University
Department of Environmental Sciences
Frederiksborgvej 399
4000 Roskilde, Denmark
Jacek Tronczynski
Ifremer
Rue de lʹIle dʹYeu
BP 21105
44311 Nantes Cedex 03, France
Jacob de Boer
VU University
De Boelelaan 1087
1081 HV Amsterdam, The Netherlands

2 | ICES Techniques in Marine Environmental Sciences No. 50
12 Abbreviations
AhR Ah Receptor
BCF bioconcentration factor
[]CDD chlorodibenzo‐p‐dioxin, prefixed with tetra (T), penta (Pe), hexa (Hx),
hepta (Hp), or octa (O)
[]CDF chlorodibenzofuran, prefixed as above
dl‐PCB dioxin‐like polychlorinated biphenyl
DR‐CALUX, DR‐lux dioxin‐responsive chemically activated luciferase
dw dry weight
ECD electron capture detection
GC gas chromatography
GCxGC comprehensive multidimensional gas chromatography
GC‐MS‐MS GC tandem mass spectrometry
GPC gel permeation chromatography
HpCDD heptachlorodibenzo‐p‐dioxin
HPLC high‐performance liquid chromatography
HRGC high‐resolution gas chromatography
HRMS high‐resolution mass spectrometry
HxCDD hexachlorodibenzo‐p‐dioxin
LoQ limit of quantification
LRGC low‐resolution gas chromatography
LRMS low‐resolution mass spectrometry
MS mass spectrometry
m/z mass/charge
OCDD octachlorodibenzo‐p‐dioxin
PBDE polybrominated diphenyl ether
PCB polychlorinated biphenyl
PCDD polychlorinated dibenzo‐p‐dioxin
PCDF polychlorinated dibenzofuran
PeCDD pentachlorodibenzo‐p‐dioxin
PFK perfluorokerosene
PFTBA perfluorotributylamine
PLE pressurized liquid extraction
PTV programmed temperature vaporizing
PYE 2‐(1‐pyrenyl)ethyldimethylsilylated silica
SIM selected ion monitoring
S/N signal‐to‐noise ratio
Soxhlet a liquid–solid extraction technique
TCDD tetrachlorodibenzo‐p‐dioxin
TEF toxicity equivalency factor
TEQ tetrachlorodibenzo‐p‐dioxin equivalent
TOC total organic carbon
ToF time‐of‐flight
ww wet weight