12 th annual northern plains workshop, bismarck, nd, 8-9 april 2008 sounding analysis and research...
TRANSCRIPT

12th Annual Northern Plains Workshop, Bismarck, ND, 8-9 April 2008
Sounding Analysis and Research Tools: What is used at Rapid City?
Matthew J. Bunkers
NOAA/NWS, Rapid City, SD

Motivation
Do you like this graph? Or this one?
2

Motivation
Do you want to make charts like this?
3http://www.crh.noaa.gov/unr/?n=pw

Outline
• Plot and analyze a hodograph
• Create a precipitable water chart
• Tell you where to get the tools
4

Hodograph
1. Get data – http://raob.fsl.noaa.gov; or radiosonde database on CD-ROMs
2. Run C program – hodo.c– Need UNIX/Linux
3. Plot in spreadsheet – Excel graph– Customize, analyze, print, save image
5

Hodograph – Get data
6
6/6/04:70-110 nmNW of BIS
Ord: 240 @ 30 ktsRM: 269 @ 26 ktsLM: 217 @ 47 kts

Hodograph – Get data
7
http://raob.fsl.noaa.gov/
Plus Radiosonde Database of North America CD-ROMs (1948mid 1990s)
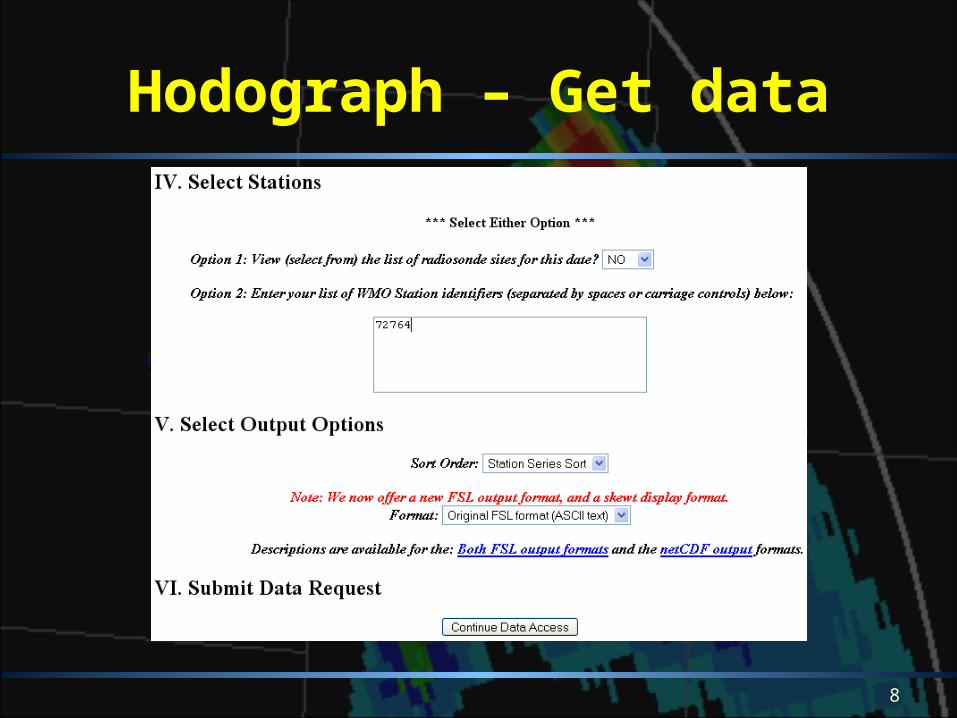
Hodograph – Get data
8

Hodograph – Get data
9

Hodograph – C program
10

Hodograph – C program
11

Hodograph – Excel spreadsheet
12
Ord: 240 @ 30 ktsRM: 269 @ 26 ktsLM: 217 @ 47 kts

Precipitable water
1. Get data – http://raob.fsl.noaa.gov; or radiosonde database on CD-ROMs
2. Run C program – pw.c
3. Plot in spreadsheet – Excel graph– Customize, analyze, print, save image
13

Precipitable water – Get data
14
http://raob.fsl.noaa.gov/
Plus Radiosonde Database of North America CD-ROMs (1948mid 1990s)

Precipitable water – Get data
15

Precipitable water – Get data
16
May have to concatenate several files; put 999 at end

Precipitable water – pw.c
• Compile this program just like hodo.c– See comments within program
17
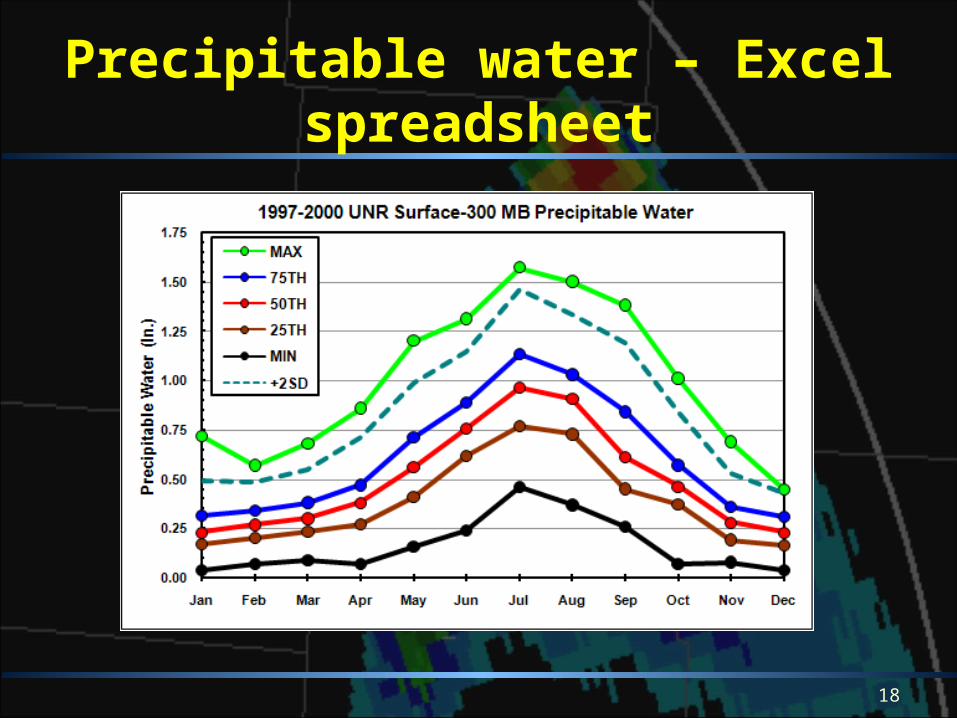
Precipitable water – Excel spreadsheet
18

Where do I get this?
• http://www.crh.noaa.gov/unr/?n=scm
• convectM.c– Computes multiple sounding variables
19
Bulk1 Bulk2 Bulk3 Bulk4 Bulk5 Bulk6 Bulk7 Bulk8 SRH1 SRH2 SRH3 Year Mo Dy Hr
5 10 15 20 25.4 30.9 31.5 31.5 38 76 115 1998 1 16 05.5 5 5 5.5 2.6 1.9 3.5 11.3 -25 -20 -20 1998 1 20 121.3 8.9 13.8 13.1 12 19.7 15.9 17.2 -17 71 89 1998 2 23 0
12.5 13.1 20 21.6 25.7 26.3 27.1 26.3 203 212 262 1998 2 25 126.4 17.1 18.7 22.2 26.2 31.9 32.8 33.3 90 186 198 1998 3 25 0
10.4 15.1 21.8 25.2 23.8 24.9 25.2 25.9 170 217 266 1998 3 26 09.9 17.1 17.8 18.9 20.9 26.5 37.9 41.8 123 186 197 1998 3 27 07.9 11.8 15.4 24.2 13 19.3 25 19.6 -104 -89 -305 1998 4 14 127.3 8.6 1.6 2.3 4.9 9.9 12.2 12.2 -35 -1 59 1998 4 15 0
12.5 13.4 10.9 9.7 14.2 18.2 23.5 23.2 -29 -24 -14 1998 4 18 0
Wrap-up
• These programs provide opportunity for nice graphics and climatological studies
• Garbage input soundings = garbage output variables
• I don’t provide “official” support
• New variables don’t get added quickly
20

Thanks for your attention!
21