12 income, employment and prices
DESCRIPTION
12 Income, employment and prices. Learning outcomes. By studying this section students will be able to: distinguish between microeconomics and macroeconomics measure the total level of economic activity in an economy distinguish between changes in real and money GNP - PowerPoint PPT PresentationTRANSCRIPT

© John Tribe
12 Income, employment and
prices
© John Tribe

© John Tribe
Learning outcomes
• By studying this section students will be able to:– distinguish between microeconomics and macroeconomics– measure the total level of economic activity in an economy– distinguish between changes in real and money GNP– measure the contribution to GNP– understand the contribution to employment– understand the contribution to tax revenue– utilize simple economic models of the macroeconomy– understand and apply the multiplier principle– measure inflation in the recreation, leisure and tourism sector– interpret government policy in this area

© John Tribe
Macroeconomics
• Cf microeconomics
• Macroeconomic issues affect the whole economy
• Aggregates– Eg. adds together the spending of individuals
to calculate consumers’ expenditure, or aggregate demand

© John Tribe
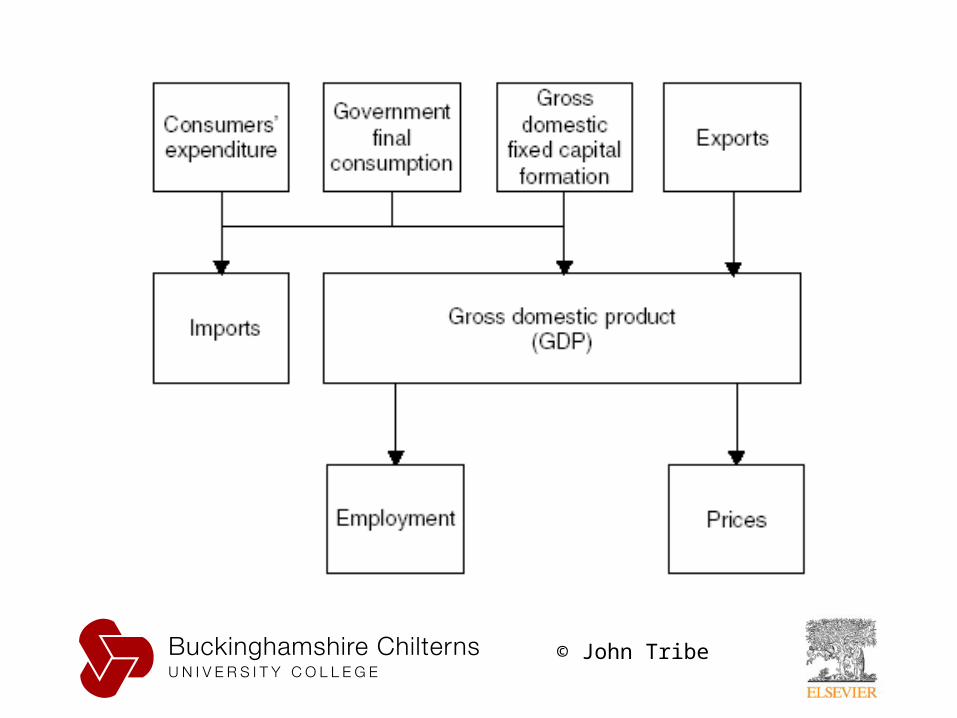
A simple macroeconomic model
• The economy is divided into two sectors, households and firms
• Real and Money Flows
• Circular Flow• National Income = A• National Output = B• National
Expenditure = C

© John Tribe
Gross, net, real and money
• Real national income or national income at constant prices has had the effects of inflation removed.– Money national income has not
• Some investment is merely replacing worn out machinery, so:– Gross national product – Capital consumption
= Net national product (national income)
© John Tribe
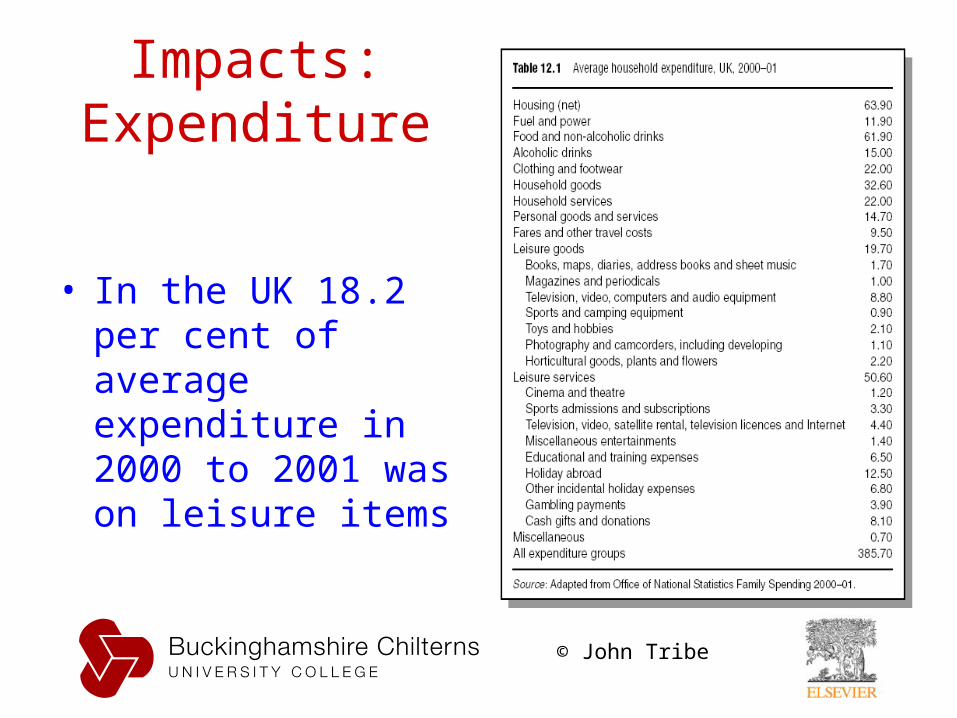
Impacts: Expenditure
• In the UK 18.2 per cent of average expenditure in 2000 to 2001 was on leisure items

© John Tribe
Impacts: Employment 1
In Australia, there were about 551,000 persons in tourism generated employment in 2000-01, the number of tourism employed persons grew by 7.4% between 1997-98 and 2000-01 and the tourism share of total employed persons in 2001 was 6.0%.

© John Tribe
Impacts: Employment 2

© John Tribe
Impacts: Taxation
– The tourism industry’s indirect tax contribution has been estimated at 10.6% of total tax revenues worldwide.

© John Tribe
Economic Impacts: Meribel, France

© John Tribe
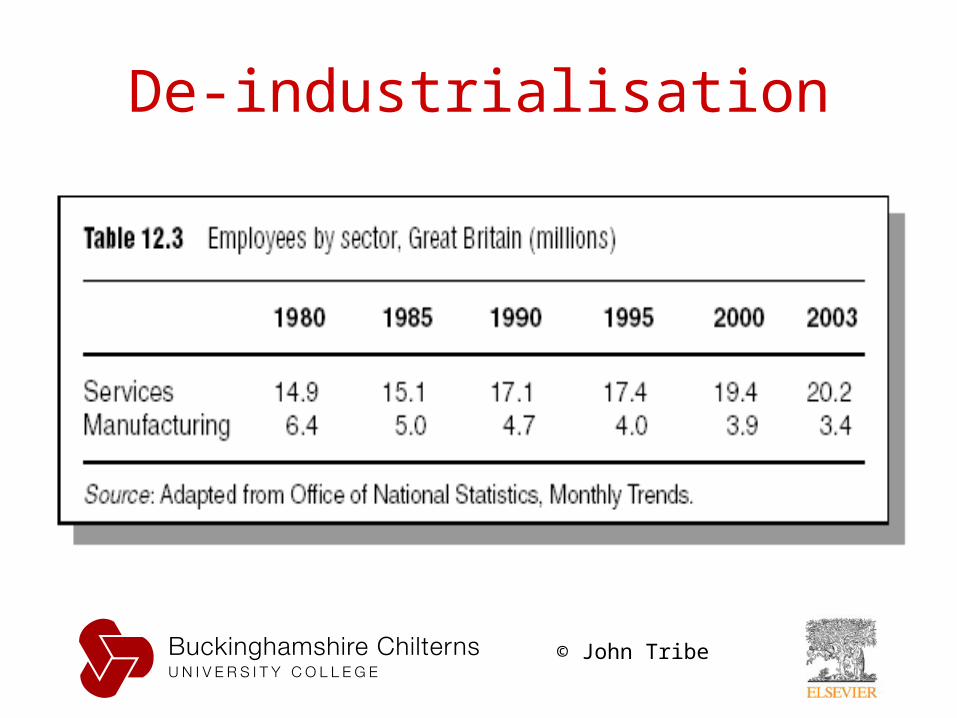
De-industrialisation in the developed world
• Employment in the services sector has grown in importance, manufacturing employment has shown a long-term decline. This is known as deindustrialization. This is caused by three factors. – First, technological progress enables productivity increases in
manufacturing and thus the ratio of labour input to output declines.
– Second, manufacturing has been subject to intense competition from low labour cost countries such as China and Vietnam, so many manufactured goods are now imported.
– Third, as incomes increase expenditure on services increases by a greater proportion (services demonstrate high income elasticity of demand).
© John Tribe
De-industrialisation

© John Tribe
Wages
• Demand and supply
• Trade Unions• Minimum
Wage

© John Tribe
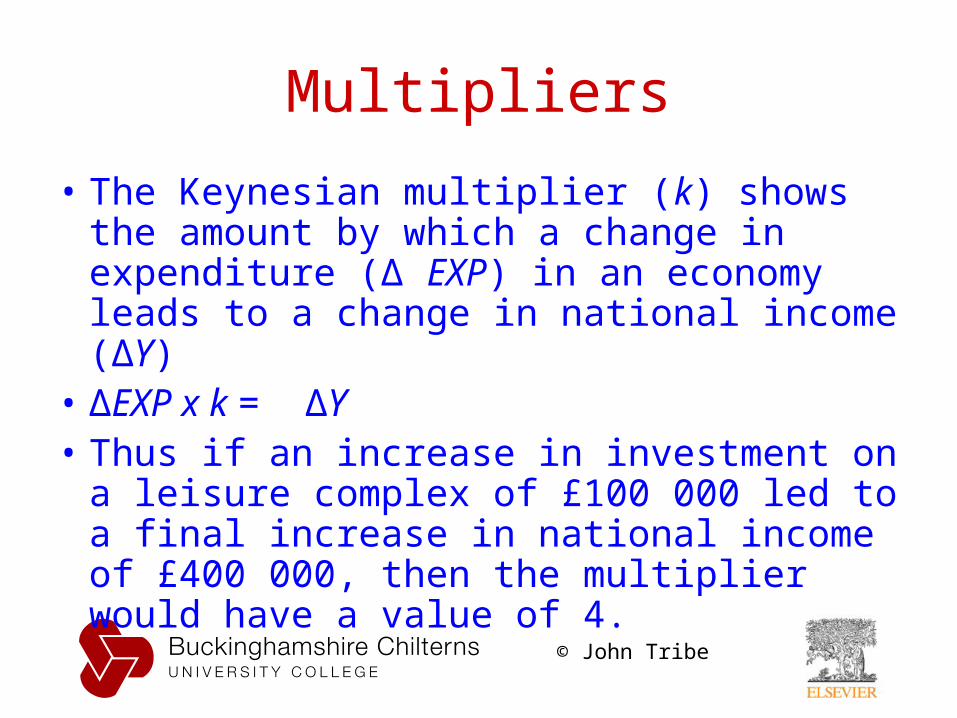
Multipliers
• Example: – Investment of £100 000 on a new leisure complex. – Firms will hire factors of production to the value of £100000 and
therefore national income, measured at point A, will rise by £100000.
– However, the effects of the investment do not stop there. – The workers who earned money from building the complex will
spend their money in shops and bars, etc. Thus the incomes of shop and bar owners will rise. They in turn will spend their incomes. In other words, a circular flow of income and expenditure will take place.
– The investment expenditure sets in motion a dynamic process, and the total extra income passing point A will exceed the initial £100 000.
– This is known as the multiplier effect. .
© John Tribe
Multipliers
• The Keynesian multiplier (k) shows the amount by which a change in expenditure (∆ EXP) in an economy leads to a change in national income (∆Y)
• ∆EXP x k = ∆Y• Thus if an increase in investment on a
leisure complex of £100 000 led to a final increase in national income of £400 000, then the multiplier would have a value of 4.

© John Tribe
Multipliers• The key factors
affecting the size of the multiplier are:– The size of the initial
injection into the economy
– “Leakages” from the economy:
• Savings• Taxation• Imports

© John Tribe
Multipliers• Formula for calculating the multiplier:• k = 1/MPL• where MPL = the marginal propensity to leak (the proportion of extra
income that leaks out of the economy).• MPL = MPS + MPM + MPT• where MPS = marginal propensity to save (the proportion of extra
income saved), MPM = marginal propensity to spend on imports (the proportion of extra income spent on imports) and MPT = marginal propensity to be taxed (the proportion of extra income taken in taxes.
• For example if MPS = 0.1Y, MPM = 0.05Y and MPT = 0.1Y, where Y = income, then:
• k = 1/(0.1 + 0.05 + 0.1)• k = 1/0.25• k = 4.

© John Tribe
Multiplier Rounds

© John Tribe
Multiplier Impacts

© John Tribe
Tourism Destination Price Index
• Prices in destinations can have an important effect on tourism demand
• A tourism destination price index can offer a guide to relative prices of key tourism-related activities (e.g. hotel costs, meal prices, car hire etc)

© John Tribe
Destination Price Index

© John Tribe
Tourism Destination Price Index
© John Tribe
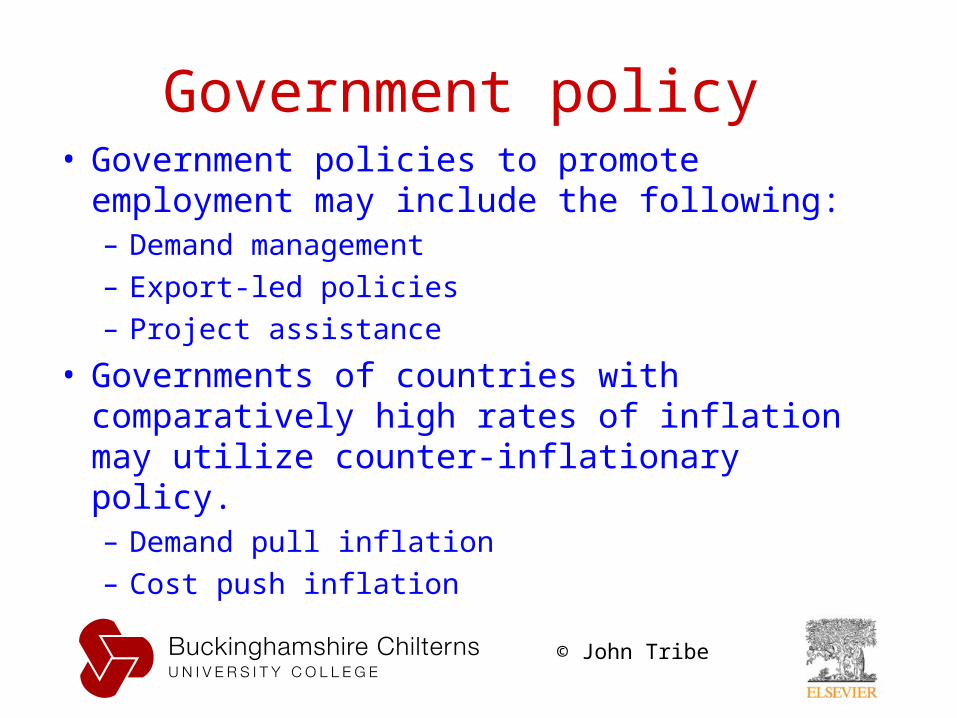
Government policy • Government policies to promote employment
may include the following:– Demand management– Export-led policies – Project assistance
• Governments of countries with comparatively high rates of inflation may utilize counter-inflationary policy.– Demand pull inflation– Cost push inflation

© John Tribe
Review of key terms• Macroeconomics =
– the study of the national economy.• National income =
– a measure of the total level of economic activity which takes place in an economy over a year.
• GNP = – gross national product.
• NNP = – net national product (national income).
• Money national income = – national income calculated at current prices.
• Real national income = – national income calculated at constant prices (inflationary
element removed).
© John Tribe
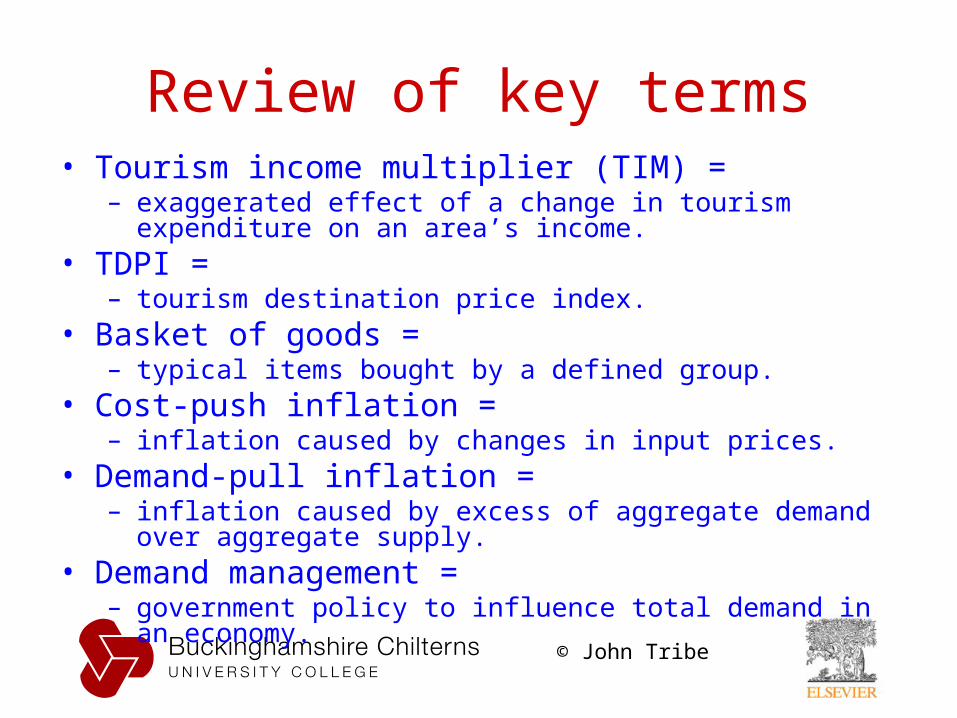
Review of key terms• Tourism income multiplier (TIM) =
– exaggerated effect of a change in tourism expenditure on an area’s income.
• TDPI = – tourism destination price index.
• Basket of goods = – typical items bought by a defined group.
• Cost-push inflation = – inflation caused by changes in input prices.
• Demand-pull inflation = – inflation caused by excess of aggregate demand over aggregate
supply.• Demand management =
– government policy to influence total demand in an economy.

© John Tribe
12 Income, employment and
prices:
The End