1,2 id 1,2, - pdfs.semanticscholar.org fileinvestigation of the dynamic melting process in a ......
TRANSCRIPT
energies
Article
Investigation of the Dynamic Melting Process in aThermal Energy Storage Unit Using a Helical CoilHeat Exchanger
Xun Yang 1,2, Teng Xiong 1,2, Jing Liang Dong 1,2 ID , Wen Xin Li 1,2 and Yong Wang 1,2,*1 National Centre for International Research of Low-Carbon and Green Buildings, Ministry of Science &
Technology, Chongqing University, Chongqing 400045, China; [email protected] (X.Y.);[email protected] (T.X.); [email protected] (J.L.D.); [email protected] (W.X.L.)
2 Joint International Research Laboratory of Green Buildings and Built Environments, Ministry of Education,Chongqing University, Chongqing 400045, China
* Correspondence: [email protected]; Tel.: +86-023-65120757; Fax: +86-023-65120773
Received: 18 June 2017; Accepted: 28 July 2017; Published: 1 August 2017
Abstract: In this study, the dynamic melting process of the phase change material (PCM) ina vertical cylindrical tube-in-tank thermal energy storage (TES) unit was investigated throughnumerical simulations and experimental measurements. To ensure good heat exchange performance,a concentric helical coil was inserted into the TES unit to pipe the heat transfer fluid (HTF).A numerical model using the computational fluid dynamics (CFD) approach was developed basedon the enthalpy-porosity method to simulate the unsteady melting process including temperatureand liquid fraction variations. Temperature measurements using evenly spaced thermocoupleswere conducted, and the temperature variation at three locations inside the TES unit was recorded.The effects of the HTF inlet parameters were investigated by parametric studies with differenttemperatures and flow rate values. Reasonably good agreement was achieved between the numericalprediction and the temperature measurement, which confirmed the numerical simulation accuracy.The numerical results showed the significance of buoyancy effect for the dynamic melting process.The system TES performance was very sensitive to the HTF inlet temperature. By contrast,no apparent influences can be found when changing the HTF flow rates. This study provides acomprehensive solution to investigate the heat exchange process of the TES system using PCM.
Keywords: thermal energy storage; helical coil heat exchanger; phase change material; heat transferfluid; CFD
1. Introduction
Over the last decade, a variety of solar energy utilization systems have been extensively used inactual applications [1–19]. These systems are deemed to be an attractive approach for solving globalenergy shortage problems due to its renewable and sustainable nature. However, the harvesting ofsolar energy varies intensely during different times, weather, and seasons, which inhibits the furtherapplication of the technology [20]. To further improve the system flexibility, thermal energy storage(TES) units are employed as an indispensable component in the system. Figure 1 illustrates a solarassisted heat pump (SAHP) system using a TES unit, which consists of several components includinga solar collector, TES unit and heat pump. During the daytime, the thermal energy gathered by thesolar collector is stored in the TES unit, while during the evening or on cloudy days, when the solarradiation drops down to zero or is at an insufficient level, the previously stored thermal energy isreleased as a low-grade heat source to the evaporator. Therefore, a balance between the energy supplyand demands is achieved, which greatly improves the system durability.
Energies 2017, 10, 1129; doi:10.3390/en10081129 www.mdpi.com/journal/energies

Energies 2017, 10, 1129 2 of 18
Energies 2017, 10, 1129 2 of 17
Therefore, a balance between the energy supply and demands is achieved, which greatly improves the system durability.
Figure1. Schematic diagram of a SAHP system using a TES unit.
In general, TES systems can be divided into two types: sensible heat thermal energy storage (SHTES) systems and latent heat thermal energy storage (LHTES) systems [21]. Compared to the widely used SHTES systems, LHTES systems provide a more promising TES solution [22]. By using phase change materials (PCMs), these systems can provide better energy storage density with small thermal fluctuations.
Numerous experimental studies have been performed in this area [23–27]. Dannemand et al. [23] studied cylindrical PCM systems utilizing stable super-cooling sodium acetate trihydrate composites. They found that low heat exchange capacity was due to limited convection in the molten PCM. Yazici et al. [24] investigated the effect of inner tube orientations on the melting behavior of paraffin. Their results demonstrated that the inner tube eccentricity was closely linked with the melting process. Murray and Groulx [25,26] studied the phase change process of dodecanoic acid under various charging and discharging conditions. They found that the natural convection played a significant role during the charging process, but became negligible during the discharging process. Gasia et al. [27] studied the dynamic melting based on a cylindrical shell-and-tube system using water as PCM. The heat transfer coefficient of the system increased due to the forced convection of the liquid PCM.
Analytical approaches provide an alternative solution. Kalaiselvam et al. [28] presented an analytical solution to locate interface locations over time. They found that the total solidification time depends on Stefan number and heat generation parameter, whereas the total melting time depended on equivalent thermal conductivity. Mosaffa et al. [29] proposed an approximate model for a two-dimensional solidification process in a shell-and-tube finned thermal storage system. The PCM solid phase variation over time was monitored and compared with the cylindrical shell and rectangular storage arrangements. Xu et al. [30] developed a mathematical model to analyze the overall exergy efficiency of combined charging-discharging processes using different kinds of PCMs and HTFs. Their results showed that the overall exergy efficiency can be improved by increasing the heat transfer units. Bechiri and Mansouri [31,32] developed an analytical solution for a shell-and-tube LHTES unit by applying an exponential integral function and a variables separation technique. Based on the analytical model, the effects of natural convection, HTF mass flow rate, outer tube radius, and pipe length on charging and discharging process were investigated.
Recently, numerical simulations using the computational fluid dynamics (CFD) approach have attracted considerable attention in this field. Compared to the experimental and analytical approaches, numerical simulations are more effective in dealing with influential factors, such as natural convection [33–39], geometric configuration [33–36], dynamic melting process [37] and non-dimensional number [38], etc. Fan et al. [33] studied a constrained melting process in a circumferentially finned spherical capsule, the influence of fin height on the TES performance was
Figure 1. Schematic diagram of a SAHP system using a TES unit.
In general, TES systems can be divided into two types: sensible heat thermal energy storage(SHTES) systems and latent heat thermal energy storage (LHTES) systems [21]. Compared to thewidely used SHTES systems, LHTES systems provide a more promising TES solution [22]. By usingphase change materials (PCMs), these systems can provide better energy storage density with smallthermal fluctuations.
Numerous experimental studies have been performed in this area [23–27]. Dannemand et al. [23]studied cylindrical PCM systems utilizing stable super-cooling sodium acetate trihydrate composites.They found that low heat exchange capacity was due to limited convection in the molten PCM.Yazici et al. [24] investigated the effect of inner tube orientations on the melting behavior of paraffin.Their results demonstrated that the inner tube eccentricity was closely linked with the melting process.Murray and Groulx [25,26] studied the phase change process of dodecanoic acid under various chargingand discharging conditions. They found that the natural convection played a significant role during thecharging process, but became negligible during the discharging process. Gasia et al. [27] studied thedynamic melting based on a cylindrical shell-and-tube system using water as PCM. The heat transfercoefficient of the system increased due to the forced convection of the liquid PCM.
Analytical approaches provide an alternative solution. Kalaiselvam et al. [28] presented ananalytical solution to locate interface locations over time. They found that the total solidificationtime depends on Stefan number and heat generation parameter, whereas the total melting timedepended on equivalent thermal conductivity. Mosaffa et al. [29] proposed an approximate model fora two-dimensional solidification process in a shell-and-tube finned thermal storage system. The PCMsolid phase variation over time was monitored and compared with the cylindrical shell and rectangularstorage arrangements. Xu et al. [30] developed a mathematical model to analyze the overall exergyefficiency of combined charging-discharging processes using different kinds of PCMs and HTFs.Their results showed that the overall exergy efficiency can be improved by increasing the heat transferunits. Bechiri and Mansouri [31,32] developed an analytical solution for a shell-and-tube LHTESunit by applying an exponential integral function and a variables separation technique. Based on theanalytical model, the effects of natural convection, HTF mass flow rate, outer tube radius, and pipelength on charging and discharging process were investigated.
Recently, numerical simulations using the computational fluid dynamics (CFD) approachhave attracted considerable attention in this field. Compared to the experimental and analyticalapproaches, numerical simulations are more effective in dealing with influential factors, such asnatural convection [33–39], geometric configuration [33–36], dynamic melting process [37] andnon-dimensional number [38], etc. Fan et al. [33] studied a constrained melting process in acircumferentially finned spherical capsule, the influence of fin height on the TES performance wasrevealed. Li and Wu [34] analyzed the TES performance with multiple geometric configurations andPCMs. Their results showed that the melting and solidification time of a TES unit with fins can be
Energies 2017, 10, 1129 3 of 18
shortened by at least 14%. Xiao and Zhang [35,36] investigated the heat transfer in a tube-and-shellstorage tank using paraffin/expanded graphite composite PCMs. They found that the type ofPCM, HTF temperatures and flow rates dominate the TES performance. Tay et al. [37] studied adynamic melting in a tube-in-tank PCM storage system, which involves forced recirculation of meltedPCM. The melting process was greatly accelerated compared to that based on natural convection.Archibold et al. [38] investigated the effects of the Grashof and Stefan numbers on TES performance.It was found that increasing the Grashof number from 1.32 × 10⁴ to 2.06 × 10⁵ can strengthen the heattransfer. Also for a constant Grashof number (9.09 × 10⁴), the PCM melted at a faster rate when theStefan number increased from 0.077 to 0.097. Fornarelli et al. [39] identified the natural convectiveflows within the molten PCM by temperature gradients and gravity, and the enhanced heat flux canreduce 30% of the charging time. Tao and Carey [40] sequenced the PCM thermal properties affectingTES performance, which was in the order of melting temperature, thermal conductivity, specific heat,density and melting enthalpy, successively.
For the tube-in-tank LHTES system, thermal resistance dominates within the PCM. To acceleratethe latent thermal energy storage process, one of the most effective methods is extending the heattransfer area [37], such as using coil tubes. Compared to the serial coil tube, a helical coil tube iseasier to install and has a greater heat transfer coefficient due to the secondary flow of fluid [41].Although numerous studies that have been conducted on LHTES systems, most of them were basedon heat exchangers with straight tube. Studies on the enhancement of heat transfer performancein tube-in-tank LHTES systems by applying helical coil tubes are relatively scarce in the publishedliterature. In order to get a rapid charging speed, an enhanced heat exchanger using a concentrichelical coil tube was applied in a vertical cylindrical LHTES in this study. The dynamic PCM meltingprocess was comprehensively studied through numerical modelling and experimental measurement.The dynamic melting process of the PCM including temperature and liquid fraction variations wereanalyzed in detail.
2. Experimental Modelling
2.1. Thermal Energy Storage (TES) Unit
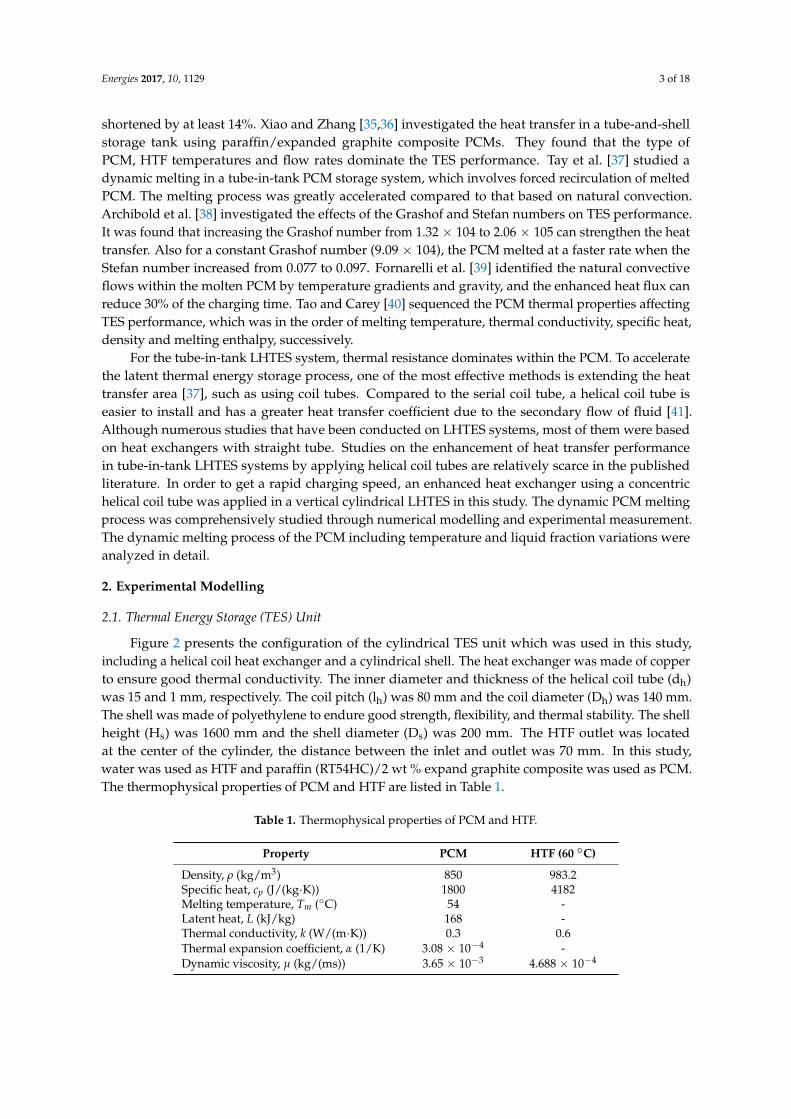
Figure 2 presents the configuration of the cylindrical TES unit which was used in this study,including a helical coil heat exchanger and a cylindrical shell. The heat exchanger was made of copperto ensure good thermal conductivity. The inner diameter and thickness of the helical coil tube (dh)was 15 and 1 mm, respectively. The coil pitch (lh) was 80 mm and the coil diameter (Dh) was 140 mm.The shell was made of polyethylene to endure good strength, flexibility, and thermal stability. The shellheight (Hs) was 1600 mm and the shell diameter (Ds) was 200 mm. The HTF outlet was locatedat the center of the cylinder, the distance between the inlet and outlet was 70 mm. In this study,water was used as HTF and paraffin (RT54HC)/2 wt % expand graphite composite was used as PCM.The thermophysical properties of PCM and HTF are listed in Table 1.
Table 1. Thermophysical properties of PCM and HTF.
Property PCM HTF (60 ◦C)
Density, ρ (kg/m3) 850 983.2Specific heat, cp (J/(kg·K)) 1800 4182Melting temperature, Tm (◦C) 54 -Latent heat, L (kJ/kg) 168 -Thermal conductivity, k (W/(m·K)) 0.3 0.6Thermal expansion coefficient, α (1/K) 3.08 × 10⁻⁴ -Dynamic viscosity, µ (kg/(ms)) 3.65 × 10⁻³ 4.688 × 10⁻⁴
Energies 2017, 10, 1129 4 of 18
Energies 2017, 10, 1129 4 of 17
(a) (b)
Figure 2. Schematic diagram of the cylindrical TES unit: (a) 3D geometry; (b) Cross section.
2.2. Experimental System Setup
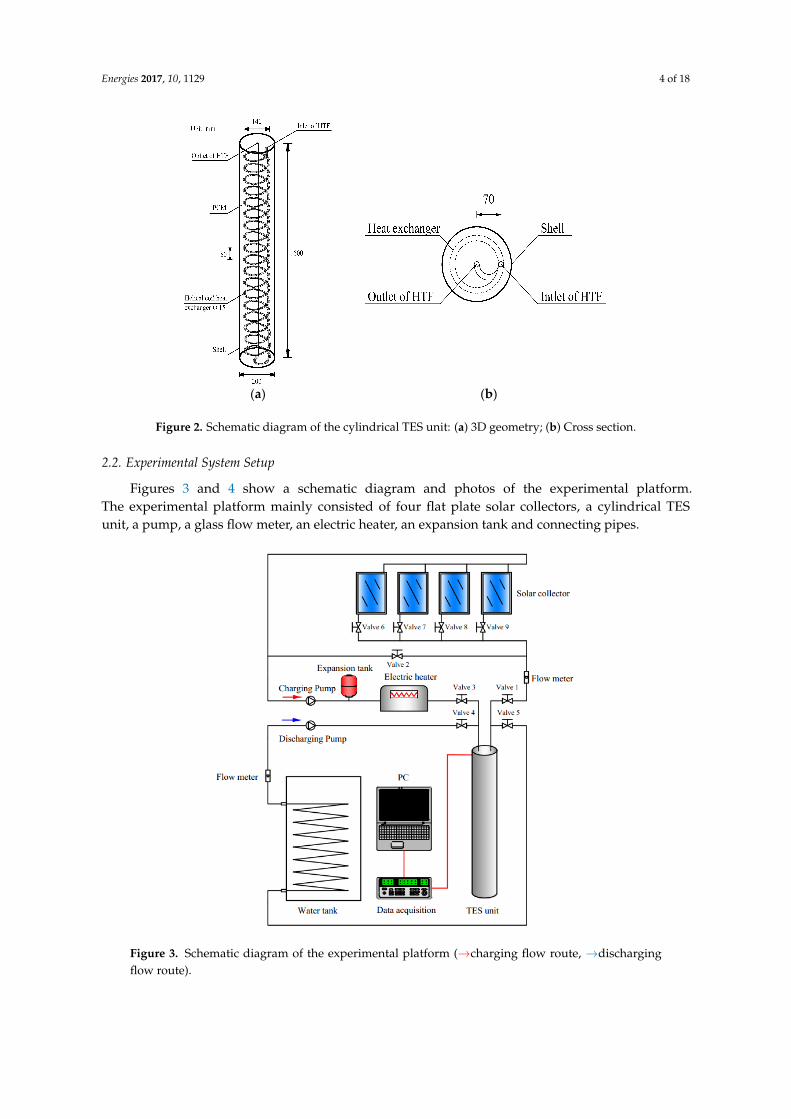
Figures 3 and 4 show a schematic diagram and photos of the experimental platform. The experimental platform mainly consisted of four flat plate solar collectors, a cylindrical TES unit, a pump, a glass flow meter, an electric heater, an expansion tank and connecting pipes.
Figure 3. Schematic diagram of the experimental platform (→charging flow route, →discharging flow route).
Figure 2. Schematic diagram of the cylindrical TES unit: (a) 3D geometry; (b) Cross section.
2.2. Experimental System Setup
Figures 3 and 4 show a schematic diagram and photos of the experimental platform.The experimental platform mainly consisted of four flat plate solar collectors, a cylindrical TESunit, a pump, a glass flow meter, an electric heater, an expansion tank and connecting pipes.
Energies 2017, 10, 1129 4 of 17
(a) (b)
Figure 2. Schematic diagram of the cylindrical TES unit: (a) 3D geometry; (b) Cross section.
2.2. Experimental System Setup
Figures 3 and 4 show a schematic diagram and photos of the experimental platform. The experimental platform mainly consisted of four flat plate solar collectors, a cylindrical TES unit, a pump, a glass flow meter, an electric heater, an expansion tank and connecting pipes.
Figure 3. Schematic diagram of the experimental platform (→charging flow route, →discharging flow route).
Figure 3. Schematic diagram of the experimental platform (→charging flow route, →dischargingflow route).
Energies 2017, 10, 1129 5 of 18
Energies 2017, 10, 1129 5 of 17
(a) (b)
(c) (d)
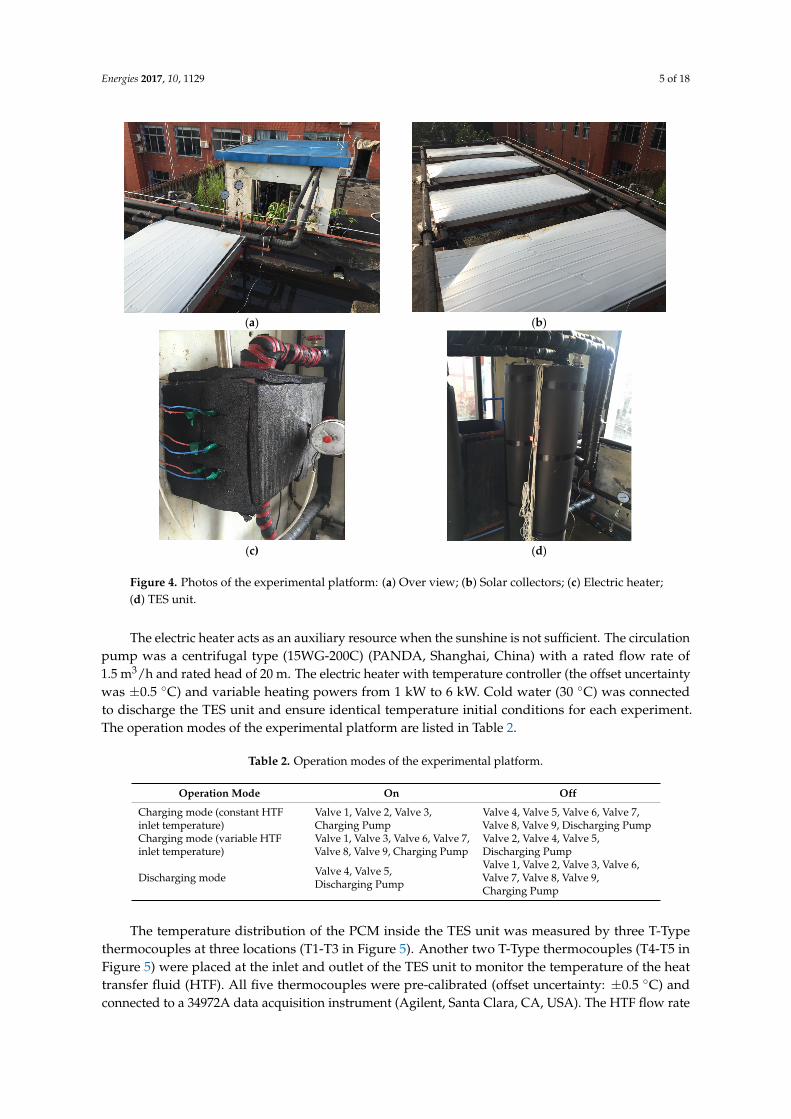
Figure 4. Photos of the experimental platform: (a) Over view; (b) Solar collectors; (c) Electric heater; (d) TES unit.
The electric heater acts as an auxiliary resource when the sunshine is not sufficient. The circulation pump was a centrifugal type (15WG-200C) (PANDA, Shanghai, China) with a rated flow rate of 1.5 m3/h and rated head of 20 m. The electric heater with temperature controller (the offset uncertainty was ±0.5 °C) and variable heating powers from 1 kW to 6 kW. Cold water (30 °C) was connected to discharge the TES unit and ensure identical temperature initial conditions for each experiment. The operation modes of the experimental platform are listed in Table 2.
Table 2. Operation modes of the experimental platform.
Operation Mode On Off Charging mode (constant HTF inlet temperature)
Valve 1, Valve 2, Valve 3, Charging Pump
Valve 4, Valve 5, Valve 6, Valve 7, Valve 8, Valve 9, Discharging Pump
Charging mode (variable HTF inlet temperature)
Valve 1, Valve 3, Valve 6, Valve 7, Valve 8, Valve 9, Charging Pump
Valve 2, Valve 4, Valve 5, Discharging Pump
Discharging mode Valve 4, Valve 5, Discharging Pump
Valve 1, Valve 2, Valve 3, Valve 6, Valve 7, Valve 8, Valve 9, Charging Pump
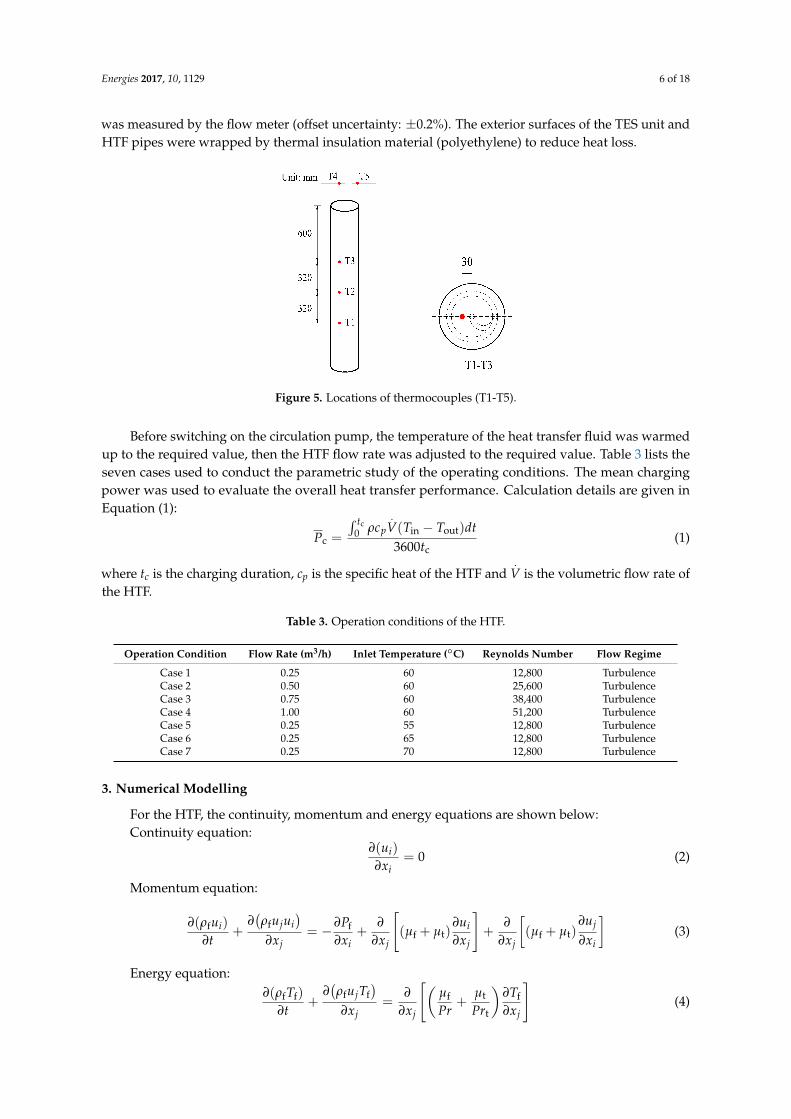
The temperature distribution of the PCM inside the TES unit was measured by three T-Type thermocouples at three locations (T1-T3 in Figure 5). Another two T-Type thermocouples (T4-T5 in Figure 5) were placed at the inlet and outlet of the TES unit to monitor the temperature of the heat transfer fluid (HTF). All five thermocouples were pre-calibrated (offset uncertainty: ±0.5 °C) and connected to a 34972A data acquisition instrument (Agilent, Santa Clara, CA, USA). The HTF flow rate was measured by the flow meter (offset uncertainty: ±0.2%). The exterior surfaces of the TES unit and HTF pipes were wrapped by thermal insulation material (polyethylene) to reduce heat loss.
Figure 4. Photos of the experimental platform: (a) Over view; (b) Solar collectors; (c) Electric heater;(d) TES unit.
The electric heater acts as an auxiliary resource when the sunshine is not sufficient. The circulationpump was a centrifugal type (15WG-200C) (PANDA, Shanghai, China) with a rated flow rate of1.5 m3/h and rated head of 20 m. The electric heater with temperature controller (the offset uncertaintywas ±0.5 ◦C) and variable heating powers from 1 kW to 6 kW. Cold water (30 ◦C) was connectedto discharge the TES unit and ensure identical temperature initial conditions for each experiment.The operation modes of the experimental platform are listed in Table 2.
Table 2. Operation modes of the experimental platform.
Operation Mode On Off
Charging mode (constant HTFinlet temperature)
Valve 1, Valve 2, Valve 3,Charging Pump
Valve 4, Valve 5, Valve 6, Valve 7,Valve 8, Valve 9, Discharging Pump
Charging mode (variable HTFinlet temperature)
Valve 1, Valve 3, Valve 6, Valve 7,Valve 8, Valve 9, Charging Pump
Valve 2, Valve 4, Valve 5,Discharging Pump
Discharging mode Valve 4, Valve 5,Discharging Pump
Valve 1, Valve 2, Valve 3, Valve 6,Valve 7, Valve 8, Valve 9,Charging Pump
The temperature distribution of the PCM inside the TES unit was measured by three T-Typethermocouples at three locations (T1-T3 in Figure 5). Another two T-Type thermocouples (T4-T5 inFigure 5) were placed at the inlet and outlet of the TES unit to monitor the temperature of the heattransfer fluid (HTF). All five thermocouples were pre-calibrated (offset uncertainty: ±0.5 ◦C) andconnected to a 34972A data acquisition instrument (Agilent, Santa Clara, CA, USA). The HTF flow rate
Energies 2017, 10, 1129 6 of 18
was measured by the flow meter (offset uncertainty: ±0.2%). The exterior surfaces of the TES unit andHTF pipes were wrapped by thermal insulation material (polyethylene) to reduce heat loss.Energies 2017, 10, 1129 6 of 17
Figure 5. Locations of thermocouples (T1-T5).
Before switching on the circulation pump, the temperature of the heat transfer fluid was warmed up to the required value, then the HTF flow rate was adjusted to the required value. Table 3 lists the seven cases used to conduct the parametric study of the operating conditions. The mean charging power was used to evaluate the overall heat transfer performance. Calculation details are given in Equation (1):
c
in ou0
c
.
ct
3600
t
pc T T dtVP
t
(1)
where tc is the charging duration, cp is the specific heat of the HTF and is the volumetric flow rate of the HTF.
Table 3. Operation conditions of the HTF.
Operation Condition Flow Rate (m3/h) Inlet Temperature (°C) Reynolds Number Flow RegimeCase 1 0.25 60 12,800 Turbulence Case 2 0.50 60 25,600 Turbulence Case 3 0.75 60 38,400 Turbulence Case 4 1.00 60 51,200 Turbulence Case 5 0.25 55 12,800 Turbulence Case 6 0.25 65 12,800 Turbulence Case 7 0.25 70 12,800 Turbulence
3. Numerical Modelling
For the HTF, the continuity, momentum and energy equations are shown below: Continuity equation:
0i
i
u
x
(2)
Momentum equation:
ff f
f t f t j i ji i
j i j j j i
u u uu P u
t x x x x x x
(3)
Energy equation:
f ff f tf f
t
j
j j j
u TT T
t x x Pr Pr x
(4)
Figure 5. Locations of thermocouples (T1-T5).
Before switching on the circulation pump, the temperature of the heat transfer fluid was warmedup to the required value, then the HTF flow rate was adjusted to the required value. Table 3 lists theseven cases used to conduct the parametric study of the operating conditions. The mean chargingpower was used to evaluate the overall heat transfer performance. Calculation details are given inEquation (1):
Pc =
∫ tc0 ρcp
.V(Tin − Tout)dt
3600tc(1)
where tc is the charging duration, cp is the specific heat of the HTF and.
V is the volumetric flow rate ofthe HTF.
Table 3. Operation conditions of the HTF.
Operation Condition Flow Rate (m3/h) Inlet Temperature (◦C) Reynolds Number Flow Regime
Case 1 0.25 60 12,800 TurbulenceCase 2 0.50 60 25,600 TurbulenceCase 3 0.75 60 38,400 TurbulenceCase 4 1.00 60 51,200 TurbulenceCase 5 0.25 55 12,800 TurbulenceCase 6 0.25 65 12,800 TurbulenceCase 7 0.25 70 12,800 Turbulence
3. Numerical Modelling
For the HTF, the continuity, momentum and energy equations are shown below:Continuity equation:
∂(ui)
∂xi= 0 (2)
Momentum equation:
∂(ρfui)
∂t+
∂(ρfujui
)∂xj
= −∂Pf∂xi
+∂
∂xj
[(µf + µt)
∂ui∂xj
]+
∂
∂xj
[(µf + µt)
∂uj
∂xi
](3)
Energy equation:∂(ρfTf)
∂t+
∂(ρfujTf
)∂xj
=∂
∂xj
[(µfPr
+µt
Prt
)∂Tf∂xj
](4)
Energies 2017, 10, 1129 7 of 18
The HTF flow regime for all cases is turbulent flow, and the standard k-ε model is applied.Turbulent kinetic energy transporting equation:
∂(ρfk)∂t
+∂(ρfujk
)∂xj
=∂
∂xj
[(µf +
µt
σk
)∂k∂xj
]+ Gk − ρfε (5)
Turbulent dissipation rate transporting equation:
∂(ρfε)
∂t+
∂(ρfµjε
)∂xj
=∂
∂xj
[(µf +
µt
σε
)∂ε
∂xj
]+ C1ε
ε
k(Gk)− C2ερf
ε2
k(6)
The turbulent viscosity:
µt = ρfCµk2
ε(7)
where:
Gk = µt
(∂ui∂xj
+∂uj
∂xi
)∂ui∂xj
(8)
The values of constants in Equations (5)–(8) are listed in Table 4 [42].
Table 4. Constants’ values.
Cµ C1ε C2ε σk σε
0.09 1.44 1.92 1.0 1.3
For the PCM, the enthalpy-porosity method [34–39] was applied to model the dynamic meltingprocess, modelling equations including the continuity, momentum, and energy equations areshown below:
Continuity equation:∂ρP
∂t+
∂(ρPui)
∂xi= 0 (9)
Momentum equation:
∂(ρPui)
∂t+
∂(ρPujui
)∂xj
= −∂PP
∂xi+ µ
∂
∂xj
(∂ui∂xj
)+ ρpgi + Si (10)
Energy equation:∂(ρph)
∂t+
∂(ρp∆H
)∂t
+∂(ρpuih
)∂xi
=∂
∂xi
(λ
∂T∂xi
)(11)
where H is the total enthalpy, which is the summation of the sensible enthalpy and latent enthalpy:
H = h + ∆H (12)
The sensible enthalpy h can be written as:
h = href +∫ T
Tref
cpdT (13)
where href is the reference enthalpy, Tref is the reference temperature.The latent enthalpy ∆H can be written as:
∆H = βL (14)
Energies 2017, 10, 1129 8 of 18
where L is the latent heat, β is the liquid fraction and can be expressed as:
β =
0, if T ≤ Ts
1, if Tl ≤ T(T − Ts)/(Tl − Ts), if Ts < T < Tl
(15)
The source term⇀S in Equation (10) is formulated as below:
⇀S = Amush
→u(1− β)2
β3 + χ(16)
where Amush is the mushy zone constant and varies between 104 and 107, according to previousliteratures, 105 is applied [43–46]. The constant χ is a small number to prevent division by zero.
For the HTF and PCM, the initial temperature equals to 30 ◦C:
Tf = TP = 30 , (t = 0) (17)
The inlet temperature and velocity of the HTF complies with Equation (18) as:
Tf = Tin, uz = uin, ux = 0, uy = 0, (t > 0) (18)
A few assumptions were made to simplify the CFD model; the detailed model assumptions are:
• The outer surface of the TES unit is adiabatic.• The thermal resistance of the heat exchanger tube is negligible.• The density of the PCM is subjected to the Boussinesq approximation [43–48].• The initial temperature of the TES unit is constant and uniform.
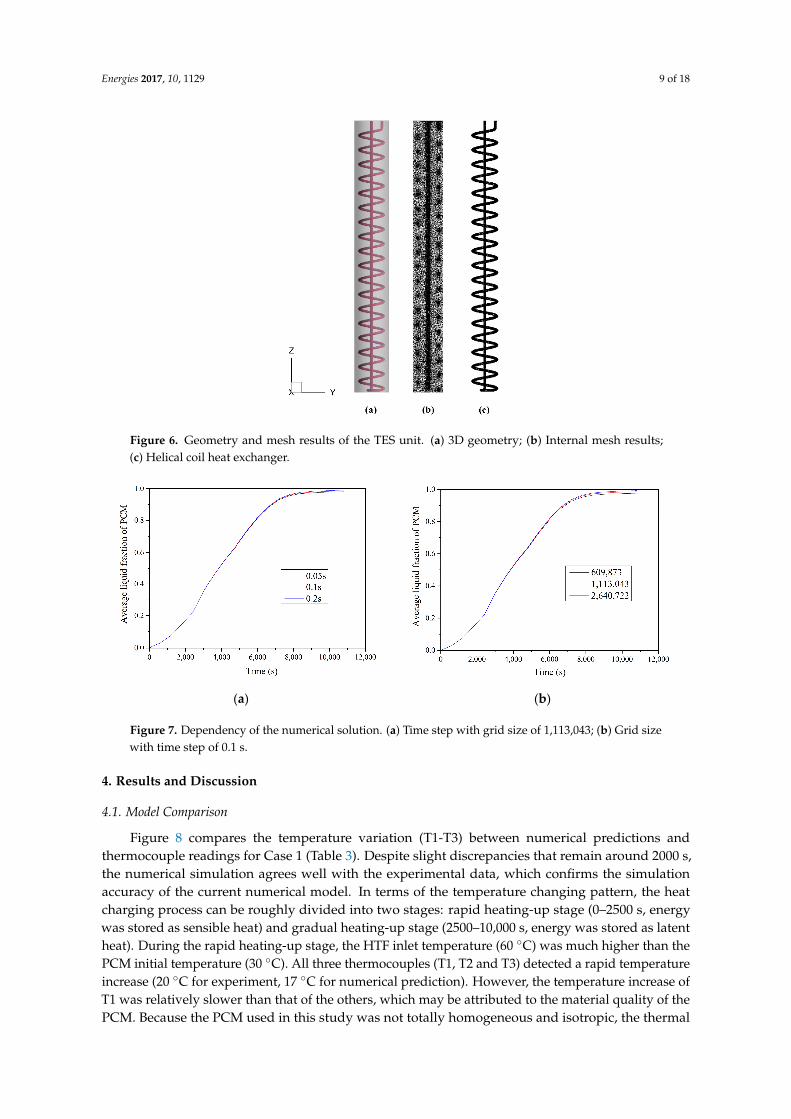
Figure 6 shows the 3D model and mesh results of the TES unit. Fluent 15.0 was used to meshthe TES unit and an unstructured mesh using tetrahedral cells was applied. All governing equationstogether with the boundary conditions over the whole domain were solved by the commercial CFDcode Fluent 15.0. The Semi-Implicit Method for Pressure-Linked Equations (SIMPLE) algorithm wasused for the pressure velocity coupling. The Pressure Staggering Option (PRESTO) scheme was appliedfor the pressure interpolation. The standard k− ε model was adopted to describe the turbulent flow ofHTF. The turbulent intensity and turbulent viscosity ratio for the HTF inlet were set as 5% and 10%,respectively. A second-order upwind scheme was adopted for the discretization of the momentumequation, energy equation, turbulent kinetic energy equation and dissipation rate equation. Solutionconvergence target was set as 10−7 for the energy equation and 10−3 for other variables. Independencytests had been conducted with three different meshes of 609,873, 1,113,043 and 2,640,722 grid elementsand three time steps of 0.05 s, 0.1 s and 0.2 s to eliminate the influence from the grid number and timestep on the average liquid fraction of PCM (Figure 7). The numerical results did not show significantchange as the number of grid elements increased to 2,640,722. In order to compromise the numericalaccuracy and computational resource and time, 1,113,043 grid elements and 0.1 s were chosen in thepresent numerical calculation.
Energies 2017, 10, 1129 9 of 18Energies 2017, 10, 1129 9 of 17
Figure 6. Geometry and mesh results of the TES unit. (a) 3D geometry; (b) Internal mesh results; (c) Helical coil heat exchanger.
(a) (b)
Figure 7. Dependency of the numerical solution. (a) Time step with grid size of 1,113,043; (b) Grid size with time step of 0.1 s.
4. Results and Discussion
4.1. Model Comparison
Figure 8 compares the temperature variation (T1-T3) between numerical predictions and thermocouple readings for Case 1 (Table 3). Despite slight discrepancies that remain around 2000 s, the numerical simulation agrees well with the experimental data, which confirms the simulation accuracy of the current numerical model. In terms of the temperature changing pattern, the heat charging process can be roughly divided into two stages: rapid heating-up stage (0–2500 s, energy was stored as sensible heat) and gradual heating-up stage (2500–10,000 s, energy was stored as latent heat). During the rapid heating-up stage, the HTF inlet temperature (60 °C) was much higher than the PCM initial temperature (30 °C). All three thermocouples (T1, T2 and T3) detected a rapid temperature increase (20 °C for experiment, 17 °C for numerical prediction). However, the temperature increase of T1 was relatively slower than that of the others, which may be attributed to the material quality of the PCM. Because the PCM used in this study was not totally homogeneous and isotropic, the thermal conductivity of the PCM in the vicinity of T1 diverged from its prescribed
Figure 6. Geometry and mesh results of the TES unit. (a) 3D geometry; (b) Internal mesh results;(c) Helical coil heat exchanger.
Energies 2017, 10, 1129 9 of 17
Figure 6. Geometry and mesh results of the TES unit. (a) 3D geometry; (b) Internal mesh results; (c) Helical coil heat exchanger.
(a) (b)
Figure 7. Dependency of the numerical solution. (a) Time step with grid size of 1,113,043; (b) Grid size with time step of 0.1 s.
4. Results and Discussion
4.1. Model Comparison
Figure 8 compares the temperature variation (T1-T3) between numerical predictions and thermocouple readings for Case 1 (Table 3). Despite slight discrepancies that remain around 2000 s, the numerical simulation agrees well with the experimental data, which confirms the simulation accuracy of the current numerical model. In terms of the temperature changing pattern, the heat charging process can be roughly divided into two stages: rapid heating-up stage (0–2500 s, energy was stored as sensible heat) and gradual heating-up stage (2500–10,000 s, energy was stored as latent heat). During the rapid heating-up stage, the HTF inlet temperature (60 °C) was much higher than the PCM initial temperature (30 °C). All three thermocouples (T1, T2 and T3) detected a rapid temperature increase (20 °C for experiment, 17 °C for numerical prediction). However, the temperature increase of T1 was relatively slower than that of the others, which may be attributed to the material quality of the PCM. Because the PCM used in this study was not totally homogeneous and isotropic, the thermal conductivity of the PCM in the vicinity of T1 diverged from its prescribed
Figure 7. Dependency of the numerical solution. (a) Time step with grid size of 1,113,043; (b) Grid sizewith time step of 0.1 s.
4. Results and Discussion
4.1. Model Comparison
Figure 8 compares the temperature variation (T1-T3) between numerical predictions andthermocouple readings for Case 1 (Table 3). Despite slight discrepancies that remain around 2000 s,the numerical simulation agrees well with the experimental data, which confirms the simulationaccuracy of the current numerical model. In terms of the temperature changing pattern, the heatcharging process can be roughly divided into two stages: rapid heating-up stage (0–2500 s, energywas stored as sensible heat) and gradual heating-up stage (2500–10,000 s, energy was stored as latentheat). During the rapid heating-up stage, the HTF inlet temperature (60 ◦C) was much higher than thePCM initial temperature (30 ◦C). All three thermocouples (T1, T2 and T3) detected a rapid temperatureincrease (20 ◦C for experiment, 17 ◦C for numerical prediction). However, the temperature increase ofT1 was relatively slower than that of the others, which may be attributed to the material quality of thePCM. Because the PCM used in this study was not totally homogeneous and isotropic, the thermal

Energies 2017, 10, 1129 10 of 18
conductivity of the PCM in the vicinity of T1 diverged from its prescribed value. Consequently, the T1temperature was lower than other two thermocouple locations during the first stage. In addition,the slight temperature discrepancies of T1-T3 between the numerical value and experimental dataaround 2000 s were attributed to the simplified PCM property in the numerical simulation. The PCMused in the experiment was mixed with a small amount of expand graphite (2 wt %) to enhance thethermal conductivity, which slightly weakened the specific heat of the PCM. However, the PCM wassimplified as pure in the numerical model. Therefore, the temperature rise of T1-T3 was little faster forexperiment in the sensible heat storage stage. For the gradual heating-up stage, the PCM temperaturerise was much slower than the previous stage (only 6 ◦C for experiment and 8 ◦C for numericalprediction). As circled in Figure 8, a vertical temperature stratification was established. In particular,the stratification was more apparent in numerical predictions compared with that in experimentaldata. This discrepancy was also attributed to the simplified PCM property in the numerical simulation.The existence of expand graphite weakens the natural convection [35,36]. However, in the numericalmodel, the natural convection was only considered by applying Boussinesq approximation withoutconsidering the effect of expanding graphite.
Energies 2017, 10, 1129 10 of 17
value. Consequently, the T1 temperature was lower than other two thermocouple locations during the first stage. In addition, the slight temperature discrepancies of T1-T3 between the numerical value and experimental data around 2000 s were attributed to the simplified PCM property in the numerical simulation. The PCM used in the experiment was mixed with a small amount of expand graphite (2 wt %) to enhance the thermal conductivity, which slightly weakened the specific heat of the PCM. However, the PCM was simplified as pure in the numerical model. Therefore, the temperature rise of T1-T3 was little faster for experiment in the sensible heat storage stage. For the gradual heating-up stage, the PCM temperature rise was much slower than the previous stage (only 6 °C for experiment and 8 °C for numerical prediction). As circled in Figure 8, a vertical temperature stratification was established. In particular, the stratification was more apparent in numerical predictions compared with that in experimental data. This discrepancy was also attributed to the simplified PCM property in the numerical simulation. The existence of expand graphite weakens the natural convection [35,36]. However, in the numerical model, the natural convection was only considered by applying Boussinesq approximation without considering the effect of expanding graphite.
Figure 8. Experimental and numerical temperature profiles of thermocouples inside the TES unit over time for Case 1.
4.2. Effect of Natural Convection on the Charging Process
In this section, two case studies were numerically conducted (Table 5).
Table 5. Numerical settings for the two cases.
Case HTF Flow Rate (m3/h) HTF Inlet Temperature (°C) Heat Transfer Mechanisms A 0.25 60 Heat conduction B 0.25 60 Heat conduction & natural convection
The temperature distribution and liquid fraction over time are shown in Figure 9 for Case A and Figure 10 for Case B, respectively.
Figure 8. Experimental and numerical temperature profiles of thermocouples inside the TES unit overtime for Case 1.
4.2. Effect of Natural Convection on the Charging Process
In this section, two case studies were numerically conducted (Table 5).
Table 5. Numerical settings for the two cases.
Case HTF Flow Rate (m3/h) HTF Inlet Temperature (◦C) Heat Transfer Mechanisms
A 0.25 60 Heat conduction
B 0.25 60 Heat conduction & naturalconvection
The temperature distribution and liquid fraction over time are shown in Figure 9 for Case A andFigure 10 for Case B, respectively.
Energies 2017, 10, 1129 11 of 18Energies 2017, 10, 1129 11 of 17
(a)
(b)
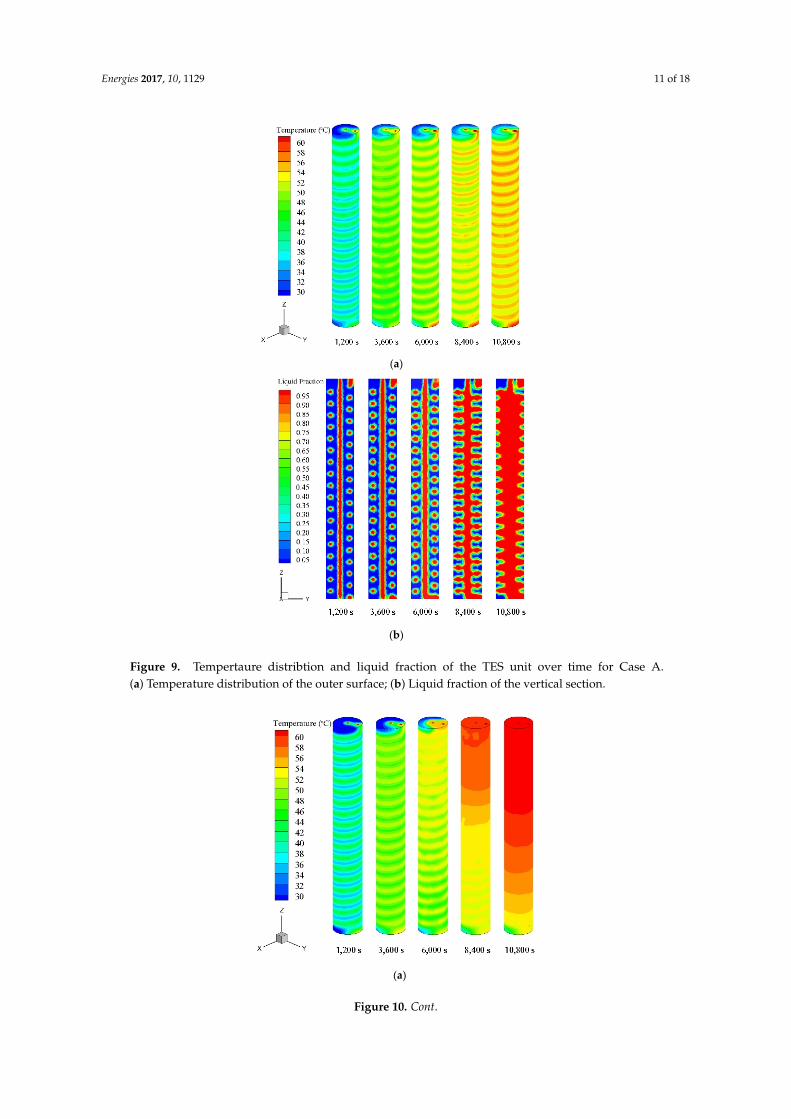
Figure 9. Tempertaure distribtion and liquid fraction of the TES unit over time for Case A. (a) Temperature distribution of the outer surface; (b) Liquid fraction of the vertical section.
(a)
Figure 9. Tempertaure distribtion and liquid fraction of the TES unit over time for Case A.(a) Temperature distribution of the outer surface; (b) Liquid fraction of the vertical section.
Energies 2017, 10, 1129 11 of 17
(a)
(b)
Figure 9. Tempertaure distribtion and liquid fraction of the TES unit over time for Case A. (a) Temperature distribution of the outer surface; (b) Liquid fraction of the vertical section.
(a)
Figure 10. Cont.

Energies 2017, 10, 1129 12 of 18Energies 2017, 10, 1129 12 of 17
(b)
Figure 10. Tempertaure distribtion and liquid fraction of the TES unit over time for Case B. (a) Temperature distribution of the outer surface; (b) Liquid fraction of the vertical section.
For Case A (Figure 9), the high temperature regions and liquid phase distribution showed a spiral pattern, which corresponding to the shape of internal helical coil heat exchanger and indicated the melting process starts from the helical coil exterior and expands outwards during the charging time (1200–10,800 s). Figure 9 shows the results generated by the numerical simulation including both heat conduction and natural convection effects (Case B). At the beginning, similar temperature and liquid phase distributions with those of Case A were found for 1200 s and 3600 s. Afterwards, a vertical temperature stratification occurred for all remaining timepoints (from 6000 s to 10,800 s). This is because at the beginning, heat conduction remains the main contributor for the melting process, whereas the natural convection does not engage due to insufficient liquid phase. After a while of energy charging, as the accumulation of melted liquid phase, sluggish fluid flow occurs vertically due to the buoyancy effect. As a result, a temperature stratification is established, and majority of the TES unit was heated up to 60 °C. The average temperatures of PCM over time for two cases are shown in Figure 11a, while the average liquid fractions of PCM are shown in Figure 11b.
(a) (b)
Figure 11. (a) Average temperatures of PCM over time; (b) Average liquid fractions of PCM over time.
From Figure 11, it can be seen that the PCM average temperature of Case B is 20.5% higher than that of Case A at 10,800 s. The average liquid fraction of Case B is 63.3% higher than that of
Figure 10. Tempertaure distribtion and liquid fraction of the TES unit over time for Case B.(a) Temperature distribution of the outer surface; (b) Liquid fraction of the vertical section.
For Case A (Figure 9), the high temperature regions and liquid phase distribution showed aspiral pattern, which corresponding to the shape of internal helical coil heat exchanger and indicatedthe melting process starts from the helical coil exterior and expands outwards during the chargingtime (1200–10,800 s). Figure 9 shows the results generated by the numerical simulation includingboth heat conduction and natural convection effects (Case B). At the beginning, similar temperatureand liquid phase distributions with those of Case A were found for 1200 s and 3600 s. Afterwards,a vertical temperature stratification occurred for all remaining timepoints (from 6000 s to 10,800 s).This is because at the beginning, heat conduction remains the main contributor for the melting process,whereas the natural convection does not engage due to insufficient liquid phase. After a while ofenergy charging, as the accumulation of melted liquid phase, sluggish fluid flow occurs vertically dueto the buoyancy effect. As a result, a temperature stratification is established, and majority of the TESunit was heated up to 60 ◦C. The average temperatures of PCM over time for two cases are shown inFigure 11a, while the average liquid fractions of PCM are shown in Figure 11b.
Energies 2017, 10, 1129 12 of 17
(b)
Figure 10. Tempertaure distribtion and liquid fraction of the TES unit over time for Case B. (a) Temperature distribution of the outer surface; (b) Liquid fraction of the vertical section.
For Case A (Figure 9), the high temperature regions and liquid phase distribution showed a spiral pattern, which corresponding to the shape of internal helical coil heat exchanger and indicated the melting process starts from the helical coil exterior and expands outwards during the charging time (1200–10,800 s). Figure 9 shows the results generated by the numerical simulation including both heat conduction and natural convection effects (Case B). At the beginning, similar temperature and liquid phase distributions with those of Case A were found for 1200 s and 3600 s. Afterwards, a vertical temperature stratification occurred for all remaining timepoints (from 6000 s to 10,800 s). This is because at the beginning, heat conduction remains the main contributor for the melting process, whereas the natural convection does not engage due to insufficient liquid phase. After a while of energy charging, as the accumulation of melted liquid phase, sluggish fluid flow occurs vertically due to the buoyancy effect. As a result, a temperature stratification is established, and majority of the TES unit was heated up to 60 °C. The average temperatures of PCM over time for two cases are shown in Figure 11a, while the average liquid fractions of PCM are shown in Figure 11b.
(a) (b)
Figure 11. (a) Average temperatures of PCM over time; (b) Average liquid fractions of PCM over time.
From Figure 11, it can be seen that the PCM average temperature of Case B is 20.5% higher than that of Case A at 10,800 s. The average liquid fraction of Case B is 63.3% higher than that of
Figure 11. (a) Average temperatures of PCM over time; (b) Average liquid fractions of PCM over time.
From Figure 11, it can be seen that the PCM average temperature of Case B is 20.5% higher thanthat of Case A at 10,800 s. The average liquid fraction of Case B is 63.3% higher than that of Case A at

Energies 2017, 10, 1129 13 of 18
10,800 s. Thus indicates that the natural convection greatly affects the simulation results, especiallyduring the gradual heating-up stage, therefore, the buoyancy effect of the PCM should be consideredin actual applications.
4.3. Effects of HTF Inlet Parameters
Figure 12 shows the experimental and numerical HTF outlet temperature variations for Case1–Case 7. In general, both results reached a stable value shortly after a rapid increase. This is becauseduring the initial period of the charging process, the melting of PCM did not occur and the PCM storedthe energy in sensible form. The temperature of the PCM around the helical heat exchanger increasedfrom the initial value (30 ◦C) to the melting temperature rapidly, which led to a relatively low heattransfer rate between the HTF and PCM as well as a rapid increase of the HTF outlet temperature.When the temperature of the PCM around the helical heat exchanger exceeded the melting temperature,the melting process of PCM initiated. Latent energy was stored in PCM with a small PCM temperaturevariation around the melting point, which led to a faster heat transfer rate between the HTF andPCM as well as a slight variation of the HTF outlet temperature. It was also found that the averagecharging time and the HTF outlet temperature of numerical results are less than that of experimentalresults. This may attribute to model simplifications of the PCM thermal properties. Consequently,the numerical model shows a better heat transfer performance.
As shown in Figure 12a, if the HTF inlet temperature was kept unchanged (60 ◦C), the increaseof the HTF flow rate can only raise the HTF outlet temperature, and the charging times were almostthe same. As shown in Figure 12b, if the HTF flow rate was kept as 0.25 m3/h, the charging timefor HTF inlet temperature of 55 ◦C was 13,700 s. Once the HTF inlet temperature increased to 70 ◦C,the charging time reduced to 5600 s, which was less than half of the value at 55 ◦C.
Energies 2017, 10, 1129 13 of 17
Case A at 10,800 s. Thus indicates that the natural convection greatly affects the simulation results, especially during the gradual heating-up stage, therefore, the buoyancy effect of the PCM should be considered in actual applications.
4.3. Effects of HTF Inlet Parameters
Figure 12 shows the experimental and numerical HTF outlet temperature variations for Case 1–Case 7. In general, both results reached a stable value shortly after a rapid increase. This is because during the initial period of the charging process, the melting of PCM did not occur and the PCM stored the energy in sensible form. The temperature of the PCM around the helical heat exchanger increased from the initial value (30 °C) to the melting temperature rapidly, which led to a relatively low heat transfer rate between the HTF and PCM as well as a rapid increase of the HTF outlet temperature. When the temperature of the PCM around the helical heat exchanger exceeded the melting temperature, the melting process of PCM initiated. Latent energy was stored in PCM with a small PCM temperature variation around the melting point, which led to a faster heat transfer rate between the HTF and PCM as well as a slight variation of the HTF outlet temperature. It was also found that the average charging time and the HTF outlet temperature of numerical results are less than that of experimental results. This may attribute to model simplifications of the PCM thermal properties. Consequently, the numerical model shows a better heat transfer performance.
As shown in Figure 12a, if the HTF inlet temperature was kept unchanged (60 °C), the increase of the HTF flow rate can only raise the HTF outlet temperature, and the charging times were almost the same. As shown in Figure 12b, if the HTF flow rate was kept as 0.25 m3/h, the charging time for HTF inlet temperature of 55 °C was 13,700 s. Once the HTF inlet temperature increased to 70 °C, the charging time reduced to 5600 s, which was less than half of the value at 55 °C.
(a)
(b)
Figure 12. Experimental and numerical outlet temperature profiles over time for Case 1–7. (a) Case 1, Case 2, Case 3 and Case 4; (b) Case 1, Case 5, Case 6 and Case 7.
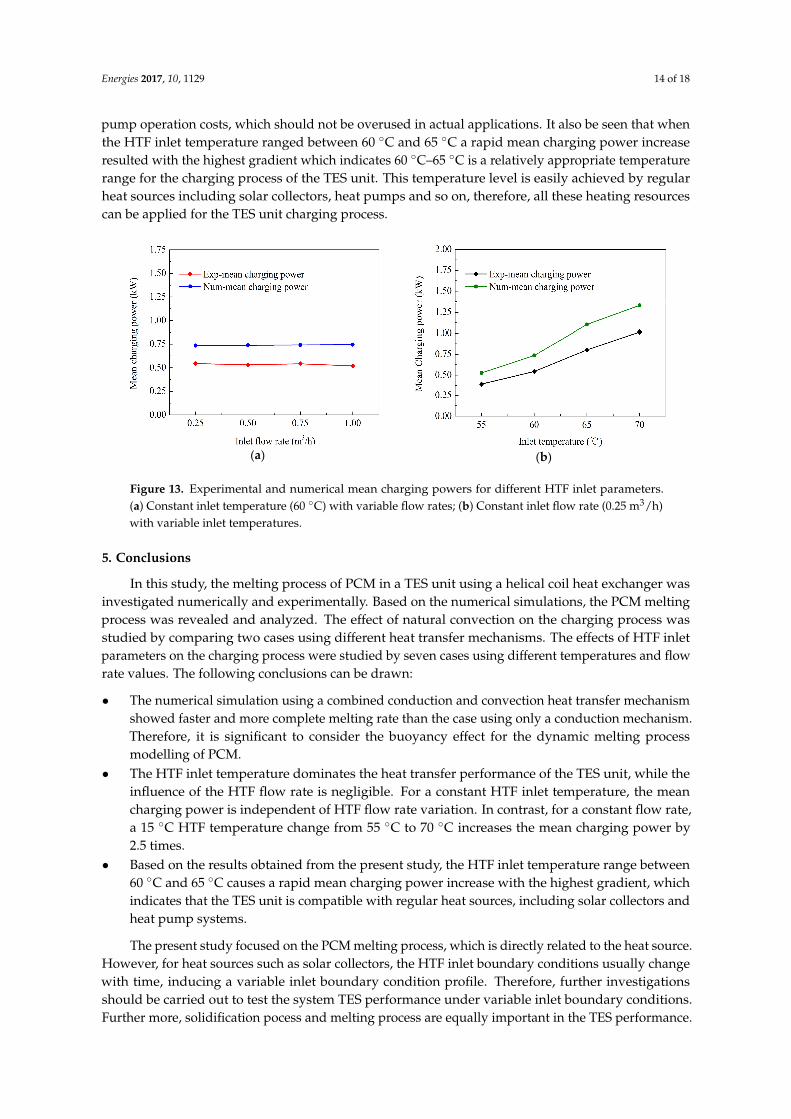
Figure 13 shows that the HTF inlet temperature can affect the mean charging power greatly, while the flow rate variation hardly has any influence on it. For a constant HTF inlet temperature (60 °C), the mean charging power was independent of flow rate variation, remaining at 0.75 kW and 0.53 kW for the numerical result and experimental result, respectively. In contrast, for a constant flow rate (0.25 m3/h), a 15 °C HTF temperature change from 55 °C to 70 °C increased the mean charging power by more than double (from 0.53 kW to 1.25 kW). This can be attributed to the following reasons: firstly, the higher inlet temperature induces a larger temperature difference between the heat exchanger and PCM, which contributes to intense heat conduction and natural convection. Secondly, the forced convection coefficient of HTF inside the heat exchanger rises as the HTF flow rate increases, indicating a decreased thermal resistance [25]. However, an excessive increase of HTF flow rate can amplify the pump operation costs, which should not be overused in actual applications. It also be seen that when the HTF inlet temperature ranged between 60 °C and 65 °C a rapid mean charging power increase resulted with the highest gradient which indicates 60 °C–65 °C is a relatively
Figure 12. Experimental and numerical outlet temperature profiles over time for Case 1–7. (a) Case 1,Case 2, Case 3 and Case 4; (b) Case 1, Case 5, Case 6 and Case 7.
Figure 13 shows that the HTF inlet temperature can affect the mean charging power greatly, whilethe flow rate variation hardly has any influence on it. For a constant HTF inlet temperature (60 ◦C),the mean charging power was independent of flow rate variation, remaining at 0.75 kW and 0.53 kWfor the numerical result and experimental result, respectively. In contrast, for a constant flow rate(0.25 m3/h), a 15 ◦C HTF temperature change from 55 ◦C to 70 ◦C increased the mean charging powerby more than double (from 0.53 kW to 1.25 kW). This can be attributed to the following reasons: firstly,the higher inlet temperature induces a larger temperature difference between the heat exchanger andPCM, which contributes to intense heat conduction and natural convection. Secondly, the forcedconvection coefficient of HTF inside the heat exchanger rises as the HTF flow rate increases, indicatinga decreased thermal resistance [25]. However, an excessive increase of HTF flow rate can amplify the
Energies 2017, 10, 1129 14 of 18
pump operation costs, which should not be overused in actual applications. It also be seen that whenthe HTF inlet temperature ranged between 60 ◦C and 65 ◦C a rapid mean charging power increaseresulted with the highest gradient which indicates 60 ◦C–65 ◦C is a relatively appropriate temperaturerange for the charging process of the TES unit. This temperature level is easily achieved by regularheat sources including solar collectors, heat pumps and so on, therefore, all these heating resourcescan be applied for the TES unit charging process.
Energies 2017, 10, 1129 14 of 17
appropriate temperature range for the charging process of the TES unit. This temperature level is easily achieved by regular heat sources including solar collectors, heat pumps and so on, therefore, all these heating resources can be applied for the TES unit charging process.
(a)
(b)
Figure 13. Experimental and numerical mean charging powers for different HTF inlet parameters. (a) Constant inlet temperature (60 °C) with variable flow rates; (b) Constant inlet flow rate (0.25 m3/h) with variable inlet temperatures.
5. Conclusions
In this study, the melting process of PCM in a TES unit using a helical coil heat exchanger was investigated numerically and experimentally. Based on the numerical simulations, the PCM melting process was revealed and analyzed. The effect of natural convection on the charging process was studied by comparing two cases using different heat transfer mechanisms. The effects of HTF inlet parameters on the charging process were studied by seven cases using different temperatures and flow rate values. The following conclusions can be drawn:
The numerical simulation using a combined conduction and convection heat transfer mechanism showed faster and more complete melting rate than the case using only a conduction mechanism. Therefore, it is significant to consider the buoyancy effect for the dynamic melting process modelling of PCM.
The HTF inlet temperature dominates the heat transfer performance of the TES unit, while the influence of the HTF flow rate is negligible. For a constant HTF inlet temperature, the mean charging power is independent of HTF flow rate variation. In contrast, for a constant flow rate, a 15 °C HTF temperature change from 55 °C to 70 °C increases the mean charging power by 2.5 times.
Based on the results obtained from the present study, the HTF inlet temperature range between 60 °C and 65 °C causes a rapid mean charging power increase with the highest gradient, which indicates that the TES unit is compatible with regular heat sources, including solar collectors and heat pump systems.
The present study focused on the PCM melting process, which is directly related to the heat source. However, for heat sources such as solar collectors, the HTF inlet boundary conditions usually change with time, inducing a variable inlet boundary condition profile. Therefore, further investigations should be carried out to test the system TES performance under variable inlet boundary conditions. Further more, solidification pocess and melting process are equally important in the TES performance. The solidification process of TES unit is a key focus for the heat utlization and should be examined in subsequent studies.
Acknowledgments: This research is financially supported by the Science and Technology Ministry of China (Project No. 2016YFC0700406), National Natural Science Foundation of China (51576023), the 111 Project (No. B13041) and the Fundamental Research Funds for the Central Universities (Project ID: 106112016CDJCR211221).
Figure 13. Experimental and numerical mean charging powers for different HTF inlet parameters.(a) Constant inlet temperature (60 ◦C) with variable flow rates; (b) Constant inlet flow rate (0.25 m3/h)with variable inlet temperatures.
5. Conclusions
In this study, the melting process of PCM in a TES unit using a helical coil heat exchanger wasinvestigated numerically and experimentally. Based on the numerical simulations, the PCM meltingprocess was revealed and analyzed. The effect of natural convection on the charging process wasstudied by comparing two cases using different heat transfer mechanisms. The effects of HTF inletparameters on the charging process were studied by seven cases using different temperatures and flowrate values. The following conclusions can be drawn:
• The numerical simulation using a combined conduction and convection heat transfer mechanismshowed faster and more complete melting rate than the case using only a conduction mechanism.Therefore, it is significant to consider the buoyancy effect for the dynamic melting processmodelling of PCM.
• The HTF inlet temperature dominates the heat transfer performance of the TES unit, while theinfluence of the HTF flow rate is negligible. For a constant HTF inlet temperature, the meancharging power is independent of HTF flow rate variation. In contrast, for a constant flow rate,a 15 ◦C HTF temperature change from 55 ◦C to 70 ◦C increases the mean charging power by2.5 times.
• Based on the results obtained from the present study, the HTF inlet temperature range between60 ◦C and 65 ◦C causes a rapid mean charging power increase with the highest gradient, whichindicates that the TES unit is compatible with regular heat sources, including solar collectors andheat pump systems.
The present study focused on the PCM melting process, which is directly related to the heat source.However, for heat sources such as solar collectors, the HTF inlet boundary conditions usually changewith time, inducing a variable inlet boundary condition profile. Therefore, further investigationsshould be carried out to test the system TES performance under variable inlet boundary conditions.Further more, solidification pocess and melting process are equally important in the TES performance.

Energies 2017, 10, 1129 15 of 18
The solidification process of TES unit is a key focus for the heat utlization and should be examined insubsequent studies.
Acknowledgments: This research is financially supported by the Science and Technology Ministry of China(Project No. 2016YFC0700406), National Natural Science Foundation of China (51576023), the 111 Project (No. B13041)and the Fundamental Research Funds for the Central Universities (Project ID: 106112016CDJCR211221).
Author Contributions: Yong Wang, Xun Yang and Teng Xiong conceived and designed the experiments. Xun Yangand Teng Xiong carried out the experiments. Xun Yang, Teng Xiong and Jingliang Dong analyzed the data and allauthors discussed the results. Xun Yang, Teng Xiong, Jingliang Dong and Wenxin Li wrote the paper.
Conflicts of Interest: The authors declare no conflict of interest.
Nomenclature
dh helical coil tube diameter (m)lh coil pitch (m)Dh coil diameter (m)Hs shell height (m)Ds shell diameter (m)cp specific heat (J/(kg·K))T temperature (◦C)L latent heat (kJ/kg)λ thermal conductivity (W/(m·K))t time (s)Pc mean power (kW)P pressure (Pa)H total enthalpy (J/kg)h sensible enthalpy (J/kg)∆H latent enthalpy (J/kg)Amush mush zone constantg gravity acceleration vector (m/s2)S source term.
V volume flow rate (m3/h)u velocity vector(m/s)Pr Prandtl numberk turbulent kinetic energy (J/kg)Greek letterρ density (kg/m3)α thermal expansion coefficient (K–1)µ dynamic viscosity (kg/(m·s))β liquid fractionχ small numberµt turbulent viscosity (kg/(m·s))ε turbulent dissipation rate (W/kg)Subscriptss solidusl liquidusm meltingc chargingf heat transfer fluidP phase change materialt turbulencein inletout outletref reference

Energies 2017, 10, 1129 16 of 18
References
1. Thygesen, R. An analysis of different solar-assisted heating systems and their effect on the energyperformance of multifamily buildings—A Swedish case. Energies 2017, 10, 88. [CrossRef]
2. Ko, M.J. Multi-objective optimization design for indirect forced-circulation solar water heating system usingNSGA-II. Energies 2015, 8, 13137–13161. [CrossRef]
3. Ko, M.J. A novel design method for optimizing an indirect forced circulation solar water heating systembased on life cycle cost using a genetic algorithm. Energies 2015, 8, 11592–11617. [CrossRef]
4. Ko, M.J. Analysis and optimization design of a solar water heating system based on life cycle cost using agenetic algorithm. Energies 2015, 8, 11380–11403. [CrossRef]
5. Lin, W.M.; Chang, K.C.; Liu, Y.M.; Chung, K.M. Field surveys of non-residential solar water heating systemsin Taiwan. Energies 2012, 5, 258–269. [CrossRef]
6. Hugo, A.; Zmeureanu, R. Residential solar-based seasonal thermal storage systems in cold climates: buildingenvelope and thermal storage. Energies 2012, 5, 3792–3985. [CrossRef]
7. Bernardo, L.R. Retrofitting conventional electric domestic hot water heaters to solar water heating systemsin single-family houses—Model validation and optimization. Energies 2013, 6, 953–972. [CrossRef]
8. Moretti, E.; Bonamente, E.; Buratti, C.; Cotana, F. Development of innovative heating and cooling systemsusing renewable energy sources for non-residential buildings. Energies 2013, 6, 5114–5129. [CrossRef]
9. Bernardo, L.R.; Davidsson, H.; Karlsson, B. Retrofitting domestic hot water heaters for solar water heatingsystems in single-family houses in a cold climate: A theoretical analysis. Energies 2012, 5, 4110–4131.[CrossRef]
10. Calise, F.; Capuano, D.; Vanoli, L. Dynamic simulation and exergo-economic optimization of a hybridsolar–geothermal cogeneration plant. Energies 2015, 8, 260–2646. [CrossRef]
11. Buker, M.S.; Mempouo, B.; Riffat, S.B. Performance evaluation and techno-economic analysis of a novelbuilding integrated PV/T roof collector: An experimental validation. Energy Build. 2014, 76, 164–175.[CrossRef]
12. Buker, M.S.; Riffat, S.B. Build-up and performance test of a novel solar thermal roof for heat pump operation.Int. J. Ambient Energy 2017, 38, 365–379. [CrossRef]
13. Buker, M.S.; Riffat, S.B. Building integrated solar thermal collectors—A review. Renew. Sustain. Energy Rev.2015, 51, 327–346. [CrossRef]
14. Sun, L.L.; Li, M.; Yuan, Y.P.; Cao, X.L.; Lei, B.; Yu, N.Y. Effect of tilt angle and connection mode of PVTmodules on the energy efficiency of a hot water system for high-rise residential buildings. Renew. Energy2016, 93, 291–301. [CrossRef]
15. Jamar, A.; Majid, Z.A.A.; Azmi, W.H.; Norhafana, M.; Razak, A.A. A review of water heating system forsolar energy applications. Int. J. Heat Mass Transfer 2016, 76, 178–187. [CrossRef]
16. Gautam, A.; Chamoli, S.; Kumara, A.; Singh, S. A review on technical improvements, economic feasibilityand world scenario of solar water heating system. Renew. Sustain. Energy Rev. 2017, 68, 541–562. [CrossRef]
17. Tian, Y.; Zhao, C.Y. A review of solar collectors and thermal energy storage in solar thermal applications.Appl. Energy 2013, 104, 538–553. [CrossRef]
18. Pan, Y. Some opinions on solar energy hot water heating for buildings in Qinghai-Tibetan plateau. HV AC2013, 43, 15–22.
19. Jiang, Y.; Rong, X.; Feng, Y.; Pan, Y.; Fu, X. Discussion for urban heating mode for Lhasa. HVAC 2013, 43, 1–7.20. Yuan, Y.P.; Zhang, N.; Tao, W.Q.; Cao, X.L.; He, Y.L. Fatty acids as phase change materials: A review.
Renew. Sustain. Energy Rev. 2014, 29, 482–498. [CrossRef]21. Yuan, Y.P.; Zhang, N.; Li, T.Y.; Cao, X.L.; Long, W.Y. Thermal performance enhancement of palmitic-stearic
acid by adding graphene nanoplatelets and expanded graphite for thermal energy storage: A comparativestudy. Energy 2016, 97, 488–497. [CrossRef]
22. Yuan, Y.P.; Cao, X.L.; Xiang, B.; Du, Y.X. Effect of installation angle of fins on melting characteristics ofannular unit for latent heat thermal energy storage. Sol. Energy 2016, 136, 365–378. [CrossRef]
23. Dannemand, M.; Johansen, J.B.; Kong, W.; Furbo, S. Experimental investigations on cylindrical latent heatstorage units with sodium acetate trihydrate composites utilizing supercooling. Appl. Energy 2016, 177,591–601. [CrossRef]

Energies 2017, 10, 1129 17 of 18
24. Yazici, M.Y.; Avci, M.; Aydin, O.; Akgun, M. Effect of eccentricity on melting behavior of paraffin in ahorizontal tube-in-shell storage unit: An experimental study. Solar Energy 2014, 101, 291–298. [CrossRef]
25. Murray, R.E.; Groulx, D. Experimental study of the phase change and energy characteristics inside acylindrical latent heat energy storage system: Part 1 consecutive charging and discharging. Renew. Energy2014, 62, 571–581. [CrossRef]
26. Murray, R.E.; Groulx, D. Experimental study of the phase change and energy characteristics inside acylindrical latent heat energy storage system: Part 2 simultaneous charging and discharging. Renew. Energy2014, 63, 724–734. [CrossRef]
27. Gasia, J.; Tay, N.H.S.; Belusko, M.; Cabeza, L.F.; Bruno, F. Experimental investigation of the effect of dynamicmelting in a cylindrical shell-and-tube heat exchanger using water as PCM. Appl. Energy 2017, 185, 136–145.[CrossRef]
28. Kalaiselvam, S.; Veerappan, M.; Aaron, A.A.; Iniyan, S. Experimental and analytical investigation ofsolidification and melting characteristics of PCMs inside cylindrical encapsulation. Int. J. Therm. Sci.2008, 47, 858–874. [CrossRef]
29. Mosaffa, A.H.; Talati, F.; Tabrizi, H.B.; Rosenc, M.A. Analytical modeling of PCM solidification in a shell andtube finned thermal storage for air conditioning systems. Energy Build. 2012, 49, 356–361. [CrossRef]
30. Xu, Y.; He, Y.L.; Li, Y.Q.; Song, H.J. Exergy efficiency and optimization of charging-discharging processes oflatent heat thermal energy storage system with three phase change materials. Solar Energy 2016, 123, 206–216.[CrossRef]
31. Bechiri, M.; Mansouri, K. Analytical solution of heat transfer in a shell-and-tube latent thermal energystorage system. Renew. Energy 2015, 74, 825–838. [CrossRef]
32. Bechiri, M.; Mansouri, K. Analytical study of heat generation effects on melting and solidification ofnano-enhanced PCM inside a horizontal cylindrical enclosure. Appl. Therm. Eng. 2016, 104, 779–790.[CrossRef]
33. Fan, L.W.; Zhu, Z.Q.; Xiao, S.L.; Liu, M.J.; Lu, H.; Zeng, Y.; Yu, Z.T.; Cen, K.F. An experimental and numericalinvestigation of constrained melting heat transfer of a phase change material in a circumferentially finnedspherical capsule for thermal energy storage. Appl. Therm. Eng. 2016, 100, 1063–1075. [CrossRef]
34. Li, Z.; Wu, Z.G. Analysis of HTFs, PCMs and fins effects on thermal performance of shell-tube thermalenergy storage units. Sol. Energy 2015, 122, 382–395. [CrossRef]
35. Xiao, X.; Zhang, P. Numerical and experimental study of heat transfer characteristics of a shell-tube latentheat storage system: Part I-Charging process. Energy 2015, 79, 337–350. [CrossRef]
36. Xiao, X.; Zhang, P. Numerical and experimental study of heat transfer characteristics of a shell-tube latentheat storage system: Part II-Discharging process. Energy 2015, 80, 177–189. [CrossRef]
37. Tay, N.H.S.; Belusko, M.; Liu, M.; Bruno, F. Investigation of the effect of dynamic melting in a tube-in-tankPCM system using a CFD model. Appl. Energy 2015, 137, 738–747. [CrossRef]
38. Archibold, A.R.; Gonzalez-Aguilar, J.; Rahman, M.M.; Goswami, D.Y.; Romero, M.; Stefanakos, E.K. Themelting process of storage materials with relatively high phase change temperatures in partially filledspherical shells. Appl. Energy 2014, 116, 243–252. [CrossRef]
39. Fornarelli, F.; Camporeale, S.M.; Fortunato, B.; Torresi, M.; Oresta, P.; Magliocchetti, L.; Miliozzi, A.; Santo, G.CFD analysis of melting process in a shell-and-tube latent heat storage for concentrated solar power plants.Appl. Energy 2016, 164, 711–722. [CrossRef]
40. Tao, Y.B.; Carey, V.P. Effects of PCM thermophysical properties on thermal storage performance of ashell-and-tube latent heat storage unit. Appl. Energy 2016, 179, 203–210. [CrossRef]
41. Guo, J.; Huai, X. Numerical investigation of helically coiled tube from the viewpoint of field synergyprinciple. Appl. Therm. Eng. 2016, 98, 137–143. [CrossRef]
42. Basha, S.A.; Gopal, K.R. In-cylinder fluid flow, turbulence and spray models—A review. Renew. Sustain.Energy Rev. 2009, 13, 1620–1627. [CrossRef]
43. Li, W.Q.; Qu, Z.G.; He, Y.L.; Tao, W.Q. Experimental and numerical studies on melting phase change heattransfer in open-cell metallic foams filled with paraffin. Appl. Therm. Eng. 2012, 37, 1–9. [CrossRef]
44. Seddegh, S.; Wang, X.; Henderson, A.D. Numerical investigation of heat transfer mechanism in a verticalshell and tube latent heat energy storage system. Appl. Therm. Eng. 2015, 87, 698–706. [CrossRef]

Energies 2017, 10, 1129 18 of 18
45. Seddegh, S.; Wang, X.; Henderson, A.D. A comparative study of thermal behaviour of a horizontal andvertical shell-and-tube energy storage using phase change materials. Appl. Therm. Eng. 2016, 93, 348–358.[CrossRef]
46. Kousha, N.; Hosseini, M.J.; Aligoodarz, M.R.; Pakrouh, R.; Bahrampoury, R. Effect of inclination angle onthe performance of a shell and tube heat storage unit–An experimental study. Appl. Therm. Eng. 2017, 112,1497–1509. [CrossRef]
47. Ren, Q.; Chan, C.L. GPU accelerated numerical study of PCM melting process in an enclosure with internalfins using lattice Boltzmann method. Int. J. Heat Mass Trans. 2016, 100, 522–535. [CrossRef]
48. Al-Abidi, A.A.; Mat, S.; Sopian, K.; Sulaiman, M.Y.; Mohammad, A.T. Numerical study of PCM solidificationin a triplex tube heat exchanger with internal and external fins. Int. J. Heat. Mass. Trans. 2013, 61, 684–695.[CrossRef]
© 2017 by the authors. Licensee MDPI, Basel, Switzerland. This article is an open accessarticle distributed under the terms and conditions of the Creative Commons Attribution(CC BY) license (http://creativecommons.org/licenses/by/4.0/).