1,2 dichloroethane (dca)
TRANSCRIPT

FINAL DRAFT REPORT
Intermedia Transfer Factors for Contaminants Foundat Hazardous Waste Sites
1,2 DICHLOROETHANE(DCA)
Risk Science Program (RSP)
Department of Environmental Toxicology
University of California
Davis, California 95616
Prepared for:
The Office of Scientific Affairs
The Department of Toxic Substances Control (DTSC)
and the California Environmental Protection Agency
in Support of the CalTOX Model
December 1994

CONTRIBUTORS
Principal Investigator: Dennis P.H. Hsieh, Sc. D.
Lead Scientist: Thomas E. McKone, Ph. D.
Primary Author: Florence F. Chiao
Authors: Richard C. Currie, B. S.; Florence F. Chiao, Ph. D.; and
Thomas E. McKone, Ph. D.
Information Management: Loreen Kleinschmidt
Contract Manager: Edward Butler, Ph. D.
Department of Toxic Substances Control
301 Capitol Mall, 2nd Floor
Sacramento, CA 95812

TABLE OF CONTENTS
FORWARD.............................................................................................................................i
OVERVIEW............................................................................................................................ii
CalTOX Chemical-Specific Input Requirements.............................................................ii
Physicochemical Properties....................................................................................ii
Table 1. Summary of Chemical Properties for 1,2 Dichloroethane.............................iii
The Solid-Water Distribution Coefficients.........................................................ivBiotransfer Factors and Bioconcentration Factors.............................................ivChemical-Specific Transformation Process Half-Lives....................................v
Statistical Methods.................................................................................................................vi
Mean and Coefficient of Variation.......................................................................viEstimation Equations and the Residual Errors of the Estimation Method..vii
1,2 Dichloroethane (DCA)....................................................................................................1
Other Names...........................................................................................................................1
Background.............................................................................................................................1
Formula...................................................................................................................................1
MW: Molecular Weight......................................................................................................1
Experimental Values................................................................................................1
Kow: Octanol-Water Partition Coefficient........................................................................2
Experimental Values................................................................................................2
Tm: Melting Point..................................................................................................................2
Experimental Values................................................................................................2
VP: Vapor Pressure at Standard Temperatures..............................................................3
Experimental Values................................................................................................3Estimation Methods.................................................................................................3
Antoine Equation 1.......................................................................................3Antoine Equation 2.......................................................................................4
S: Solubility in Water...........................................................................................................4
Experimental Values................................................................................................4Unit Conversion.......................................................................................................4
H: Henry's Law Constant....................................................................................................5
Experimental Values................................................................................................5Estimation Method...................................................................................................5
Dair: Diffusion Coefficient in Pure Air............................................................................5
Estimation Method...................................................................................................5

Dwater: Diffusion Coefficient in Pure Water...................................................................6
Estimation Method...................................................................................................6
Koc: Organic-Carbon Partition Coefficient.......................................................................7
Experimental Values................................................................................................7Estimation Method...................................................................................................7
Kd_s: Distribution Coefficient in Ground-Surface and Root-Zone Soil....................8
Estimation Method...................................................................................................8
Kd_v: Distribution Coefficient in Vadose-Zone Soil.....................................................8
Estimation Method...................................................................................................8
Kd_q: Distribution Coefficient in the Ground-Water Zone.........................................9
Estimation Method...................................................................................................9
Kd_d: Distribution Coefficient in Sediment Particles....................................................10
Estimation Method...................................................................................................10
Kps: Partition Coefficient for Plant-Tissue (Above Ground Fresh Mass) Relativeto Soil Concentration (Fresh Soil)..........................................................................10
Estimation Method...................................................................................................10
Kpa : Biotransfer Factors For Plant Leaves Relative to Contaminant AirConcentration.............................................................................................................11
Estimation Method...................................................................................................11
Biotransfer Factors for Food Products...............................................................................12
Bk: Steady-State Biotransfer Factors for Whole Milk Relative to ContaminantIntake by Cattle............................................................................................................12
Estimation Method 1................................................................................................12Estimation Method 2................................................................................................13
Bt: Steady-State Biotransfer Factors for Meat Relative to Contaminant Intake byCattle.............................................................................................................................14
Estimation Method 1................................................................................................14Estimation Method 2................................................................................................14
Be: Steady-State Biotransfer Factors for Egg Relative to Dietary ContaminantIntake by Chickens.....................................................................................................15
Estimation Method...................................................................................................15
Bbmk: Biotransfer Factor for Human Breast Milk Relative to DietaryContaminant Intake by the Mother.......................................................................16
Estimation Method...................................................................................................16
BCF: Bioconcentration Factors for Fish Relative to Water Concentration..............17
Experimental Values:...............................................................................................17Estimation Method...................................................................................................17
Kp_w: Human Skin Permeability Coefficient Relative to ContaminantConcentration in Water............................................................................................17

Estimation Method...................................................................................................18
Km: Partition Coefficient for Human Skin Relative to ContaminantConcentration in Water or Soil..............................................................................18
Estimation Method...................................................................................................18
Thalf_a : Reaction Half-Life in Air.....................................................................................19
ExperimentalValues.................................................................................................19
Thalf_g: Reaction Half-Life in Ground-Surface Soil......................................................20
Estimated Values......................................................................................................20
Thalf_s: Reaction Half-Life in Root-Zone Soil................................................................20
Estimated Values......................................................................................................20
Thalf_v: Reaction Half-Life in Vadose-Zone Soil..........................................................21
Experimental Values................................................................................................21
Thalf_q: Reaction Half-Life in Groundwater...................................................................22
Experimental Values................................................................................................22
Thalf_w: Reaction Half-Life in Surface Water................................................................22
Experimental Values................................................................................................22
Thalf_d: Reaction Half-Life in Surface Water Sediment..............................................23
Experimental Values................................................................................................23
References................................................................................................................................23

FORWARD
The Department of Toxic Substances Control (DTSC), within the CaliforniaEnvironmental Protection Agency, has the responsibility for managing the State'shazardous-waste program to protect public health and the environment. The Office ofScientific Affairs (OSA) within the DTSC provides scientific assistance in the areas oftoxicology, risk, environmental assessment, training, and guidance to the regionaloffices within DTSC. Part of this assistance and guidance is the preparation ofregulations, scientific standards, guidance documents, and recommended proceduresfor use by regional staff, local governmental agencies, or responsible parties and theircontractors in the characterization and mitigation of hazardous-waste-substances-release sites. The CalTOX model has been developed as a spreadsheet model to assist inexposure and health-risk assessments that address contaminated soils and thecontamination of adjacent air, surface water, sediments, and ground water.
The modeling effort includes multimedia transport and transformation models,exposure scenario models, and efforts to quantify and reduce uncertainty inmultimedia, multiple-pathway exposure models. Use of the CalTOX model requiresthat we determine the intermedia transfer factors (ITFs) that define concentrationrelationships between an exposure medium and the environmental medium that isthe source of the contaminant. ITFs are chemical and physical parameters which serveas inputs in the CalTOX model analysis.
This report provides a set of ITFs needed to run the CalTOX model for DCA. For thischemical, we have conducted a critical review of existing literature for measuredvalues and estimation methods in order to compute an arithmetic mean (–x), acoefficient of variation (CV), and plausible range for each ITF.
i
OVERVIEW
The purpose of this report is to provide a set of chemical-specific intermedia-transferfactors (ITFs) for DCA. We have carried out a critical review of the existing literature inorder to identify a mean value, coefficient of variation (CV) and value range for theITFs listed in Table 1. For values used to define a given parameter, our highest prioritywas given to experimental values reported in the primary scientific literature, that is,peer-reviewed journals. For parameters that are not readily available from the primaryliterature, widely cited secondary references such as Lyman et al. (1982, 1990),Verschueren (1984), Howard et al. (1990, 1991), Mackay et al. (1992), the CRC Handbook(1989-90) and the Merck Index (1983, 1989) are used to establish parameter values.When measured values are not available from either the primary literature orsecondary references, estimates of ITF parameter values are based on estimationequations that are available in the primary literature. Typically, these estimationmethods relate ITFs to other measured contaminant parameters using quantitative-structure-activity-relationship (QSAR) methods. In these cases, parameter valuesestimated from a QSAR method are treated as the arithmetic mean and the estimationerror of the method is used to determine the CV. Table 1 summarizes the unitsrequired by the CalTOX model, the values of chemical specific physico-chemicalproperties, distribution coefficients, biotransfer and bioconcentration factors, andtransformation half-lives obtained in this study.
CalTOX Chemical-Specific Input Requirements
The CalTOX model uses three sets of input data—one describing the chemical-specificproperties of the contaminants, a second providing properties of the environment orlandscape receiving the contaminants, and a third that defines for exposure assessmentthe characteristics of individuals in various age/sex categories and the characteristics ofthe micro-environments in which they live or from which they obtain water and food.Each of the inputs in these sets must be described in terms of a mean value with anestimated coefficient of variation, which describes the uncertainty or variabilityassociated with that parameter. This report addresses mean value, CV, and range ofvalues needed to characterize chemical-specific inputs.
Physicochemical Properties
Physicochemical properties include molecular weight, octanol-water partitioncoefficient, melting point, vapor pressure, Henry’s law constant, diffusion coefficientsin air and water, and the organic-carbon partition coefficient. The octanol-waterpartition coefficient provides a measure of the extent of chemical partitioning betweenwater and octanol at equilibrium and is used as a basis for estimating other ITFparameters. The melting point is the temperature at which a compound makes thetransition from a solid to a liquid phase. Vapor pressure is the pressure exerted by achemical vapor in equilibrium with its solid or liquid phase. Water solubility is theupper limit on a chemical's dissolved concentration in pure water, at a specifiedtemperature.
ii

Table 1. Summary of Chemical Properties for 1,2 Dichloroethane
Description Symbola MeanValue
Coefficientof Variation
Numberof Values
Molecular Weight (g/mol) MW 98.97 1.9 × 10 -4 4
Octanol-Water Partition Coefficient Kow 28 0.077 4
Melting Point (K) Tm 237.7 6.5 × 10 -4 4
Vapor Pressure (Pa) VP 10,746 0.038 3
Solubility (mol/m3) S 86 0.050 4
Henry's Law Constant (Pa-m3/mol) H - 119 0.18 3
Diffusion Coefficient in Pure Air (m2/d) Dair 0.74 0.05 1
Diffusion Coefficient in Pure Water (m2/d) Dwater 9.7 × 10 -5 0.25 1
Organic Carbon Partition Coefficient Koc - 18 1.10 2
Distribution Coefficient in Ground-Surface andRoot-Zone Soil
Kd_s - b b e
Distribution Coefficient in Vadose-Zone Soil Kd_v - b b e
Distribution Coefficient in the Ground-Water Zone Kd_q - b b e
Distribution Coefficient in Ground Water Sediment Kd_d - b b e
Partition Coefficient in Plants Relative to SoilConcentration [ppm (pFM) /ppm (sFM)]
Kps - 1.0 4.0 e
Biotransfer Factor in Plants Relative toContaminant Air Concentration [m3(a)/kg (pFM)]
Kpa - 0.015 14 e
Biotransfer Factor in Milk Relative to Cattle-DietContaminant Intake (d/kg)
Bk - 5.4 × 10 -7 11 e
Biotransfer Factor in Meat Relative to Cattle-DietContaminant Intake (d/kg)
Bt - 6.5 × 10 -6 13 e
Biotransfer Factor in Eggs Relative to Hen-DietContaminant Intake (d/kg)
Be - 2.2 × 10 -4 14 e
Biotransfer in Breast Milk Relative to ContaminantIntake by the Mother (d/kg)
Bbmk - 5.6 × 10 -6 10 e
Bioconcentration Factor in Fish Relative toContaminant Water Concentration
BCF - 2.0 1.0 1
Skin Permeability Coefficient (cm/h) Kp_w - 0.010 2.4 e
Skin-Water/Soil Partition Coefficient[ppm (skin)/ppm (water)]
Km - 4.2 0.27 e
Reaction Half-Life in Air (d) Thalf_a 45 1.2 4
Reaction Half-Life in Ground-Surface Soil (d) Thalf_g 110 0.41 4
Reaction Half-Life in Root-Zone Soil (d) Thalf_s 110 0.41 4
Reaction Half-Life in the Vadose-Zone Soil (d) Thalf_v 260 0.92 6
Reaction Half-Life in Ground-Water Zone Soil (d) Thalf_q 335 0.68 5
Reaction Half-Life in Surface Water (d) Thalf_w 820 1.6 4
Reaction Half-Life in the Sediment (d) Thalf_d 430 0.63 4aValues followed by a " -" include default equations that can be used for estimationsbKd = [(Koc) × (fraction organic matter)], a site and soil zone specific parametereestimated parameter value
iii

Henry's law constant is a measure at equilibrium of the ratio of chemical activity inthe gas above a liquid to chemical activity in the liquid. Diffusion coefficients describethe movement of a molecule in a liquid or gas medium as a result of differences inconcentration within the medium. They are used to calculate the dispersivecomponent of chemical transport. The higher the diffusion coefficient, the more likelya chemical is to move in response to concentration gradients. The organic-carbonpartition coefficient provides a measure of chemical partitioning between organiccarbon (in soils, rocks, and sediments) and water. The higher the Koc, the more likely achemical is to bind to the solid phase of soil or sediment than to the liquid phase.
The Solid-Water Distribution Coefficients
The distribution or sorption coefficient, Kd, is the concentration ratio, at equilibrium,of chemical attached to solids and/or particles (mol/kg) to chemical concentration inthe solution, mol/L. When Koc is multiplied by the fraction organic carbon in a soil orsediment, we obtain an estimate of the soil/water or sediment/water partitioncoefficient. CalTOX requires, as input, distribution coefficients for ground-surface, root-zone, and vadose-zone soil; ground-water-zone rock or soil, and surface-watersediments.
Biotransfer Factors and Bioconcentration Factors
The CalTOX model requires, as input, general relationships that can be used toestimate partition coefficients between air and plants; between soil and plants; betweenanimal feed intake and animal-based food products; between surface water and fish;between the human mother’s uptake and breast milk; between skin and water; andbetween skin uptake and concentration in skin water.
The chemical-specific plant-air partition coefficient, Kpa , represents the ratio ofcontaminant concentration in above-ground plant parts, in mg/kg (fresh mass), tocontaminant concentration in the gas-phase of the atmosphere mg/m3 (air). The plant-soil partition coefficient, Kps, expresses the ratio of contaminant concentration in plantparts, both pasture and food, in mg/kg (plant fresh mass) to concentration in wet root-zone soil, in mg/kg.
The biotransfer factors Bt, Bk and Be are the steady-state contaminant concentrationsin, respectively, fresh meat, milk, and eggs; divided by the animals’ daily contaminantintake. These factors are expressed in units of (mg/kg)/(mg/d), or kg/d. Unlikebioconcentration factors, which express steady-state concentration ratios betweenanimal tissue and a specific environmental medium, biotransfer factors express thesteady-state relationship between intake and tissue or food-product concentrations.
Lactating women can transfer to breast milk their intake of contaminants from allintake routes—ingestion, inhalation, and dermal contact. Bbmk is the biotransfer factorfor milk-concentration versus the mother’s intake. This relationship may also be
iv

described as the ratio of contaminant concentration in mother’s milk divided by themother's daily intake of that contaminant, in units of d/kg (milk).
The bioconcentration factor BCF provides a measure of chemical partitioning betweenfish tissue based on chemical concentration in water.
Chemical specific exposure factors used in CalTOX include the skin-water and skin-soilpartition coefficients. Km is the skin-water partition coefficient in cm3 (water)/cm3
(skin) . In order to estimate the skin-soil partition factor, Ksoilm , with units
cm3(soil)/cm3(skin), we divide equation Km by the sorption coefficient Kd for soil, or
Ksoilm =
Km
Kd
Kp_w is the steady-state permeability coefficient in cm/hour for a contaminant fromwater on skin through stratum corneum and can either be based on a measured valueor estimated values.
Chemical-Specific Transformation Process Half-Lives
Chemical transformations, which may occur as a result of biotic or abiotic processes,can have a profound effect on the persistence of contaminants in the environment.Experimental methods and estimation methods are available for defining these fateprocesses in a variety of media. Specific information on the rates and pathways oftransformation for individual chemicals of concern should be obtained directly fromexperimental determinations, if possible, or derived indirectly from information onchemicals that are structurally similar. CalTOX makes use of media- and reaction-specific reaction half-lives to establish rate constants for transformation removalprocesses that include photolysis, hydrolysis, oxidation/reduction, and microbialdegradation.
Transformation-rate half-lives are among the more uncertain parameters in theCalTOX model. There are typically few available measurements or ranges of estimatedvalues in the primary and secondary literature. Most of the available half-life valuesare obtained from limited measurements for environmental media that are notnecessarily representative of those in California. These values often involve scientificjudgment as much as measurement. In making use of these data, we expanded therange of the reported values by a factor of 5 when only 2 or 3 representative values arepresented and by a factor of 10 when only one value is provided. If 4 or more measuredvalues are available, these uncertainty factors are not applied. In order to express thelack of reliability associated with a limited number of measured values for aparameter, these uncertainty factors are used to express both large uncertainty andsignificant variability.
v

Statistical Methods
Each of the inputs to CalTOX must be described by a mean value and an estimatedcoefficient of variation which describes the uncertainty or variability associated withthat parameter. For input values that are derived from a number of measured values,the mean and coefficient of variation are obtained from the arithmetic mean and thearithmetic standard deviation of the inputs. For estimated input values, the mean andcoefficient of variation are obtained from an estimation equation and the residualerror of the estimation equation. The methods we used to obtain these values aredescribed here.
Mean and Coefficient of Variation
The arithmetic mean (–x) is used to represent all inputs that are derived from a numberof measured values—even those that might have geometric distributions. The (–x) iscomputed by summing the reported values and dividing this sum by the total numberof observations:
Arithmetic mean (–x) = ∑i = 1
nxi
n(Eqn. 1)
Where ∑i = 1
nxi is the sum of the observed values and n is the number of observations. In
this case, the coefficient of variation (CV) is computed by dividing the arithmeticstandard deviation (sn) by the mean. Standard deviation and CV are computedaccording to the following equations:
standard deviation (sn) =
∑i = 1
n
(xi - –x)2
n (Eqn. 2)
coefficient of variation (CV) = sn–x
(Eqn. 3)
It should be noted that, based on the central limit theorem of statistics, the confidenceassociated with the estimate of –x from above becomes large as the number of samplesused to estimate –x also becomes large. Therefore, the reliability of the estimates ofmean and CV of a parameter are low when the sample size is small. It is beyond thescope of this document to explicitly address the reliability of these estimates.Nonetheless, in order to give an indication of potential reliability problems, we list thenumber of measurements used to estimate the mean and CV of each parameter in thelast column of Table 1.
vi

Estimation Equations and the Residual Errors of the Estimation Method
Estimates of some CalTOX inputs are based on regression equations that relate aparameter value to some measure of structure or activity associated with thecontaminant. These methods are referred to as quantitative structure-activityrelationship (QSAR) methods. The reliability of a parameter-value estimated in thisway is defined by the precision of these QSAR methods.
Our estimate of precision in QSAR estimation methods is based on calculating, Se, thestandard error of the estimate (or standard deviation of the residuals). This errorcalculation is based on the regression equations and fragment models used to derive aparameter value. To illustrate, when the value of parameter such as the organic-carbon partition coefficient (Koc) is estimated using a regression or correlation analysis,the Se is calculated using the following approach (Hamburg, 1970). First, since it istypical that it is the log Koc (not Koc itself) that is estimated from a regression equation,we calculate the Se of log Koc according to
Se of log Kestoc =
∑i = 1
n
(log Kmsdoc - log K
estoc )
2
(n-2) (Eqn. 4)
where n is the number of chemicals used in the estimation protocol and Kestoc refers to
the estimated property (Koc in this case) and Kmsdoc refers to the corresponding measured
values used to carry out the regression. In order to calculate the Se of Koc, we make useof the transformation
GSD (Kestoc ) = 10(Se of log K
est
oc) (Eqn. 5)
to calculate the geometric standard deviation of Se (GSD) of Kestoc , which is simply the
GSD of the Koc estimate, that is GSD (Kestoc ). It has been shown by Atchison and Brown
(1957) that the relationships between the GSD and CV for log normal distributions areas follows
GSD = exp{ }ln(1+CV2) (Eqn. 6)
CV = ( )exp{ } [ln(GSD)]2 -1 (Eqn. 7)
vii

Since the implicit assumption of a regression for estimating the log of Koc is that anyestimated value, log (K
estoc ), is centered on normal distribution with standard deviation
equal to Se of log Koc, it follows that the corresponding estimated value of Koc iscentered on a log normal distribution with GSD (K
estoc ) and with
CV (Kestoc ) =
exp{ } [ln(GSD(K
estoc ))]2 -1 (Eqn. 8)
This approach is used to estimate CVs for the estimation equations presented in thisdocument.
In some cases the error term, CV for example, is calculated by combining through theoperations of multiplication and division the CVs of two or more parameters. Forexample the CV in the ration H = VP/S is combined from the CV (VP) and CV (S). Inthis case, if the input parameters are independent, the combined CV is calculated usingthe following equation:
CVcombined = ∑i = 1
n
CV2i
n(Eqn. 9)
where n is the number of parameters used in the multiplication/division and CVi is
the coefficient of variation in the ith input parameter.
viii

Final Draft: December 1994 1,2 Dichloroethane (DCA)
1,2 Dichloroethane (DCA)
Other Names
1,2 DCA, DCE, DCA, EDC, dichloroethylene, sym-dichloroethane; glycol dichloride;1,2 bichloroethane; α, β-dichloroethane; ENT 1,656; ethane dichloride; ethylenechloride; 1,2 ethylene dichloride; Dichloroemulsion; Borer Sol; Dutch Liquid;Dutch Oil; Brocide; RCRA Waste Number U077; CAS 107-06-2 (WHO IARC, 1979)
Background
1,2 Dichloroethane (DCA) belongs to the chemical family of chlorinated alkanes.DCA is manufactured by reacting ethylene with chlorine or hydrogen chloride inthe presence of a metal catalyst. Used in the manufacturing of vinyl chloride,tetraethyllead, intermediate insecticidal fumigants and tobacco flavoring; DCA isalso found as a constituent in paint, varnish, finish removers, soaps and scouringcompounds; as a metal degreaser; in wetting and penetrating agents, chemicalsynthesis and ore floatation (Verscheuren, 1983). It is also used in the productionof ethyleneamines, tetrachloroethylene; trichloroethylene, as a lead scavenger andin the production of vinylidene chloride (WHO IARC, 1979). Disposal of EDC tarsis usually by burial in a landfill or incineration. The lack of detection of DCA insoil is due to its rapid removal into water and air (Scherb, 1978). Evaporationappears to be the major pathway by which DCA is lost from the water (Dilling1975). In the atmosphere, oxidation by hydroxyl radicals is the dominant lossprocess (Radding, 1977).
Formula
C2 H4 Cl2
H
H
Cl C
H
H
ClC
MW: Molecular Weight
The units used for molecular weight are grams/mole (g/mol).
Experimental Values
98.96 reported in Weast et al. [CRC Handbook (1990)]
98.96 reported in Budavari et al. [Merck Index (1989)]
1

Final Draft: December 1994 1,2 Dichloroethane (DCA)
98.97 reported in Patty's Industrial Hygiene & Toxicology [Clayton andClayton (1981)]
99 reported in Verscheuren (1983)
From the above 4 reported values above, we obtain the following statistics forthe molecular weight of 1,2 DCA:
Arithmetic mean (coefficient of variation):MW = 98.97 (1.9 × 10⁻⁴) g/mol
Range: 98.96 to 99 g/mol
Kow: Octanol-Water Partition Coefficient
The units used for Kow are mg/liter (octanol) mg/liter (water) and Kow is therefore unitless.
Experimental Values
25 reported at 20 °C as a Kow of 25 by Chiou et al. (1977) using a shake flask-GC method
28.2 reported as a log Kow of 1.45 by Veith et al. (1980) estimated usingreverse-phase liquid chromatography (RP-HPLC)
28.2 reported at 23 °C as a Kow of 28.2 by Banerjee et al. (1980) using a shake-flask LSC method [Also cited in Mackay et al.(1993)]
30.2 reported as a log Kow of 1.48 by Jow and Hansch (1985) as unpublishedresults in Hansch and Leo (1979)
From the 4 measured values above we obtain the following statistics for theoctanol-water partition coefficient of 1,2 DCA at 25 °C:
Arithmetic mean (coefficient of variation):Kow = 28 (0.077)
Range: 25 to 30.2
Tm: Melting Point
The units used for melting point are kelvins (K).
Experimental Values
237.49 reported as a MP of -35.66 °C by Thermodynamics Research Center DataProject (1964) [also cited in Riddick et al. (1986)]
2

Final Draft: December 1994 1,2 Dichloroethane (DCA)
237.7 reported as a MP of -35.5 °C by McGovern (1943)
237.8 reported as a MP of -35.4 °C by Verscheuren (1983)
237.8 reported as a MP of -35.3 °C by Weast et al. [CRC (1988)]
From the 4 measured values above, we obtain the following statistics for themelting point of 1,2 DCA:
Arithmetic mean (coefficient of variation):Tm = 237.7 (6.5 × 10⁻⁴) K
Range: 237.49 to 237.8 K
VP: Vapor Pressure at Standard Temperatures
The units used for vapor pressure are pascals (Pa).
Experimental Values
10,399 reported at 25 °C as 78 mm Hg by McGovern (1943)
10,639 reported at 25 °C by Pearce and Peters (1929) [also cited in Boublik et al.(1984)]
11,199 reported at 25 °C as 84 mm Hg extrapolated from Stull (1947)
From the 3 measured values above, we obtain the following statistics for thevapor pressure of 1,2 DCA at 25 °C:
Arithmetic mean (coefficient of variation): VP = 10,700 (0.038) Pa
Range: 10,399 to 11,199 Pa
Estimation Methods
Antoine Equation 1
The following Antoine equation was derived from data by Pearce and Peters (1929)[also cited in Boublik et al. (1984)].
log10 VP = 6.16284 – 1278.323
223.694 + T (°C)
for -30 °C < T < 99 °C; yielding:
VP = 10,500 Pa at 298 K
3

Final Draft: December 1994 1,2 Dichloroethane (DCA)
Antoine Equation 2
The following Antoine equation was derived from data by Stull (1947).
log10 VP = 10.1193 – 1813.12
273 + T (°C)
for -24 °C < T < 64 °C; yielding:
VP = 10,800 Pa at 298 K
S: Solubility in Water
The units used in the solubility values below are mg
liter (water) (mg/L).
Experimental Values
7987 reported at 25 °C as 80700 µM by Banerjee et al. (1980) using a shake-flaskGC method [Also cited in Horvath (1982)]
8450 reported at 20 °C as 0.845 g/100 ml solution by Chiou et al. (1977) using ashake flask-GC method
8650 reported at 25 °C as 0.865 g/100 g water by Gross (1929) using a shake-flask interferometer method [also cited in MacKay et al. (1990)]
9000 reported as 9.0 g/1000 g water by Gross and Saylor (1931) using a shake-flask interferometer method
Unit Conversion
Arithmetic mean (coefficient of variation) of 1,2 DCA solubility
= 8522 (0.050) mg/L
= 86 (0.050) mol/m3
From the 4 measured values above, we obtain the following statistics for thewater solubility of 1,2 DCA at 25 °C:
Arithmetic mean (coefficient of variation):S = 86 (0.050) mol/m3
Range: 80.7 to 90.9 mol/m3
4

Final Draft: December 1994 1,2 Dichloroethane (DCA)
H: Henry's Law Constant
The units used for Henry's Law constant are Pascals-m3
mole (Pa-m3/mol).
Experimental Values
101 reported at 20 °C as 0.0010 atm m3/mol by Tse (1992)
111 reported at 25 °C as 0.0011 atm m3/mol by EPA (1987) from a batchstripping method
143 reported as 0.00141 atm m3/mol at 25 °C by Ashworth et al. (1988)measured by EPICS [Also cited in Mackay et al. (1992)]
From the 3 measured values above, we obtain the following statistics forHenry's law constant at 20-25 °C:
Arithmetic mean (coefficient of variation):H = 120 (0.18) Pa-m3/mol
Range: 101 to 143 Pa-m3/mol
Estimation Method
H = VP (Pa)
S (mol/m3) =
10700 86
= 125 Pa-m3/mol
Dair: Diffusion Coefficient in Pure Air
The units used for the diffusion coefficient in pure air are meters2
day (m2/d).
Estimation Method
Based on the Fuller et al. (1966) method described in Lyman et al. (1982), theestimated diffusion coefficient in air(m2/d) is given by:
Dair = 8.6 × 10⁻³ T1.75
(29 + Mx)/(29 × Mx)
[ ]2.7 + V1/3x
2
Molar volume(Vx) can be estimated by the LeBas incremental method as describedin Lyman et al. (1982) With a molar volume, Vx, of 94 cm3/mol, molecular weight(Mx) of 96.97 g/mol, and a temperature equal to 298 K, the above expression gives:
5

Final Draft: December 1994 1,2 Dichloroethane (DCA)
Dair = 3.46 × 10⁻⁵ T1.75 = 0.74 m2/d
The reported average absolute estimation error is 5 to 10% [Fuller et al. (1966)].This estimation error is reported as <5% for chlorinated aliphatics and equivalentto the CV below.
Based on the estimated value and the estimation error reported above, weobtain the following statistics for the estimated air diffusion coefficient of 1,2DCA at 25 °C:
Arithmetic mean (coefficient of variation):Dair = 0.74 (0.05) m2/d
Dwater: Diffusion Coefficient in Pure Water
The units used for the diffusion coefficient in pure water are meters2
day (m2/d).
Estimation Method
Based on the Wilke and Chang (1955) method described in Reid et al. (1987) thediffusion coefficient in water (m2/d) is given by:
Dwater = 6.5 × 10⁻⁷ f × My T
hy V0.6x
Wilke and Chang (1955) recommend an association factor, ƒ, of 2.6 when thesolvent is water. The viscosity of water, hy, is 0.89 cP at 25 °C. Molar volume (Vx)can be estimated by the LeBas incremental method as described in Lyman et al.(1982). With a Vx equal to 94 cm3/mol, a temperature (T) of 298 K, and My (MW ofwater) equal to 18 g/mol., this expression gives:
Dwater = 3.27 × 10⁻⁷ T = 9.7 × 10⁻⁵ m2/d at 25 °C
Original data for this estimation, provided in Reid et al. (1987), can be used todetermine the standard error of the estimator for this estimation method. Fromthis data we calculate a CV of 0.25 from a 25% estimation error.
6

Final Draft: December 1994 1,2 Dichloroethane (DCA)
Based on the estimated value and the estimation error reported above, weobtain the following statistics for the estimated water diffusion coefficient of 1,2DCA at 25 °C:
Arithmetic mean (coefficient of variation):Dwater = 9.7 × 10⁻⁵ (0.25) m2/d
Koc: Organic-Carbon Partition Coefficient
The units used for Koc are mg/kg (organic carbon)
mg/kg (water) and Koc is therefore unitless.
Experimental Values
4.1 reported at 25 °C as a Koc of 2.1 to 6.1 by Liljestrand and Charbeneau(1987) using an organic clay soil from an aquifer (19 ft.) with a fractionorganic carbon (foc) of 0.169 from an aquifer
33 reported at 25 °C as a Kd of 0.304 by Chiou et al. (1979) using aWillamette silt loam (pH = 6.8; fom = 1.6% ) and assuming that organiccarbon is 58% of organic matter (Schwartzenbach et al. (1993) [Also citedin Mackay et al. (1993)]
From the 2 measured values above, we obtain the following statistics for theorganic carbon partition coefficient for 1,2 DCA:
Arithmetic mean (coefficient of variation):Koc = 18 (1.1)
Range: 4.1 to 33
Estimation Method
Karickhoff (1981) has described empirical estimation methods for obtaining Kocfrom Kow. The most general of these is that Koc is equal to 0.41 times Kow .
Koc = 0.41 × Kow
Kow = 28
Koc (est) = 11 (1)
The reported CV is based on data provided by Karickhoff (1981). This estimationerror does not include uncertainty in the value of Kow.
7
Final Draft: December 1994 1,2 Dichloroethane (DCA)
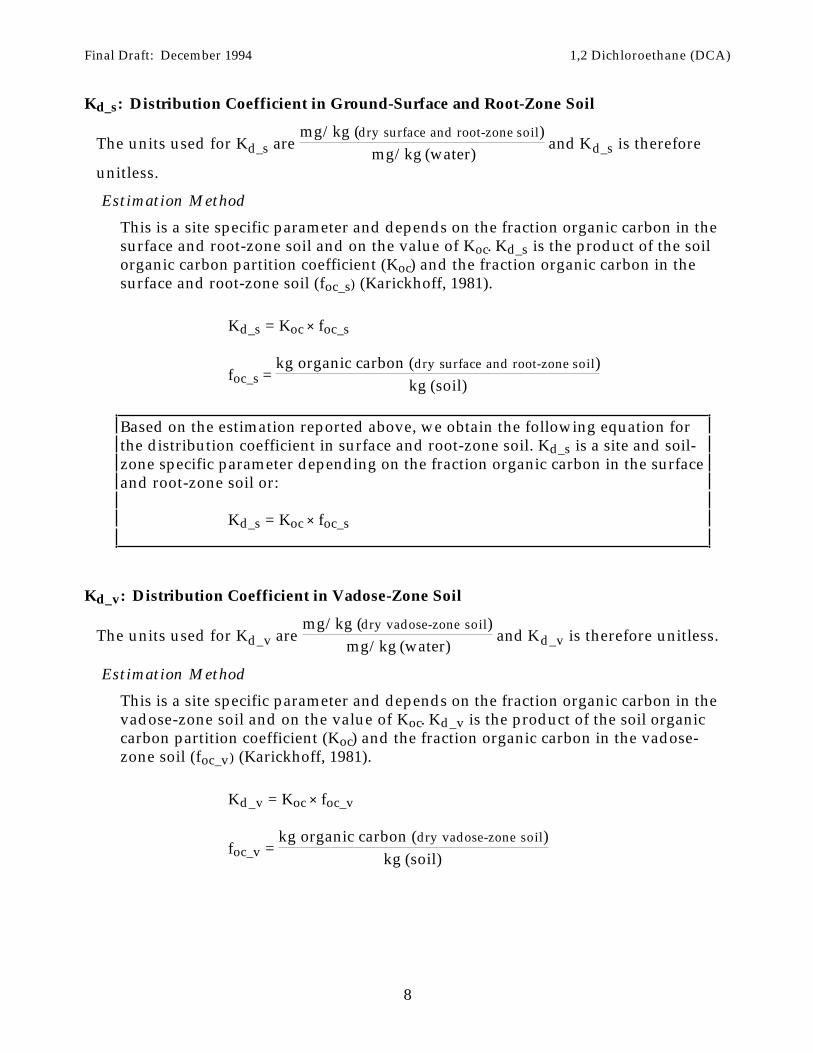
Kd_s: Distribution Coefficient in Ground-Surface and Root-Zone Soil
The units used for Kd_s are mg/kg (dry surface and root-zone soil)
mg/kg (water) and Kd_s is therefore
unitless.
Estimation Method
This is a site specific parameter and depends on the fraction organic carbon in thesurface and root-zone soil and on the value of Koc. Kd_s is the product of the soilorganic carbon partition coefficient (Koc) and the fraction organic carbon in thesurface and root-zone soil (foc_s) (Karickhoff, 1981).
Kd_s = Koc × foc_s
foc_s = kg organic carbon (dry surface and root-zone soil)
kg (soil)
Based on the estimation reported above, we obtain the following equation forthe distribution coefficient in surface and root-zone soil. Kd_s is a site and soil-zone specific parameter depending on the fraction organic carbon in the surfaceand root-zone soil or:
Kd_s = Koc × foc_s
Kd_v: Distribution Coefficient in Vadose-Zone Soil
The units used for Kd_v are mg/kg (dry vadose-zone soil)
mg/kg (water) and Kd_v is therefore unitless.
Estimation Method
This is a site specific parameter and depends on the fraction organic carbon in thevadose-zone soil and on the value of Koc. Kd_v is the product of the soil organiccarbon partition coefficient (Koc) and the fraction organic carbon in the vadose-zone soil (foc_v) (Karickhoff, 1981).
Kd_v = Koc × foc_v
foc_v = kg organic carbon (dry vadose-zone soil)
kg (soil)
8

Final Draft: December 1994 1,2 Dichloroethane (DCA)
Based on the estimation reported above, we obtain the following equation forthe distribution coefficient in vadose-zone soil. Kd_v is a site and soil-zonespecific parameter depending on the fraction organic carbon in the vadose-zoneor:
Kd_v = Koc × foc_v
Kd_q: Distribution Coefficient in the Ground-Water Zone
The units used for Kd_q are mg/kg (dry aquifer material)
mg/kg (water) and Kd_q is therefore unitless.
Estimation Method
This is a site-specific parameter and depends on the fraction organic carbon in theground-water zone and on the value of Koc. Kd_q is the product of the soil organiccarbon partition coefficient (Koc) and the fraction organic carbon in the ground-water zone (foc_q) (Karickhoff, 1981).
Kd_q = Koc × foc_q
foc_q = kg organic carbon (dry aquifer material)
kg (solid)
Based on the estimation reported above, we obtain the following equation forthe distribution coefficient in the ground-water zone. Kd_q is a site and soil-zone specific parameter depending on the fraction organic carbon in theground-water zone or:
Kd_q = Koc × foc_q
9

Final Draft: December 1994 1,2 Dichloroethane (DCA)
Kd_d: Distribution Coefficient in Sediment Particles
The units used for Kd_d are mg/kg (dry surface-water sediment)
mg/kg (water) and Kd_d is therefore
unitless.
Estimation Method
This is a site specific parameter and depends on the fraction organic carbon in thesurface-water sediment and the value of Koc. Kd_d is the product of the soil organiccarbon partition coefficient (Koc) and the fraction of organic carbon in surface-watersediment (foc_d) [Karickhoff, 1981].
Kd_d = Koc × foc_d
foc_d = kg organic carbon (dry surface-water sediment)
kg (soil)
Based on the estimation reported above, we obtain the following equation forthe distribution coefficient in surface-water sediment particles. Kd_d is a siteand soil-zone specific parameter depending on the fraction organic carbon insurface-water sediment or:
Kd_d = Koc × foc_d
Kps: Partition Coefficient for Plant-Tissue (Above Ground Fresh Mass) Relative to SoilConcentration (Fresh Soil)
The units used for Kps are mg/kg (plant fresh mass [pFM]) mg/kg (soil fresh mass [sFM]) (ppm [pFM]/ppm [sFM]).
No reported measurements of Kps for 1,2 DCA are available in the currentliterature. An estimation method for this parameter is thus applied.
Estimation Method
Based on a review of reported measurements of bioconcentration for 29 persistentorganochlorines in plants, Travis and Arms (1988) have correlated plant-soilbioconcentration (on a dry-mass basis) in above-ground plant parts withoctanol-water partition coefficients. This bioconcentration factor, Bv, on adry-weight basis is expressed as:
log Bv = 1.58 – 0.58 log Kow ± 0.73 (n=29, r2=0.525)
10

Final Draft: December 1994 1,2 Dichloroethane (DCA)
We calculated the error term, ± 0.73, from the mean square error of the estimatorfor this regression from the data provided by Travis and Arms (1988). Whenadjusted to a fresh-mass basis (assuming that the plant dry-mass fraction equals0.2), this estimation equation gives the plant-soil partition coefficient, Kps,expressing the ratio of contaminant concentration in mg/kg in above-groundplant fresh mass relative to contaminant concentration in mg/kg (dry soil) in theroot-zone as:
Kps = 7.7 K–0.58ow (CV = 4.0) ppm (pFM)/ppm (sDM)
Expressing the ratio of contaminant concentration in mg/kg in above-groundplant fresh mass relative to contaminant concentration in mg/kg (fresh soil), andassuming fresh soil 10% by mass water in the root-zone soil, the Kps estimation is:
Kps (est) = 7.0 K–0.58ow
Kow = 28
Kps (est) = 1.0 ppm (pFM)/ppm (sFM)
The estimation error reported above corresponds to a CV of 4.
From the estimation method identified above, we obtain the followingstatistics for the partition coefficient in plant leaves relative to contaminantconcentration in soil of 1,2 DCA:
Arithmetic mean (coefficient of variation):Kps = 1.0 (4) ppm (pFM)/ppm (sFM)
Kpa: Biotransfer Factors For Plant Leaves Relative to Contaminant Air Concentration
The units used for Kpa are mg/kg (plant fresh mass [pFM])
mg/cubic meter of air (m3 [air]) (m3 [a]/kg [pFM])
No reported measurements of Kpa for 1,2 DCA are available in the currentliterature. An estimation method for this parameter is thus applied.
Estimation Method
Based on the model of Riederer (1990) for foliar uptake of gas-phase contaminants(mg/m3) relative to contaminant concentration in plant leaves (mg/kg freshmass), we estimate a steady-state plant-air coefficient as:
11

Final Draft: December 1994 1,2 Dichloroethane (DCA)
Kpa(m3 [a]/kg [pFM])= [0.5 + ((0.4 + 0.01 × Kow)(RT/H))] × 10-3 kg/m3
R = 8.313 Pa-m3/mol-K
T = 298 K
H = 120 Pa-m3/mol
Kow = 28
Kpa (est) = 0.015 m 3 [a]/kg [pFM]
McKone (1993) has estimated that the CV associated with this partition estimationmodel is on the order of 14.
From the estimation method identified above, we obtain the followingstatistics for the partition coefficient in plant leaves relative to contaminantconcentration in air for 1,2 DCA:
Arithmetic mean (coefficient of variation):Kpa= 0.015 (14) m3 [a]/kg [pFM]
BIOTRANSFER FACTORS FOR FOOD PRODUCTS
The biotransfer factors Bt, Bk and Be are the steady-state contaminantconcentrations in, respectively; fresh meat, milk, and eggs; divided by the animalsdaily contaminant intake, and are expressed in units of (mg/kg)/(mg/d) or kg/d.
Bk: Steady-State Biotransfer Factors for Whole Milk Relative to Contaminant Intake byCattle
The units used for Bk are days/kg (milk) (d/kg [milk]).
No reported measurements of Bk are available in the current literature.Estimation methods are therefore considered.
Estimation Method 1
Based on a review of biotransfer factors for 28 organic chemicals in milk Travisand Arms (1988) developed the following geometric-mean regressions for Bk1based on the octanol-water partition coefficient, Kow,
log Bk1 = log Kow – 8.1 ± 0.84 (n = 28, r2 = 0.55)
12

Final Draft: December 1994 1,2 Dichloroethane (DCA)
Using the data provided by Travis and Arms (1988), we calculated the error term, ±0.84, from the mean square error of the estimator for this regression. Thisestimation error corresponds to a CV of 6. From the above expression and log Kowof 1.45, we obtain the following statistics for the Bk1 of 1,2 DCA:
Bk1 (est) = 2.2 × 10⁻⁷ days/kg (milk)
CV = 6
Estimation Method 2
The transfer of organic chemicals from feed to milk has also been expressed interms of the fat-diet partition coefficient, Kfd, which is the steady-state ratio ofcontaminant concentration in animal fat (or lipid) to contaminant concentrationin animal feed with units kg (feed)/kg (fat). Kenaga (1980) reviewed cattle-dietaryfeeding studies for 23 chemicals, and from these studies derived the following fat-feed equation relating Kfd to Kow,
log Kfd = 0.5 log Kow – 3.457 ± 1 (n = 23, r2 = 0.62)
The estimation error in this expression, ± 1, was calculated by Kenaga (1980). Fromthe above expression with log Kow of 1.45, an assumed pasture intake by dairycattle of 85 kg/d (McKone and Ryan, 1989), and an assumed fat content of 0.04 inmilk; we obtain the following statistics for the Bk2 of 1,2 DCA:
Bk2 (est)= 8.7 × 10⁻⁷ days/kg (milk)
CV = 14
The above estimation error corresponds to assumed CV of 14.The 2 estimation values reported above yield the arithmetic mean and CVreported below:
Bk (avg) = 5.5 × 10⁻⁷ days/kg (milk)
CVpooled = 11
Based on the estimation equation and the estimation error reported above, weobtain the following value for the estimated steady-state biotransfer factor formilk relative to dietary contaminant intake by dairy cattle for 1,2 DCA:
Arithmetic mean (coefficient of variation):Bk = 5.5 × 10⁻⁷ (11) days/kg (milk)
Range: 2.2 × 10⁻⁷ to 5.5 × 10⁻⁷days/kg (milk)
13

Final Draft: December 1994 1,2 Dichloroethane (DCA)
Bt: Steady-State Biotransfer Factors for Meat Relative to Contaminant Intake by Cattle
The units used for Bt are days/kg (meat) (d/kg [meat]).
No reported measurements of cattle-meat biotransfer for 1,2 DCA are available inthe current literature. Estimation methods are therefore considered.
Estimation Method 1
Based on a review of biotransfer factors for 36 chemicals in meat, Travis and Arms(1988) developed the following geometric-mean regression for Bt1 based on theoctanol-water partition coefficient, Kow,
log Bt1 = log Kow – 7.6 ± 0.95 (n = 36, r2 = 0.67)
Using the data provided by Travis and Arms (1988), we calculated the error term,± 0.95 from the mean square error of the estimator for this regression. Thisestimation errors corresponds to a CV of 11. From the above expression and a logKow equal to 1.45, we obtain the following estimation:
Bt1 (est) = 7.0 × 10⁻⁷ days/kg (meat)
CV = 11
Estimation Method 2
The transfer of organic chemicals from feed to meat has also been expressed interms of the fat-feed partition coefficient, Kfd, which is the steady-state ratio ofcontaminant concentration in animal fat (or lipid) to contaminant concentrationin animal feed with units kg(feed)/kg(fat). Kenaga (1980) reviewed cattle-dietaryfeeding studies for 23 chemicals, and from these studies derived the following fat-feed equation relating Kfd to Kow:
log Kfd = 0.5 log Kow – 3.457 ± 1 (n = 23, r2 = 0.62)
The estimation error in this expression, ± 1, was calculated by Kenaga (1980). Fromthe above expression with log Kow equal to 1.45, an assumed pasture intake by beefcattle of 60 kg/d (McKone and Ryan, 1989), and an assumed fat content of 0.4 inmeat; we obtain the following estimation:
Bt2 (est) = 1.2 × 10⁻⁵ days/kg (meat)
CV = 14
The above estimation error corresponds to a CV of 14.
14
Final Draft: December 1994 1,2 Dichloroethane (DCA)
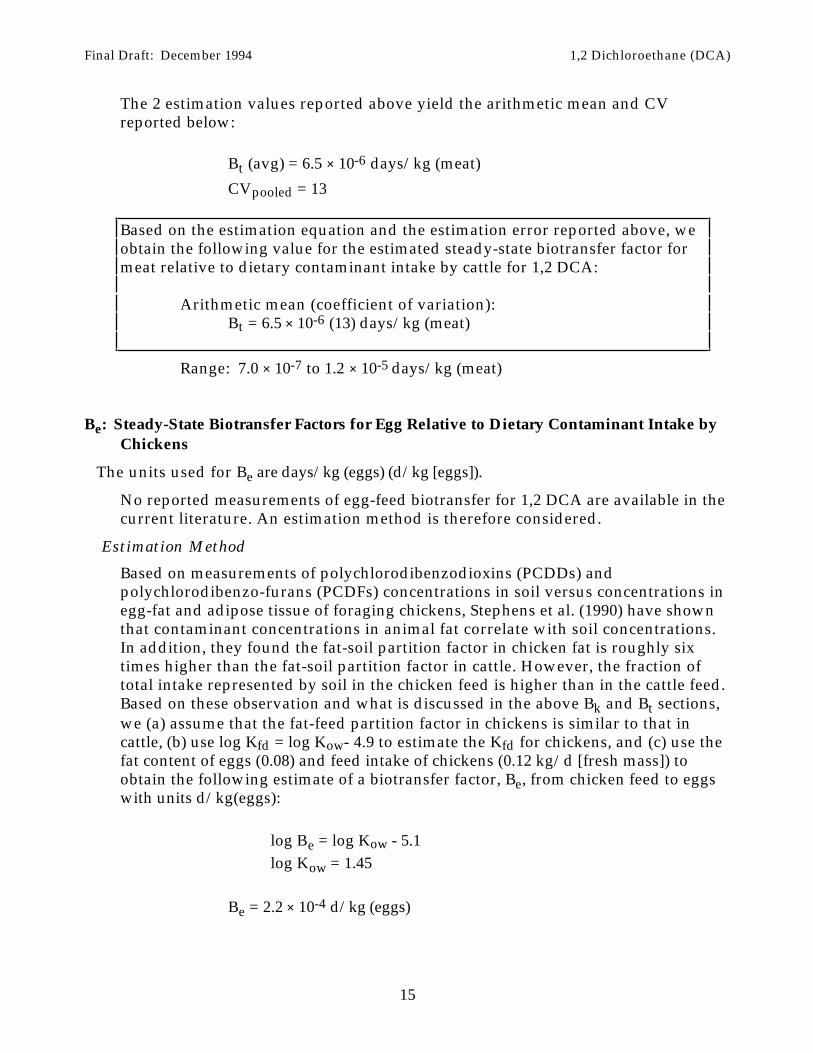
The 2 estimation values reported above yield the arithmetic mean and CVreported below:
Bt (avg) = 6.5 × 10⁻⁶ days/kg (meat)
CVpooled = 13
Based on the estimation equation and the estimation error reported above, weobtain the following value for the estimated steady-state biotransfer factor formeat relative to dietary contaminant intake by cattle for 1,2 DCA:
Arithmetic mean (coefficient of variation):Bt = 6.5 × 10⁻⁶ (13) days/kg (meat)
Range: 7.0 × 10⁻⁷ to 1.2 × 10⁻⁵ days/kg (meat)
Be: Steady-State Biotransfer Factors for Egg Relative to Dietary Contaminant Intake byChickens
The units used for Be are days/kg (eggs) (d/kg [eggs]).
No reported measurements of egg-feed biotransfer for 1,2 DCA are available in thecurrent literature. An estimation method is therefore considered.
Estimation Method
Based on measurements of polychlorodibenzodioxins (PCDDs) andpolychlorodibenzo-furans (PCDFs) concentrations in soil versus concentrations inegg-fat and adipose tissue of foraging chickens, Stephens et al. (1990) have shownthat contaminant concentrations in animal fat correlate with soil concentrations.In addition, they found the fat-soil partition factor in chicken fat is roughly sixtimes higher than the fat-soil partition factor in cattle. However, the fraction oftotal intake represented by soil in the chicken feed is higher than in the cattle feed.Based on these observation and what is discussed in the above Bk and Bt sections,we (a) assume that the fat-feed partition factor in chickens is similar to that incattle, (b) use log Kfd = log Kow- 4.9 to estimate the Kfd for chickens, and (c) use thefat content of eggs (0.08) and feed intake of chickens (0.12 kg/d [fresh mass]) toobtain the following estimate of a biotransfer factor, Be, from chicken feed to eggswith units d/kg(eggs):
log Be = log Kow - 5.1
log Kow = 1.45
Be = 2.2 × 10⁻⁴ d/kg (eggs)
15

Final Draft: December 1994 1,2 Dichloroethane (DCA)
We estimate the CV in this expression is 14.
Based on the estimation equation and the estimation error reported above, weobtain the following value for the estimated steady-state biotransfer factors foregg concentration relative to dietary contaminant intake by chickens for 1,2DCA:
Arithmetic mean (coefficient of variation):Be = 2.2 × 10⁻⁴ (14) days/kg (eggs)
Bbmk: Biotransfer Factor for Human Breast Milk Relative to Dietary ContaminantIntake by the Mother
The units used for Bbmk are days/kg (mothers milk) (d/kg [mothers milk]).
No experimental results quantifying Bbmk are available in the current literature.An estimation method (Smith, 1987), is therefore considered:
Estimation Method
Bbmk = 2 × 10⁻⁷ Kow
Kow = 28
Bbmk = 5.6 × 10⁻⁶ days/kg (mothers' milk)
The CV of the above method is approximately 10.
Based on the estimation equation and the estimation error reported above, weobtain the following value for the estimated biotransfer factor for human breastmilk concentration relative to dietary contaminant intake by the mother for 1,2DCA:
Arithmetic mean (coefficient of variation):Bbmk = 5.6 × 10⁻⁶ (10) days/kg (mothers' milk)
16

Final Draft: December 1994 1,2 Dichloroethane (DCA)
BCF: Bioconcentration Factors for Fish Relative to Water Concentration
The units used for BCF (fish/water) are mg/kg (fish)
mg/liter (water) , and BCF is therefore
unitless.
Experimental Values:
2 reported at 16 °C as 2 BCF fish/water by Veith et al. (1980) using bluegillsunfish and a concentration of 96 µg/l
From the measured value* reported above, and the assumption that thevariation in this measurement is approximately 1, we obtain the followingstatistics for BCF in fish relative to contaminant concentration in water for 1,2DCA:
Arithmetic mean (coefficient of variation):BCF (fish/water) = 2 (1)
*lipid-based BCFs are adjusted downward by a factor of 0.08 to account for fishlipid content
Estimation Method
For fish, the BCF is taken as the ratio of concentration of a xenobiotic substance infish flesh (or lipids) to the contaminant's concentration in water (Mackay, 1982)The BCF for neutral organic compounds can be estimated from regressionequations based on selected physicochemical properties, particularly a compound'sKow or aqueous solubility. Mackay (1982) recommends:
BCF = 0.048 Kow
Kow = 28
BCF (est) = 1.3
CV = 0.6
The reported GSD is 1.8 which corresponds to an estimation error of 0.6.
Kp_w: Human Skin Permeability Coefficient Relative to Contaminant Concentrationin Water
The units used for Kp_w are centimeters/hour (cm/hr).
No reported measurements of Kp_w for 1,2 DCA are available in the currentliterature. An estimation method for this parameter is thus applied.
17

Final Draft: December 1994 1,2 Dichloroethane (DCA)
Estimation Method
Because dermal transfer is considered a nonsteady-state event, diffusion modelsrequire input parameters which are difficult to measure, such as the stratumcorneum diffusion coefficient (Dsc) [Flynn and Amidon (1991)]. Estimation ofaqueous biotransfer of 1,2 DCA is calculated with the following equation based onthe estimation method of McKone and Howd (1992).
Kp_w = MW-0.6
0.33 +
0.0025
2.4 × 10⁻⁶ + 3 × 10⁻⁵ K0.8ow
-1
Kow = 28
MW = 96.97 g/mol
Kp_w = 0.010 cm/hr
who report a coefficient of variation equal to 2.4
Based on the estimation equation and the estimation error reported above, weobtain the following value for the estimated human skin permeabilitycoefficient relative to contaminant water concentration for 1,2 DCA:
Arithmetic mean (coefficient of variation):Kp_w = 0.010 (2.4) cm/hr
Km: Partition Coefficient for Human Skin Relative to Contaminant Concentration inWater or Soil
The units used for Km are mg/kg (skin)
mg/liter (water) (ppm [skin]/ppm [water]).
No experimental values for Km are currently available in the literature, thereforean estimation method is considered.
Estimation Method
Experimental values quantifying dermal transfer of 1,2 DCA in water, or for waterin a soil matrix, may depend on pH, particle size and organic carbon content(Flynn and Amidon, 1991). An estimation method based on McKone and Howd(1992) is therefore used here.
Km = 0.64 + (0.25 K0.8ow)
Kow = 28
18

Final Draft: December 1994 1,2 Dichloroethane (DCA)
Km = 4.2 ppm (skin)/ppm (water)
The reported geometric standard deviation of 1.3 in this estimation methodcorresponds to a CV of 0.27.
Based on the estimation equation and the estimation error reported above, weobtain the following value for the partition coefficient into human skinrelative to 1,2 DCA water or soil concentration:
Arithmetic mean (coefficient of variation):Km= 4.2 (0.27) ppm (skin)/ppm (water)
Thalf_a: Reaction Half-Life in Air
The units used for Thalf_a are days.
ExperimentalValues
9.8 reported as a photo-oxidation half-life of 234 hours by Radding et al.(1977) [Callahan et al. (1979)]
36 reported at 23 °C as a photooxidation rate constant of 22 × 10-14
cm3/molecule-sec. by Howard and Evenson (1976) using hydroxylradicals and assuming a hydroxyl radical concentration of 1 × 10⁶
molecules/cm3
12 to reported as a photo-oxidation half-life of 292 to 2917 hours by Atkinson122 (1985) from the vapor phase reaction with hydroxyl radicals in air [also
cited by Howard (1991) and MacKay et al. (1992)]
From the 4 experimental values reported above, we obtain the followingstatistics on the reaction half-life for 1,2 DCA in air:
Arithmetic mean (coefficient of variation):Thalf_a = 45 (1.2) days
Range: 9.8 to 122 days
19

Final Draft: December 1994 1,2 Dichloroethane (DCA)
Thalf_g: Reaction Half-Life in Ground-Surface Soil
The units used for Thalf_g are days.
Estimated Values
71 to reported at 25 °C as an aerobic degradation rate in aquifer material of118 15.12 and 23.85% by Watwood et al. (1991) using a Sandia and a Bosque
unsaturated calcareous soils from New Mexico, 100 ppb, and 14C labelled1,2 DCA for 4 weeks and assuming first-order degradation with respectto concentration
77 to reported as a half-life of 11-24 weeks by Wilson et al. (1983) using soil168 from a shallow water-table aquifer at 20 °C for 16 weeks and assuming
first-order degradation with respect to concentration [also cited inHoward (1991) and Mackay et al. (1992)]
From the 4 measured values above, we obtain the following statistics for thereaction half-life for 1,2 DCA in surface soil:
Arithmetic mean (coefficient of variation):Thalf_g = 110 (0.41) days
Range: 71 to 168 days
Thalf_s: Reaction Half-Life in Root-Zone Soil
The units used for Thalf_s are days.
Estimated Values
71 to reported at 25 °C as an aerobic degradation rate in aquifer material of118 15.12 and 23.85% by Watwood et al. (1991) using a Sandia and a Bosque
unsaturated calcareous soils from New Mexico, 100 ppb, and 14C labelled1,2 DCA for 4 weeks and assuming first-order degradation with respectto concentration
77 to reported as a half-life of 11-24 weeks by Wilson et al. (1983) using soil168 from a shallow water-table aquifer at 20 °C for 16 weeks and assuming
first-order degradation with respect to concentration [also cited inHoward (1991) and Mackay et al. (1992)]
20

Final Draft: December 1994 1,2 Dichloroethane (DCA)
From the 4 measured values above, we obtain the following statistics for thereaction half-life for 1,2 DCA in root-zone soil:
Arithmetic mean (coefficient of variation):Thalf_s = 110 (0.41) days
Range: 71 to 168 days
Thalf_v: Reaction Half-Life in Vadose-Zone Soil
The units used for Thalf_v are days.
Experimental Values
71 to reported at 25 °C as an aerobic degradation rate in aquifer material of118 15.12 and 23.85% by Watwood et al. (1991) using a Sandia and a Bosque
unsaturated calcareous soils from New Mexico, 100 ppb, and 14C labelled1,2 DCA for 4 weeks and assuming first-order degradation with respectto concentration
77 to reported as a half-life of 11-24 weeks by Wilson et al. (1983) using soil168 from a shallow water-table aquifer at 20 °C for 16 weeks and assuming
first-order degradation with respect to concentration [also cited inHoward (1991) and Mackay et al. (1992)]
568 to reported at 25 °C as an anaerobic degradation rate in aquifer material of573 3.33 and 3.36 % by Watwood et al. (1991) using a Sandia and a Bosque
unsaturated calcareous soils from New Mexico, 100 ppb, and 14C labelled1,2 DCA for 4 weeks and assuming first-order degradation with respectto concentration
From the 6 values above, we obtain the following statistics for the reaction half-life for 1,2 DCA in vadose-zone soil:
Arithmetic mean (coefficient of variation):Thalf_v = 260 (0.92) days
Range: 71 to 573 days
21

Final Draft: December 1994 1,2 Dichloroethane (DCA)
Thalf_q: Reaction Half-Life in Groundwater
The units used for Thalf_q are days.
Experimental Values
71 to reported at 25 °C as an aerobic degradation rate in aquifer material of118 15.12 and 23.85% by Watwood et al. (1991) using a Sandia and a Bosque
unsaturated calcareous soils from New Mexico, 100 ppb, and 14C labelled1,2 DCA for 4 weeks and assuming first-order degradation with respectto concentration
77 to reported as a half-life of 11-24 weeks by Wilson et al. (1983) using soil168 from a shallow water-table aquifer at 20 °C for 16 weeks and assuming
first-order degradation with respect to concentration [also cited inHoward (1991) and Mackay et al. (1992)]
568 to reported at 25 °C as an anaerobic degradation rate in aquifer material of573 3.33 and 3.36 % by Watwood et al. (1991) using a Sandia and a Bosque
unsaturated calcareous soils from New Mexico, 100 ppb, and 14 Clabelled 1,2 DCA for 4 weeks and assuming first-order degradation withrespect to concentration
289 reported as a biotransformation rate constant of 1 × 10⁻⁴ hrs-1 by Silka(1988) using data from measurements at a sand and gravel outwashaquifer located in Tacoma, WA
From the 7 values above, we obtain the following statistics for the reaction half-life for 1,2 DCA in groundwater:
Arithmetic mean (coefficient of variation):Thalf_q = 270 (0.83) days
Range: 71 to 573 days
Thalf_w: Reaction Half-Life in Surface Water
The units used for Thalf_w are days.
Experimental Values
21 reported at 25 °C as a half-life in water of 21 days by Tabak et al. (1981)using domestic wastewater conditions in a static-culture flask-screeningprocedure for 28 days in the dark
540 reported as a dark phase half-life in water of 18 months by Dilling (1975)assuming first order kinetics
22
Final Draft: December 1994 1,2 Dichloroethane (DCA)
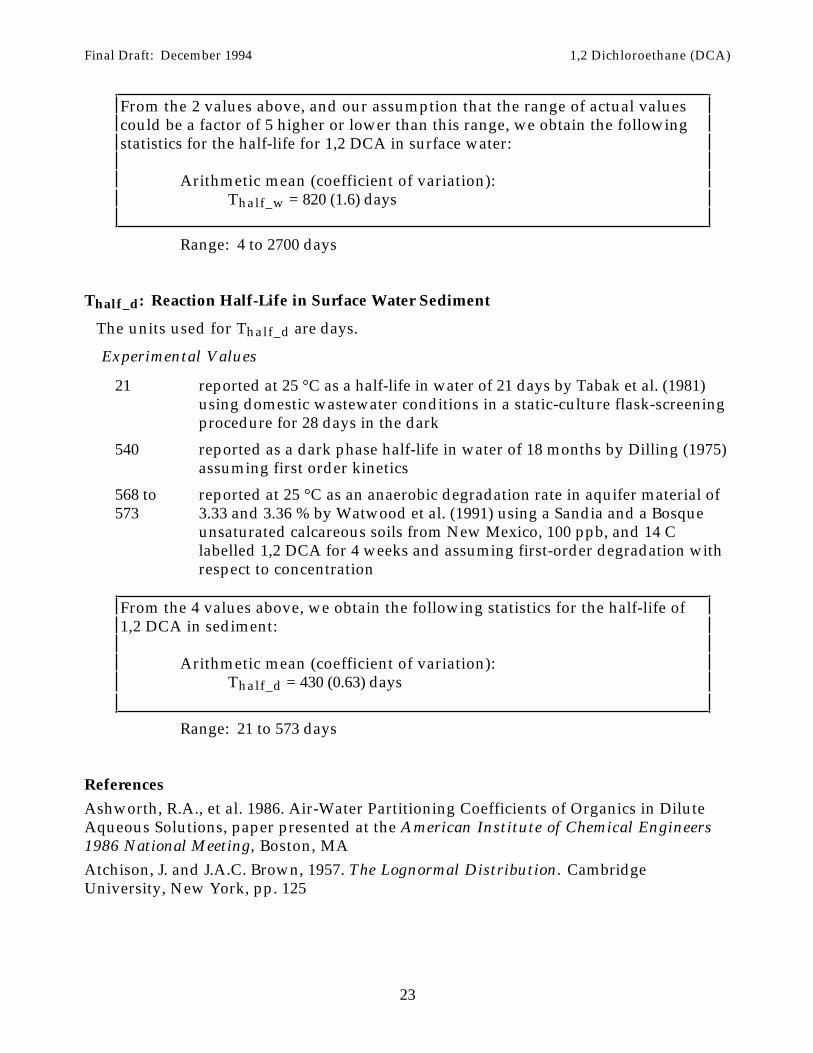
From the 2 values above, and our assumption that the range of actual valuescould be a factor of 5 higher or lower than this range, we obtain the followingstatistics for the half-life for 1,2 DCA in surface water:
Arithmetic mean (coefficient of variation):Thalf_w = 820 (1.6) days
Range: 4 to 2700 days
Thalf_d: Reaction Half-Life in Surface Water Sediment
The units used for Thalf_d are days.
Experimental Values
21 reported at 25 °C as a half-life in water of 21 days by Tabak et al. (1981)using domestic wastewater conditions in a static-culture flask-screeningprocedure for 28 days in the dark
540 reported as a dark phase half-life in water of 18 months by Dilling (1975)assuming first order kinetics
568 to reported at 25 °C as an anaerobic degradation rate in aquifer material of573 3.33 and 3.36 % by Watwood et al. (1991) using a Sandia and a Bosque
unsaturated calcareous soils from New Mexico, 100 ppb, and 14 Clabelled 1,2 DCA for 4 weeks and assuming first-order degradation withrespect to concentration
From the 4 values above, we obtain the following statistics for the half-life of1,2 DCA in sediment:
Arithmetic mean (coefficient of variation):Thalf_d = 430 (0.63) days
Range: 21 to 573 days
References
Ashworth, R.A., et al. 1986. Air-Water Partitioning Coefficients of Organics in DiluteAqueous Solutions, paper presented at the American Institute of Chemical Engineers1986 National Meeting, Boston, MA
Atchison, J. and J.A.C. Brown, 1957. The Lognormal Distribution. CambridgeUniversity, New York, pp. 125
23

Final Draft: December 1994 1,2 Dichloroethane (DCA)
Atkinson, R., 1985. Kinetics and Mechanisms of the Gas Phase Reaction of HydroxylRadical with Organic Compounds Under Atmospheric Conditions, Chem. Rev. 85: 69–201
Atkinson, R., 1989. Kinetics and Mechanisms of the Gas-Phase Reactions of theHydroxyl Radical with Organic Compounds. J. of Phy. and Chem. Ref. Data. MonographNo. 1
Banerjee, S., S.H. Yalkowsky, and S.C. Valvani 1980. Water Solubility andOctanol/Water Partition Coefficient of Organics. Limitations of Solubility-PartitionCoefficient Correlation, Environ. Sci. Technol. 14(10):1227-1229
Beratergremium Fur Umweltrelevante Altstoffe (BUA) Der Gesellschaft DeutscherChemiker (Consulting Group Of The German Chemical Society For EnvironmentallyRelevant Existing Chemicals), 1987. Dichlormethan BUA-Stoffbericht Nr. 6 (Report No.6 on Dichloromethane). VCH New York, NY
Boublík, T., V. Fried, and E. Hála, 1984. The Vapour Pressures of Pure Substances:Selected Values of the Temperature Dependence of the Vapour Pressures of Some PureSubstances in the Normal and Low Pressure Region (Second Revised Edition), PhysicalSciences Data; 17 Elsevier Science, Amsterdam, The Netherlands)
Bruggeman, R., Trapp, S., Matthies, M., 1991. Behavior Assessment of a VolatileChemical in the Rhine River. Environ. Toxicol. & Chem. 10:1097-1103
Callahan, M.A., et al, 1979. Chapter 44. 1,2-Dichloroethane (Ethylene Dichloride). 2:Water-Related Environmental Fate of 129 Priority Pollutants. Vol. 2. EPA-440/4-79-029b. U.S. Environmental Protection Agency, Washington, DC 44-1 to 44-10
Chiou, C.T., L.J. Peters, and A.H. Freed 1979. A Physical Concept of Soil-Water Equilibriafor Nonionic Organic Compounds, Science 206:831–832
Clayton, G. D. and Clayton, F. E. Ed., 1981. Patty's Industrial Hygiene & Toxicology.Third ed., John Wiley & Sons, New York. Vol. 2B:3491-3497
Coca, J. and R. Diaz, 1980. J. Chem. Eng. Data 25(1):80-83
Dean, J.D., Ed. 1985. Lange's Handbook of Chemistry McGraw-Hill, New York City, NY,13th ed
Dilling, W. L. 1977. Environ. Sci. Technol. 11(4):405-409
Dilling, W.L., N.B. Tefertiller and G.J. Kallos, 1975. Evaporation Rates and Reactivitiesof Methylene Chloride, Chloroform, 1,1,1-Trichloroethane, Trichloroethylene,Tetrachloroethylene, and Other Chlorinated Compounds in Dilute Aqueous Solutions.Environ. Sci. Technol. 9(9):833-838
EPA/OTS, 1987. Analysis and Interpretation of Batch Equilibrium and Column Studiesof the Partitioning of Chlorinated Hydrocarbons to Soil Materials from the PPG LakeCharles Site, Doc #86-870002008,
Flynn and Amidon, 1991. Dermal Exposure Assessment: Principles and Applications,Interim Report. USEPA Jan, 1992. Office of Research and Development. Washington,DC. EPA/600/8-91/011B
Fuller, E.N., P.D. Schettler, and J.C. Giddings, 1966. A New Method for Prediction ofBinary Gas-Phase Diffusion Coefficients, Ind. Eng. Chem. 58:19-27
24

Final Draft: December 1994 1,2 Dichloroethane (DCA)
Gross, P. M., 1929. The Determination of the Solubility of Slightly Soluble Liquids inWater and the Solubilities of Dichloroethanes and Dichloropropanes, J. Am. Chem Soc.51:2362-2366
Gross, P.M., and J.H. Saylor, 1931. The Solubilities of Certain Slightly Soluble OrganicCompounds in Water, J. Am. Chem. Soc. 53:1744-1751
Gutsche, B., and H., Knapp, 1982. Fluid Phase Equilibria 8:285
Hamburg, M. 1970. Statistical Analysis for Decision Making. Harcourt BraceJovanovich; San Diego, California
Hansch, C., and A. Leo 1987. The Log P and Related Parameters Database, created andupdated by the Medicinal Chemistry Project at Pomona College, Claremont, CA, underthe direction of Corwin Hansch and Albert Leo — 1987 Printout
Hansch, C., and A. Leo, 1985. The Log P and Related Parameters Database, created andupdated by the Medicinal Chemistry Project at Pomona College under the direction ofCorwin Hansch and Albert Leo — 1985 Printout, Medchem Project Issue Nº. 26,Pomona College, Claremont, CA
Hendry and Kenley, 1976. Atmospheric Reaction Products of Organic Compounds, EPAReport. EPA-560/12-79-001, 81 pp
Horvath, A. L., 1982. Halogenated Hydrocarbons, Solubility–Miscibility with WaterMarcel Dekker, Inc., New York, NY
Howard, C. J. and Evenson, K. M., 1976. Rate Constants for the Reactions of OH withEthane and Some Halogen Substituted Ethanes at 296 K, J Chem. Phys. 64(11):4303-4306
Howard, P. H., R. S. Boethling, W. F. Jarvis, W. M. Meylan, and E. M. Michalenko, Eds.1991. Handbook of Environmental Degradation Rates Lewis; Chelsea, MI
Howard, P.H., G.W. Sage, W.F. Jarvis, and D.A. Gray, Eds. 1990. Handbook ofEnvironmental Fate and Exposure Data for Organic Chemicals. Volume II. SolventsLewis; Chelsea, MI
Jow, P. and Hansch, 1985. Pomona College, Unpublished Results
Karickhoff, S. W., 1981. Semi-Empirical Estimation of Sorption of HydrophobicPollutants of Natural Water Sediments and Soils, Chemosphere 10(8):833-846
Kenaga, E. E., 1980. Correlation of Bioconcentration Factors of Chemicals in Aquatic andTerrestrial Organisms with Their Physical and Chemical Properties. Environ. Sci.Technol. , 14(5):553-556
Kirk–Othmer Encyclopedia of Chemical Technology, 1964. Chlorocarbons andChlorohydrocarbons, Vol. 5, 2nd ed., Wiley Interscience; New York, NY. pp 100-363
Liljestrand, H. M. and R. J. Charbeneau, 1987. Analysis and Interpretation of BatchEquilibrium and Column Studies of the Partitioning of Chlorinated Hydrocarbons toSoil Materials from the PPG Lake Charles Site. Environmental and Water ResourcesEngineering , Department of Civil Engineering, The University of Texas at Austin.Austin, TX 78712
25

Final Draft: December 1994 1,2 Dichloroethane (DCA)
Lyman, W. J., W. F. Reehl, and D. H. Rosenblatt, 1990. Handbook of Chemical PropertyEstimation Methods: Environmental Behavior of Organic Compounds , AmericanChemical Society, Washington, DC
Lyman, W. J., W. F. Reehl, and D. Rosenblatt, 1982. Handbook of Chemical PropertyEstimation Methods: Environmental Behavior of Organic Compounds. AmericanChemical Society, Washington, D. C.
Mackay, D. 1982. Correlation of Bioconcentration Factors, Environ. Sci. Technol. 16:274–278
Mackay, D., W.-Y. Shiu, and K.-C. Ma, 1993. Illustrated Handbook of Physical-ChemicalProperties and Environmental Fate for Organic Chemicals. Volume III. VolatileOrganic Chemicals, Lewis; Boca Raton, FL
McGovern, E. W., 1943. Chlorohydrocarbon Solvents. Ind. Eng. Chem. 35(12):1230-1239
McKone, T. E., and Howd, R. A., 1992. Estimation Dermal Uptake of Nonionic OrganicChemicals from Water and Soil: I. Unified Fugacity-Based Models for RiskAssessments. Risk Analysis 12(4):543-557
McKone, T. E., and Ryan, P. B., 1989. Human Exposures to Chemicals Through FoodChains: An Uncertainty Analysis. Environ. Sci. Technol. 23:1154-1163
McKone, T.E., 1993. The Precision of QSAR Methods for Estimating IntermediaTransfer Factors in Exposure Assessments, SAR and QSAR in EnvironmentalResearch, 1:41-51
McNally, M.E., and R.L. Grob, 1984. Headspace Determination of Solubility Limits of theBase Neutral and Volatile Components from Environmental Protection Agency's Listof Priority Pollutants. J. Chromatog. 284:105-116
Morgan, D. L., Cooper, S W., Carlock, D L., Sykora, J J., Sutton, B., Mattie, DR.,McDougal, JN. Dermal Absorption of Neat and Aqueous Volatile Organic Chemicals inthe Fischer 344 Rat. Environ-Res, Vol 55(1):51-63
Mudder, T. 1981. Development of Empirical Structure-Biodegradability Relationshipsand Testing Protocol for Slightly Soluble and Volatile Priority Pollutants, Diss. Abstr.Int. B. 42:1804
Pearce, J. N., and P. E. Peters, 1929. J. Phys. Chem. 33:873
Radding, S. B., Lui, D. H., Johnson, H. L., & Mill, T. 1977. Review of the EnvironmentalFate of Selected Chemicals, Washington, DC, US EPA, office of Toxic Substances. EPA560/5-77-003, PB 267121
Reid, R. C., J. M. Prausnitz, and B. E. Poling, 1987. The Properties of Gases and LiquidsMcGraw Hill, New York, NY 4th ed
Reiderer, M. 1990. “Estimating Partitioning and Transport of Organic Chemicals in theFoliage/Atmosphere System: Discussion of a Fugacity-Based Model,” Environ. Scil.Technol. 24:829–837
Riddick, J. A. , Bunger, W. B., Sakano, T. K., 1986. Organic Solvents: Physical Propertiesand Mehods of Purification. 4th ed., John Wiley & Sons. New York, NY Vol. II: No. 319
26

Final Draft: December 1994 1,2 Dichloroethane (DCA)
Scherb, K., 1978. [Investigations on the Evaporation of Low Molecular WeightChlorinated Hydrocarbons form Flow-Gutter] Munch. Beitr. Abwasser-Fisch. Flussbiol., 30:235-248 (in German)
Schwarzenbach, R. P., Gschwend, P. M., and D. M. Imboden, 1993. EnvironmentalOrganic Chemistry. Wiley-Interscience, John Wiley and Sons, New York, NY
Silka, L.R., and D.A. Wallen, 1988. Observed Rates of Biotransformation of ChlorinatedAliphatics in Groundwater. Superfund '88, Proceedings of the 9th National Conference,Nov. 28-30, 1988, Washington, DC Hazardous Materials Control Research Institute,Washington, DC pp. 138-141
Smith, A. H. 1987. Infant Exposure Assessment for Breast Milk Dioxins and FuransDerived from Waste Incineration Emissions. Risk Analysis 7:347-353
Stephens, R. D., Harnly, M., Haywood, G. G., Chang, R. R., Flattery, J., Petreas, M. X.,Goldman, L., 1990. Bioaccumulation of Dioxins in Food Animals II: ControlledExposure Studies, Chemosphere 20:1091-1096
Stull, D. R. 1947. Vapor Pressure of Pure Substances: Organic Compounds, Ind. Eng.Chem. 39:517–540
Tabak, H. H., Quave, S. A., Mashni, C. I., and Barth, E. F., 1981. Biodegradability Studieswith Organic Priority Pollutant Compounds. J. Water Pollut. Control Fed., 53:153-1518
Thermodynamics Research Center Data Project, Thermodynamics Research Center,College Station, Texas A&M University. Table 23-10-2-(2.013)-a, Dec. 31, 1964
Travis, C. C., and A. D. Arms, 1988. Bioconcentration of Organics in Beef, Milk, andVegetation, Environ. Sci. Technol. 22:271–274
Tse, G., Orbey, H., and Sandler, S. I. Infinite Dilution Activity Coefficients and Henry'sLaw Coefficients of Some Priority Water Pollutants Determined By a Relative GasChromatographic Method. Environmental Science & Technology 26(10):2017-2022
US Department of Health and Human Services, Toxicological Profile for 1,2Dichloroethane. Draft, 1993
Veith, G.D., K.J. Macek, S.R. Petrocelli, and J. Caroll 1980. An Evaluation of UsingPartition Coefficients and Water Solubility to Estimate Bioconcentration Factors forOrganic Chemicals in Fish, in Aquatic Toxicology, ASTM STP 707, J. G. Eaton,P. R. Parrish, and A. C. Hendricks, Eds. American Society for Testing and Materials,Philadelphia, PA pp 117–119
Verschueren, K., 1983. Handbook of Environmental Data on Organic Chemicals,Second Edition, Van Nostrand Reinhold, New York, NY
Warner, H.P., J.M. Cohen and J.C. Ireland, 1987. Determination of Henry's LawConstants of Selected Priority Pollutants., EPA/600/D-87/229 U.S. EPA, Cincinnati, OH.NTIS: PB87-212684 14
Weast, R. C., Lide, D. R., Astle, M.J. and Beyer, W.H. Eds. 1989. CRC Handbook ofChemistry and Physics: A Ready Reference Book of Chemical and Physical Data, 67thed. CRC Press, Boca Raton, FL
Wilke, C.R., and P. Chang, 1955. Correlation of Diffusion Coefficients in DiluteSolutions, AIChE J. 1:264–270
27

Final Draft: December 1994 1,2 Dichloroethane (DCA)
Wilson, J.T., McNabb, J. F., Blackwill, D.L., Ghiorse, W. C., 1983. Enumeration andCharacterization of Bacteria Indigenous to a Shallow Water-table Aquifer. GroundWater 21:134-142.
World Health Organization International Agency for Research on Cancer, 1985.Monographs on the Evaluation of the Carcinogenic Risk of Chemicals to Humans:Some Chemicals Used in Plastics and Elastomers, 39:195-215
Wright, W.H., and J.M. Schaffer, 1932. Critical Anthelmintic Tests of Chlorinated AlkylHydrocarbons and a Correlation Between the Anthelmintic Efficacy, ChemicalStructure and Physical Properties, Am. J. Hyg. 16(2):325-428
28