1/17/2015 1 gas chromatography, refractive index & distillation the next two (2) experiments...
TRANSCRIPT
1/17/2015 1
Gas Chromatography, Refractive Index & Distillation The next two (2) experiments introduce Gas
Chromatography and Simple & Fractional Distillation. They are then tied together along with the Refractive
Index technique in a third experiment. This Week
Gas Chromatography – Acetates Pavia – p. 817 - 836 Slayden – p. 39 - 31
2nd Week Distillation of a Mixture
Slayden – p. 43 - 46 3rd Week
Gas Chromatography and Refractive Index of Distillates from “Distillation of Mixture” Experiment Slayden – p. 47
Gas Chromatography – Acetates

1/17/2015 2
Gas Chromatography Uses
Separation and analysis of organic compounds Testing purity of compounds Determine relative amounts of components in
mixture Compound identification Isolation of pure compounds (microscale work)
Similar to column chromatography, but differs in 3 ways: Partitioning process carried out between Moving Gas
Phase and Stationary Liquid Phase Temperature of gas can be controlled Concentration of compound in gas phase is a
function of the vapor pressure only. GC also known as Vapor-Phase Chromatography (VPC)
and Gas-Liquid Partition Chromatography (GLPC)
Gas Chromatography – Acetates
1/17/2015 3
Gas Chromatograph Microliter Syringe Heated injection port with rubber septum for
inserting sample Heating chamber with carrier gas injection port Oven containing copper, stainless steel, or glass
column Column packed with the Stationary Liquid
Phase, a non-volatile liquid, wax, or low melting solid-high boiling hydrocarbons, silicone oils, waxes or polymeric esters, ethers, and amides. We use DC200 from Dow Chemical
Liquid phase is coated onto a support material, generally crushed firebrick
Gas Chromatography – Acetates

1/17/2015 4
Principals of Separation
Column is selected, packed with Liquid Phase, and installed
Sample injected with microliter syringe into the injection port where it is vaporized and mixed into the Carrier Gas stream (helium, nitrogen, argon)
Sample vapor becomes partitioned between Moving Gas Phase and Stationary Liquid Phase
The time the different compounds in the sample spend in the Vapor Phase is a function of their Vapor Pressure
The more volatile (Low Boiling Point / Higher Vapor Pressure) compounds arrive at the end of the column first and pass into the detector
Gas Chromatography – Acetates

1/17/2015 5
Principals of Detection Two Detector Types
Thermal Conductivity Detector (TCD) (we use this) Flame Ionization
TCD is electrically heated “Hot Wire” placed in carrier gas stream
Thermal conductivity of carrier gas (helium in our case) is higher than most organic substances
Presence of sample compounds in gas stream reduces thermal conductivity of stream
Wire heats up and resistance decreases Two detectors used: one exposed to sample gas and
the other exposed to reference flow of carrier gas Detectors form arms of Wheatstone Bridge, which
becomes unbalanced by sample gas Unbalanced bridge generates electrical signal, which
is amplified and sent to recorder
Gas Chromatography – Acetates
1/17/2015 6
Factors Affecting Separation Boiling Points of Components in Sample
Low boiling point compounds have higher vapor pressures
High boiling point compounds have lower vapor pressures requiring more energy to reach equilibrium vapor pressure, i.e., atmospheric pressure
Boiling point increases as molecular weight increases
Flow Rate of Carrier Gas Choice of Liquid Phase
Molecular weights, functional groups, and polarities of component molecules are factors in selecting liquid phase
Length of Column Similar compounds require longer columns than
dissimilar compounds. Isomeric mixtures often require quite long columns
Gas Chromatography – Acetates

1/17/2015 7
The Experiment Purpose – Introduce the theory and technique of gas
chromatographyIdentify a compound by it retention timeFrom the relationship between peak area and mole content calculate the mole fraction and
mole percent of a compound in a mixture Approach
Obtain chromatograph of a known equimolar mixture of four (4) esters - Ethyl, Propyl, Butyl, Hexyl Acetate
Obtain chromatograph of unknown mixture (one or more compounds in the known mixture)
Determine Retention Times Calculate Peak Areas Adjust Peak Areas for Thermal Response Calculate Total Area from Adjusted Areas Calculate Mole Fraction Calculate Mole Percentage
Gas Chromatography – Acetates
1/17/2015 8
The Experiment (Con’t)
Groups – Work in groups of three (2)
Each group will obtain 2 copies of the chromatogram for the standard (equimolar) mixture
Each Student will run their own unknown
Samples
The Standard (Equimolar) Mixture has 4 esters:
Ethyl Acetate, Propyl Acetate, Butyl Acetate, Hexyl Acetate
The Unknowns have from 2 to 4 of the compounds in the standard mixture
Gas Chromatography – Acetates
1/17/2015 9
The Report The Gas Chromatograph instrument settings and the
processing of the samples to get the chromatograms are considered one (1) procedure
When multiple samples or sub-samples are processed with the same procedure, it is not necessary to set up a separate procedure for each sample
Setup a suitable template in “Results” section to report all of the results obtained
Thus, the process to obtain Gas Chromatograms of the “Known” mixture of 4 acetates and the “Unknown” mixture utilize the same procedure
The computation of the Peak Area, Adjusted Peak Areas, Total Peak area, Mole Fraction, and Mole % are considered “separate” procedures
Gas Chromatography – Acetates
1/17/2015 10
Data Summary Procedure – Using complete sentences summarize, in paragraph form, all of the results obtained in the experiment
Analysis & Conclusion Section Develop a set of arguments to prove the identity
of the unknown compounds in the unknown mixture
Comment on the equivalency of the peak areas and equimolar content of the known mixture
Why was it necessary to apply the Thermal Response Correction Factor to the measured peak areas?
Chromatograms Copied chromatogram sets for each team
member must be copied at the same scale, otherwise retention time computations will be wrong
Tape the trimmed chromatograms to a blank sheet of paper and attach to end of report
Gas Chromatography – Acetates
1/17/2015 11
Record Instrument readings (Place in GC procedure “Results”) Injection Port Temp Column Temp Detector Temp Gas Flow Rate – 60 mL / min Chart Speed – Generally 5 cm /min Moving Liquid Phase – (DC-200)
Injecting the Sample Sample is injected into the “B” port with the Microsyringe The Microsyringe is fragile and expensive – BE CAREFUL Mark “Starting Point” on chart – short vertical line Insert needle fully into “B” Port through the rubber septum Coordinating with chart recorder operator, inject the
sample into the heated chamber, while simultaneously starting the chart recorder
Gas Chromatography – Acetates
For the instrument in the 407 lab, all three temperatures are read from the single dial on the front of cabinet
1/17/2015 12
Determine the Retention Time The period following injection that is required for a
compound to pass through the column to the point where the detector current is maximum, i.e. maximum pen deflection or maximum peak height
For a given set of constant conditions (carrier gas, flow rate of carrier gas, column temperature, column length, liquid phase, injection port temperature), the retention time of any compound is always constant
Retention Time is similar to the “Retardation Factor, Rf” in Thin Layer Chromatography
Compute Retention Time from the Chart Speed (5 or 10 cm/min) and the distance on the chart from the time of injection to the point on the chart where the perpendicular line drawn from the peak height intersects the base line
Gas Chromatography – Acetates

1/17/2015 13
Determination of Retention Time Since Velocity (v) = Distance / Time = d / t Ret Time (t) = Distance(cm) / Velocity(cm/min) = d
/ v
Gas Chromatography – Acetates
Retention Time Distances
Mark Starting Point On Chart (t = 0)
Draw vertical Line from Peak Top to Base Line
Measure Distance from Starting Point to Base of Peak Distance
Note: Disregard “Air Peaks” in all calculations

1/17/2015 14
Quantitative Analysis The area under a gas chromatograph peak is
proportional to the amount (moles) of the compounds eluted
The molar percentage composition of a mixture can be approximated by comparing the relative areas of the peaks in the chromatogram
This approach assumes that the detector is equally sensitive to all compounds and its response is linear
This assumption is usually not valid and will be addressed by adjusting the peak areas using the Thermal Response algorithm described on slides 17-24
Gas Chromatography – Acetates
1/17/2015 15
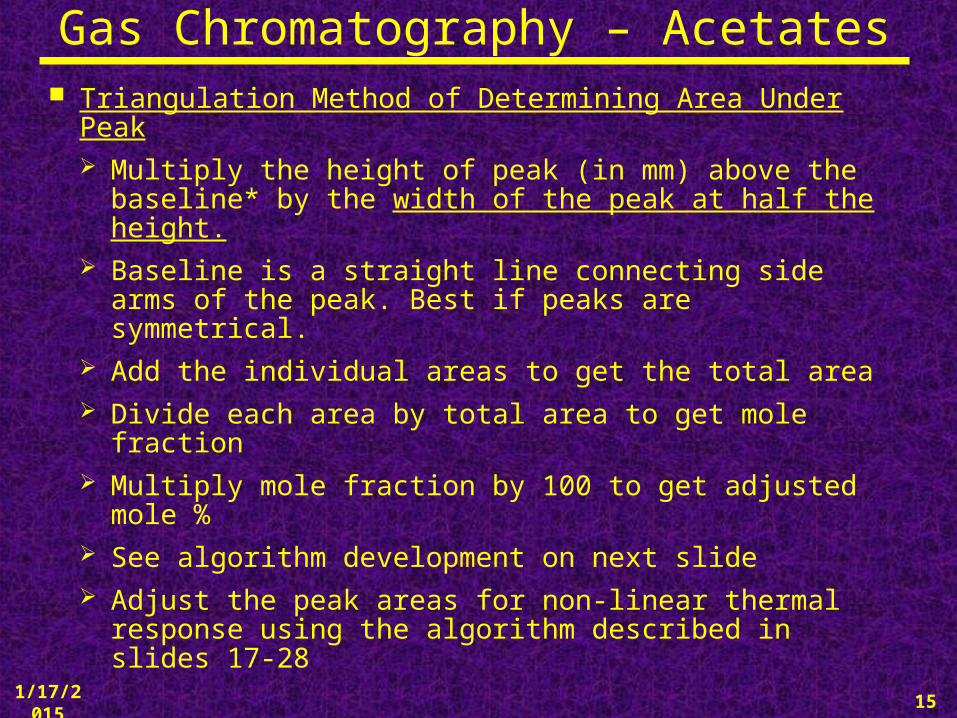
Triangulation Method of Determining Area Under Peak Multiply the height of peak (in mm) above the
baseline* by the width of the peak at half the height.
Baseline is a straight line connecting side arms of the peak. Best if peaks are symmetrical.
Add the individual areas to get the total area Divide each area by total area to get mole fraction Multiply mole fraction by 100 to get adjusted
mole % See algorithm development on next slide Adjust the peak areas for non-linear thermal
response using the algorithm described in slides 17-28
Gas Chromatography – Acetates

1/17/2015 16
Draw Baseline connecting peak bottoms Peak Area by the Triangulation Method
Peak Area = h * w½
Whereh = Peak Height from baseline
w½ = width of peak at ½ the peak height
Adjust Peak Area for thermal responseSee discussion on following slides
Total Adjusted Peak Area (TA) = A + B Mole Fraction (MF) A/TA B/TA Mole Percent= MF x 100
Gas Chromatography – Acetates
Baseline
Baseline
1/17/2015 17
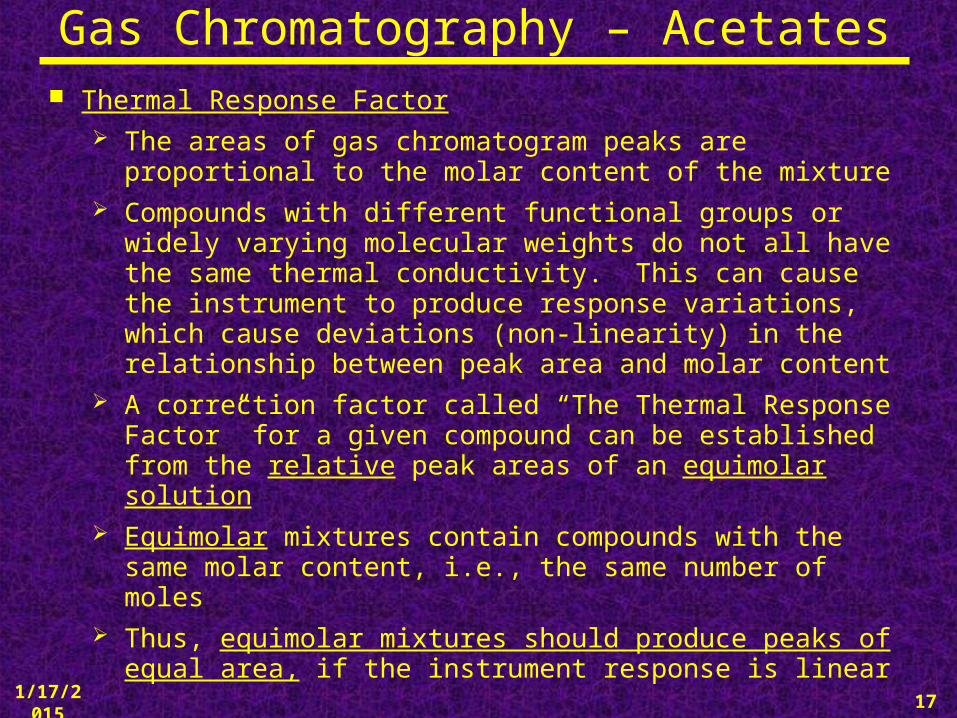
Thermal Response Factor The areas of gas chromatogram peaks are
proportional to the molar content of the mixture Compounds with different functional groups or
widely varying molecular weights do not all have the same thermal conductivity. This can cause the instrument to produce response variations, which cause deviations (non-linearity) in the relationship between peak area and molar content
A correction factor called “The Thermal Response Factor” for a given compound can be established from the relative peak areas of an equimolar solution
Equimolar mixtures contain compounds with the same molar content, i.e., the same number of moles
Thus, equimolar mixtures should produce peaks of equal area, if the instrument response is linear
Gas Chromatography – Acetates

1/17/2015 18
Thermal Response Ratios
GC Peak Area Correction Factor (approach 1) The ratio of one peak area to another in a GC
chromatogram should be proportional to the molar ratio of the components in the mixture
The expression for modifying the Peak Areas for a non-linear area instrument response is constructed as follows: Determine the area of each peak in an
equimolar mixture Compute the ratio of one of the peaks selected
as the “basis for computation” relative to each peak area
Gas Chromatography – Acetates
1 1 1 11 2 3 4
1 2 3 4
Area Area Area AreaTR = TR = TR = TR =
Area Area Area Area
1/17/2015 19
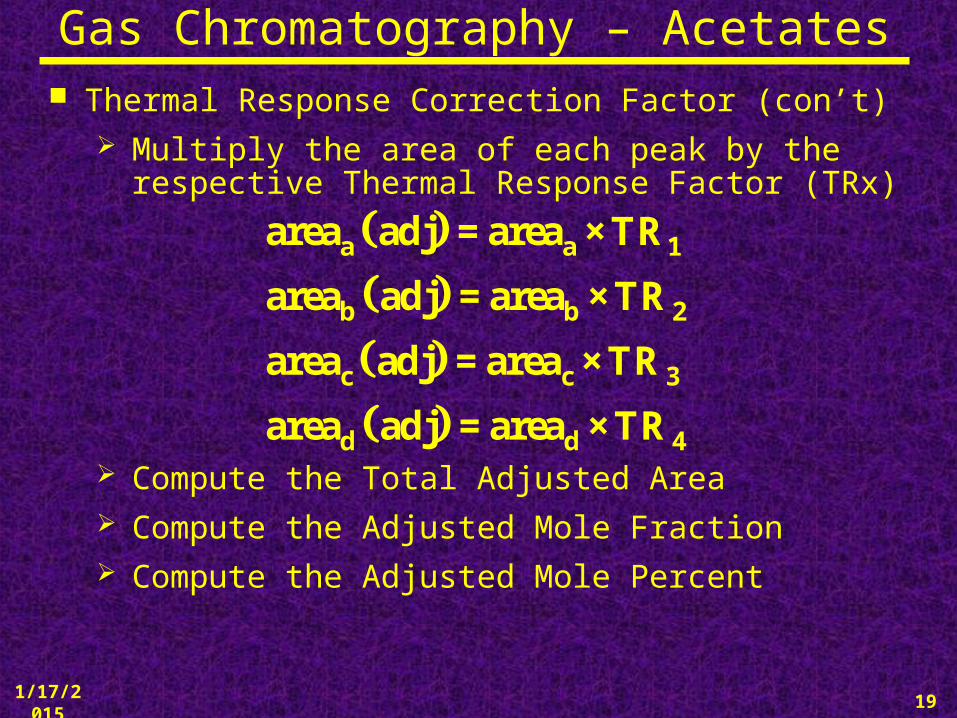
Thermal Response Correction Factor (con’t) Multiply the area of each peak by the
respective Thermal Response Factor (TRx)
Compute the Total Adjusted Area Compute the Adjusted Mole Fraction Compute the Adjusted Mole Percent
Gas Chromatography – Acetates
a a 1
b b 2
c c 3
d d 4
area adj = area ×TR
area adj = area ×TR
area adj = area ×TR
area adj = area ×TR

1/17/2015 20
Thermal Response RatiosExample – Ethyl Acetate (S=2) is used as basis for calculations
Gas Chromatography – AcetatesEtAc (2)EtAc (2) ProAc (3)ProAc (3) BuAc (4)BuAc (4) HexAc (6)HexAc (6)
StandardStandard
EquimolarEquimolar
MixtureMixture
MeasuredMeasured
Peak AreaPeak Area1.441.44 1.091.09 1.161.16 0.980.98
TRTRss/TR/TRii = A = Ass/A/Aii
(s=2)
1.441.44 = 1.00= 1.001.441.44
1.441.44 = 1.32 = 1.321.091.09
1.441.44 = 1.24= 1.241.161.16
1.44 1.44 = 1.47 = 1.470.980.98
UnknownUnknown
MixtureMixture
MeasuredMeasured
Peak AreaPeak Area2.142.14 2.182.18 2.122.12 1.541.54
Adjusted AreasAdjusted Areas 2.14 * 1.00 = 2.142.14 * 1.00 = 2.14 2.18 * 1.32 = 2.882.18 * 1.32 = 2.88 2.12 * 1.24 = 2.632.12 * 1.24 = 2.63 1.54 * 1.47 = 2.261.54 * 1.47 = 2.26
Total Adjusted Area 2.14 + 2.88 + 2.63 + 2.26 = 9.91
Mole Fraction EtAc — 2.14 / 9.91 = 0.216
Mole Fraction ProAc — 2.88 / 9.91 = 0.291
Mole Fraction Bu Ac — 2.63 / 9.91 = 0.265
Mole Fraction HexAc — 2.26 / 9.91 = 0.228

1/17/2015 21
Thermal Response Ratios
GC Peak Area Correction Factor (alternate approach) The ratio of one peak area to another in a GC
chromatogram should be proportional to the molar ratio of the components in the mixture
If the peaks of an equimolar mixture do not have the same area, the relationship between the area of a peak and the mole fraction of the compound in the mixture is incorrect and would have to be adjusted by some factor
The Thermal Response Factor (TR) is determined from an “Equimolar” Mixture
Gas Chromatography – Acetates
1/17/2015 22
The derivation that follows utilizes ratios between any two compounds in a mixture, one of which will be designated as the “basis for computation”
Assuming an equimolar mixture of 4 acetates:
Ethyl Acetate, Propyl Acetate, Butyl Acetate, Hexyl Acetate
In the equation development below, the subscript “i” will be used to designate the compounds in a mixture:
i(1,2,3,4) = Ethyl(1), Propyl(2), Butyl(3), Hexyl(4) In the derivation and examples that follow, Ethyl
Acetate will be used as the basis for the calculations (designated by subscript (s), but any of the other compounds could also be used, such as in the case where the unknown mixture does not contain any Ethyl Acetate
Gas Chromatography – Acetates
1/17/2015 23
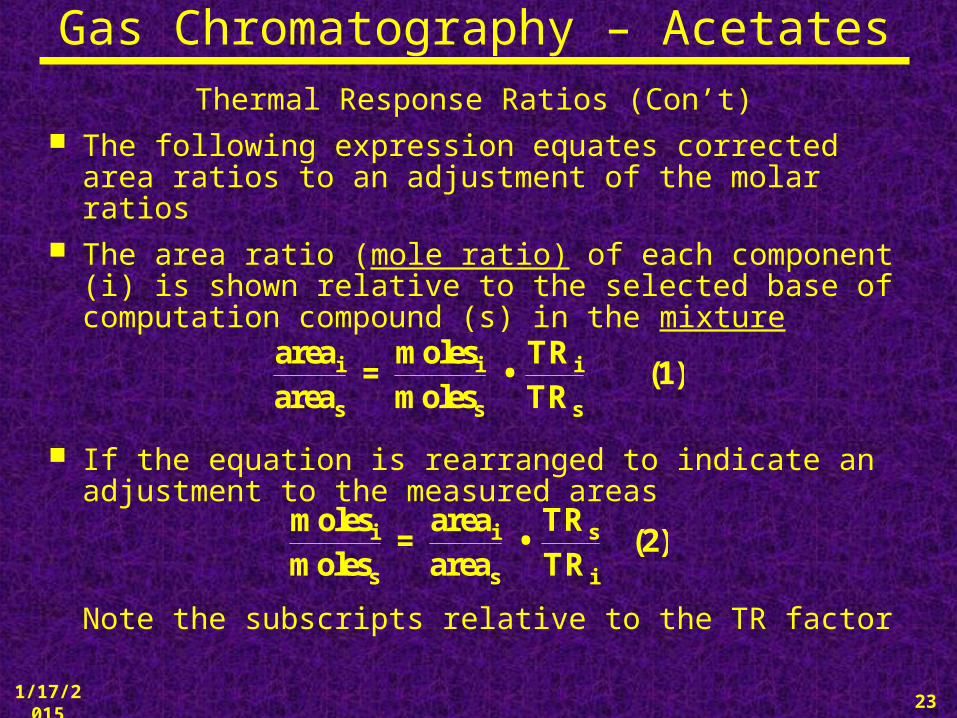
Thermal Response Ratios (Con’t) The following expression equates corrected area
ratios to an adjustment of the molar ratios The area ratio (mole ratio) of each component (i)
is shown relative to the selected base of computation compound (s) in the mixture
If the equation is rearranged to indicate an adjustment to the measured areas
Note the subscripts relative to the TR factor
Gas Chromatography – Acetates
i i i
s s s
area moles TR = • (1)
area moles TR
si i
s s i
TRmoles area = • (2)
moles area TR
1/17/2015 24
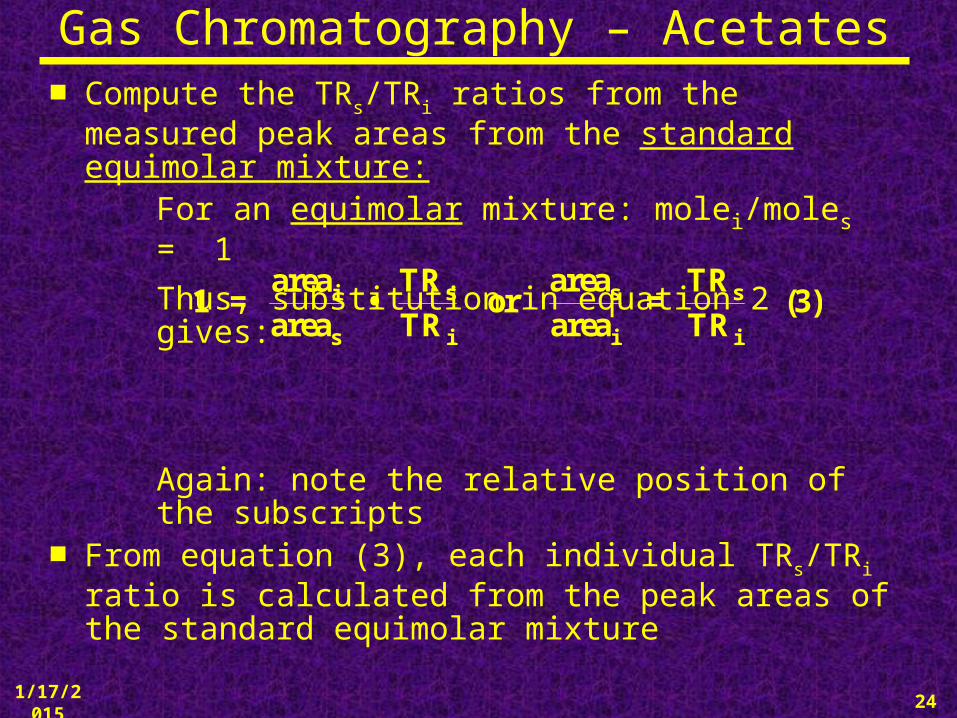
Compute the TRs/TRi ratios from the measured peak areas from the standard equimolar mixture:
For an equimolar mixture: molei/moles = 1
Thus, substitution in equation 2 gives:
Again: note the relative position of the subscripts
From equation (3), each individual TRs/TRi ratio is calculated from the peak areas of the standard equimolar mixture
Gas Chromatography – Acetates
s s si
s i i i
TR area TRarea1 = • or = (3)
area TR area TR
1/17/2015 25
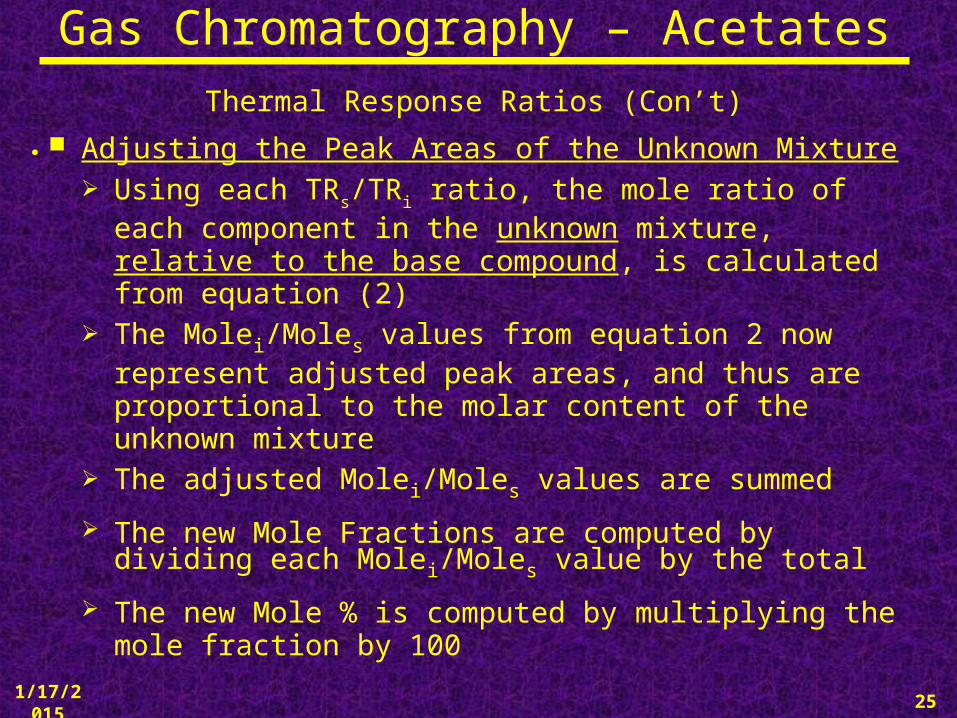
Thermal Response Ratios (Con’t) Adjusting the Peak Areas of the Unknown Mixture
Using each TRs/TRi ratio, the mole ratio of each component in the unknown mixture, relative to the base compound, is calculated from equation (2)
The Molei/Moles values from equation 2 now represent adjusted peak areas, and thus are proportional to the molar content of the unknown mixture
The adjusted Molei/Moles values are summed
The new Mole Fractions are computed by dividing each Molei/Moles value by the total
The new Mole % is computed by multiplying the mole fraction by 100
Gas Chromatography – Acetates
.
1/17/2015 26
Gas Chromatography – Acetates
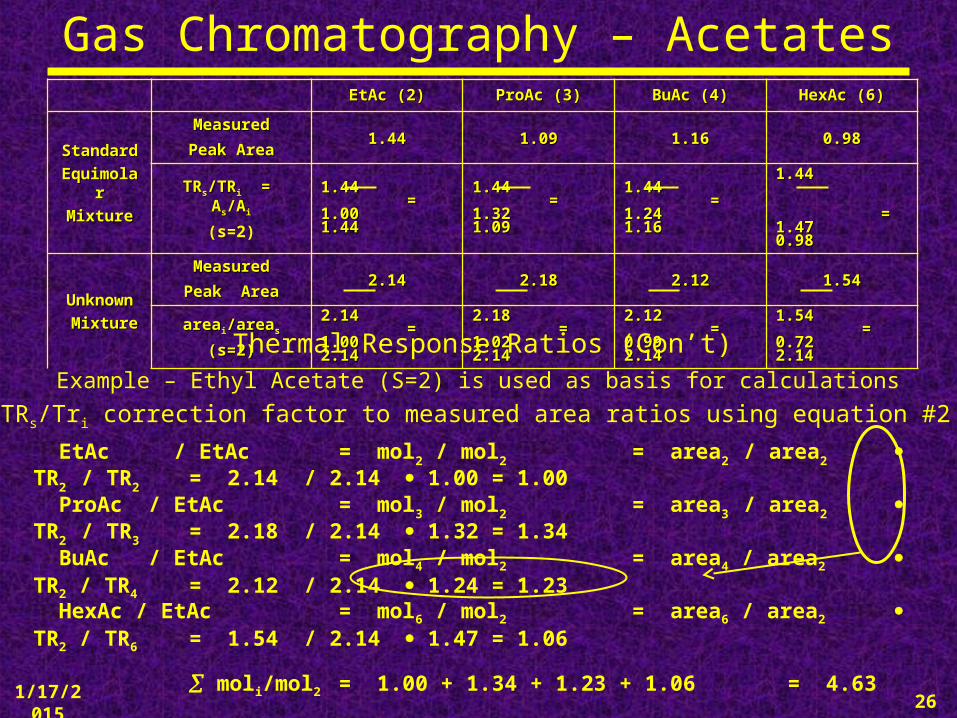
EtAc / EtAc = mol2 / mol2 = area2 / area2 TR2 / TR2 = 2.14 / 2.14 1.00 = 1.00 ProAc / EtAc = mol3 / mol2 = area3 / area2 TR2 / TR3 = 2.18 / 2.14 1.32 = 1.34 BuAc / EtAc = mol4 / mol2 = area4 / area2 TR2 / TR4 = 2.12 / 2.14 1.24 = 1.23 HexAc / EtAc = mol6 / mol2 = area6 / area2 TR2 / TR6 = 1.54 / 2.14 1.47 = 1.06
moli/mol2 = 1.00 + 1.34 + 1.23 + 1.06 = 4.63
mole % EtAc = 1.00 / 4.63 * 100 = 21.6% mole % ProAc = 1.34 / 4.63 * 100 = 28.9% mole % BuAc = 1.23 / 4.63 * 100 = 26.6% mole % HexAc = 1.06 / 4.63 * 100 = 22.9%
EtAc (2)EtAc (2) ProAc (3)ProAc (3) BuAc (4)BuAc (4) HexAc (6)HexAc (6)
StandardStandard
EquimolarEquimolar
MixtureMixture
MeasuredMeasured
Peak AreaPeak Area1.441.44 1.091.09 1.161.16 0.980.98
TRTRss/TR/TRii = A = Ass/A/Aii
(s=2)
1.441.44 = 1.00= 1.001.441.44
1.441.44 = 1.32 = 1.321.091.09
1.441.44 = 1.24= 1.241.161.16
1.44 1.44 = 1.47 = 1.470.980.98
UnknownUnknown
MixtureMixture
MeasuredMeasured
Peak AreaPeak Area2.142.14 2.182.18 2.122.12 1.541.54
areaareaii/area/areass
(s=2)(s=2)
2.142.14 = 1.00= 1.002.142.14
2.182.18 = 1.02= 1.022.142.14
2.122.12 = 0.99= 0.992.142.14
1.541.54 = 0.72= 0.722.142.14
Apply TRs/Tri correction factor to measured area ratios using equation #2
Thermal Response Ratios (Con’t)Example – Ethyl Acetate (S=2) is used as basis for calculations
1/17/2015 27
Gas Chromatography – Acetates
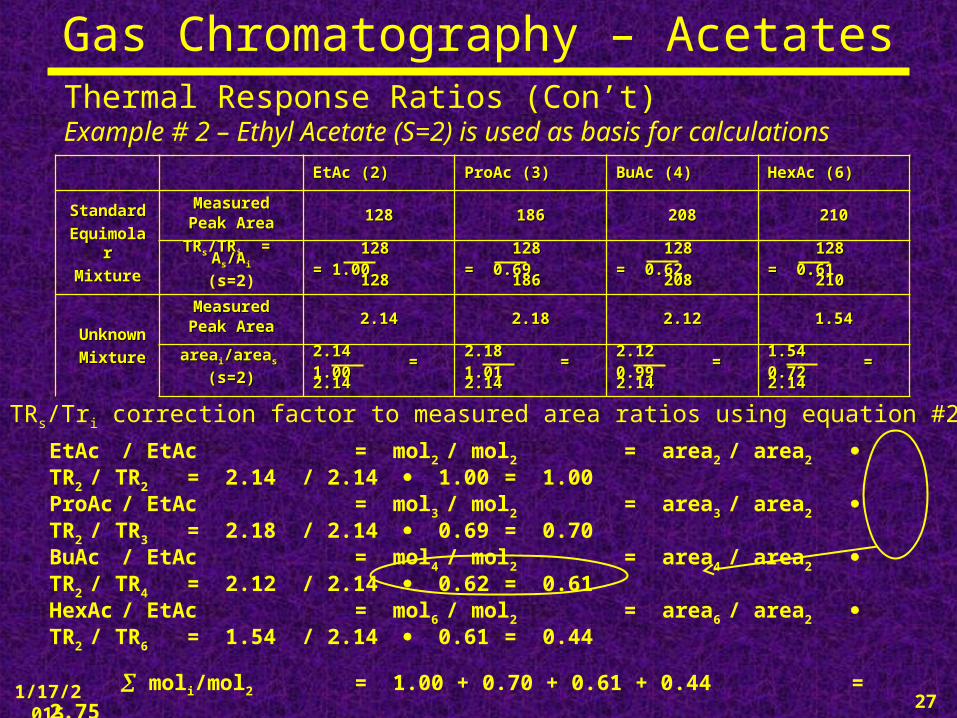
EtAc (2)EtAc (2) ProAc (3)ProAc (3) BuAc (4)BuAc (4) HexAc (6)HexAc (6)
StandardStandard
EquimolarEquimolar
MixtureMixture
MeasuredMeasuredPeak AreaPeak Area 128128 186186 208208 210210
TRTRss/TR/TRii = A = Ass/A/Aii
(s=2) 128128 = 1.00= 1.00 128128
128128 = 0.69= 0.69 186186
128128 = 0.62= 0.62 208208
128128 = 0.61= 0.61 210210
UnknownUnknown
MixtureMixture
MeasuredMeasuredPeak AreaPeak Area 2.142.14 2.182.18 2.122.12 1.541.54
areaareaii/area/areas s
(s=2)(s=2)2.142.14 = 1.00= 1.002.142.14
2.182.18 = 1.01= 1.012.142.14
2.122.12 = 0.99= 0.992.142.14
1.541.54 = 0.72= 0.722.142.14
Thermal Response Ratios (Con’t)Example # 2 – Ethyl Acetate (S=2) is used as basis for calculations
EtAc / EtAc = mol2 / mol2 = area2 / area2 TR2 / TR2 = 2.14 / 2.14 1.00 = 1.00ProAc / EtAc = mol3 / mol2 = area3 / area2 TR2 / TR3 = 2.18 / 2.14 0.69 = 0.70BuAc / EtAc = mol4 / mol2 = area4 / area2 TR2 / TR4 = 2.12 / 2.14 0.62 = 0.61HexAc / EtAc = mol6 / mol2 = area6 / area2 TR2 / TR6 = 1.54 / 2.14 0.61 = 0.44
moli/mol2 = 1.00 + 0.70 + 0.61 + 0.44 = 2.75
mole% EtAc = 1.00 / 2.75 * 100 = 36.4% mole% ProAc = 0.70 / 2.75 * 100 = 25.4% mole% BuAc = 0.61 / 2.75 * 100 = 22.2% mole% HexAc = 0.44 / 2.75 * 100 = 16.0%
Apply TRs/Tri correction factor to measured area ratios using equation #2

1/17/2015 28
Gas Chromatography – AcetatesThermal Response Ratios (Con’t)Ex. 3 - Assumes the unknown is missing Ethyl Acetate and Propyl Acetate (S=3) is used as basis for calculations
ProAc (3)ProAc (3) BuAc (4)BuAc (4) HexAc (6)HexAc (6)
Standard
Equimolar
Mixture
MeasuredMeasuredPeak AreaPeak Area
186186 208208 210210
TRTRss/TR/TRii = A = Ass/A/Aii
(s=3) 186 186 = 1.0= 1.0 186186
186186 = 0.89= 0.89 208208
186186 = 0.89= 0.89 210210
Unknown
Mixture
MeasuredMeasuredPeak AreaPeak Area
2.182.18 2.122.12 1.541.54
areaareaii/area/areass
(s=3) 2.182.18 = 1.0 = 1.0 2.182.18
2.122.12 = 0.97= 0.97 2.182.18
1.541.54 = 0.71= 0.71 2.182.18
ProAc / EtAc = mol3 / mol3 = area3 / area3 TR3 / TR3 = 2.18 / 2.18 1.00 = 1.00BuAc / EtAc = mol4 / mol3 = area4 / area3 TR3 / TR4 = 2.12 / 2.18 0.89 = 0.87HexAc / EtAc = mol6 / mol3 = area6 / area3 TR3 / TR6 = 1.54 / 2.18 0.89 = 0.63
moli/mol3 = 1.00 + 0.87 + 0.63 = 2.50
mole% ProAc = 1.00 / 2.50 * 100 = 40.0% mole% BuAc = 0.87 / 2.50 * 100 = 34.8% mole% HexAc = 0.63 / 2.50 * 100 = 25.2%
Apply TRs/Tri correction factor to measured area ratios using equation #2