1.1.3 final report
TRANSCRIPT

ESPON 1.1.3 - Final Report Part 1 I
ESPON project 1.1.3 Enlargement of the European Union and
the wider European Perspective as regards its Polycentric Spatial Structure
Part 1 Summary
Co-financed by the European Community through the Interreg III ESPON Programme

ESPON 1.1.3 - Final Report Part 1 II

ESPON 1.1.3 - Final Report Part 1 III
ESPON project 1.1.3
Enlargement of the European Union and the wider European Perspective as regards its Polycentric Spatial
Structure
Final Report
Volumes
Part 1: Summary
Part 2: Results of the Project
Part 3: Annexes A-D
December 2005
(Updated August 2006)
Contact Information:
Lisa Van Well KTH, The Royal Institute of Technology SE-100 44 Stockholm, SWEDEN Tel:+46 8 790 9430 Fax:+46 8 970 6761 E-mail: [email protected] Web: www.infra.kth.se

ESPON 1.1.3 - Final Report Part 1 IV
This report represents the final results of a research project conducted within the framework of the ESPON 2000-2006 programme, partly financed through the INTERREG programme. The partnership behind the ESPON programme consists of the EU Commission and the Member States of the EU25, plus Norway and Switzerland. Each partner is represented in the ESPON Monitoring Committee. This report does not necessarily reflect the opinion of the members of the Monitoring Committee. Information on the ESPON programme and projects can be found on www.espon.lu” The web side provides the possibility to download and examine the most recent document produced by finalised and ongoing ESPON projects. ISBN number: 2-9599669-3-7 This basic report exists only in an electronic version. Word version: © The ESPON Monitoring Committee and the partners of the projects mentioned. Printing, reproduction or quotation is authorized provided the source is acknowledged and a copy is forwarded to the ESPON Coordination Unit in Luxembourg.

ESPON 1.1.3 - Final Report Part 1 V
ESPON 1.1.3 Partners
• Lead Partner: KTH, The Royal Institute of Technology
(SWEDEN)
• Faculty of Civil and Geodetic Engineering, Chair of Spatial Planning, Ljubljana (FGG) (SLOVENIA)
• Institute of Geography and Spatial Organization (IGSO), Polish Academy of Sciences (POLAND)
• Centre for Advanced Spatial Analysis (UCL) (UNITED KINGDOM)
• National Technical Univ. of Athens (NTUA) (GREECE)
• Spiekermann & Wegener, Urban and Regional Research (S&W) (GERMANY)
• Austrian Institute for Regional Studies and Spatial Planning (ÖIR) (AUSTRIA)
• Global Urban Development (formerly the Prague Institute for Global Urban Development) (CZECH REPUBLIC)
• Centre for Urban and Regional Development Studies, Ltd. (CEDRU) (PORTUGAL)
• IRER, University of Neuchâtel (SWITZERLAND)
• Karelian Institute, University of Joensuu (FINLAND)
• TNO Inro (THE NETHERLANDS)
• Hungarian Public Nonprofit Company for Regional Development and Town Planning (VÁTI) (HUNGARY)
• Nordregio (SWEDEN)
• Swedish Institute for Growth Policy Studies (ITPS) (SWEDEN)

ESPON 1.1.3 - Final Report Part 1 VI

ESPON 1.1.3 - Final Report Part 1 VII
Foreword ESPON project 1.1.3 takes up the particular effects of enlargement of the European Union and the wider European perspective with regard to the polycentric development of the territory. As such, the focus is on the polycentric spatial tissue with special attention on the discontinuities and potentials implicit in processes of integration in the new member states (EU10) and accession countries (Bulgaria and Rumania). We also examine the polycentric spatial structure in terms of the often conflicting goals of the European Spatial Development Perspective (ESDP), particularly balanced competitiveness and economic and social (territorial) cohesion. The main question is: are the new member states and accession countries “catching up”? We provide some very different methodologies to paint a picture of the degree of territorial cohesion and competition on various levels in the ESPON space. We also suggest a spatial and temporal policy strategy that could pursue the goals of cohesion and competition in a phase model of policy combinations.
This report has been a group effort on behalf of the Transnational Project Group.
KTH, as Lead Partner, has been responsible for project management and editing of reports, under the legally responsible person, Professor Folke Snickars. Lars Olof Persson initially led the project up until his death in February 2005. Subsequently Lisa Van Well has taken over project leadership. Mats Johansson (ITPS/KTH) has represented the project as Swedish ECP and has also been an active Partner. Juan Grafeuille has been the Financial Manager of the project. KTH is indebted to the help of several persons throughout the course of the project, particularly Camila Cortés Ballerino, Firas Hammami and José Sterling for this Final Report, but also Rebhieh Suleiman and Tugkan Suer who helped with editing the Interim Reports.
We would like to take the opportunity to acknowledge the important contributions that Lars Olof Persson added to this project. Even after his death, his innovative ideas and inspiration remain a guiding force in this Final Report.

ESPON 1.1.3 - Final Report Part 1 VIII
Division of labour within the chapters of this final report is as follows:
Chapter 1:
Edited by Lisa Van Well (KTH)
Previous enlargement illustrations by Minas Angelidis (NTUA) (with the help of Gabriella Karka, Dafni Manousaridi and Costas Santimpantakis for this and other sections by Angelidis) and Jorge Gaspar (CEDRU).
Chapter 2:
Economic transition flows: Mats Johansson (ITPS/KTH)
Introduction to cohesion and Convergence and Divergence: Pieter de Bruijn and Jos Muskens (TNO Inro)
Snapshots of the European Tissue: Jörg Neubauer and Tomas Hanell (Nordregio)
Accessibility: Klaus Speikermann (S&W)
Neighbour-dependent growth: Timo Hirvonen (Joensuu)
Financial systems: José Corpataux and Olivier Crevoisier (University of Neuchâtel)
Regional specialisation: Elena Besussi (UCL)
Border region introduction: Tomas Hanell (Nordregio)
Border regions typology: Gabriela Tatzberger and Friedrich Schindegger (ÖIR) with Iván Illés (Centre for Regional Studies Hungarian Academy of Sciences, Budapest)
Border region illustrations: Erzsébet Vajdovich Visy (VÁTI) and Minas Angelidis (NTUA)
Chapter 3:
Polycentricity in context: Lisa Van Well (KTH)
Polycentricity and goal conflicts; Michael Wegener (S&W)
Rethinking Polycentricity: Minas Angelidis (NTUA) and Lisa Van Well (KTH)

ESPON 1.1.3 - Final Report Part 1 IX
Transnational Nodes: Minas Angelidis (NTUA), Lisa Van Well and Camila Cortés Ballerino (KTH)
How to measure Polycentricity: Michael Wegener (S&W)
Slovenian illustration: Alma Zavodnik Lamovšek (FGG).
Chapter 4:
Scenario Study 1: Mike Batty (UCL)
Scenario Study 2: Michael Wegener and Klaus Spiekermann (S&W)
Chapter 5
Edited by Lisa Van Well (KTH) and Michael Wegener (S&W)
Special thanks is also given on behalf of the Lead Partner to Piotr Korcelli and Tomasz Komornicki for their insightful commenting on several sections of the Final Report and the Interim Reports.
Lisa Van Well
KTH (The Royal Institute of Technology)
Stockholm
December 27, 2005
(Updated September 4, 2006)
The Content of this paper does not necessarily reflect the opinion of the ESPON Monitoring Committee

ESPON 1.1.3 - Final Report Part 1 X

ESPON 1.1.3 - Final Report Part 1 XI
Table of Contents for Part 1
1 Executive Summary 1
1.1 The 2004 enlargement and the European Territory 1
1.2 Analysing the effects of enlargement 3
1.3. Cohesion of the European territory 4
1.3.1 Cohesion and divergence at the macro-level and meso-levels 7
1.3.2 Analysing and forecasting accessibility 11
1.4 Analysing policentricity 12
1.5 A phase strategy of European spatial development 16
1.6 Policy combinations 17
1.6.1 Macro level principle-based policy combinations 18
1.6.2 Meso-level principle-based policy combinations 20
1.6.3 Meso-level capacity-based policy combinations - Creating the strategy 22
1.6.4 Micro-level capacity-based policy combinations: Capacity for implementation 23
2. Scientific summary 25
2.1 Methodologies and concepts for analysing cohesion 25
2.2 Methods and concepts for analysing polycentricity 30
2.3 Scenario study methodology 32
2.4 Building typologies for border regions 35
3. Networking with other ESPON projects and internal evaluation 37
3.1 Networking of ESPON 1.1.3 37
3.2 Internal evaluation 37
3.3 Further research issues and data gaps to overcome 38

ESPON 1.1.3 - Final Report Part 1 XII
Table of Contents for Part 2 Chapter 1 1 Enlargement: Territorial Cohesion, Balanced
Competitiveness and Polycentric Development 1
1.1 Background to the 2004 Enlargement 1
1.2 Framework for analysis 3
1.3 Concepts: Operationalising the “norms” of spatial development policies 6
1.3.1 Enlargement and Polycentric Development 12
1.4 The linking function of polycentricity: Efficiency and Equity 14
1.4.1 Cohesion and Competition: Looking forward 15
1.5 Looking backward: Excursions into previous enlargements 16
1.5.1 European Integration effects on the regional development and the polycentric structure: some teachings from the Greek accession experience 16
1.5.1.1 Convergence to the EU economic and social structures 16
1.5.1.2 Per region disparities 17
1.5.1.3 Territorial disparities 19
1.5.1.4 Conclusions / lessons from the Greek accession experience 23
1.5.2 Portugal European Integration: What can New Member States and Accession Countries expect? 24
1.5.2.1 Convergence/Divergence Trends 24
1.5.2.2 The Impact of CSF II and III in Portugal (1994-99 and 2000-2006) 27
1.5.2.3 Regional Disparities in Portugal 28
1.5.2.4 Conclusions 31

ESPON 1.1.3 - Final Report Part 1 XIII
Table of Contents for Part 2 Chapter 2 2 Cohesion and Convergence in the Enlarged EU 33
2.1 Measuring “cohesion” through GDP as a variable 34
2.1.1 Snapshots of the European tissue - Visualizing economic and demographic distribution on the eve of accession 36
2.1.1.1 Changing Contributions to total population 37
2.1.1.2 Changing contributions to total GDP in ESPON space 38
2.2 Convergence and divergence in Europe’s regional
social-economic fabric 42
2.2.1 Introduction 42
2.2.2 Indicators of economic convergence 42
2.2.3 GDP per capita - regional level and growth 45
2.2.4 Convergence and divergence in GDP per capita 46
2.2.5 Conclusions and policy implications 47
2.3 Spatial cooperation and integration: Both convergence and divergence 51
2.3.1 Flows and transition processes 51
2.3.2 Factor Endowments and Factor Mobility 52
2.4 Accessibility 59
2.5 Neighbour-dependent growth: empirical evidence from enlargement countries in ESPON space 66
2.5.1 Neighbour-dependent growth in EU10, EU15 and EU27+2 67
2.5.2 Clusters of regions and spatial outliers 71
2.5.3 Key findings and implications of neighbour-dependent growth 77
2.6 Regional specialisation 79
2.6.1 Taking up from the Third Interim Report 79
2.6.2 Methodology: The ‘P’, ‘S’, ‘C’ and ‘D’ regions 79
2.6.3 Results 82
2.6.4 Policy implications of regional specialisation 90
2.7 Financial system, exchange rate and polycentricity in the context of European enlargement 91
ESPON 1.1.3 - Final Report Part 1 XIV
2.7.1 What are the spatial connections and barriers due to financial and monetary integration? 92
2.7.2 Highlighting the evolution of some financial and monetary variables 95
2.7.2.1 Financial system development 95
2.7.2.2 Level of inward foreign direct investments 96
2.7.2.3 Regional impact of exchange rate variations 98
2.7.3 What territorial challenges for the new member states? 99
2.8 Some characteristics of ESPON space macro border areas 101
2.9 The potential of border regions 106
2.9.1 Coming to a border typology for the enlargement area 107
2.9.2 Comments to geographical-physical and socio-economic border region typologies 117
2.9.3 Future research questions 118
2.9.4 Conclusions regarding border regions 119
2.10 Border Region illustrations from the “ground” 121
2.10.1 Hungarian – Slovakian border region 121
2.10.2 Greek-Bulgaria border regions 125
2.10.2.1 Degree of economic disparities – economic interactions during the accession process 127
2.10.2.2 Conclusions/ Some recommendations for the improvement of the border regions typology 136

ESPON 1.1.3 - Final Report Part 1 XV
Table of Contents for Part 2 Chapter 3
3 Polycentricity and Enlargement 138
3.1 The New Peripheries of Europe 139
3.2 Polycentricity and Goal Conflicts 140
3.3 Rethinking some aspects of Polycentricity 142
3.3.1 A Polycentric picture of the New Member States 147
3.3.1.1 Polycentricity in transnational regions: New possibilities with enlargement 150
3.3.1.2 A Potential Baltic Sea Integration Zone? 151
3.3.1.3 A Potential SE Europe / Balkans Integration Zone 154
3.4 How to measure polycentricity in the enlarged Europe 157
3.4.1 National polycentricity 158
3.4.2 European polycentricity 169
3.4.3 Conclusions 172
3.5 Illustration: Polycentricity in Slovenia 173
3.5.1 Polycentric development of Slovenian urban system 174
3.5.2 Interpreting National Polycentricity from the “Ground” 179
Table of Contents for Part 2 Chapter 4
4 Scenario Studies 182
4.1 Introduction to the Models 182
4.2 Scenario Study I (RESSET) 183
4.2.1 The RESSET Approach 183
4.2.2 The Calibration Summarized 185
4.2.3 Aggregate Model Scenario Results 187
4.2.3.1 Trend Scenarios 188
4.2.3.2 Examples of ‘What If’ Scenarios: Sampling the Scenario: Sampling the Scenario Space 193
4.2.4 Limitations of the Model Scenario Results 196
4.3 Scenario Study II: Transport (SASI) 197
ESPON 1.1.3 - Final Report Part 1 XVI
4.3.1 The SASI model 198
4.3.2 Transport scenarios 200
4.3.3 Scenario results 201
4.3.4 Conclusions 217
Table of Contents for Part 2 Chapter 5 5 Policy Conclusions 219
5.1 Spatial consequences of the EU enlargement 219
5.2 A phase strategy of European spatial development 222
5.3 Policy combinations 224
5.4 Principle-based policy combinations 225
5.4.1 Macro level policy combinations 225
5.4.2 Meso level policy combinations 228
5.5. Capacity-based policy combinations 229
5.5.1 Macro-level capacity-based policy combinations 229
5.5.2 Meso-level capacity-based policy combinations – Creating the strategy 230
5.5.3. Micro-level capacity-based policy combinations: Capacity for implementation 232

ESPON 1.1.3 - Final Report Part 1 XVII
PART 1 Summary

ESPON 1.1.3 - Final Report Part 1 XVIII
ESPON 1.1.3 - Final Report Part 1 XIX
Table of Contents for Part 1
1. Executive Summary 1
1.1 The 2004 Enlargement and the European territory 1
1.2 Analysing the effects of Enlargement 3
1.3 Cohesion of the European territory 4
1.3.1 Convergence and divergence at the macro-level and meso levels 7
1.3.2 Analysing and forecasting accessibility 11
1.4 Analysing polycentricity 12
1.5 A phase strategy of European spatial development 16
1.6 Policy combinations 17
1.6.1 Macro level principle-based policy combinations 18
1.6.2 Meso level principle-based policy combinations 20
1.6.3 Meso-level capacity-based policy combinations- Creating the strategy 22
1.6.4 Micro-level capacity-based policy combinations: Capacity for implementation 23
2 Scientific Summary 25
2.1 Methodologies and concepts for analysing cohesion 25
2.2 Methods and concepts for analysing polycentricity 30
2.3 Scenario study methodology 32
2.4 Building typologies for border regions 355
3 Networking with other ESPON projects and internal evaulation 37
3.1 Networking of ESPON 1.1.3 37
3.2 Internal evaluation 37
3.3 Further research issues and data gaps to overcome 38

ESPON 1.1.3 - Final Report Part 1 XX
Maps Map 1.1: Redistribution of GDP 1995-2000, NUTS3 6
Map 1.2: Population change 1995-2000, ESPON space land border regions, NUTS3 9
Figures
Figure 2.1 The SASI model 34
Tables
Table 1.1 Goal conflicts of polycentricity policies 16
Table 2.1 Dimensions and criteria for border region typologies 36

ESPON 1.1.3 - Final Report Part 1 1
1 Executive Summary
1.1 The 2004 enlargement and the European territory
The objective of the ESPON 1.1.3 project has been to analyse the enlargement of the EU and the wider European perspective as regards its polycentric spatial structure.
The territorially enlarged European Union and extended internal market became de facto with the accession of Estonia, Latvia, Lithuania, Poland, Hungary, The Czech Republic, Slovakia, Slovenia, Cyprus and Malta to the EU on May 1, 2004. This fifth wave of enlargement as an on-going process of integration of ten new member states into the EU, represents one of the most important opportunities and challenges for the EU to increase international competitiveness and become the most competitive and dynamic knowledge-based society in the world. The challenges and possibilities will increase even more with the accession of Bulgaria and Romania in 2007.
At the same time, the special geographic, historical, economic and political position of most of the new member States (EU10) and the two most imminent accession countries (Bulgaria and Romania) gives a whole new meaning to considerations of polycentric spatial development in Europe. For centuries many of these countries have been part of a buffer-zone between East and West, although today their economic linkages are almost totally reoriented towards the west. Many of these states are fairly new players in the market economy and are relatively new at building up decentralised systems of governance. The relative geographical and functional peripheral situation of most of the new member states (in relation to the EU15) can be seen as a disadvantage, but also as an advantage, as we are experiencing a Europe for which the sphere of influence has been drastically augmented. St. Petersburg, Moscow, Kiev and Istanbul now constitute centers of economic power at the frontiers of the European territory and are important nodes in the polycentric development of a much wider Europe.
Effects of EU enlargement and European integration can already be discerned, and these present, not surprisingly, a mixed bag of results: Growth rates in the enlargement area are above the EU15 average, but spatial polarisation at the national level appears to be a corresponding phenomenon. Economic restructuring is occurring in the enlargement area from primary sectors to the service sectors, but at the same time employment levels have fallen.

ESPON 1.1.3 - Final Report Part 1 2
Text Box 1 .1. The accession of Greece and Portugal
The integration into the European Union of Greece (1981) and Portugal (1986) increased the territorial cohesion of Europe as a whole. But the economic disparities between the central and peripheral regions within these countries was not markedly reduced.
In Greece the convergence of the country to the EU average advanced less then than was anticipated. Regional disparities are still persistent with a great disparity between Athens and the other parts of the country. Although a large part of the Structural Funds, including the Cohesion Funds, were allocated to improve the Greek infrastructure, the restructuring of the urban system remained insufficient and progress towards a more polycentric territorial system has been limited. Peripheral centres did profit by some limited decentralisation of activities by the national government, primarily by changes in territorial governance and reinforcement of the institutional capacity of regions to implement EU aid programmes.
In Portugal European integration stimulated economic growth and social well-being of the whole country. However regional imbalances did not change considerably. Despite the importance of the Structural Funds for infrastructure modernisation, economic cycles in the European economy have been more influential for the convergence process within Portugal than EU funding. The recent EU enlargement in 2004 has rendered the catching-up process in Portugal more difficult as the specialisation of the Portuguese economy based on intensive labour and low wages is no longer viable in a common market with countries with even lower wages.
The new member states of the EU enlargement of 2004 and future and accession countries should therefore not expect that territorial cohesion at the national level will be increased simply as a result of short- and medium-term European interventions such as the Structural Funds. While the competitiveness of their countries as a whole can be expected to increase, a reduction of disparities within their territory will require more focused national actions to stimulate spill-over of growth and efficiency from the capital cities and large agglomerations to regions in the periphery. These measures should include bottom-up capacity-building processes to increase the competitiveness of second-order cities and rural areas as well as within-country and trans-national co-operation.

ESPON 1.1.3 - Final Report Part 1 3
Geographically, the enlargement of 2004 increased the population of the European Union by 28 percent and expanded its territory by 34 percent. Four waves of enlargement have preceded the enlargement of 2004, but the 2004 new member states differed more drastically from the old member states than Greece (1981), Portugal and Spain (1986) or Austria, Finland and Sweden (1995). Nevertheless, some general insights from previous enlargements can be discerned (see Text box 1.1). With the exception of the two island states, Cyprus and Malta, the new member states of 2004 have a common history of half a century of constrained growth in planned economies and limited opportunities for international cultural exchange, trade and travel.
This common heritage is one of the reasons for the large gap in economic development between the old and new member states. The ten new member states taken together have a GDP per capita of less than one fifth of the average of the fifteen old member states, and through enlargement the ratio between the per-capita income of the poorest and the richest regions in the European Union has widened from 1:10 to 1:30. However, even between the new member states there are large economic disparities between the most economically successful countries Cyprus, Malta and Slovenia and the remaining countries, and within the new member states between the capital cities and other large agglomerations and the peripheral rural regions. In particular Budapest, Prague and Warsaw are quickly catching up with cities in western Europe at the price of widening economic gaps within their own countries.
This Final Report of the ESPON 1.1.3 Transnational Project Group (TPG) thus takes a deeper look at the process of enlargement and its effects on polycentric development, balanced competitiveness and territorial cohesion within the European territory.
1.2 Analysing the effects of Enlargement
In examining the effects of enlargement of the European spatial tissue we implicitly and explicitly make several assumptions throughout this report. The first is that the processes of enlargement have been long-term projects. While the emphasis of this report is on the latest enlargement in 2004 and the next slated enlargement of 2007, we recognise that the four previous enlargements have undoubtedly had a great impact on the territorial integrity of the European space, the effects of which are still being seen. The latest enlargement process began already over a decade ago when many of

ESPON 1.1.3 - Final Report Part 1 4
the new member states and accession countries regained independence after a period of Soviet influence and planned economy. Thus the period of analysis in our report largely begins from the year 1995 and runs in most cases to 2000 or 2001. We assume that, for the new member states, this period of time represents an “EU accession trial stage” where economic changes due to post-communist regimes and the release of Commission’s Cohesion and Pre-accession Funds, already show impact on the economic performance and specialisation of the individual regions.
While enlargement in and of itself has obvious ramifications on the territorial morphology of Europe and its polycentric development, an important intervening variable which effects the functionality of territory is the process of European integration. Processes of integration effect both the polycentric development of the ESPON space as well as the normative goals of European Spatial Development Perspective (ESDP): competition, cohesion and sustainable development. Polycentric development as a policy strategy attempts to link up the goals of cohesion and competition, but is also constituted by these two factors. In this sense polycentric development could also be seen as both an intervening variable (policy strategy) and as a dependent variable (functional state of affairs).
1.3 Cohesion of the European territory
Just how territorially cohesive is the European territory? In light of this question we look deeper into the processes of territorial cohesion and convergence in the European territory that are induced by the widening and deepening processes of political, economic and social integration in Europe. As its main objective, territorial cohesion attempts to achieve a more balanced development by reducing existing disparities (for instance between urban networks), preventing territorial imbalances (for instance geographical imbalances between regions), and by making both sectoral policies, which have a spatial impact, and regional policies more coherent.
Convergence is as depicted the active process of becoming cohesive. In making our “diagnosis” of the territorial cohesion of the new member states and accession countries we employ various methods, which paint a range of different pictures of the spatial tissue of Europe. These different pictures, of course have to do with the types of questions being asked as well as the territorial level being examined (most of our analysis are performed on NUTS3 level).

ESPON 1.1.3 - Final Report Part 1 5
When cohesion was measured in terms of annual growth rate of NUTS3 regions between 1995 and 2000 (in GDP per capita in PPS) the new member states appear to be “catching up” on the European level. However when measured by both ß-convergence and σ-convergence, most of the countries in Europe, including the new member states and accession countries are still experiencing regional divergence as the dominating trend. Only Greece and Italy show some patterns of converging levels of wealth across the regions by these convergence techniques.
We also discuss the spatial distribution of the ESPON space from its function as a total entity in comparison to other markets. This approach focuses on the role of single regions within the total ESPON space and hence generates statements on change in regions’ position (both GDP per capita and population) relative to the total space. In terms of population, most capital regions display an increasing proportion of the total ESPON space. In terms of redistribution of GDP, many new member states, such as the Baltic States, enjoyed strong relative economic growth during the period, greatly based on the growth of capital regions at the expense of other parts of the countries. This redistribution of GDP is show below in map 1.1.

ESPON 1.1.3 - Final Report Part 1 6
Map 1.1: Redistribution of GDP 1995-2000, NUTS3

ESPON 1.1.3 - Final Report Part 1 7
1.3.1 Convergence and divergence at the macro-level and meso levels
ESPON 1.1.3 has collected first evidence of the concurrent process of convergence (at the European level) and divergence (at the national and regional level) and has explored in its analyses and model forecasts these processes and their consequences for territorial cohesion and polycentricity.
Patterns of regional growth
In measuring neighbour-dependent growth we find clear disparities as well as interesting spatial patterns across European space. Neighbour-dependent growth in this report is a concept that determines how geographic location affects patterns of economical growth, based on the Moran I spatial autocorrelation statistic. This exercise has underlined the importance of spatial proximity, especially in the new member states: The more a region is surrounded by regions with positive economic or population development, the higher are its own growth rates for each of these aspects.
In terms of neighbour-dependent growth, most countries and parts of Europe seem to form clear macro clusters of economic performance. The results also indicate some evidence for cohesion at the macro level. The regions surrounded by regions with a low GDP per capita seem to grow faster than regions with more prosperous neighbours. This holds true also for the enlargement area, although the effect is found to be slightly weaker than in EU15 area. In some cases the results could be favorable in the way that similar countries or regions can form clusters of development by growing together; but at the same time it could also strengthen disparities between regions in favour of the best performing ones.
In a macro-economic perspective, trade between the Western and Eastern parts of Europe is expected to increasingly show patterns of the theory of comparative advantages. Free trade results in an adjustment process among the labour-intensive sectors and also in the regions where these sectors are over-represented, possibly making them more vulnerable. There are, however, still sectors and regions where an increased trade within an enlarged EU will have negative effects. Some products and branches that are labour-intensive but not entirely dependent on low wages will probably be affected by increased imports. This will also have regional implications in the old member states, especially for regions that will experience a more intensive competition from the new member states, as the accession of Portugal (see Text Box 1.1) demonstrated.

ESPON 1.1.3 - Final Report Part 1 8
The disturbing prospect is that, if only market forces are at work, the EU enlargement will, as it is hoped for, reduce the economic disparities between the old and new member states but at the same time it is likely to increase the disparities between and within the new member states.
Border regions
The dominant role and increasing importance of borders and border regions is one of the most distinguishing features of the enlargement area. Today, the permeability of these borders is fairly high; although in some places natural barriers (mountain ranges; rivers lacking bridges) and administrative shortcomings still inhibit cross-border interaction. Border regions tend to bear the brunt of the tension created by the wide disparities in income levels but can benefit from the additional opportunities of efficient factor allocation, which helps them to achieve above-average positions within their countries in most cases, while at the same time experiencing below-average levels of security and frequently even creating additional ecological strains.
However on the whole, border regions tend to be economically disadvantaged compared to non-border regions. Regions at borders between the old and new member states and in particular between the new member states have experienced less economic and population growth. In terms of population most capital regions display an increasing proportion of the total ESPON space, at the expense of other regions. This is especially true of the Baltic States as well as Romania and Bulgaria (see map 1.2). In addition, border regions tend to be more neighbour-dependent than non-border regions, a finding which is not in line with the hypothesis that national borders are important for determining the discontinuities in regional development and population dynamics.
We make the assumption that high levels of economic disparities in cross-border regions is not necessarily a handicap for integration, but rather gives greater potential for change. The geographical type of border, the density of border crossings and intensity of transnational activities are also important factors in examining the possibilities for potential flow integration of these areas. We develop two different typologies examining the potential for change in border regions. As a result of these two typologies we see four types of border regions based on their integration potential: Forerunners of integration, hardworkers of integration, candidates of integration and handicapped for integration.

ESPON 1.1.3 - Final Report Part 1 9
Map 1.2: Population change 1995-2000, ESPON space land border regions, NUTS3

ESPON 1.1.3 - Final Report Part 1 10
Border regions in the enlargement area enjoy varying degrees of potential for integration and cross-border flows, as seen in the typologies for
Text Box 1.2. Border region Illustrations
The integration potential in the Hungarian-Slovakian border regions is strengthened by several factors, primarily a common language and culture and similar recent history. The economic disparities between cross-border region are not great, but this similarity of economic structures does not involve barriers of integration, especially on the western side of the border. Because of relatively higher unemployment and lower wages in Slovakia, there is a substantial, organized commuting from many neighbouring Slovakian NUTS3 regions to Hungarian regions.
The Hungarian-Slovakian border region can be regarded as a “hardworker of integration” in view of the great efforts on both sides of the border, to strengthen links and cooperation. Further strengthening is still needed in joint studies of development perspective of cities and rural areas, elaboration of a joint scheme of settlement development with special regard to the coordinated development of local centres and enhanced cooperation between small (micro) regions.
In contrast, the Greek-Bulgarian border regions are characterised by high disparities 0f GDP per capita. In 2001 the GDP per capita of the Greek border regions were more than twice that of the regions on the Bulgarian side. This has provoked a shift of industries from the Greek side to the Bulgarian side, and the immigration of Bulgarian workers to Greece. Also, the border between Greece and Bulgaria simultaneously constitutes a national barrier and a historical and language barrier.
Because the interactions in the Greek-Bulgarian border regions are growing very fast the characterization “forerunners of integration” could be more appropriate for the entire Greek-Bulgarian border region. The numbers of bilateral collaborations and of participations of both sides in transnational activities are high. Although projects have promoted transnational governance and specifically focus on spatial planning, cooperation of the two border regions in spatial planning activities remains extremely weak compared to the needs created by the rapid changes in spatial interactions between the two border regions.
ESPON 1.1.3 - Final Report Part 1 11
integration. But the diversity of these regions calls for more in-depth examination of the specific situations “on the ground” in order for any typology to be useful. (see text box 1.2 for the illustrations of the Hungarian-Slovakian and Greek-Bulgarian border regions).
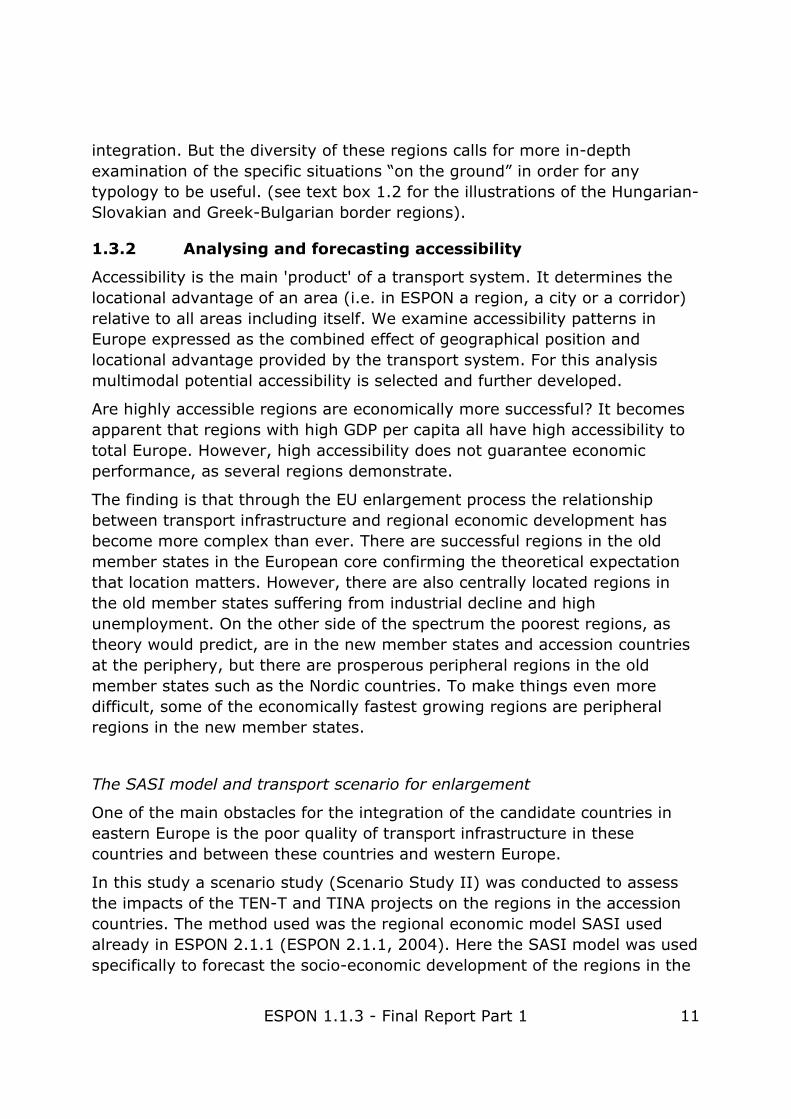
1.3.2 Analysing and forecasting accessibility
Accessibility is the main 'product' of a transport system. It determines the locational advantage of an area (i.e. in ESPON a region, a city or a corridor) relative to all areas including itself. We examine accessibility patterns in Europe expressed as the combined effect of geographical position and locational advantage provided by the transport system. For this analysis multimodal potential accessibility is selected and further developed.
Are highly accessible regions are economically more successful? It becomes apparent that regions with high GDP per capita all have high accessibility to total Europe. However, high accessibility does not guarantee economic performance, as several regions demonstrate.
The finding is that through the EU enlargement process the relationship between transport infrastructure and regional economic development has become more complex than ever. There are successful regions in the old member states in the European core confirming the theoretical expectation that location matters. However, there are also centrally located regions in the old member states suffering from industrial decline and high unemployment. On the other side of the spectrum the poorest regions, as theory would predict, are in the new member states and accession countries at the periphery, but there are prosperous peripheral regions in the old member states such as the Nordic countries. To make things even more difficult, some of the economically fastest growing regions are peripheral regions in the new member states.
The SASI model and transport scenario for enlargement
One of the main obstacles for the integration of the candidate countries in eastern Europe is the poor quality of transport infrastructure in these countries and between these countries and western Europe.
In this study a scenario study (Scenario Study II) was conducted to assess the impacts of the TEN-T and TINA projects on the regions in the accession countries. The method used was the regional economic model SASI used already in ESPON 2.1.1 (ESPON 2.1.1, 2004). Here the SASI model was used specifically to forecast the socio-economic development of the regions in the

ESPON 1.1.3 - Final Report Part 1 12
new member states after their entry into the European Union taking account of the expected reduction of border barriers, such as waiting times and customs procedures as well as different scenarios of implementation of the TEN-T and TINA projects.
The model simulations of Scenario Study II show that the large gaps in accessibility and economic development between the old and new member states existing before the EU enlargement in 2004 cannot be totally overcome but can be significantly reduced by a strategy of transport infrastructure development in coordination with other EU policies. The largest gains in accessibility of the new member states are due to the enlargement process itself because it has reduced barriers for travel and goods transport between the old and the new member states and between the new member states themselves. The infrastructure projects examined contribute to this effect and, not surprisingly, the more infrastructure projects are implemented in the new member states, the better for them.
The forecasts of the effects on cohesion, however, show that the goal conflict between competitiveness and territorial cohesion are relevant. All policy scenarios examined, including the enlargement scenario, reduce disparities in accessibility and GDP per capita between the old and new member states in relative terms. However, in absolute terms, they widen the gap in accessibility and GDP per capita between the old and new member states.
Similarly, all policy scenarios examined contribute to increasing polycentricity at the European level by fostering the economic development of the capital cities and other large cities in the new member states. However, the price to be paid for this is that the national urban systems of the new member states become more polarised.
1.4 Analysing polycentricity
“Polycentricity is not a goal in itself but one of the means to achieve policy objectives such as economic competitiveness, social equity and sustainable development” (ESPON 1.1.1 Final Report p. 7-8).
As such polycentricity can be conceptualised as both an ongoing process and as a normative goal to be achieved and is alleged to help in reducing regional disparities and in increasing competitiveness for integration. Yet it is important to bear in mind that polycentricity at heart is a political concept.

ESPON 1.1.3 - Final Report Part 1 13
While polycentricity is a main research object of ESPON, the verdict is still out if it can reduce economic and social disparities and lead to balanced competitiveness and sustainable development in each and every region in the European territory.
National (meso-level) polycentricity
In ESPON 1.1.3 a comprehensive indicator of polycentricity developed in ESPON 1.1.1 was used to measure the degree of polycentricity of the current urban systems of the new member states and accession countries individually and taken together. The developed approach measures polycentricity by identifying three dimensions of polycentricity: the size or importance of cities (population, economic activity), their distribution in space or location and the spatial interactions or connections between them.
The new member states and accession countries on average have urban systems that are more polycentric than those of the old member states because their cities are more evenly distributed over space. Yet they are on average more polarised with respect to connectivity. Except for the special case of Cyprus, the most polycentric countries in the new member states and accession countries are Poland and Slovenia. The Baltic States and Hungary are the least polycentric of the new member states and accession countries. Estonia and Lithuania suffer from the poor accessibility of their peripheral areas, Latvia from the dominance of Riga, and Hungary is weak in all three dimensions.
Our illustration of national polycentricity in Slovenia shows that the view from the “ground” is a bit more complex. There is still a lack of medium-sized towns which would enhance a more balanced regional development. As well the illustration illuminates a discrepancy which should be given some attention, i.e,. understanding of polycentric development in areas of different sizes. Another, even larger conflict is in the comparison of the European urban network and urban networks at the level of single countries. Smaller countries and countries outside of “Pentagon”, including Slovenia, have had large problems in trying to meet the strategic goals ('Lisbon') on the one hand, and, on the other hand, meeting their own guidelines for achieving polycentric development.

ESPON 1.1.3 - Final Report Part 1 14
European (macro-level) polycentricity
The European system of MEGAs (Metropolitan European Growth Areas) is rather balanced, and the largest cities within the European territory are in no way too large or economically dominant for the remaining cities. Both with respect to population and economic performance the MEGAs in the new member states are in the lower ranks of the urban hierarchy in Europe. However, the European urban system is highly clustered in north-western Europe, whereas there are large areas served only by one MEGA at the periphery. Accessibility is relatively equally spread over large and small cities, but the MEGAs in the new member states and accession countries are poorly connected.
Polycentric observations from “diagnosis” of the Euopean spatial tissue
In terms of diagnosis of the European spatial tissue, on both the macro and meso levels, ESPON project 1.1.3 has come to the several findings related to polycentric development:
- At the meso level, although the new member states still have more polycentric urban systems than the old member states, their urban systems have become more polarised since the opening of the Iron Curtain and are likely to continue to do so due to rapid economic growth of the capital cities and rural-to-urban migration. The modernisation of their transport infrastructure largely oriented towards the capital cities contributes to this development.
- The move to from centralised, bank-based financial systems to liberal finance-based systems in the new member states will encourage further monocentric development. FDI tends to cluster in main metropolitan areas, also aggrevating monocentric trends.
- Regions in the new member states that are converging in terms of GDP per capita 1995 and GDP growth from 1995 to 2001, show no signs of growing regional specialisation (except Budapest in service sectors). In new member states presence of MEGAS has little effect on growing specialisation, the opposite of the effect on the EU15 regions.
- Regional specialisation and greater sector concentration, especially in the presence of MEGAs can lead to increased productivity. But the risk is that industry-specific shocks may make highly specialised regions more vulnerable.

ESPON 1.1.3 - Final Report Part 1 15
- At the macro European level there are several potential transnational integration zones, based on the existance of MEGAS and their fucntional relations. Two of these potential transnational zones could be in the Baltic Sea Region and the Balkans Region, although they in no way could compete on the level of the ”Pentagon”. A greater focus on the MEGAs in these zones could also decrease polycentric development and increase rgional disparities within the respective countries.
- There are inherent goal conflicts in pursuing polycentric development policies at the global scale, the European scale and the national and regional scales.
Polycentricity, levels and goal conflicts
Polycentricity is associated with major policy objectives of the European Union: Countries with a polycentric urban system are in general economically more successful and environmentally more sustainable than countries with a dominant capital city, but not necessarily spatially more equitable if also rural regions are included (see ESPON 1.1.1, 2004).
The polarisation of the urban systems in the new member states and accession countries has increased since their transition from planned to market economies in the 1990s and is likely to further increase in the future.
This creates serious goal conflicts for future EU spatial policy oriented at a balanced polycentric territorial structure of Europe (see Table 1).
It is the responsibility of the future spatial policy of the European Union to find a rational solution to this goal conflict. This solution cannot be the one-sided pursuit of one of the two conflicting goals at the expense of the other. Rather, the task is to develop a balanced strategy which is differentiated in both space and time and takes account of the specific needs of different types of regions.

ESPON 1.1.3 - Final Report Part 1 16
Table 1.1 Goal conflicts of polycentricity policies
Goal Policy Goal conflict
Competitiveness at global scale ('Lisbon')
Strengthen highest-level global cities in the 'Pentagon'
Polarisation between the global cities in the 'Pentagon' and the cities in the rest of Europe will increase. The European urban system will be less balanced and polycentric.
Territorial cohesion at European scale
Strengthen major cities outside of the 'Pentagon'
The competitiveness of the global cities in Europe may decrease. The urban systems of individual countries will be less balanced and polycentric.
Territorial cohesion at national scale
Strengthen medium-level cities in the new member states and accession countries
Competitiveness of major cities in the new member states and accession countries may decrease.
Sustainability ('Gothenburg')
Strengthen lower-level cities in the new member states and accession countries
Competitiveness of major cities in the new member states and accession countries may decrease.
1.5 A phase strategy of European spatial development
It is a recurrent theme of many ESPON projects (e.g. ESPON 1.1.1 and ESPON 2.1.1) that the stated EU goals of competitiveness and territorial cohesion/polycentricity are in conflict. This conflict is nowhere so explicit as in the case of the EU enlargement. If, for instance, the goal is to strengthen major urban centres outside the “Pentagon”, this will increase spatial disparities between the already too dominant capital cities and other large cities in countries such as the Baltic states, Hungary or the Czech Republic. However, if the promotion of balanced urban systems in these countries is a common goal, more Structural Funds and transport infrastructure have to go to medium-size cities of the new member states, and this will go at the expense of their capitals.
This confirms the need for a spatially differentiated and temporal spatial policy. We thus propose the idea of a phase strategy to meet these needs.

ESPON 1.1.3 - Final Report Part 1 17
Such a strategy implies that in the already highly developed and urbanised old member states, existing or emerging polycentric structures are strengthened by predominantly improving the accessibility of medium-level central places and compensating the accessibility deficits of rural and peripheral regions. In the still urbanising new member states, however, for a transition period of ten to fifteen years it is justified to enhance the growth dynamics of these countries by fast and efficient transport connections between the capital cities and major agglomerations in the new member states and the economic centres in Western Europe. After that period, however, the risk of over-dominance of these cities will have to be reduced by shifting the focus of investments first to medium-size cities and later, as in the old member states, to rural and peripheral regions. The rationale behind this is that scientific and technical innovations are not restricted to large agglomerations but can also, or even better, be achieved in well connected cities of medium size, which is demonstrated by the fact that the economically most successful countries in Europe are those with the most polycentric urban systems (see ESPON 1.1.1, 2004). Such a strategy is not in conflict with the competitiveness goal of the European Union but achieves it in a more sophisticated way than by the one-sided promotion of the largest agglomerations. From such a spatial strategy differentiated in space and time new challenges for European spatial policy arise.
We thus present the idea of such a phase model as a “meta” policy recommendation as it is one way of dealing with the goal conflicts between competitiveness, cohesion and sustainability that are deep-rooted in pursuing polycentric development across the board in Europe. However an important caveat must be made: We are in no way advocating the phase model for all countries or regions in Europe, simply presenting an alternative that might profitably be used with caution to deal with spatial planning goal conflicts.
1.6 Policy combinations
To respond to the challenges of providing non-conflicting policy recommendations ESPON 1.1.3 proposes a coherent policy framework based on policy combinations. The term policy combinations was chosen as it best describes the process of co-ordinating coherent combinations of policies that are both multi-level, spanning the vertical levels of government and administration, and inter-sectoral, with the integration of traditional policy areas, as well as integrating a temporal framework. In normative terms,

ESPON 1.1.3 - Final Report Part 1 18
policy combinations also implicitly reflect ways to bridge the gap between policies primarily oriented to competition within the European territory and cohesion of the territory on all levels, including the temporal dimension of the phase model.
We thus suggest two kinds of policy combinations:
- Principle-based policy combinations are built on top-down governance processes by EU and national institutions or implemented via EU programmes such as the Structural Funds. Principle-based combinations work to achieve a concrete goal-oriented measure with a greater focus on what is to be achieved, compared to providing the tools of how the measure is to be achieved.
- Capacity-based policy combinations are implemented by national, regional or local governments, private businesses and civil society organisations and focus on the capacity to implement EU funding opportunities. Thus capacity-based combinations, while also obviously-goal oriented, have a specific orientation on providing the necessary capacity, be it organisational or governance aspects, to show how the goals could be met.
1.6.1 Macro level principle-based policy combinations
Structural policy
European structural policy is particularly affected by the goal conflict between competitiveness and territorial cohesion. If the goal of global competitiveness is the only guiding principle, predominantly the major agglomerations within the “Pentagon” attract the largest part of the Structural Funds, and this will further widen the existing gap between economic performance between the old and new member states. If, however, the cohesion goal receives highest priority, most Structural Funds go into the poorest regions in the new member states and this may reduce the global competitiveness of the European Union as a whole.
Following the phase model, Structural Funds will in the near future have to be concentrated on the capital cities and other major agglomerations in the new member states; this will facilitate convergence at the European level but is likely to increase economic disparities within these countries and can therefore be justified only for a limited transition period. In the old member states, structural policies will not further strengthen the already highly

ESPON 1.1.3 - Final Report Part 1 19
developed cities in the “Pentagon”, which have hardly deficits in economic development potential, but be targeted at cities in regions with restructuring problems or suffering from their peripheral location and so promote polycentric development.
In this first phase of spatial policy for the new member states, polycentricity at the European level should be increased by promotion of the network of major cities in the “Triangle of Central Europe” between Warsaw, Prague and Budapest with its potentially high level of integration in order to strengthen the relationships of this trans-national region with the 'Pentagon', the wider Balkan area and the Balkan region as well as the trans-national region formed by the three Baltic states. Transnational co-operation with the Russian enclave Kaliningrad as well as with St. Petersburg and Kiev is important in this context.
During this transition period, however, preparations should be made for the next phase of spatial policy in the new member states. Each new member state should be encouraged to draft a national programme for regional development with emphasis on the functional growth of second-tier cities. EU funding should be provided to partnerships at the regional level – both to draft the plan and to secure its implementation. The smaller new member states should profit from drafting plans in co-operation with neighbouring countries. Plans should be based on an analysis of the potential functions and contributions to positive spatial association of the second-tier cities.
In doing this, special attention should be paid to the exploitation and further strengthening of the economies of scale of regional economic specialisation, cultural assets and environmental resources, tourism and the multiplier effects of universities and research centres, functional linkages between neighbouring regions and existing or possible trans-national networks of co-operation between cities in border regions. Also possibilities to decentralise government agencies from the capital cities to second-tier cities should be considered.
Infrastructure policy
The goal conflict between competitiveness and territorial cohesion is equally relevant for European transport and telecommunications infrastructure policy. If the competitiveness goal has highest priority, the already fast, high-capacity transport corridors between the largest agglomerations are upgraded even further. If, however, the goal of territorial cohesion has the highest priority, predominantly the connections to and between the capitals

ESPON 1.1.3 - Final Report Part 1 20
of the new member states are improved – at the expense of regional connections within these countries. Both strategies have the negative side effect of further growth in traffic, in particular goods transport. To concentrate transport investment, however, on peripheral regions to promote territorial cohesion leads to unacceptable congestion bottlenecks in the agglomerations both within and outside the 'Pentagon'.
A transport policy following the phase model differentiates between the old and new member states:
In the already highly developed and urbanised old member states existing or emerging polycentric structures are to be strengthened by predominantly improving the accessibility of medium-level central places and compensating the accessibility deficits of rural and peripheral regions. In the still urbanising new member states, however, a phased strategy is appropriate. For a transition period of ten to fifteen years it is justified to enhance the growth dynamics of these countries by fast and efficient transport connections between the capital cities and major agglomerations in the new member states and the economic centres in western Europe. After that period, however, the risk of over-dominance of these cities will have to be reduced by shifting the focus of investments first to links between medium-size cities and later, as in the old member states, to rural and peripheral regions. This would not only mean to link these regions to major cities but also to develop local accessibility including sustainable transport options such as public transport and cycling. A particular challenge would be to preserve still existing railway lines threatened by being closed down. This is a field for co-operation between all three levels, the EU, the nation state and the regional centres.
Both strategies have to be combined with Europe-wide co-ordinated measures to control the expected further rise of person travel and goods transport on roads by internalising the external costs of road transport and promoting the use of environment-friendly transport modes and regional economic circuits and so contribute to the sustainability goal of the European Union and prepare Europe for future fuel scarcity and higher fuel prices.
1.6.2 Meso level principle-based policy combinations
Monetary and financial integration
It is assumed that the spatial development of the new member states and accession countries will also be affected by monetary and financial

ESPON 1.1.3 - Final Report Part 1 21
integration. Based on their planned-economy history, the financial institutions in new member states are highly centralised. The ongoing liberalisation and move to a more financial-market based system is likely to provoke the further concentration of financial activities in the main financial centres at the national and international scale.
Similar consequences are to be expected from the liberalisation of capital flows. Liberal finance-based economic systems tend to encourage further monocentric development. Inward foreign direct investment tends to cluster in the main metropolitan areas and so impedes the development of peripheral regions, especially those with strong specialisation in agriculture, tourism or manufacturing industries.
In the near future these centralising effects of liberalisation have to be accepted as a necessary condition for the stimulation of rapid economic growth. In the long run, however, decentralisation plans at the national and regional level will be required to ensure that equity concerns are not completely overshadowed by strategies for efficient competition.
Boosting border regions
ESPON 1.1.3 has developed a typology of border regions in the new member states resulting in four types of border regions based on their integration potential: forerunners of integration, hardworkers of integration, candidates of integration and handicapped for integration.
This typology, while still in an embryonic stage could have important implications for policy formulation with regard to Structural Funds, for instance: Should greater funding be placed in cross-border regions that are already forerunners of integration in order to produce the largest, most cost-effective results? Or will more social and spatial justice be achieved by focusing on the cross-border regions that are handicapped for integration, even if the return on these projects does not yield as much on the European (macro) scale?
What has even more so become apparent as the result of the border region typology exercise is that it has become clear that no single strategy or policy instrument can serve the different needs of all the various types of border regions. Instead there is a need for more diverse and phased policy combinations with respect to the Structural Funds or transport, agricultural and R&D policy. In the short run, the most successful forerunner regions may have to be promoted, but in the medium- and long-term the focus could be shifted to the support of the most disadvantaged border regions

ESPON 1.1.3 - Final Report Part 1 22
handicapped for integration. Ideally, as shown by the illustrations of the Hungarian-Slovakian and Greek-Bulgarian border regions (text box 1.2), policy interventions should preferably be formulated at the transnational or cross-border level. In such a scheme combinations of policies can be based on more detailed data, such as flows of workers and enterprises and their likely response to available policy options.
1.6.3 Meso-level capacity-based policy combinations- Creating the strategy
The combination of the phase strategy of spatial policy and the multi-level and cross-sectoral integration of policies in policy combinations advocates focusing on the competitiveness of the major urban agglomerations in the new member states and accession countries in the initial stage, and pursuing the goal of balanced and polycentric regional development in the subsequent stages. However implicit in the first stage is the idea that growth in the capital city and urban areas would somehow also “spill-over” into the less advantaged regions.
Yet if this spill-over is to take place, it is imperative that territorial governance recognise the complementarities between policies and act upon these through national and regional strategies.
Our analysis of the national strategic plans (presented in Annex D) showed that all new member states have developed strategies for (more or less explicitly stated) polycentric development and express goals in accordance with those of the European Spatial Development Perspective (ESDP).
Most national strategies also recognise the importance of the cross-sectoral approach. For example in Estonia the challenge at the administrative level is the need to integrate and coordinate different plans regarding infrastructure, land consolidation and land use while finding a path towards convergence of the monetary system in anticipation of the introduction of the Euro. Estonia recognises that it is important to build up capacity and local initiatives for the co-ordination of various sectors. Lithuania’s strategy mentions the challenges of implementing cross-sectoral policies and the role of further decentralisation of administrative functions in this process.
Many national strategies contain an implicit plan for a phase strategy of pursuing the goals or competitiveness and cohesion. While both efficiency and equity are major goals of the national strategies, in nearly all countries

ESPON 1.1.3 - Final Report Part 1 23
the main concern seems to be regional economic growth and better economic integration with Europe, with the territorial cohesion of all regions in the country as a somewhat secondary objective. However, in a few countries the phase strategy is more explicitly formulated. Bulgaria states that regional economic growth is a platform to improve socio-economic conditions. And Poland’s documents discuss how, while sustainable polycentric development of the entire territory is a long-term goal, the medium-term strategy is rapid economic growth and increased competitiveness.
To create awareness in the new member states of the unique challenge and opportunity offered to them by their accession to the EU to develop their spatial structure towards a higher level of accessibility and competitiveness without repeating the mistakes made by some old member states, “soft” policies of capacity building and networking should be applied.
1.6.4 Micro-level capacity-based policy combinations: Capacity for implementation
It is imperative at the micro-level to not only provide opportunities to increase economic development in regions, but also to imbue measures to make sure that regions carry out the task.
As seen in the illustration of the Portuguese accession process (text box 1.1), European integration precipitated a decline in traditional economic sectors (such as fishing or shipbuilding), but stimulated other industries and opportunities (such as the automobile industry or tourism.). In the face of such restructuring of the economic base, as is now happening in the new member states and accession countries, national efforts should be put forth to assist regions and local actors to cope and in fact capitalise on the socio-economic changes that are brought about by European integration.
Capacity building measures should also take the cautious attitude that not all regions, especially in the new member states will respond equally to policies that promote specialisation or differentiation of the economic structure. While regional specialisation is one way to cope with the processes of European integration and globalisation, it may not be an applicable strategy in all regions. In this sense, capacity building measures should be uniquely specified for the regions at hand.

ESPON 1.1.3 - Final Report Part 1 24
Finally, it is of highest importance that the necessity and potential of a phase strategy to assimilate the goals of competitiveness and cohesion in the spatial development of the new member states is recognised in their spatial development plans. ESPON 1.1.3 has not been able to analyse the micro-level governance aspects of implementing such a strategy in the necessary depth and detail. Such an analysis would require the examination of a wide range of multi-level policy options: at the macro level EU structural policy support, at the national level policies to first promote the growth of major urban areas and later support peripheral regions and at the regional and local level policies to strengthen the bottom-up capacity to profit from the growth of capital and central cities. This would be an appropriate theme for a whole new ESPON project.

ESPON 1.1.3 - Final Report Part 1 25
2 Scientific Summary
This section takes up the main concepts, methodologies, typologies and indicators that have been used or developed for the ESPON 1.1.3 project. We have primarily utilised quantitative methods in our analyses of territorial cohesion and polycentric development, but these have also been enriched by selected case illustrations from the “ground”, which add depth to the analyses, provide crucial feedback to the feasibility of the typologies, and illuminate dimensions not covered by quantitative methods.
2.1 Methodologies and concepts for analysing cohesion
Convergence
This report conceptualises convergence as the process of achieving territorial cohesion. Thus convergence is the dynamic aspect of cohesion. The methods applied in section 2.1 are to a large degree focused on descriptive analyses on GDP per capita. To correct for differences in purchasing power we used GDP in terms of purchasing power parities. The concept of convergence essentially stems from a neoclassical framework, which assumes regional disparities to diminish in time. This assumption is tested by linear regression in which the growth rate of regional GDP per capita is modelled against initial levels of GDP per capita.
GDP = Gross Domestic Product
For a comparison between regions with different size (inhabitants) and different living standards (purchasing power) we use real GDP per capita, which means GDP per capita in Purchasing Power Standards (PPS). These numbers are indexed at EU15average = 100.

ESPON 1.1.3 - Final Report Part 1 26
ß- and σ-convergence
Two concepts of convergence among regions stand out in the empirical literature: ß-convergence and σ-convergence. They concentrate on whether relatively poor regions catch up with richer ones, and how regions differ in this convergence (or divergence) process. When the focus is on dispersion in wealth between regions or nations, the concept of σ-convergence is probably the most useful concept. It is based on the standard deviation, across regions, of the logarithm of real GDP per capita. When the standard deviation declines over time σ-convergence applies.
Another well-known convergence concept is the so-called ß-convergence.
The way the ß-coefficient is estimated is described as the concept of unconditional convergence. The alternative concept of conditional ß-convergence arises when extra explanatory variables are added which represent region-specific factors.
In Text Box 2.1 we list the types of cohesion indicators used in this report:

ESPON 1.1.3 - Final Report Part 1 27
Text Box 2.1 Types of cohesion indicators (1) Coefficient of variation. The coefficient of variation is the standard deviation of region indicator values expressed in percent of their European average. The coefficient of variation informs about the degree of homogeneity or polarisation of a spatial distribution. A coefficient of variation of zero indicates that all areas have the same indicator values. (2) Gini coefficient. Areas are sorted graphically by increasing indicator value and their cumulative distribution (the so-called Lorenz curve) is drawn against a cumulative equal distribution (an upward sloping straight line). The surface between the two cumulative distributions indicates the degree of polarisation of the distribution of indicator values. The Gini coefficient calculates the ratio between the area of that surface and the area of the triangle under the upward sloping line of the equal distribution. A Gini coefficient of zero indicates that the distribution is equal-valued, i.e. that all areas have the same indicator value. A Gini coefficient close to one indicates that the distribution of indicator values is highly polarised, i.e. few areas have very high indicator values and all other areas very low values. (3) Geometric/arithmetic mean. This indicator compares two methods of averaging among observations: geometric (multiplicative) and arithmetic (additive) averaging. If all observations are equal, the geometric and arithmetic mean are identical, i.e. their ratio is one. If the observations are very heterogeneous, the geometric mean and hence the ratio between the geometric and the arithmetic mean go towards zero. (4) Correlation between relative change and level. This indicator examines the relationship between the percentage change of an indicator and its magnitude by calculating the correlation coefficient between them. If for instance the correlation between the changes in GDP per capita of the region and the levels of GDP per capita in the regions is positive, the more affluent regions gain more than the poorer regions and disparities in income are increased. If the correlation is negative, the poorer regions gain more than the rich regions and disparities decrease. (5) Correlation between absolute change and level. This indicator is constructed as the previous one except that absolute changes are considered. The distinction between relative and absolute change is relevant from an equity point of view. If, for instance, as a consequence of a transport project a rich and a poor region gained both ten percent in GDP per capita, cohesion indicators would indicate neither convergence nor divergence; however, in absolute terms the rich region would gain much more than the poor region. It is even possible that a region is a winner in relative terms but a loser in absolute terms.
ESPON 1.1.3 - Final Report Part 1 28
Accessibility
Accessibility is the main 'product' of a transport system. It determines the locational advantage of an area (i.e. in ESPON a region, a city or a corridor) relative to all areas including itself. Indicators of accessibility measure the benefits households and firms in an area derive from the existence and use of the transport infrastructure relevant for their area.
The important role of transport infrastructure for spatial development in its most simplified form implies that areas with better access to the locations of input materials and markets will, ceteris paribus, be more productive, more competitive and hence more successful than more remote and isolated areas.
For the analysis of accessibility in Section 2.4 multimodal potential accessibility is selected and further developed. Potential accessibility is based on the assumption that the attraction of a destination increases with size and declines with distance or travel time or cost. Therefore both size and distance of destinations are taken into account. In the ESPON 1.1.3 application the size of the destination is represented by population, the distance between regions is measured in terms of travel time. For the impedance function a negative exponential function is used in which nearby destinations are given greater weight than remote ones. Multimodal accessibility is calculated through aggregation of road, rail and air travel time between regions (Schürmann et al., 1997; Wegener et al., 2001).
Neighbour-dependent growth
Neighbour-dependent growth is a concept that determines how geographic location affects patterns of growth. The analysis is based on the Moran I spatial autocorrelation statistic:
To avoid the problem of arbitrary neighbourhoods the following eight ‘very isolated islands’ were excluded from the dataset: ES701, ES702, FR91, FR92, FR93, FR94, PT2, PT3.
In general terms, univariate Moran I measures the degree to which a spatial phenomenon is correlated to itself in space. The expected value for Moran's I is -1/(n-1) which approaches 0 for a large number of regions. Values of I are in the range from approximately -1 to 1. Positive values imply positive

ESPON 1.1.3 - Final Report Part 1 29
spatial autocorrelation, a tendency towards clustering of similar values. The converse is true for negative values indicating that dissimilar values tend to appear in close association.
Significant values of this local Moran can be used to identify atypical regions (hot and cold spots), and areas where there appears to be a high tendency for clustering. When decomposed in this way, a local Moran statistic acts like a “spatial smoother”, indicating two forms of spatial associations. Positive forms of spatial associations are observed in the following areas:
• High-High, i.e. a high rate in a region surrounded by high values of the weighted average rate of the neighbouring regions, and
• Low-Low, i.e. a low rate in a region surrounded by low values of the weighted average rate of the neighbouring region.
• Two forms of negative spatial associations are:
• Low-High, i.e. a low rate in a region surrounded by high values of the weighted average rate of the neighbouring regions, and
• High-Low, i.e. a high rate in a region surrounded by low values of the weighted average rate of the neighbouring regions.
Regional specialisation
Below is discussed the methodology by which the ‘P’, ‘S’, ‘C’ and ‘D’ regions have been determined
In order to further investigate the relation between GDP and specialisation, we have identified four broad categories based on GDP performance. These are based on a mixed quali-quantitative measure based on the deviation from the EU27+2 average GDP per capita (in PPS) at the beginning of the period (1995) and the growth rate during the period 1995-2001. Through this indicator we have identified the following categories:
• ‘P’ (powerful) regions with GDP per capita in 1995 and growth rate of GDP per capita both above average;
• ‘S’ (slowing) regions, with a GDP per capita above average in 1995 and a growth rate below average;
• ‘C’ (converging or catching-up) regions, with a GDP per capita below average in 1995 but a growth rate above average.

ESPON 1.1.3 - Final Report Part 1 30
• ‘D’ (diverging or declining) regions with both GDP per capita in 1995 and growth rate below average.
For each of these GDP performance categories, we have extended the analysis of regional specialisation by correlating specialisation trends with the presence of the MEGAs categories identified in ESPON 1.1.1 and with the aggregation of NACE sector with the highest growth rate in the period 1995-2001.
Financial systems
The financial and monetary systems in the new member states described in section 2.7 use primarily theoretical literature for the analysis. Our research hypotheses are mainly based on previous works and studies realised in Switzerland and in the United Kingdom. Lessons are drawn from the experiences of these two countries. A conceptual framework is then built in order to catch the impact of financial and monetary variables on the spatial structures of the new EU Member states. Our empirical work is focused mainly on the ten new Member States (Cyprus, the Czech Republic, Estonia, Hungary, Latvia, Lithuania, Malta, Poland, Slovakia, Slovenia) and the two ones who will join in 2007 (Bulgaria and Romania).
2.2 Methods and concepts for analysing polycentricity
In ESPON 1.1.3 a comprehensive indicator of polycentricity developed in ESPON 1.1.1 was used to measure the degree of polycentricity of the current urban systems of the new member states and accession countries individually and taken together. The developed approach measures polycentricity by identifying three dimensions of polycentricity: the size or importance of cities (population, economic activity), their distribution in space or location and the spatial interactions or connections between them.
Size Index
The first and most straightforward prerequisite of polycentricity is that there is a distribution of large and small cities. It can be shown empirically and postulated normatively that the ideal rank-size distribution in a territory is loglinear. Moreover, a flat rank-size distribution is more polycentric than a steep one. Finally, a polycentric urban system should not be dominated by one large city.

ESPON 1.1.3 - Final Report Part 1 31
To operationalise this, two sub-indicators were defined: (a) the slope of the regression line of the rank-size distribution of population and (b) the degree by which the size of the largest city deviates from that regression line. When calculating the regression line, all but the largest city are considered.
An alternative is to perform the same analysis not for population but for GDP. As with the rank-size distribution of population, two sub-indicators were defined for GDP: (c) the slope of the regression line of the rank-size distribution of GDP and (d) the degree by which the GDP of the city with the largest GDP deviates from that regression line. When calculating the regression line, all but the city with the largest GDP are considered. Here, the primacy rate is interpreted in terms of economic dominance: a primacy rate above one indicates that the primate city is "too rich" for the urban system of the country.
Location Index
The second prerequisite of a polycentric urban system is that its centres are equally spaced from one another – this prerequisite is derived from the optimal size of the service or market area of centrally provided goods and services. Therefore a uniform distribution of cities across a territory is more appropriate for a polycentric urban system than a highly polarised one where all major cities are clustered in one part of the territory.
A second step in the analysis of polycentricity is therefore to analyse the distribution of cities over space. One possible approach is to subdivide the territory of each country into service areas such that each point in the territory is allocated to the nearest centre – such areas are called Thiessen polygons. Thiessen polygons can be constructed by dividing the territory into raster cells of equal size and to associate each cell with the nearest urban centre. In this way the area served by each centre can be measured.
In the present analysis airline distance was used to allocate raster cells to centres. As measure of inequality of the size of service areas (e) the Gini coefficient of inequality was used. The Gini coefficient measures the degree of inequality of a distribution between zero and one (or zero and 100), where zero indicates perfect equality and one (or 100) maximum polarisation.
Connectivity Index
A third property of polycentric urban systems is that there is functional division of labour between cities, both between higher-level centres and the lower-level centres in their territory and between cities at equal levels in the urban hierarchy. This implies that the channels of interaction between cities

ESPON 1.1.3 - Final Report Part 1 32
of equal size and rank, but in particular between lower-level and higher-level cities, are short and efficient. It is obvious that this requirement may be in conflict with the postulate that cities of equal size and rank should be equally spaced over the territory.
There are principally two ways to measure connectivity. One is to measure actual interactions. Ideally, the analysis would reveal functional relationships between cities of equal size or rank and between cities of different size or rank in the urban hierarchy. Appropriate indicators of such interactions would be flows of goods or services, travel flows or immaterial kinds of interactions, such as telephone calls or e-mails. The second possibility is to measure the potential for interactions. Measures of interaction potential could be infrastructure supply, i.e. the level of road connections (motorways, roads) or the level of service of rail (number of trains) or air (number of flights) connections. An urban system with good connections between lower-level centres is more polycentric than one with mainly radial connections to the dominant capital. In polycentric urban systems also lower-level centres have good accessibility.
For measuring interaction potential the multimodal accessibility of FUAs calculated for ESPON 1.1.1 was used. Two sub-indicators were defined: (f) the slope of the regression line between population and accessibility of centres and (g) the Gini coefficient of accessibility of centres. The two sub-indicators have similar meaning: the flatter the regression line, the more accessible are lower-level centres compared to the primate city, and the lower the Gini coefficient, the less polarised is the distribution of accessibility.
2.3 Scenario study methodology
Scenario Study I: RESSET
The scenarios generated by the RESSET Model (REgional Scenario Simulations for the European Territory) are quite different in conception from those produced by SASI which follows in 4.3 RESSET is a sketch planning model that enables the user to very quickly test a scenario at different levels of detail by specifying different scales of change in population, employment, and accessibility. RESSET is a sketch planning tool that is tiny in comparison, being delivered to any user over the net and designed to be run over and over again to generate a sense of the future development of Europe

ESPON 1.1.3 - Final Report Part 1 33
rather than very detailed results at the subregional level. The model is available in various forms at http://www.casa.ucl.ac.uk/resset/.
RESSET simulates change in the European space at three levels: first at the entire EU29 level (EU15+CH+NO+AC12) which involves a demo-economic forecasting model of the 29 countries based on simple extrapolation of population and employment under various plausible scenarios about aggregate growth rates – fertility and mortality, net migration and economic development.
Scenario Study II: The SASI model
The SASI model is a recursive simulation model of socio-economic development of regions in Europe subject to exogenous assumptions about the economic and demographic development of Europe as a whole and transport infrastructure investments and transport system improvements, in particular of the trans-European transport networks (TEN-T) and TINA networks. For each region the model forecasts the development of accessibility and GDP per capita. In addition cohesion indicators expressing the impact of transport infrastructure investments and transport system improvements on the convergence (or divergence) of socio-economic development in the regions and polycentricity indicators expressing the impact of transport infrastructure investments on the polycentricity of national urban systems are calculated.
The main concept of the SASI model is to explain locational structures and locational change in Europe in combined time-series/cross-section regressions, with accessibility indicators being a subset of a range of explanatory variables. Accessibility is measured by spatially disaggregate accessibility indicators (Schürmann et al., 1997; Wegener et al., 2001). The focus of the regression approach is on long-term spatial distributional effects of transport policies. Factors of production including labour, capital and knowledge are considered as mobile in the long run, and the model incorporates determinants of the redistribution of factor stocks and population. The model is therefore suitable to check whether long-run tendencies in spatial development coincide with spatial development objectives of the European Union.
The SASI model differs from other approaches to model the impacts of transport on regional development by modelling not only production (the demand side of regional labour markets) but also population (the supply side

ESPON 1.1.3 - Final Report Part 1 34
of regional labour markets). A second distinct feature is its dynamic network database based on a 'strategic' subset of highly detailed pan-European road, rail and air networks including major historical network changes as far back as 1981 and forecasting expected network changes according to the most recent TEN-T and TINA planning documents.
The SASI model has six forecasting submodels: European Developments, Regional Accessibility, Regional GDP, Regional Employment, Regional Population and Regional Labour Force. A seventh submodel calculates Socio-Economic Indicators with respect to efficiency and equity. Figure 2.4 visualises the interactions between these submodels.
Figure 2.1 The SASI model
The spatial dimension of the model is established by the subdivision of the European Union into regions at the NUTS-3 level. The study area of the model consists of the original 15 EU member states (1,085 regions), the 10 new member states (121) regions, the two accession countries Bulgaria and

ESPON 1.1.3 - Final Report Part 1 35
Romania (70 regions), Norway and Switzerland (45 regions) and the western Balkan countries Albania, Bosnia-Herzegovina, Croatia, Makedonia and Yugoslavia (9 regions), in total 1,330 regions. The regions are connected by road, rail and air networks. The temporal dimension of the model is established by dividing time into periods of one year duration. The base year of the simulations is 2001, and the forecasting horizon is 2031, however, in a backcast also the period 1981-2001 is modelled. In each simulation year the seven submodels of the SASI model are processed in a recursive way, i.e. sequentially one after another, i.e. within one simulation period no equilibrium between model variables is established; in other words, all endogenous effects in the model are lagged by one or more years.
More detailed information on the SASI model and its implementation and calibration for ESPON can be found in Wegener and Bökemann (1998) and the Final Report of ESPON 2.1.1 (ESPON 2.1.1, 2004).
2.4 Building typologies for border regions
Using the indicators geographical type of border, density of border crossings membership in Euroregions and transnational Working Communities and level of economic disparities we have designed two tentative typologies that could capture the barriers and possibilities for various types of cross-border flows.
In the “Version 1” typology, based on density of border crossings and geographic type of border, which we could call “Flow accessibility”, we see that quite naturally border regions that have “green” or easily passable borders with a high density of border crossings are Forerunners candidates of integration (integration here consisting of increased flows of goods, services, knowledge and cross-border cooperation and implicitly economic and social integration). Inter-regional export of goods is expected to be higher and the frequency of travel, for tourism or commuting, is facilitated. Those regions with low density of border crossings and generally less inaccessible borders are at the start Handicapped for integrative processes and flows. Hardworkers and Candidates for integration still have low density of border-crossings and more inaccessible borders respectively to overcome.
Based on the assumption that any kind of typology has to be related to the context of its usage the following double approach tries to summarize the observed characteristics in two different ways. The first one addresses

ESPON 1.1.3 - Final Report Part 1 36
physical characteristics that may be considered to be related with infrastructure policy interventions. The second one addresses socio-economic disparities as the target of structural policies and transnational activities.
From that point of view it is just necessary to keep the typologies separated. The rationale for the integrated typology is as follows:
Table 2.1 Dimensions and criteria for border region typologies
Dimensions Criteria
Starting position Density of border crossing
points
Intensity of transnational
activities
Potential for change Geographic type of border Economic disparities
… applied in Draft Typology 1 … applied in Draft Typology 2

37
3 Networking with other ESPON projects and internal evaluation
3.1 Networking of ESPON 1.1.3
The ESPON 1.1.3 TPG has been working in cooperation with a number of other ESPON projects in developing indicators, methodologies and scenarios. Since project 1.1.3 is broad in its mandate to depict the barriers and opportunities that enlargement presents for polycentric development, some parts of the project necessarily are enriched by cooperation with other more focused projects. Indeed it has been one of the great advantages to the ESPON 1.1.3 project is that it has spanned a relatively long time period (three years) which has given the TGP the opportunity to build on the work of the other TPGs.
In the chapter on polycentricity we have built on the work of ESPON 1.1.1, as in fact many of the project partners are involved in both projects. In conjunction with 1.1.1 the method of measuring polycentricity has been developed, as well as the means of evaluating polycentricity in relation to the normative objectives of the ESDP. Cooperation with 1.1.1 has also been fruitful in the section on Transnational Regions and Transnational Urban Networks.
The SASI model presented in the Scenario Study of the impacts of European transport policies on the Enlargement area is also used in ESPON 2.1.1.
The country reports in Annex D have benefited from cross-referencing with the country reports in ESPON 1.1.1 and 2.4.2.
In January 2004 the TPGs of ESPON 1.1.3 and 1.1.4 held adjacent partner meetings in Budapest. This was a good opportunity to discuss common problems, particularly those concerning data collection. The ESPON 1.1.3 Lead Partner also has cooperated very closely with 1.1.4 with regard to project management and financial issues.
3.2 Internal evaluation
The TPG of ESPON 1.1.3 has been very large, with 15 partners and associate partners. This has been both an advantage and a disadvantage. The
38
advantages include the very broad range of expertise which has been a value-added element to the project, in particular our partners and associate partners from the new member states, who have added credibility to many of our results. The disadvantage has been the difficulties of leading so many partners and incorporating the various contributions into the reports.
Since the project spanned a long time, there has also been the problem of changing experts within the Partner teams. The most tragic and unfortunate change for the project was the death of Lars Olof Persson, the 1.1.3 Project Leader from KTH, in February 2004. Lars Olof Persson’s leadership during the first two years of the project contributed to the vital stage of the formation of the project and the important work on the first three interim reports. His death has left the project somewhat poorer, but his inspiration and innovative ideas live on in this report, especially the idea of “policy combinations” described in chapter 5.
Lisa Van Well has subsequently taken over leadership of the project. All TPG partners have been extremely supportive in these rapidly changed circumstances. In particular, Michael Wegener, Folke Snickars and Mats Johansson have been a source of unobtrusive and appreciated support.
Since the submission of the TIR, the project group has met twice, in Ljubljana in March of 2004 and in connection with the Manchester ESPON seminar in November 2004. Cooperation among the TPG has progressed very fruitfully.
3.3 Further research issues and data gaps to overcome
The work done by ESPON 1.1.3 for this Final Report has focused on solidifying the concepts of polycentric development and territorial cohesion and in providing a diagnosis of the spatial tissue of the EU27, with particular emphasis on the Enlargement area. We have also developed a potentially useful typologies for determining where policy interventions may be directed for border regions.
As many ESPON projects have bemoaned, it is very difficult to come by data regarding flows of people, goods, services and knowledge. In this report we have set out a typology of the various potential barriers and opportunities to cross-border regional flows, but have not actually examined the flows themselves. This may be necessary to accomplish on the more micro-levels.

39
Data requests and data gaps to overcome
• Socio-economic data at municipal level
• Socio-economic and spatial interactions at municipal level
• Data of flows at regional al municipal level
• Density cross border: As one example for that kind of objective may be serve the indicator ‘Density of road border crossing points’. It should be possible to survey additional data about actual usage, capacity, usability for different groups and quality of infrastructure. Another example is to collect data about existing mountain passes and tunnels as well as bridges overcoming the natural barriers of mountain ranges and rivers. In addition the compilation of rail border crossings and shipping relations (harbours) would be desirable.
Further research issues
Further research issues include extending the border region typology to the entirety of European cross-border regions. In such an exercise one could also extend the analysis with the inclusion of water borders, rail border crossings and harbours, and add dimensions such as rural-urban and core-periphery.
We have presented the idea of a phase model as a strategy to assimilate the goals of competitiveness and cohesion in the spatial development of the new member states is recognised in their spatial development plans. ESPON 1.1.3 has not been able to analyse the governance aspects of implementing such a strategy in the necessary depth and detail. Such an analysis would require the examination of a wide range of multi-level policy options: at the macro level EU structural policy support, at the national level policies to first promote the growth of major urban areas and later support peripheral regions and at the regional and local level policies to strengthen the bottom-up capacity to profit from the growth of capital and central cities. This would be an appropriate theme for a whole new ESPON project.

ESPON 1.1.3 - Final Report Part 2 I
ESPON project 1.1.3 Enlargement of the European Union and
the wider European Perspective as regards its Polycentric Spatial Structure
Part 2 Results of the Project
Co-financed by the European Community through the Interreg III ESPON Programme

ESPON 1.1.3 - Final Report Part 2 II

ESPON 1.1.3 - Final Report Part 2 III
ESPON project 1.1.3
Enlargement of the European Union and the wider European Perspective as regards its Polycentric
Spatial Structure
Final Report
Volumes
Part 1: Summary
Part 2: Results of the Project
Part 3: Annexes A-E
December 2005
Contact Information:
Lisa Van Well KTH, The Royal Institute of Technology SE-100 44 Stockholm, SWEDEN Tel:+46 8 790 9430 Fax:+46 8 970 6761 E-mail: [email protected] Web: www.infra.kth.se

ESPON 1.1.3 - Final Report Part 2 IV
This report represents the final results of a research project conducted within the framework of the ESPON 2000-2006 programme, partly financed through the INTERREG programme. The partnership behind the ESPON programme consists of the EU Commission and the Member States of the EU25, plus Norway and Switzerland. Each partner is represented in the ESPON Monitoring Committee. This report does not necessarily reflect the opinion of the members of the Monitoring Committee. Information on the ESPON programme and projects can be found on www.espon.lu” The web side provides the possibility to download and examine the most recent document produced by finalised and ongoing ESPON projects. ISBN number: 2-9599669-3-7 This basic report exists only in an electronic version. Word version: © The ESPON Monitoring Committee and the partners of the projects mentioned. Printing, reproduction or quotation is authorized provided the source is acknowledged and a copy is forwarded to the ESPON Coordination Unit in Luxembourg.

ESPON 1.1.3 - Final Report Part 2 V
ESPON 1.1.3 Partners
• Lead Partner: KTH, The Royal Institute of Technology (SWEDEN)
• Faculty of Civil and Geodetic Engineering, Chair of Spatial Planning, Ljubljana (FGG)(SLOVENIA)
• Institute of Geography and Spatial Organization (IGSO),
• Polish Academy of Sciences (POLAND)
• Centre for Advanced Spatial Analysis (UCL) (UNITED KINGDOM)
• National Technical Univ. of Athens (NTUA) (GREECE)
• Spiekermann & Wegener, Urban and Regional Research (S&W) (GERMANY)
• Austrian Institute for Regional Studies and Spatial Planning (ÖIR) (AUSTRIA)
• Global Urban Development (formerly the Prague Institute for Global Urban Development) (CZECH REPUBLIC)
• Centre for Urban and Regional Development Studies, Ltd. (CEDRU) (PORTUGAL)
• IRER, University of Neuchâtel (SWITZERLAND)
• Karelian Institute, University of Joensuu (FINLAND)
• TNO Inro (THE NETHERLANDS)
• Hungarian Public Nonprofit Company for Regional Development and Town Planning (VÁTI) (HUNGARY)
• Nordregio (SWEDEN)
• Swedish Institute for Growth Policy Studies (ITPS) (SWEDEN)

ESPON 1.1.3 - Final Report Part 2 VI
The Content of this paper does not necessarily reflect the opinion of the ESPON Monitoring Committee

ESPON 1.1.3 - Final Report Part 2 VII
PART 2 Results of the Project
Chapter 1

ESPON 1.1.3 - Final Report Part 2 VIII

ESPON 1.1.3 - Final Report Part 2 IX
Table of Contents for Part 2 Chapter 1
1 Enlargement: Territorial Cohesion, Balanced Competitiveness and Polycentric Development 1
1.1 Background to the 2004 Enlargement 1
1.2 Framework for analysis 3
1.3 Concepts: Operationalising the “norms” of spatial development policies 6
1.3.1 Enlargement and Polycentric Development 12
1.4 The linking function of polycentricity: Efficiency and Equity 14
1.4.1 Cohesion and Competition: Looking forward 15
1.5 Looking backward: Excursions into previous enlargements 16
1.5.1 European Integration effects on the regional development and the polycentric structure: some lessons from the Greek accession experience 16
1.5.1.1 Convergence to the EU economic and social structures 16
1.5.1.2 Per region disparities 17
1.5.1.3 Territorial disparities 19
1.5.1.4 Conclusions / lessons from the Greek accession experience 23
1.5.2 Portugal European Integration: What can new member states and accession countries expect? 24
1.5.2.1 Convergence/Divergence Trends 24
1.5.2.2 The Impact of CSF II and III in Portugal (1994-99 and 2000-2006) 27
1.5.2.3 Regional Disparities in Portugal 28
1.5.2.4 Conclusions 31
ESPON 1.1.3 - Final Report Part 2 X
Figures
Figure 1.1: Framework for Analysis 5
Figure 1.2: Functional Urban Areas in Greece 18
Figure 1.3: Per head Community aid -CSF- in Greece 1994-1999 (Ecus per head) 19
Figure 1.4: Per head regional GDP (PPS – EU15=100) change in Greece 1988-2002 20
Figure 1.5: Real Convergence in the Cohesion Countries, 1988-2003 26
Figure 1.6: GDP Annual Growth in EU15 and Portugal, 1988-2003 26
Figure 1.7: GDP per capita by region in Portugal, 1995-1999 29
Figure 1.8: GDP per person employed by region in Portugal, 1995-1999 30
Figure 1.9: GDP per capita, NUTS III, in Portugal, 2001 31
Tables
Table 1.1: Population change of in the "Capital Region", the Rest of Attica, the total of Attica (MRA) and the total of Greece 1991-2001. 22
Table 1.2: Impact of CSF III in GDP (prices 1995) 27

ESPON 1.1.3 - Final Report Part 2 1
1 Enlargement: Territorial Cohesion, Balanced Competitiveness and Polycentric Development
1.1 Background to the 2004 Enlargement
The objective of the ESPON 1.1.3 project has been to analyze the enlargement of the EU and the wider European perspective with regards to its polycentric spatial structure.
The territorially enlarged Europe and extended internal market became de facto with the accession of Estonia, Latvia, Lithuania, Poland, Hungary, The Czech Republic, Slovakia, Slovenia, Cyprus and Malta to the EU on May 1, 2004. This fifth wave of enlargement as an on-going process of integration of ten new member states into the EU, represents one of the most important opportunities and challenges for the EU to increase international competitiveness and become the most competitive and dynamic knowledge-based society in the world. The challenges and possibilities will increase even more with the accession of Bulgaria and Romania in 2007.
The special geographic, historical, economic and political position of most of the new member states (EU10) and the accession countries gives a whole new meaning to considerations of polycentric spatial development. For centuries many of these countries have been part of a buffer-zone between East and West, although today their economic linkages are almost totally reoriented towards the west. Many of these states are fairly new players in the market economy and are relatively new in building up decentralized systems of governance. The relatively peripheral situation of most of the new member states (in relation to the EU15) is both a disadvantage and an advantage and we are currently experiencing a Europe for which the sphere of influence has been drastically augmented. St. Petersburg, Moscow, Kiev and Istanbul now constitute centers of economic power at the frontiers of the European territory and are important nodes in the polycentric development of Europe.
In order to better understand the driving forces and dilemmas connected to the accession of the new member states and accession countries to the EU, we take as a starting point some of Inotai’s (2003)1 seven common characteristics of EU10, largely rooted in history. Itotai’s generalisations cover a wide range of characteristics for the large and diverse territory of
1 Inotai, A., ‘The Eastern Enlargement of the EU’, in Cremona, M., 2003 The Enlargement of
the European Union. Oxford University Press

ESPON 1.1.3 - Final Report Part 2 2
the new member states and accession countries and thus do not depict the historical situation in every NMAC. In addition today many of these characteristics are outdated or even partly erroneous in many countries. Still we find that many of his observations are useful to paint a broad, if very generalised picture of the rapidly changing enlarged part of the territory of the European Union.
A. A Buffer Zone over centuries During the last 1000 years these ten countries had at various times been parts of a buffer between West and East. While this situation may not hold true today, the new challenge is to redefine the future borders of Europe in terms of territorial security, taking into account the interests of the new neighbours to the EU.
B. Economic Periphery and Peripheralisation The highly differing income levels reflecting differences in economic and industrial activity between neighbouring countries in Eastern Europe puts an intensive pressure to reinforce and accelerate the catching up process.
C. Cultural and Ethnic Diversity
The regions of East Central, and South Eastern Europe as well as Eastern Baltic Sea region are multicultural regions, with corresponding problems and potential advantages for territorial cohesion.
D. Top-down versus Bottom-Up Development Patterns
Some of the countries in the region are the historical products of top-down development. The results of the development have been both positive and negative. However many of these are nation-states, which have had long struggles for independence and this together with unprecedented entrepreneurship and mobility, provide the important preconditions for bottom-up development patterns.
E. Modernisation Anchor Outside the Region
There is little doubt that the modernisation anchors thus far remain located outside geographic frontiers of the new member states and accession countries and could explain why regional cooperation has been sometimes limited in the past. However, as these countries now accede the EU, the prospects for regional cooperation should improve spectacularly, in trade, investments and joint infrastructural and environmental projects.

ESPON 1.1.3 - Final Report Part 2 3
F. Economic Modernisation versus National Sovereignty
Today we can see that in many countries in new member states there is a certain split in the society. On the one hand, they accept that their key to economic modernisation is the EU. On the other hand they would like to keep their hard-won political sovereignty. The challenge is that shared sovereignty, interdependence, practical strategic alliances and flexibility are the most important requirements in order to protect national interests in the newly enlarged EU.
Effects of enlargement and integration are already being seen and these present, not surprisingly, a mixed bag of results: Growth rates in the enlargement area are above the EU15 average, but within countries, real economic convergence remains limited. Economic restructuring is occurring in the enlargement area from primary sectors to the service sectors, but employment levels have fallen.
This Final Report of the ESPON 1.1.3 Transnational Project Group (TPG) thus takes a deeper look at the process of enlargement and its effects on polycentric development, balanced competitiveness within the European territory and territorial cohesion.
We do this by first taking a step back and examining the situation of the changing European tissue from 1995-2000 (2001) via backcasting methods to diagnose the state of spatial development in the EU as a whole and primarily in the EU10. A second step involves ascertaining recent trends in development patterns. We also employ forward looking scenarios to examine possible futures of the stepwise spatial integration of the new member states and candidate countries in a polycentric and cohesive European space.
1.2 Framework for analysis
In examining the effects of enlargement of the European spatial tissue we implicitly and explicitly make several assumptions throughout this report. The first is that the processes of enlargement have been long-term projects. While the emphasis of this report is on the latest enlargement in 2004 and the next slated enlargement of 2007, we recognize that the four previous enlargements have undoubtedly had a great impact on the territorial integrity of the European space, the effects of which are still being seen. The latest enlargement process began already over a decade ago when many of the new member states and accession countries regained independence

ESPON 1.1.3 - Final Report Part 2 4
after a period of Soviet influence and planned economy. With the goal in mind to rejoin the European sphere in terms of identity and the internal market the new member states and accession countries already began the orchestration of transforming social, economic and political systems to be coordinated with the acquis communautaire. This process was strengthened by the associate membership of (some of) these countries in the early 1990s. Thus the period of analysis in our report largely begins from the year 1995 and runs in most cases to 2000 or 2001.
We assume that, for the new member states, this period of time represents an “EU accession trial stage” where economic changes due to the introduction of market economy rules, the growing economic ties with the EU countries and the release of the European Commission’s Cohesion and Pre-accession Funds, already show impacts on the economic performance and specialisation of the individual regions.
While enlargement in and of itself has obvious ramifications on the territorial morphology of Europe and its polycentric development, an important intervening variable which effects the functionality of territory is the process of European integration. By integration we mean the expanding, widening and deepening of possibilities for joint action, both inter-governmental and supranational, in the European space. Integration is generally discussed in terms of macroeconomic integration, but is also highly political, social, monetary and, most important for our purposes, spatial.
The mandate for ESPON 1.1.3 has been to examine the effects of enlargement on the polycentric spatial structure also in terms of the goals or norms of the European Spatial Development Perspective (ESDP): Balanced competitiveness, territorial cohesion and conservation of the natural and cultural heritage. The emphasis has more and more been focused (Lillehammer Guidance Paper) on territorial cohesion. However here the causality becomes less clear. Processes of integration can push both the polycentric development of the ESPON space as well as competition, cohesion and sustainable development, but the direction is not self-evident. Polycentric development as a policy strategy attempts to link up the goals of cohesion and competition, but is also constituted by these two factors, as well as by sustainable development. In this sense polycentric development could be seen as both an intervening variable (policy strategy) and as a dependent variable (functional state of affairs). Figure 1.1 below shows this chain of policy reasoning (ie the relationships in the figure below are of polity nature, rather than causal).
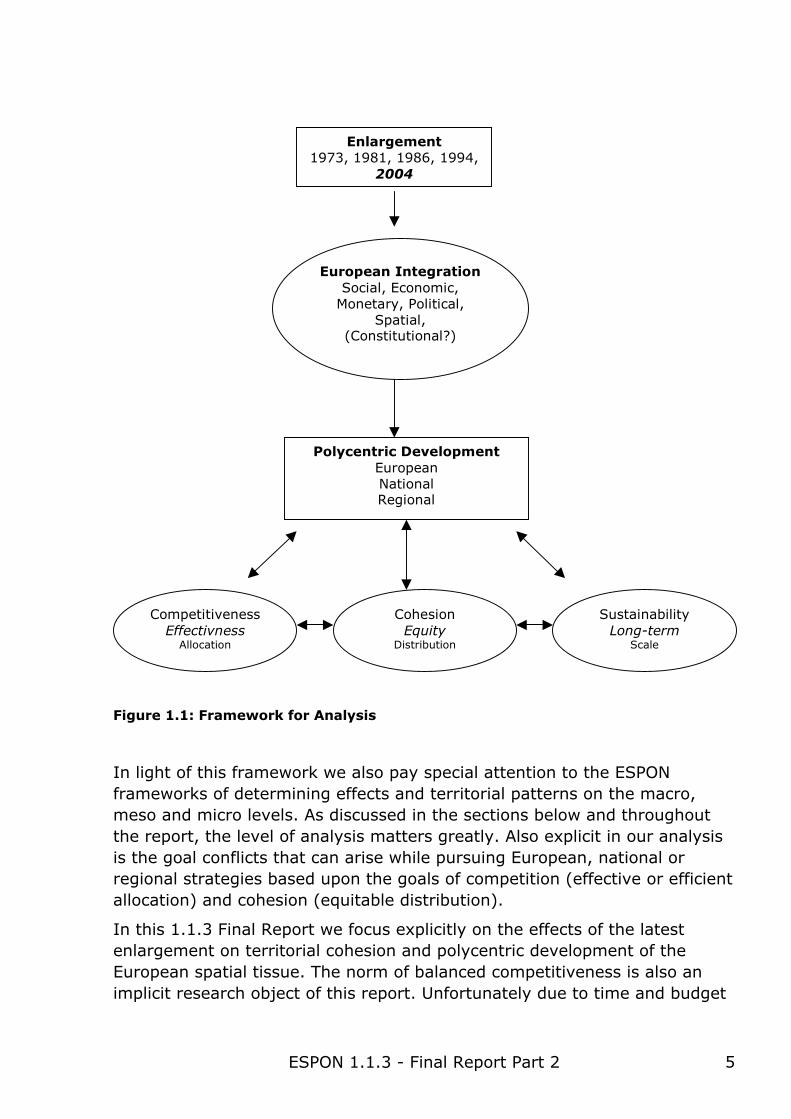
ESPON 1.1.3 - Final Report Part 2 5
Figure 1.1: Framework for Analysis
In light of this framework we also pay special attention to the ESPON frameworks of determining effects and territorial patterns on the macro, meso and micro levels. As discussed in the sections below and throughout the report, the level of analysis matters greatly. Also explicit in our analysis is the goal conflicts that can arise while pursuing European, national or regional strategies based upon the goals of competition (effective or efficient allocation) and cohesion (equitable distribution).
In this 1.1.3 Final Report we focus explicitly on the effects of the latest enlargement on territorial cohesion and polycentric development of the European spatial tissue. The norm of balanced competitiveness is also an implicit research object of this report. Unfortunately due to time and budget
Enlargement 1973, 1981, 1986, 1994,
2004
European Integration Social, Economic,
Monetary, Political, Spatial,
(Constitutional?)
Polycentric Development European National Regional
Competitiveness Effectivness
Allocation
Cohesion Equity
Distribution
Sustainability Long-term
Scale

ESPON 1.1.3 - Final Report Part 2 6
considerations, we only take up the norm of conservation of the natural and cultural heritage very slightly, as this was not one of the main tasks of the project.
The research questions addressed in this final report deal with the challenges of territorial cohesion and competitiveness in an enlarged European Union (Chapter 2) and the possibilities for polycentric development as a strategy to link these challenges (Chapter 3). The Scenario studies in chapter 4, based on the RESSET and SASI models, also assesses the impacts of the accessibility projects on the regions in the accession countries in terms of both cohesion and competitiveness.
1.3 Concepts: Operationalising the “norms” of spatial development policies
The problem with empirically evaluating the effects of enlargement on polycentricity in terms of the three objectives is that competitiveness, cohesion and conservation are not strictly codified in terms of EU policy. Spatial development policy, in which these three objectives are operative, is still the formal and legal domain of national and local governments. However, while the EU does not have full competence in the area spatial development, it has been active in producing a set of common objectives or norms for the area. We will address these objectives in this section, as well as in the final section, as norms, which describe “collective expectations for the proper behavior of actors with a given identity” (Katzenstein 1996:5). They differ from directives or regulations in that they have weak legally enforceable qualities. Rather norms prescribe or proscribe the range of acceptable actions for an actor (governmental or non-governmental) that adheres to a certain identity, in our case a European identity. As Kratochwil (1989: 11) states "Norms are therefore not only "guiding devices", but also the means which allow people to pursue goals, share meanings, communicate with each other, criticize assertions, and justify actions.”
The identity aspect of norms is particularly important in the case of spatial development policies in the recent enlargement countries. Integration into the EU has been a long process that started years before actual accession. Many of the EU10 have had recent histories as part of the Former USSR or as Soviet Satellites and independence has been accompanied by processes of (re)-establishment of former national identities. Augmenting this identity process is now the most recent identity as a member of the European Union.

ESPON 1.1.3 - Final Report Part 2 7
Norms such as those posed within European spatial development can play an important role in consolidating both national and EU identities.
With regard to European spatial development, we can conceive of the primary normative document being the ESDP2. This legally non-binding code of guidelines and actions that “ought” to be carried out has no legal backing, but assumes its power via the intensive negotiating process between governments and EU institutions that preceded the adoption of the document. The broad norms of the ESDP are synthesised into economic and social cohesion, conservation of natural and cultural heritage and balanced and effective competition across the community territory. To this we would all the more all-encompassing norm of territorial cohesion (as expounded on in the Third Cohesion Report of 2004) and the operational norm of polycentric development, which coordinates these norms as a policy option or strategy.
In our discussions below of the concepts (or norms) of territorial cohesion, competition and polycentricity as they relate to enlargement, we take up both the political and the theoretic aspects of each term. But we also operationalise the terms and problematise them in terms of research questions or aims of this report.
Territorial Cohesion, Competitiveness and Enlargement Past enlargements (1973, 1981, 1986, and 1994) as well as the latest enlargement have presented challenges for the EU in terms of promoting the political goals of economic, social and territorial cohesion. The accessions of Greece (1981) and Spain and Portugal (1986) widened the social and economic divergences within the then EU considerably. Perhaps it is not a coincidence that social and economic cohesion became a political goal for the European Union as formalised in the EC Treaty (Title XVII) established by the Single European Act of 1987 soon after the second and third enlargement waves.
“Economic and social cohesion, as defined by Article 158, is needed for the Community’s ‘overall harmonious development’ and requires a reduction of the ‘disparities between the levels of development of the various regions’, i.e. the ‘backwardness of the least favoured regions’, which include rural areas.” Faludi (2005: 6) suggests that in connection with this, Spain (as a 2 The ESDP process has also be conceptualised as a “discourse” by Böhme (2003) or
“ideology” by Hajer (1989). These conceptualisations obviously are close to seeing the ESDP process as a normative one. The focus on norms, however, in our definition, put more emphasis on the identity factor, that is that the ESDP proscribes and prescribes the actions that should be taken for an actor with a “European” identity.

ESPON 1.1.3 - Final Report Part 2 8
new member state at the time) was active in insisting that disadvantaged regions should be compensated for the disadvantages of the Single Market and that cohesion policy funding should be greatly increased.
Territorial cohesion is a relatively more recent political term which is used to incorporate the spatial or territorial dimensions of social and economic cohesion. The Third Cohesion Report asserts that:
The concept of territorial cohesion extends beyond the notion of economic and social cohesion by both adding to this and reinforcing it. In policy terms, the objective is to help achieve a more balanced development by reducing existing disparities, preventing territorial imbalances and by making both sectoral policies which have a spatial impact and regional policy more coherent. The concern is also to improve territorial integration and encourage cooperation between regions . (CEC, 2004a:27)
This rather vague focus is intentional, as Faludi (2005) reminds us that territorial cohesion is a politically negotiated concept “…whose function is to generate consensus”. During the writing of the Third Cohesion Report the EU and the member states were heavily involved in pre-accession integration and negotiations. The newest member states (EU10) had a part in this process and thus the concept of territorial cohesion in the Third Cohesion Report also implicitly refers to the latest accession wave in 2004. Most certainly the recommendations given in the Third Cohesion Report for the direction of the Structural Funds is largely focused on the process of enlargement.
While this report will not drive the hypotheses that the negotiation of the concept of territorial cohesion has political linkages with the accession of the EU-10, it is nonetheless interesting to note the intentional or unintentional coincidence of the establishment of territorial cohesion as a “new” EU political goal at roughly the same time as the fifth enlargement process, just as the concept of social and economic cohesion could have been driven by the accession wave of the 1980s.
This raises our first research question: What can the new member states expect from the experiences of previous enlargements?
In other words how did previous enlargements and integration into the EU affect the spatial tissue within enlargement countries? We present the illustrations of the Greek enlargement into the EU in 1981 and the Portuguese accession in 1986 in order to assess the step-wise integration of these enlargement processes. Although it is impossible to transfer the experiences of previous enlargement to the sew member states and accession countries, we nevertheless illustrate Greece and Portugal as

ESPON 1.1.3 - Final Report Part 2 9
examples of what the new member states and accession countries could possibly expect, and more importantly, not expect, with regard to territorial cohesion at the national and regional levels.
In Chapter 2 we look deeper into the processes of territorial cohesion and convergence in the European territory that are induced by greater integration. We first take some time to reflect on the meanings of cohesion and convergence and portray convergence as the dynamic counterpart to the more static state of affairs of cohesion. Thus convergence is the process of becoming cohesive.
The salient questions regarding convergence are: To what extent do the poorer regions of the EU have the possibilities to “catch up” with those more advantaged regions? Is convergence happening in the EU space? (chapter 2, sections 2.1 and 2.2).
We realise that the question is ultimately dependent on the spatial scope addressed. Patterns of convergence or divergence do look different when examined from NUTS2 or NUTS3 level (we choose NUTS3 for most of our analyses). What we do see at NUTS3, however, is greater spatial polarisation in much of the ESPON space, including the new member states.
Regional policies aimed at competitive strength and international cohesion should focus on agglomeration advantages and disadvantages of core regions within the new member states. Increased integration can lead to convergence and symmetrical flows with regard to capital and labour, if regional or national development is steered by polycentric policy strategies. But asymmetrical (one-way) flows could on the contrary lead to increased divergence if polycentricity is not on the political agenda- that is the most competitive regions will attract the lion’s share of flows at the cost of the disadvantaged regions.
There are several ways of examining and approaching the question of EU-level and national convergence. In making our “diagnosis” of the cohesion situation of the new member states and accession countries, we employ various methods, which paint a range of different pictures of the spatial tissue of Europe. This, of course has to do with the types of questions being asked. But what the research questions have in common is that all take as their point of departure that enlargement will spur greater integration of European of the European territory.
First we examine a type of integration in the form of transport accessibility patterns in Europe with a special focus on the new member states and accession countries and relate regional accessibility to regional economic performance.

ESPON 1.1.3 - Final Report Part 2 10
Through the EU enlargement process the relationship between transport infrastructure and regional economic development has become more complex than ever, and the fruitful question is: Are regions with higher accessibility really more successful than other regions? (chapter 2, section 2.4)
While transport accessibility functions as an integration process to overcome geographical distance, the question can be posed how much geography in itself affects regional development and cohesion.
Another question related to physical and geographical distance is: To what extent does geographical proximity matter in the regional development of the ESPON space? Is it advantageous to have prosperous neighbours? (chapter 2, section 2.5)
The hypothesis in this case is that regions with similar development patterns (either positive or negative) tend to be located close to one another. In an enlarged and integrated Europe, especially as a consequence of the latest enlargement to the east, this kind of dependence can be expected to strengthen due to the constantly increasing mobility of goods and production factors, as well as intensified inter-regional cooperation. Neighbour-dependent growth in the EU10, EU15 and EU27+2 is explored by the method of spatial autocorrelation (see Part I, scientific summary for a full explanation of this method).
Processes of integration and globalisation are also expected to affect the degree of regional specialisation and geographic concentration of economic activities in the entire ESPON space. This is particularly true in the light of effectiveness policies and interventions to increase regional competitiveness and boost productivity. However as regional specialisation increases, industry-specific shocks risk becoming region-specific shocks, thus eroding processes of convergence.
The main questions are: Is there a relationship between specialisation trends and economic sectors? Is there a relationship between specialisation trends and presence of MEGAs and is the relationship different for old and new member states? Which regions are most vulnerable? (chapter 2, section 2.6)
To address these questions we develop a typology showing powerful, slowing, converging and diverging regions based on GDP per capita and growth rate, which is augmented by the presence of MEGAs and type of regional specialisation (or de-specialisation) in various sectors.
While there has been much emphasis placed on decentralized economic development and regional specialization as some of the main means to
ESPON 1.1.3 - Final Report Part 2 11
redress regional disequilibria, the effects of financial and monetary integration have largely been neglected.
However we address this topic by the hypothesis that financial and monetary integration in the enlarged EU will play in increasingly central role in determining patterns of territorial cohesion and competitiveness. The disappearance of local and autonomous banking systems and the concentration of financial activities in main financial centres are generally considered to be the consequence of ensuring efficiency and competitiveness of financial markets.
The salient question is: Will financial and monetary integration have beneficial repercussions for all the regions that make up the European economy or will it provoke spatial discontinuities? (chapter 2, section 2.7)
To answer this question, we identify the cohesion and competitiveness effects of the enlargement process on economic and urban structures in a context of financial and monetary integration, with an additional focus on levels of FDI inflows received by the new member states.
While expanding trade and investment flows across borders between the EU15 and the new member states and accession countries and among them is expected to be a result of increased integration, the data about factor endowments is are in many ways incomplete. However cross-border interactions or flows can be approached by examining the potential for increased integrative flows, as we do in the section regarding the special position of border regions
Border regions tend, for the most part, to be lagging regions. For instance, while border regions constitute about a quarter of all NUTS 3 regions within the EU, their share in the number of lagging regions (ESPON 2.1.1 and 3.1) amounts to nearly 40%. Thus a particular focus on the border regions of the EU, and especially in the new member states seems appropriate. The border between the EU15 and the EU10 is especially important, as much of this border constituted the former “Iron Curtain” separating the two previously very different political and economic systems.
The dominant role and increasing importance of borders and border regions is one of the most distinguishing features of the enlargement area today. We make the assumption that high levels of economic disparities in cross-border regions is not necessarily a handicap for integration, but rather gives greater potential for change. The geographical type of border, the density of border crossings and intensity of transnational activities are also important factors in examining the possibilities for potential flow integration of these areas. We develop two different typologies examining the potential for change in

ESPON 1.1.3 - Final Report Part 2 12
border regions; one based on physical characteristics of the border region and the other on socio-economic factors.
The main questions addressed in the border region typologies are thus: What types of border regions have the greatest potential for intensified integration? Where are the regions that are in need of further assistance to capitalise on the possibilities of integration? (chapter 2, section 2.9)
The border region typologies are further enriched by illustrations of cross-border regions in the enlargement area with the goal to assess the feasibility of the typologies from a qualitative perspective.
1.3.1 Enlargement and Polycentric Development
Polycentricity is one of the core concepts of ESPON. Following the European Spatial Development Perspective (ESDP), the promotion of a 'balanced polycentric urban system' is one of the most frequently cited policy objectives of the programme. The interest in polycentric development is fuelled by the hypothesis put forward in the ESDP that polycentric urban systems are more efficient, more sustainable and more equitable than both monocentric urban systems and dispersed small settlements.
Polycentricity is the main topic of ESPON 1.1.1 "The Role, Specific Situation and Potentials of Urban Areas as Nodes of Polycentric Development". However, polycentricity is also of great importance for ESPON 1.1.3. In contrast to ESPON 1.1.1, here the focus is on polycentricity in the new member states of the European Union. Indeed the mandate for the ESPON 1.1.3 project has been to ascertain how the process of EU enlargement has effects of the polycentric spatial tissue of Europe at all levels.
To this task, the challenges for the 1.1.3 project are: How to measure the degree of polycentricity of a region, a national urban system or the European urban system at large, and to evaluate it with respect to the policy objectives of European Spatial Development Perspective competitiveness, cohesion and environmental sustainability? (chapter 3, section 3.4).
This is accomplished by the development of an approach to measure polycentricity by the three dimensions of: the size or importance of cities (population, economic activity), their distribution in space or location and the spatial interactions or connections between them. In this 1.1.3 report, the new member states and accession countries are highlighted as to their national level of polycentricity.

ESPON 1.1.3 - Final Report Part 2 13
Polycentricity is a concept based on central-place theory as originally conceptualised in 1930s. In such, polycentricity gives priority to the analysis of the role of cities and the urban structure in a spatial development, considering cities and their relationships aiming for growth of centres.
Considering the priority of cities or Functional Urban Areas (FUAs) we ask the descriptive questions of: What is the pattern of the FUAs in the new member states and accession countries and which are the important Metropolitan European Growth Areas (MEGAs)? Are there any Potential Integration Zones in the Enlargement area? (chapter 3, section 3.3.1.2 and 3.3.1.3)
The point of departure for these queries is the European scale. The project used as a main building block the FUAs and MEGAs of ESPON 1.1.1 to zoom in on a closer picture of the polycentric potential in the Enlargement area. In addition we propose two ideas for transregional Potential Integration Zones when considering future visions of further integration of the new member states and accession countries with transregional counterparts of the EU25.
Polycentricity is given a primary role in the ESPON programme as the means of achieving territorial cohesion. Thus it is conceptualised as both an ongoing process and as a goal to be achieved and is alleged to help in reducing regional disparities and in increasing competitiveness for integration (see chapter 3). Yet it is important to bear in mind that polycentricity at heart a political concept. As Bas Waterhout succinctly reports, polycentricity is a bridging concept and “…. the only substantive spatial planning concept the European Spatial Development Perspective (ESDP) with the potential to integrate the interests of the many parties involved”3. Meijers, Waterhout and Zonneveld more recently (2005: 97) express that “From a substantive point of view its most important feature is that it links the seemingly conflicting goals of cohesion across the EU territory and the level of competitiveness of the EU on the global level”.
The question we examine in the report is: What is the inherent goal conflict between cohesion and competition, and between various levels, in strategies to achieve polycentricity? (section 3.2)
This Final Report also takes this substantiation of polycentricity as a political way to achieve the norms of competitiveness and cohesion.
3 Waterhout, Bas. 2002. Polycentric Development: What is behind it? in European Spatial Planning, Faludi, A. ed.
Cambridge, Mass p 93

ESPON 1.1.3 - Final Report Part 2 14
1.4 The linking function of polycentricity: Efficiency and Equity
Following Waterhout, Zonneveld and Meijers (2005) our conceptualisation of polycentricity in this report is that it melds together the norms of competitiveness and cohesion in a politically acceptable way that could be useful for formulating national spatial plans, concepts and strategies. In a sense this represents the classic dilemma of efficiency (competitiveness, as strengths and potentials) and equity (cohesion, as the distribution of wealth and employment).
Waterhout, Zonneveld and Meijers (2005) found that there are two types of equity norms regarding polycentric strategies: those that deal with reducing disparities within the urban systems and those that aim to reduce geographical imbalances between various regions of the country. Concerning competitiveness they make the interesting finding that countries and regions that are relatively more polycentric on a national level, such as Swizterland, the Netherlands, Flanders, Germany, Poland and Slovenia, tend to have competitiveness of the country as a whole as a primary goal.
But as Waterhout, Zonneveld and Meijers (2005) state, most national plans for polycentric development pursue these policy norms concurrently. Indeed since cohesion and competitiveness are “norms” that should be addressed in national policies, it behoves all countries to pay heed to these goals. Cohesion is a goal that focuses on deficiencies and challenges, while competitiveness is a goal that emphasises potentials.
In the policy implications chapter of this report, we examine the extent to which national polycentricity strategies in the new member states and accession countries reflect both the norms of cohesion and competitiveness.
We thus ask the question: Is it possible to distinguish a dominant norm- competitiveness or cohesion, in the spatial strategies of the new member states and accession countries, or are both referenced equally? (chapter 5 and Annex D)
However there does seem to be a temporal aspect to the conflicting goals of efficiency and equity. Korcelli in the same special issue of Build Environment (2005) describes National Concept of Spatial Development in Poland as an attempt to find a balance between efficiency and equity, yet priority in the short term has been given to efficiency or national competitiveness as the quickest path to economic development. Perhaps the idea that focusing on major cities as the engines of a growth that will “spill over” into the rest of the country, will form the first stage. But more importantly, the intermediate, and more long-term political goal is that of equity or cohesion

ESPON 1.1.3 - Final Report Part 2 15
of the entire national territory. “Spatial polarisation in the long term is not accepted by the National Concept of Spatial Development” (Korcelli 2005:137). In fact with the new government established in Poland in October 2005 there seems to be a clear shift towards more socially-oriented policy approaches (personal communication with Piotr Korcelli).
In this report we ask the question of: How can the future spatial policies of the European Union to find a rational and sophisticated solution to this goal conflict? What are the challenges then for structural policy and infrastructure policy?
This temporal or phase model of spatial development encapsulating both efficiency and equity concerns is discussed in greater detail in the policy conclusions of Chapter 5.
1.4.1 Cohesion and competition: Looking forward
In addition to the very long-term scenarios produced by the sketch of the RESSET model depicted, our forward-looking study of cohesion and competition was conducted by scenario studies to assess the impacts of the TEN-T and TINA projects on the regions in the accession countries. The method used was the regional economic model SASI used already in ESPON 2.1.1 (ESPON 2.1.1, 2004). Here the SASI model was used specifically to forecast the socio-economic development of the regions in the new member states after their entry into the European Union.
One of the main obstacles for the integration of the candidate countries in eastern Europe is the poor quality of transport infrastructure in these countries and between these countries and western Europe. In the context of ESPON 1.1.3 the issue is how much the reduction of barriers such as border waiting times or customs at the former EU borders or political, cultural or social barriers between regions and countries after the enlargement of the European Union will benefit the new member states? What is the expected impact of the TEN-T and TINA projects on the regions of the NMACs? Can we forecast cohesion and competitiveness?

ESPON 1.1.3 - Final Report Part 2 16
1.5 Looking backward: Excursions into previous enlargements
1.5.1 European Integration effects on the regional development and the polycentric structure: some lessons from the Greek accession experience
Since 1981, when it became member of the EU (then EC), Greece has been following a course of intense integration in the structures of the European Union. As a lagging behind country it has profited until now from the EU Cohesion Policy (implemented through the Structural Funds/SF and the Cohesion Fund). We will mainly allege that the effects of Cohesion Policy on the regional development and the polycentric structure of Greece could be useful as teachings for the recent (2004) and future accession countries, the majority of which are economically lagging behind today.
1.5.1.1 Convergence to the EU economic and social structures5
At the national level in terms of GDP per capita during the interval 1980-20026 Greece began to approach the Community average. However this rate of convergence has been somewhat slower than in other Cohesion countries. More specifically, during the period 1980-1987, retardation in Greece increased slightly (in relation to the remainder of the EC)7.
During the period 1988-2001, retardation decreased by one third in Spain, Greece and Portugal, the three poorer member states, (in relation to the rest of the Union). In other words, the GDP per capita of these three countries together was increased from 68% (1988) to 78% (2001) of the EU-15 average. More specifically, GDP per capita in Greece increased from 58% (1988) to 67% (2001) of the EU average8. As a comparison, during the
5 See methodological notes on the use and the interpretation of the GDP per capita per country and per region for long term comparisons in Annex 6 We used data from 1988 onwards which are compatible with the ESA95 methodology used by Eurostat from 1995 onwards. The data for 1988 are extracted from the table 1 in Annex of the EC (2003), Second progress report on economic and social cohesion, while those for 2002 are extracted from the EC (2004) Third Cohesion Report. For the years 1980-87 see in more detail in our Annex A11. 7 See methodological notes in Annex A11. 8 See methodological notes in Annex A11.

ESPON 1.1.3 - Final Report Part 2 17
same interval, the percentage of Ireland was increased from 64% to 118% of the EU-15 average.
During the integration process of Greece into the EU the unemployment rate of the country increased considerably. Considering the interval 1992-2002, this rate increased from 7.8% to 10.8% while the EU-15 rate decreased from 8.9% to 7.8%. In 2002 Greece had the highest unemployment rate among the cohesion countries.
1.5.1.2 Per region disparities
Before the entry of Greece in the EU, the inter-regional disparities in terms of GDP per capita were very intense, mainly between the metropolitan regions of Athens and Thessalonica and the remaining regions. A second range of per head GDP disparities existed between, on the one hand, the coastal zones and the lowlands as well as the regions located across the corridor, with an S form, Patras - Athens - Thessalonica - Kavala (cf. in Figure 1.2) and on the other hand, the remaining regions of the country.
The Community Support Frameworks (CSFs) for Greece, the main instrument of the implementation of the EU Cohesion Policy for the country, intended to limit these disparities. Here we mainly refer to the relevant prerogatives of the CSFs implemented during the 1990s: the First CSF in 1989-1993 and the Second CSF in 1994-1999, because their effects on the inter-regional disparities could be examined using the GDP per capita data per region for 2002.
The per head regional aid which was given by these two CSFs was by far bigger in the case of the least developed regions compared with the developed regions. Figure 1.3 shows the allocation of the Second CSF 1994-1999. The regional aid given by the First CSF 1989-1993 was similarly allocated per region (Angelidis 2004a). We note that the per region allocation of the Third CSF 2000-2006 favoured the less developed regions to an even greater extent.

ESPON 1.1.3 - Final Report Part 2 18
Figure 1.2: Functional Urban Areas in Greece
Source: Angelidis 2005

ESPON 1.1.3 - Final Report Part 2 19
Figure 1.3: Per head Community aid -CSF- in Greece 1994-1999 (Ecus per head) Source: Andrikopoulou – Kafkalas 2000 (data used: CSF for Greece 1994-1999, Population census 1991) – The map has been redrawn by NTUA
The situation today indicates that measured as GDP per capita, inter-regional disparities in Greece increased slightly (or remained substantially unchanged) during the interval 1988-2002 (see in Figure 1.4). What is more important, the differences (mainly between MRA and the rest of the regions) with regard to the crucial elements of productive structures, such as RTD (Research-Technology-Development), the quality of the human potential, business competitiveness, the quality of the services provided to enterprises and citizens etc, remain very strong.
1.5.1.3 Territorial disparities
Territorial disparities are not confined in the per region disparities as for the socio-economic indicators. They further include disparities within the urban systems and the relationships of these systems with the countryside, the localization of the economic activities and the infrastructures, the land uses, etc. Here we focus on the effects of the implementation of the 1st (1989-1993) and the 2nd (1994-1999) CSFs on the urban structure of Greece.

ESPON 1.1.3 - Final Report Part 2 20
Before the 1990s the Greek space was strongly monocentric. Spatial growth was focused on the metropolitan region of Athens, in Thessalonica and in the S-shaped corridor "Patras – Athens – Thessalonica – Kavala" (Figure 1.2). The potential of the small and medium-sized cities, i.e. the regional, prefectoral and local level centres was by far smaller while the intensity of the interconnections among them as well as with their surrounding countryside was very low.
0
20
40
60
80
100
120
Tot
al G
reec
e
Ana
t. M
aked
onia
, Thr
aki
Ken
trik
i Mak
edon
ia
Dyt
iki M
aked
onia
Thes
salia
Ipei
ros
Ioni
a N
isia
Dyt
iki E
llada
Ster
ea E
llada
Pelo
ponn
isos
Att
iki
Vor
eio
Aig
aio
Not
io A
igai
o
Kri
ti
Regions
Per
head
Reg
iona
l GD
P (P
PS)
EU15
-100
1988 1995 2002
Figure 1.4: Per head regional GDP (PPS – EU15=100) change in Greece 1988-2002
* PPS: Purchasing Power Standards Source of data: For the year 1988 older estimations EC, for the years 1995 and 2002: Eurostat site ESA95.The data are processed by the author
In order to evaluate the territorial effects of the 1st and the 2nd CSFs we selected from all of the programs implemented, those concerning the transport system and we mainly examined the effects of these last in the urban system. A considerable part of the transport infrastructure finance was dedicated to the improvement of the national motorway linking Athens to Thessalonica and the northern frontier (“PATHE”), the construction of several parts of the motorway “Egnatia”, linking the western part of northern Greece to its eastern frontiers and the construction of new or the improvement of existing parts of important road axes in Western Greece, as well as in other regions of the country. Two important metro lines as well as a new international airport were constructed in the metropolitan Region of

ESPON 1.1.3 - Final Report Part 2 21
Athens. Finally, several harbours and airports situated in the rest of the country were constructed or upgraded. The motorways “PATHE” and “Egnatia” as well as the Athens international airport have been included in the TEN – Transport.
The entire national transport system became more powerful and the transport service provided to a great number of regions of the country was considerably ameliorated. The improvement of the motorway Athens-Thessalonica-northern frontier, although necessary, favoured the already “overdeveloped” S-shaped corridor Patras-Athens–Thessalonica–Kavala. The parts of the “Egnatia” motorway which have so far been constructed mainly improved the accessibility of Thessalonica and secondly the accessibility of certain small and medium-sized urban centres of Northern Greece. However, the positive effects of this “peripheral” motorway are less important than expected because it remains unfinished. The construction of the other road axes, harbours and airports located in peripheral regions could contribute substantially in the development of a considerable number of provincial urban centres but some of the relevant infrastructures have not yet been completed, the most important case being the Northwest–Southwest Greece axis which still remains in a poor state.
The use of the improvement of the national transport system as a means to make the urban system of the country more polycentric constituted an objective of the CSFs (1st and 2nd) although this was not so clearly specified. This objective had also been included (more clearly specified in this case) in the General Framework of Spatial Planning and Sustainable Development of Greece (2002) (this Framework is not yet approved by the Parliament) in line with the relevant orientation of the ESDP. As explained above, this objective was achieved in practice (during the implementation of the transport infrastructure programs) to a limited extent. The transport works that have been finalised have not constituted cohesive networks capable of sufficient support to the strengthening of the urban systems of the country’s peripheral regions. Their effects remain limited from this point of view since they improved the accessibility of a restricted number of peripheral urban centres.
Some crucial aspects emerge in the “final image” of the Greek urban system. Even after the implementation of the 1st and 2nd CSFs, the Greek urban system remains strongly monocentric. We should not, however, confine ourselves to a general statement. It is necessary to examine in greater depth the changes of the urban system. As for the population potential, the metropolitan region of Athens maintains its primacy. The population of the initial agglomeration, i.e. the so-called Basin of Athens, has stabilised, but the metropolitan region has gradually integrated the rest

ESPON 1.1.3 - Final Report Part 2 22
of the area of Attica, the population of which rose strongly during the 1990s. So, the population of the extended metropolitan region of Athens (MRA) –of the entire area of Attica has grown considerably. Therefore, its participation percentage in the total population of Greece remains unchanged9 (see table 1.1).
Table 1.1: Population change of in the "Capital Region", the Rest of Attica, the total of Attica (MRA) and the total of Greece 1991-2001.
Population 1991
Population 2001
Popul. change 1991-2001 %
"Capital Region" * 3.072.922 3.179.882 3,5
Rest of Attica 450.485 576.725 28,0 Attica 3.523.407 3.756.607 6,6 Total Greece 10.252.580 10.939.605 6,7 1991 2001 Attica / Total Greece % 34,37 34,34
* Statistical territorial unit which includes the most of the Municipalities of the Basin of Athens Source of data: National Statistical Service of Greece. The data are processed by NTUA
Similarly, the share of the (extended) metropolitan region of Thessalonica to the total population of the country remains essentially unchanged. Centres with an important regional and local role remain comparatively weak. Only Patras, Iraklion and the twin pole "Volos–Larissa" have reached a population size of 130,000–240,000. The remaining administrative regional centres do not exceed 80,000 residents. Most prefectoral centres, i.e. the centres of the administrative division of nomos (prefecture), are even smaller: 40% of them have a population below 20,000. Their role as service centres of their countryside remains limited.
Two important remarks should be added: The role of the capital in the administrative system of the country was limited during this decade because of the administrative decentralisation and the improvement of the administrative capacity of the regional centres, which has been necessary in order to ensure (among other reasons) that these centres maintain the institutional capacity for the implementation of the CSFs. Nevertheless, the MRA (as well as that of Thessalonica) maintains its primal importance in RTD
9 See for details concerning the previous periods in: Angelidis 2004b and Angelidis et al
2001 and 1998.

ESPON 1.1.3 - Final Report Part 2 23
as well as in other sectors, which are most important for the national and regional development.
1.5.1.4 Conclusions / lessons from the Greek accession experience
We summarise here the conclusions of the Greek accession experience that could be useful as lessons for the recent (2004) and future accession countries. It is important to keep in mind that, as with the majority of the new member states, prior to its entry into the EC, Greece was: (a) a lagging behind country, with a large rural sector and a non-modernised industrial sector, (b) its infrastructures as well as its sectors which are crucial for the development (RTD etc) were under-developed, and (c) priority has been given by the TEN-T and the national authorities in the improvement of transport links favouring the capital city.
The integration of Greece into the EU (later in the EMU) accelerated its development rates and the modernisation of its economy and society. The disparities between Greece and the majority of EU countries have been limited. However, the convergence, both nominal and real (concerning the socio-economic structures) of the country to the EU average advanced less than was anticipated by the development programs.
The inter-regional disparities as for the per capita GDP were limited to a small degree. The disparities between the “overdeveloped” metropolitan regions of Athens and Thessalonica and the rest of the regions remain important as for the crucial parameters of the development capacity (RTD etc).
1. A large part of the SF and the Cohesion Funds were allocated for the improvement of infrastructure, mainly the transport infrastructure. Although several important transport projects were implemented in the peripheral regions of the country, the impact of the entire transport system improvement to the restructuring of the urban system was poor.
2. The share of the population of the Capital Region/MRA to the country population remains very high, essentially as it was before the integration of the country in the EU and the implementation of the Cohesion Policy. The most dynamic activities remain in Athens (and Thessalonica).
3. The peripheral centres profited by a limited deconcentration of productive activities. They mostly profited by changes in territorial governance, as a considerable reinforcement of the regional/ prefectoral/ local authorities

ESPON 1.1.3 - Final Report Part 2 24
was made in order that these last would have sufficient institutional capacity to implement the Community aid programs.
4. Finally, the peripheral urban systems have not been reinforced sufficiently. Therefore, the progress towards a more polycentric territorial system has been relatively small.
The most important conclusion that is relevant for the new member states and accession countries is that regional disparities in Greece after its accession in the EU remain very important and persistent (whether they “increased slightly” or they “remained unchanged”) despite the support given to the country by the EU Cohesion policy. The most glaring disparity between the capital region and the other regions of the country remains very obvious.
1.5.2 Portugal European Integration: What can new member states and accession countries expect?
Portugal joined the EU in 1986 with Spain and since then regional development in Europe has clearly been a critical issue. At the time of their accession, these two Iberian countries as well as Greece and Ireland were lagging behind European economic and social standards. Therefore, Structural Funds and the Cohesion Fund were powerful financial instruments to promote development in these countries and to achieve real and nominal convergence with Europe. Clearly, there were changes in economic, social and environmental domains, some very important and very positive, along with some drawbacks and failures. In the present section we briefly present and examine some of the changes in Portugal since European integration and discuss this in the light of the implications of enlargement for the new member states and accession countries.
1.5.2.1 Convergence/Divergence Trends
Since 1986 the Portuguese economy has apparently been in a cycle of convergence with European economy; however performance has not always been good. Economic growth in Portugal after EU integration has been very impressive, for instance GDP per capita was multiplied by 1.76 in real terms during the period 1985-2000. Profound institutional, economic and technological changes have been critical components of productivity growth

ESPON 1.1.3 - Final Report Part 2 25
(although not so impressive). Portugal has one of the lowest unemployment rates in the European Union (6.4% vs. 8% in the EU15 and 9% in the EU25 in 2003). Demography is a major problem in the country and if there was not a strong in-migration flow population would have declined in the period 1991-2001. Immigrants, the female population and older people have been essential to guarantee a high participation rate, which has been rather important to compensate for the productivity gap between Portugal and the rest of the European Union.
Economic growth relied largely on non-tradable goods and services and in the financial sector. Exports of goods and services decreased from 33% in 1986-91 to 30% in 1995-2000 of the total GDP in Portugal. Nevertheless, there was a strong increase of machinery and equipment, especially automobiles and components, in the export structure of Portugal. Moreover, the changing pattern of Portuguese international trade can be described by a concentration in the European Union, particularly as a result of Iberian economic integration.
The economic structure in Portugal has become ever more dependent on services employment, since agricultural and even manufacturing jobs have been decreasing since the 1980s. In the service sector, FIRE (finance, insurance and real estate), producer services and telecommunications are very dynamic activities.
We can identify four periods in the Portuguese economic convergence process within Europe:
• A period of real convergence with EU economy between 1986 and 1992, as a result of large inflows of inward investment in manufacturing, finance and real estate. Structural Funds available under the first Community Support Framework (CSF) (1989-1993) were mostly used for infrastructure modernisation and the exports dynamic stimulated by demand from the larger and more developed economies of the EU.
• Economic slowdown and halt of real convergence processes between 1992 and 1993 due to the economic recession in the most important European markets and the lack of public funding associated with the transition from the first CSF to the second CSF (1994-1999).

ESPON 1.1.3 - Final Report Part 2 26
0
20
40
60
80
100
120
140
1988 1990 1995 2000 2003
GD
P pe
r hea
d (P
PS),
EU-1
5=10
0
EL E IRL P Figure 1.5: Real Convergence in the Cohesion Countries, 1988-2003
Source: Eurostat
0
0,5
1
1,5
2
2,5
3
3,5
4
88-98 88-93 93-98 98-03
GD
P an
nual
gro
wth
rate
(%)
P UE-15 Figure 1.6: GDP Annual Growth in EU15 and Portugal, 1988-2003
Source: Eurostat and DG Regio
• Real convergence between 1994 and 1999 and nominal convergence until 1997 achieved by exports growth and control of imports, growth of productivity, decrease of inflation rate and interest rate, exchange rate stability and EMU and EURO membership.
• Deceleration of the real and nominal convergence after 2000 with divergent growth (ending a long period of catching-up) in a context of European enlargement to the East (these countries became more important inward investment locations). The public and private

ESPON 1.1.3 - Final Report Part 2 27
investment delays associated with the transition from the second CSF to the third CSF (2000-2006) also put the Portuguese economic convergence at risk. Recently, the Stability and Growth Pact have rendered public investment more difficult, especially with the growth of inflation, unemployment and the need to cut public expenditure.
1.5.2.2 The Impact of CSF II and III in Portugal (1994-99 and 2000-2006)
The Department of Prospective and Planning (DPP) estimates that the impact of CSF in 1994-1999 was a 0.4% average annual growth increase of GDP10. The overall impact on employment has been evaluated to around 2.1% for the period. The Structural Funds were essential to achieve real convergence with the EU (GDP per capita in PPS increased 7.6 points between 1993 and 1999 in relation to GDP per capita in the EU15).
The macroeconomic impact of the Structural Funds in the third programming period (2000-2006) was assessed in the mid-term evaluation by the DPP. The effects can be divided in three different periods: demand growth in 2000-2003; demand slowdown in 2004-2009 and growing supply effects (2010-2020). The relevance of infrastructure development in the (CSF) III is responsible for demand growth that is basically in non-tradable sectors.
Table 1.2: Impact of CSF III in GDP (prices 1995)
(Average percentage differences between values with and without CSF III)
2000-2003 2004-2009 2010-2020
Total Public Expenditure in CSF III 1.9 0.5 2.8
Structural Funds in CSF III 0.7 1.7 1.6
Source: DPP (2003) – Impacto do QCA III. DPP, Lisboa
These results clearly illustrate the limited role of CSF III in the process of growth convergence in the short-term, especially because the effects on production will be more relevant in the medium-term (2010-2020).
10 DPP (2001) – O Impacto Macroeconómico do Quadro Comunitário de Apoio (1994-1999).
DPP, Lisboa. www.dpp.pt

ESPON 1.1.3 - Final Report Part 2 28
Another interesting finding concerns the total employment and productivity impacts (see table 1.2). In the first period (2000-2003), there is an impact of total public expenditure in CSF III in both variables around 1.3% and 0.7%, respectively (0.8% and 0.5% Structural Funds impact). However, in the period 2004-2009, both variables increased at the same rate (0.3%) and finally in 2010-2020 the effects in job growth are stagnated but there is an important increase in productivity (2.7% induced by total public expenditure in CSF III and 1.7% by Structural Funds).
1.5.2.3 Regional Disparities in Portugal
Regional imbalances in Portugal are quite strong and in general can be described as a coastal/interior area divide. The coastal area is a narrow strip roughly between Lisbon and Porto which is highly urbanised with a dynamic productive fabric. The interior area of Portugal is more rural and cities are smaller. Besides this strong spatial imbalance, there is a certain contrast between the North and South of Portugal, due to physical and cultural factors. Nevertheless, the coastal area of Portugal is more developed than the interior.

ESPON 1.1.3 - Final Report Part 2 29
0
20
40
60
80
100
120
140
NORTE CENTRO LISBOA E VALEDO TEJO
ALENTEJO ALGARVE ACORES MADEIRA
NUTS II
PIB
pc
(P=1
00)
19951999
Figure 1.7: GDP per capita by region in Portugal, 1995-1999 Source: INE
The coastal/interior divide is a stable trend of regional performance, even if after European integration the country witnessed a period of slow convergence growth in the Portuguese regions. However, regional disparities increased in the 1995-99 period basically as a result of the very good performance of Lisboa e Vale do Tejo (LVT) and Madeira regions. The capital-city region has been clearly the most developed region of Portugal.
In fact, the more advanced competitive factors of this region and the concentration of public funding (including Structural Funds) in 1996-98 in projects like Lisbon International Exhibition (EXPO 98) and the new Vasco da Gama bridge may have been responsible for the better economic performance of Lisbon region. In the Madeira and Algarve regions productivity growth was higher than the Portuguese average, although GDP per capita growth was inferior to the Portuguese average in Algarve, precisely the opposite of Acores. Norte, Centro and Alentejo experienced divergent growth between 1995 and 1999 (see figure 1.7).

ESPON 1.1.3 - Final Report Part 2 30
0
20
40
60
80
100
120
140
NORTE CENTRO LISBOA E VALEDO TEJO
ALENTEJO ALGARVE ACORES MADEIRA
NUTS II
PIB
/Em
p (P
=100
)
19951999
Figure 1.8: GDP per person employed by region in Portugal, 1995-1999
Source: INE
Comparing the structure of gross value added in each region with the national structure in 1999, the Centro and especially Norte regions have a strong specialization in the manufacturing activities translating the relevance of several traditional clusters that are very dynamic in the international markets. Centro region is also specialized in education and health services. The structure of value added in Lisboa e Vale do Tejo is rather different from the national breakdown, namely because the role of specialisation in finance, business services and real estate. Alentejo is specialised in agriculture and extraction, in addition to some public services. The tourism development in Algarve explains the relevance of hotels and restaurants and real estate in the regional production of the region. The economy of Açores is very dependent on agriculture activities and public administration as well as transport. Although public administration and transport also generate an important share of regional production in Madeira, the service activities related with tourism specialisation are also strategic for economic growth.
Regional disparities are also quite dramatic at NUTS III level in Portugal, where the coastal and interior divide is much more visible. The coefficient of variation of GDP per capita changed from 0.293 to 0.305 between 1995 and 1999, which indicates a slight increase of regional disparities.

ESPON 1.1.3 - Final Report Part 2 31
Figure 1.9: GDP per capita, NUTS III, in Portugal, 2001
Source: INE
At NUTS3 level the regions with a better economic performance are in the coastal area, although some interior areas performed well in that period. Nevertheless, some of the spatial imbalances were so pronounced that public regional policy has been unable, to overcome such strong regional imbalance (see figure 1.9).
1.5.2.4 Conclusions
Some important findings about the Portugal EU integration that could be useful for the new member states and accession countries are drafted below:

ESPON 1.1.3 - Final Report Part 2 32
1. European integration stimulated economic growth and social well-being in Portugal at a national level. Although the regional imbalances (relative terms) were not reduce, all NUTS, levels 2 and 3, witnessed a significant improvement in social well being.
2. European markets and particularly the demands of more developed countries in the EU encouraged innovation and expansion in the manufacturing activities.
3. Structural Funds were extremely important to infrastructure modernization, namely to reduce time and cost distance to the centre of Europe and to improve inter and intra regional accessibility.
4. Apparently, economic cycles in the European economy have been more influential in the convergence growth than European funding.
5. The EMU, Euro and the Stability and Growth Pact have different impacts, and the public expenditure cuts have a strong influence in the growth of Portuguese economy.
6. The recent enlargement of European Union has rendered the catching-up process in Portugal more difficult and it seems that the specialization model of the Portuguese economy (based on intensive labour and low wages) is no longer viable in an enlarged Europe with other countries with even lower wages.
7. EU integration precipitated the decline of traditional sectors (like agriculture and fishing) along with other more capital intensive (shipbuilding, steelworks,) and knowledge (pharmaceuticals) industries and created new opportunities (such as automobiles, wine, tourism).
8. After more than ten years of public (national and Community) funding, the pattern of regional disparities did not change considerably in Portugal.

ESPON 1.1.3 - Final Report Part 2 I
PART 2 Results of the Project
Chapter 2

ESPON 1.1.3 - Final Report Part 2 II

ESPON 1.1.3 - Final Report Part 2 III
Table of Contents for Part 2 Chapter 2 2 Cohesion and Convergence in the Enlarged EU 33
2.1 Measuring “cohesion” through GDP as a variable 34
2.1.1 Snapshots of the European tissue - Visualizing economic and demographic distribution on the eve of accession 36
2.1.1.1 Changing contributions to total population 37
2.1.1.2 Changing contributions to total GDP in ESPON space 38
2.2 Convergence and divergence in Europe’s regional social-economic fabric 42
2.2.1 Introduction 42
2.2.2 Indicators of economic convergence 42
2.2.3 GDP per capita - regional level and growth 45
2.2.4 Convergence and divergence in GDP per capita 46
2.2.5 Conclusions and policy implications 47
2.3 Spatial cooperation and integration: Both convergence and divergence 51
2.3.1 Flows and transition processes 51
2.3.2 Factor Endowments and Factor Mobility 52
2.4 Accessibility 59
2.5 Neighbour-dependent growth: empirical evidence from enlargement countries in ESPON space 66
2.5.1 Neighbour-dependent growth in EU10, EU15 and EU27+2 67
2.5.2 Clusters of regions and spatial outliers 71
2.5.3 Key findings and implications of neighbour-dependent growth 77
2.6 Regional Specialisation 79
2.6.1 Taking up from the Third Interim Report 79
2.6.2 Methodology: The ‘P’, ‘S’, ‘C’ and ‘D’ regions 79
2.6.3 Results 82
2.6.4 Policy implications of regional specialisation 90
2.7 Financial system, exchange rate and polycentricity in the context of European enlargement 91
2.7.1 What are the spatial connections and barriers due to financial and monetary integration? 92

ESPON 1.1.3 - Final Report Part 2 IV
2.7.2 Highlighting the evolution of some financial and monetary variables 95
2.7.2.1 Financial system development 95
2.7.2.2 Level of inward foreign direct investments 96
2.7.2.3 Regional impact of exchange rate variations 98
2.7.3 What territorial challenges for the new member states? 99
2.8 Some characteristics of ESPON space macro border areas 101
2.9 The potential of border regions 106
2.9.1 Coming to a border typology for the enlargement area 107
2.9.2 Comments to geographical-physical and socio-economic border region typologies 117
2.9.3 Future research questions 118
2.9.4 Conclusions regarding border regions 119
2.10 Border region illustrations from the “ground” 121
2.10.1 Hungarian – Slovakian border region 121
2.10.2 Greek-Bulgaria border regions 125
2.10.2.1 Degree of economic disparities – economic interactions during the accession process 127
2.10.2.2 Conclusions/ Some recommendations for the improvement of the border regions typology 136
Figures
Figure 2.1. Net-migration rates in the Baltic States and Poland 57
Figure 2.2. Net-migration rates, East Central Europe 58
Figure 2.3. Net-migration rates, South East Europe 58
Figure 2.4 Multimodal accessibility 2001, all destinations (top left), only EU15 destinations (top right) and only new member states and Bulgaria and Romania (NMAC) as destinations (bottom). 62
Figure 2.5 Accessibility and GDP per capita 2001. 63
Figure. 2.6 Accessibility and GDP per capita in the new member states and Bulgaria and Romania, all destinations (top), only EU15 destinations (centre) and only new member states and Bulgaria and Romania as destinations (bottom). 65

ESPON 1.1.3 - Final Report Part 2 V
Figure 2.7 Spatial dependence in different neighbourhoods, population and GDP per capita change 1995-2000, EU27+2 68
Figure 2.8: Building the typology based on specialisation trends and NACE sectors 81
Figure 2.9: Building the typology based on specialisation trends and presence of MEGAs 81
Figure 2.10: Specialisation trends and the C, D, S, P regions 83
Figure 2.11: Diagrammatic chart of typology 2 in TIR (Herfindahl rate of change and GDP/h growth between 1995 and 2001) 83
Figure 2.12: Specialisation trends and sectoral growth in EU15 (1995-2001) 85
Figure 2.13: Specialisation trends and sectoral growth in EU12 (1995-2001) 85
Figure 2.14: presence of MEGAs in the ‘P’, ‘S’, ‘C’ and ‘D’ regions 87
Figure 2.15: Specialisation and presence of MEGAs in the EU15 87
Figure 2.16: Specialisation and presence of MEGAs in the EU12 (+NO –BG) 88
Figure 2.17: A conceptual framework to highlight the spatial impact of financial and monetary variables 94
Figure 2.18: Greece- Bulgaria Border Regions: administrative units (NUTS2, NUTS3), population of the Functional Urban Areas (FUAs) 2000. 127
Maps
Map 2.1: Redistribution of population 40
Map 2.2: Redistribution of GDP 41
Map 2.3: GDP per capita in PPS, 2000 (EU average = 100) 44
Map 2.4: GDP per capita in PPS, annual growth rate 1995-2000 (%) 48
Map 2.5: Spatial association of population growth 1995-2000, regions by type of univariate local Moran I 73
Map 2.6: Spatial association of GDP per capita growth 1995-2000, regions by type of bivariate local Moran I 74
Map 2.7: ESPON space land borders and border regions, 2005 102
Map 2.8: Population change 1995-2000 in ESPON space land border regions 105
Map 2.9: Geographical Type Borders 109

ESPON 1.1.3 - Final Report Part 2 VI
Map 2.10: Dimension of economic disparities 110
Map 2.11: Draft Typology # 1: border typology for integration potential 115
Map 2.12: Draft Typology # 2: border typology for integration potential 116
Tables
Table 2.1: Convergence within countries, 1995-2000 49
Table 2.2: Values and interpretations of Moran I index 67
Table 2.3: Spatial dependence of population and GDP per capita change, values of univariate and bivariate Moran I indices 70
Table 2.4: Types of regions and forms of local spatial association 72
Table 2.5: Regions by type of local spatial association in EU27+2, EU15 and EU10 75
Table 2.6: The most significant ‘hot spot’ -regions in EU10 77
Table 2.7: Inward FDI flows in candidate countries in 2001 97
Table 2.8: Relative change of GDP shares of macro border regions 1995-2000 104
Table 2.9: Dimensions and criteria 114
Table 2.10: Draft Typology # 1: border typology for integration potential – geographical-physical border typology 114
Table 2.11 Draft Typology # 2: border typology for integration potential – socio-economic border typology 116
Table 2.12 122
Table 2.13 122
Table 2.14: Population of the border regions 128
Table 2.15: Border regions: Regions codes, population by sex 129
Table 2.16: Surface and population density of the border regions 130
Table 2.17: GDP / head (PPS) of the border regions 131
Table 2.18: Employment rate of the border regions 131
Table 2.19: Employment by sector of the border regions 132

ESPON 1.1.3 - Final Report Part 2 33
2 Cohesion and Convergence in the Enlarged EU
At the heart of the debate on the effects of recent and future EU enlargement are the norms of economic and social cohesion. The importance accorded to cohesion derives from the belief that “solidarity and mutual support are an equally important basis for progress, not only for social reasons but also for optimising overall economic benefits since there is ample evidence of detrimental effects of inequality of growth” (CEC, 1996). In addition to economic and social cohesion a main goal in European Union cohesion policy is territorial cohesion, which is to help achieve a more balanced development by reducing existing disparities and avoiding territorial imbalances. Furthermore the aim of territorial cohesion is to improve territorial integration and encourage cooperation between regions (EC, 2004). The latter objectives are particular important in the context of eastern enlargement of the European Union. Internal market rules now also apply to the new ten member states, facilitating their integration with the EU15. The sudden takeover of market forces 15 years ago rapidly increased spatial disparities within most of the EU10 countries. Enlargement alongside with liberalisation of markets is likely to reinforce this process of increasing inequalities. Here cohesion policy has the task of counteracting these forces at different spatial levels. These commitments to territorial and social justice provide the rationale for the EU Structural Funds and the Cohesion Fund.
Cohesion is interpreted in different ways across the European territory and hence policy approaches and measurements vary accordingly. In general, if there is cohesion within a group, the various members fit together well and form a united whole. For some this means a level of stability in territorial and social relations while others associate a process of convergence in disparities between regions and social groups (DIW & EPRC, 2001). Cohesion is associated with a wide variety of policy choices. These include the objectives of equalising regional and social differences through redistribution of growth and employment (equity), but also policies oriented towards maximising the contribution of regions and social groups to national competitiveness (efficiency). Indicators for measuring cohesion fall into three groups: physical indicators associated with geographical or natural conditions; economic indicators such as GDP for measuring regional prosperity; and social indicators such as unemployment rates and quality of the labour force. EU analyses of regional disparities and EU structural and cohesion policies generally give primacy to two measures: GDP per capita and unemployment rates. Both are associated with methodological difficulties that limit their use, but alternatives are limited.

ESPON 1.1.3 - Final Report Part 2 34
For EU policy purposes, economic development (measured in terms of per capita GDP) largely determines access to the Structural Funds (most notably through Objective 1) and is a key consideration in EC competition policy reviews of regional aid maps. Also, EU regional policy and competition policy both use unemployment rates as an important measure of cohesion as well as employment trends (for the Structural Funds).
Conclusions about cohesion are sensitive to the time period and the spatial scale used for analysis. The NUTS classification used by Eurostat is associated with the latter problem since it is based on administrative boundaries and involves areas of greatly differing size, population and population density. Conclusions refer to the average person in each region, since indicators are calculated as if all inhabitants of a region are alike.
2.1 Measuring “Cohesion” through GDP as a Variable
Cohesion indicators are macroanalytical indicators combining the indicators of individual regions into one measure of their spatial concentration. Changes in the cohesion indicators between two points in time reveal whether certain developments have reduced or increased existing disparities in those indicators between the regions. Two dimensions are relevant if cohesion indicators are to be compared. The first dimension is the area considered. Within the EU, very often NUTS2 is the level that is analysed because of limited data availability at NUTS3 level. However, cohesion disparities at NUTS3 level may look quite different from the pattern at NUTS2 level.
The second dimension is the cohesion indicator used. It has been demonstrated that different cohesion indicators give different results (Bröcker et al., 2004). Some commonly used indicators even indicate convergence, while divergence has occurred according to another indicator. One important distinction is whether the indicator measures relative or absolute convergence or divergence – if, for instance, all regions gain in relative terms by the same percentage, the richer regions gain more in absolute terms.
As used in the SASI model transport Scenario (chapter 4), the following five types of cohesion indicators are calculated throughout this report to measure convergence or divergence of economic conditions in EU27+2 (see Box 2.1):

ESPON 1.1.3 - Final Report Part 2 35
Text Box 2.1 Types of cohesion indicators
(1) Coefficient of variation. The coefficient of variation is the standard deviation of region indicator values expressed in percent of their European average. The coefficient of variation informs about the degree of homogeneity or polarisation of a spatial distribution. A coefficient of variation of zero indicates that all areas have the same indicator values.
(2) Gini coefficient. Areas are sorted graphically by increasing indicator value and their cumulative distribution (the so-called Lorenz curve) is drawn against a cumulative equal distribution (an upward sloping straight line). The surface between the two cumulative distributions indicates the degree of polarisation of the distribution of indicator values. The Gini coefficient calculates the ratio between the area of that surface and the area of the triangle under the upward sloping line of the equal distribution. A Gini coefficient of zero indicates that the distribution is equal-valued, i.e. that all areas have the same indicator value. A Gini coefficient close to one indicates that the distribution of indicator values is highly polarised, i.e. few areas have very high indicator values and all other areas very low values. (3) Geometric/arithmetic mean. This indicator compares two methods of averaging among observations: geometric (multiplicative) and arithmetic (additive) averaging. If all observations are equal, the geometric and arithmetic means are identical, i.e. their ratio is one. If the observations are very heterogeneous, the geometric mean and hence the ratio between the geometric and the arithmetic mean go towards zero. (4) Correlation between relative change and level. This indicator examines the relationship between the percentage change of an indicator and its magnitude by calculating the correlation coefficient between them. If for instance the correlation between the changes in GDP per capita of the region and the levels of GDP per capita in the regions is positive, the more affluent regions gain more than the poorer regions and disparities in income are increased. If the correlation is negative, the poorer regions gain more than the rich regions and disparities decrease. (5) Correlation between absolute change and level. This indicator is constructed as the previous one except that absolute changes are considered. The distinction between relative and absolute change is relevant from an equity point of view. If, for instance, as a consequence of a transport project a rich and a poor region gained both ten percent in GDP per capita, cohesion indicators would indicate neither convergence nor divergence; however, in absolute terms the rich region would gain much more than the poor region. It is even possible that a region is a winner in relative terms but a loser in absolute terms.

ESPON 1.1.3 - Final Report Part 2 36
2.1.1 Snapshots of the European tissue - Visualizing economic and demographic distribution on the eve of accession
In the following section on spatial distribution we discuss the ESPON space from its function as a total entity in comparison to other markets. Hence we consider the ESPON space to represent the total production territory at internal and global markets. This approach focuses on the role of single regions within the total ESPON space and hence generates statements on change in regions’ position relative to the total of the ESPON space.
The 1990s have witnessed important shifts in the spatial center of gravity of both the economic and demographic structure across Europe. However, statistical observations of the total ESPON space for our purposes are only available for the years between 1995-2000; a period too short to allow for conclusions within a long-term economic cycle.
Tentatively, we distinguish a number of more or less clear spatial patterns in terms of population and wealth contribution that characterize the spatial tissue of the ESPON space:
• patches characterizing a number of neighbouring regions within a country or in border regions with strongly diverse directions in their contributions to the total in an enlarged EU
• carpets of increasing or decreasing contribution, indicating clusters of similar development and in some cases a harmonized polycentric development
• monoliths i. e. regions with European or national importance with increasing or decreasing contribution to the total, indicating a changing importance of a monocentric regional system.
These visual observations made already in our TIR, is complemented by means of a rigorous analysis of spatial association (see section 2.5).

ESPON 1.1.3 - Final Report Part 2 37
2.1.1.1. Changing contributions to total population
Map 2.1 shows the changes in the regional (NUTS3) contribution to total population in ESPON space during the last half of the 1990s. In conclusion, this visual examination of redistribution of population indicates that by understanding the ESPON as a market entity the following observations can be made:
• There has been an obvious westward shift in population shares along a dividing range from Trondheim in Norway to Valetta in Malta. The westward drift has some exceptions, in particular due to depopulation tendencies in the northwestern Iberian Peninsula, central France, parts
Text Box 2.2: Technical comment to maps 2.1 and 2.2
Data in maps 2.1 and 2.2 should not be paralleled with growth as the method is
biased for large regions. Small increases in large economies will result in large
changes in their overall share whereas large increases in small economies will result
in virtually no change in their respective shares. Regions with a large economy or
population that has grown only insignificantly (but more than the overall average),
will nonetheless be displayed as dark green on the map simply on account of their
large relative weight in the overall ESPON space economy or population. Similarly,
large regions with only a moderate decline will nonetheless inevitably be displayed in
the dark red category. On the other hand, regions with a very small economy or
population will – regardless of an extremely rapid growth – be displayed either in the
red categories or as only light green.
The example of the neighbouring regions the Åland Islands in Finland and Stockholm
in Sweden is illustrative. The small economy of Åland (26 000 inhabitants) has had a
very fast economic growth rate (37.6% between 1995 and 2000) but does only
account for a very small increase (lightest green) in the overall share of the ESPON
space GDP simply because it is so small. Stockholm, on the other hand, has had a
slower economic growth rate than Åland but simply because it is a big economy, the
change is depicted as dark green.

ESPON 1.1.3 - Final Report Part 2 38
of Scotland and Sardinia. Correspondingly the shift from Eastern Europe has several exceptions.
• In particular most capital regions display an increasing proportion of total ESPON space population.
• The three Baltic States suffer from significant population losses during the last decade.
• The contribution of the regions of Poland to the total EU29 population is diversified. Regions at the Baltic Sea coast gain in share while many inner/hinterland patches are losing significantly. Even the patches at the eastern and future external EU25 border.
• There are some big urban systems loosing their position to their surroundings, among them, Berlin, Warszawa, Posznan, Gdansk and Budapest.
• The urban system of the axial extension of the GIZ of EU15 - i.e. Czech Republic, Slovakia, Hungary and Slovenia largely form a carpet of relative loss in general.
• Romania and Bulgaria are almost entirely losing in population position being part of the southeastern declining carpet stretching up to Hungary.
• Malta and Cyprus clearly succeeded in gaining population weight during the latter half of the 1990s with Cyprus being in the group of regions heavily improving its position.
2.1.1.2 Changing contributions to total GDP in ESPON space
Map 2.2 shows the changes in regional (NUTS3) contribution to total GDP of the ESPON space between 1995 and 2000. The map primarily displays spatial patterns of changing contributions to “total” wealth in the enlarged Europe or total ESPON space respectively:
• The Baltic States enjoyed strong growth during the period in many regions and hence could improve their contribution to total ESPON GDP significantly. The success is based on growth in capital regions disfavouring other parts of the countries.
• Poland holds a different position among the countries of the enlargement area. In terms of wealth contribution to the total of the ESPON space it almost entirely comprises a carpet on the rise.

ESPON 1.1.3 - Final Report Part 2 39
• Czech Republic, Slovakia and Hungary play different roles in terms of economic contribution. While the Czech carpet faces dramatic losses in contribution except for the monolithic rise of Prague, this monocentric structure cannot be recognized in Slovakia and Hungary.
• Romania and Bulgaria entirely perform as an economic decreasing carpet in ESPON terms. The spot of Burgas, located at the Black Sea coast and being the only exception, managed to gain economic weight in the ESPON space.
• The Slovenian patch gains in wealth position almost across the country. Malta slightly gains whereas Cyprus faces a rather strong loss.

ESPON 1.1.3 - Final Report Part 2 40
Map 2.1: Redistribution of population

ESPON 1.1.3 - Final Report Part 2 41
Map 2.2: Redistribution of GDP

ESPON 1.1.3 - Final Report Part 2 42
2.2 Convergence and divergence in Europe’s regional social-economic fabric
2.2.1 Introduction
As put forward in chapter 1 of this Final Report, a fundamental debate within the theme of European enlargement is focused on issues of cohesion. In addition to section 2.1, in which cohesion is discussed from a static perspective, this section concentrates on cohesion from a more dynamic viewpoint. Based on gross domestic product per capita, economic discontinuities and barriers are identified at European and national levels. The basic question that is addressed in this section is to what extent the poorer regions within the EU25 are able to catch up with those that are already richer. The answer to this question depends to a large extent on the spatial scope that is addressed. Therefore, we not only analyse regional continuities and discontinuities within the EU25 as a whole, but also within the EU15 countries and the EU10 countries. In addition, we address the extent of convergence at the meso level, within the national economies of Europe.
2.2.2 Indicators of economic convergence
As basic underlying indicator of convergence, real GDP per capita is used. GDP per capita, corrected for national price differences through recalculation in purchasing power parities, is commonly used in convergence studies (Quah, 1996). To correct for outliers and to adapt the distribution towards a more normal distributed phenomenon, levels of GDP are transformed through a logarithmical function.
Convergence can be interpreted as the dynamic counterpart of the static concept of cohesion. There have been numerous attempts to provide a proper definition of convergence (Quah, 1996). Two concepts stand out in the empirical literature: ß-convergence and σ-convergence (Sala-i-Martin, 1996). The concept of ß-convergence results from a neo-classical growth framework. In particular, it refers to the coefficient ß in the following standard regression equation:

ESPON 1.1.3 - Final Report Part 2 43
10010 ,,, ln ttititti uYY −
∧
− ++= βα (1),
in which Ŷi,t0-t1 denotes the average yearly growth rate of GDP per capita in region i between the years t0 and t1, Yi,t0 is initial GDP in year t0 and and ui,t0-t1 represents specific shocks between times t0 and t1. A negative coefficient is an indication of convergence since it indicates a negative association between initial GDP scores and regional growth rates. In other words, a negative coefficient is an outcome of a general pattern in which relatively poor regions are catching up with their more prosperous equivalents.
When poorer regions not only catch up, but also outrun the former leading regions, convergence is not a necessary outcome. In order to control the analyses for this situation the concept of σ-convergence is applied. This is based on the standard deviation across regions of the logarithm of real GDP per capita. When the standard deviation declines over time σ-convergence applies. The concept’s focus is on dispersion in wealth between regions or nations across time. In sum, if a nation’s ß-convergence shows a negative, statistically significant value over time and the standard deviation of the regional scores in that nation declines in the time period under consideration, convergence applies.

ESPON 1.1.3 - Final Report Part 2 44
© Project 1.1.3 TNO 2004 500 km
GDP per capita (PPS) 2000(EU average = 100)
up to 2525 to 5050 to 7575 to 100100 to 125125 to 150150 to 175175 to 200200 and more
© EuroGeographics Association for the administrative boundaries
Origin of the data: EU-15 and CCs: EurostatNorway and Switzerland: NationalStatistical Offices
Source: ESPON Data Base
Ljubljana
Map 2.3: GDP per capita in PPS, 2000 (EU15 average = 100)

ESPON 1.1.3 - Final Report Part 2 45
2.2.3 GDP per Capita - Regional Level and Growth
Map 2.3 depicts an overview of GDP per capita in purchasing power standards (PPS) in 2000. Setting the EU15 average at 100, it is quite remarkable to see that most regions are below this level, even in the EU15 member states. Most GDP is earned in economic centres, generally located in metropolitan areas with relatively small surface areas. The map clearly shows the European economic core of what is indicated as the “Blue Banana” (RECLUS, 1989), the area from London, Benelux, South-Germany to North-Italy. In general, the New Member States are clearly behind the EU average. Note however that, apparently, border regions in Hungary, Czech Republic and Slovenia appear to benefit from the neighbourhood of successful EU15-regions (South-East Germany, Vienna, North-East Italy). Slovenia (especially the region around its capital Ljubljana) has the highest level of GDP of the New Member States. The metropolitan regions of Budapest, Prague and Warsaw are the only ones in the New Member States with a GDP per capita level higher than the EU average. Within the EU15 countries, the Mediterranean, especially the Southern part of Italy, Portugal and Greece, has the lowest level of GDP. Within this context however, Basque Country, Catalonia and the capitols of Lisbon, Madrid, Rome and Athens perform relatively well. Within Germany, we clearly see that the Eastern part of the country has not caught up yet with the rest of the country. Within the United Kingdom, peripheral regions such as the Northern part of Scotland and Northern Ireland experience relatively low levels of wealth.
It should be mentioned that differences between individual countries in terms of the number (population size) of regions identified as separate NUTS3 units could be a contributing factor in the results. The smaller the number of NUTS3 regions (like in Poland or Spain), the more uniform the interregional GDP pattern appears.
The GDP per capita development from 1995 to 2000 (see Map 2.4) reveals that many regions in the new member states have experienced relatively strong GDP growth. The strongest regional growth figures are experienced in Poland and Estonia. Strong growth is also experienced in the capital cities in the other Baltic States and regions in Hungary and Slovenia. The Czech Republic, with the exception of the Prague region, is not able to join in this positive development. Within the EU15, all regions in Ireland benefit from the fast growing economy in the country. Furthermore, regions in the Mediterranean countries also reveal a strong degree of catching up. Large parts of France, Germany, Sweden and the Northern part of the UK tend to stay behind. Outside the EU25, most regions in Bulgaria and Romania will be
ESPON 1.1.3 - Final Report Part 2 46
challenged to catch up with EU regions, particularly in Bulgaria, where some regions have even experienced a reduction of GDP per capita.
In sum, the economic core of Europe classically centers around the “Blue Banana” ranging from Ireland, Greater London, the Benelux countries and South-West Germany to the Alps and the Northern part of Italy. Outside the “Blue Banana” important economic hot spots can be distinguished around metropolitan areas, such as Paris, Stockholm and Barcelona. The Mediterranean countries have relatively low levels of GDP per capita, but the most remarkable lag exists between the EU15 member states and the new member states in the Eastern part of Europe. Many regions in the economic core of Europe have not shown high growth in GDP per capita over the years 1995 to 2000. This especially applies to regions in Switzerland and Germany. With a few exceptions, regions in the Mediterranean and the New Member States have performed well in terms of growth of GDP per capita. The most important exception was the Czech Republic.
2.2.4 Convergence and Divergence in GDP per capita
Maps 2.3 and 2.4 already give some hints on the question whether convergence or divergence is taking place over the EU25 regions. To access this question in a more precise way, table 2.1 summarizes the convergence coefficients discussed earlier. At the level of the EU25 countries there is a clear pattern of convergence measured in terms of GDP per capita. The negative ß-coefficient is statistically significant at a level of 5 percent, indicating a statistically significant negative relationship between level of GDP per capita in 1995 and growth of GDP per capita from 1995 to 2000. Since the standard deviation of regional GDP per capita has decreased over time, poorer regions are catching up, but have not outrun regions with higher levels of GDP per capita. In sum, the years between 1995 and 2000 have shown signs of growth of regional levels of GDP per capita for the EU25. This finding comes at no surprise given the patterns in Maps 2.3 and 2.4, which give an indication that especially the new member states, with initially relatively low levels of wealth, experienced relatively high growth in GDP per capita. The same holds for the EU15 regions. Here, regions in the Mediterranean have experienced strong development features. However, within the ten New Member States, there are no indications of convergence. The ß-coefficient is not statistically significant and σ has increased over time.
Also, within countries, convergence is rather an exception than general practice. Only in Greece and Italy does ß-convergence and σ-convergence

ESPON 1.1.3 - Final Report Part 2 47
clearly indicate a converging level of wealth across regions. Clear patterns of divergence within countries can be distinguished for Switzerland, Czech Republic, Hungary, Ireland, Latvia, Lithuania and Poland. So, out of the ten new member states, five countries show divergence within the nation. At a national level, catching-up of Eastern European countries tends to relate negatively to internal cohesion at national level.
2.2.5 Conclusions and policy implications
Convergence at the macro level appears to be a clear outcome of the enlargement of the European Union. The new member states have experienced positive economic effects from integration, even prior to their accession. Spain and Portugal also exhibited this trend from the 1980s and onwards and the Eastern European countries have been repeating this trend in recent years. However, effects are not evenly dispersed across the new member states and across regions of the New Member States. Investment opportunities tend to reveal themselves in agglomerations like Prague and Budapest.
Regional policies aimed at competitive strength and European-wide cohesion should focus on agglomeration advantages and disadvantages of these core regions within the new member states. Regional policies aimed at national cohesion within the new member states still need to focus on the social cohesion aspects of lagging regions. The choice between competitive strength and macro-level cohesion on the one hand, and national (or meso-level) cohesion on the other hand, is obviously of a political nature.

ESPON 1.1.3 - Final Report Part 2 48
© Project 1.1.3 TNO 2004 500 km
GDP per capita (PPS) annualgrowth rate 1995-2000 (%)
up to -1-1 to 00 to 11 to 33 to 55 to 77 and more
© EuroGeographics Association for the administrative boundaries
Origin of the data: EU-15 and CCs: EurostatNorway and Switzerland: NationalStatistical Offices
Source: ESPON Data Base
Ljubljana
Map 2.4: GDP per capita in PPS, annual growth rate 1995-2000 (%)
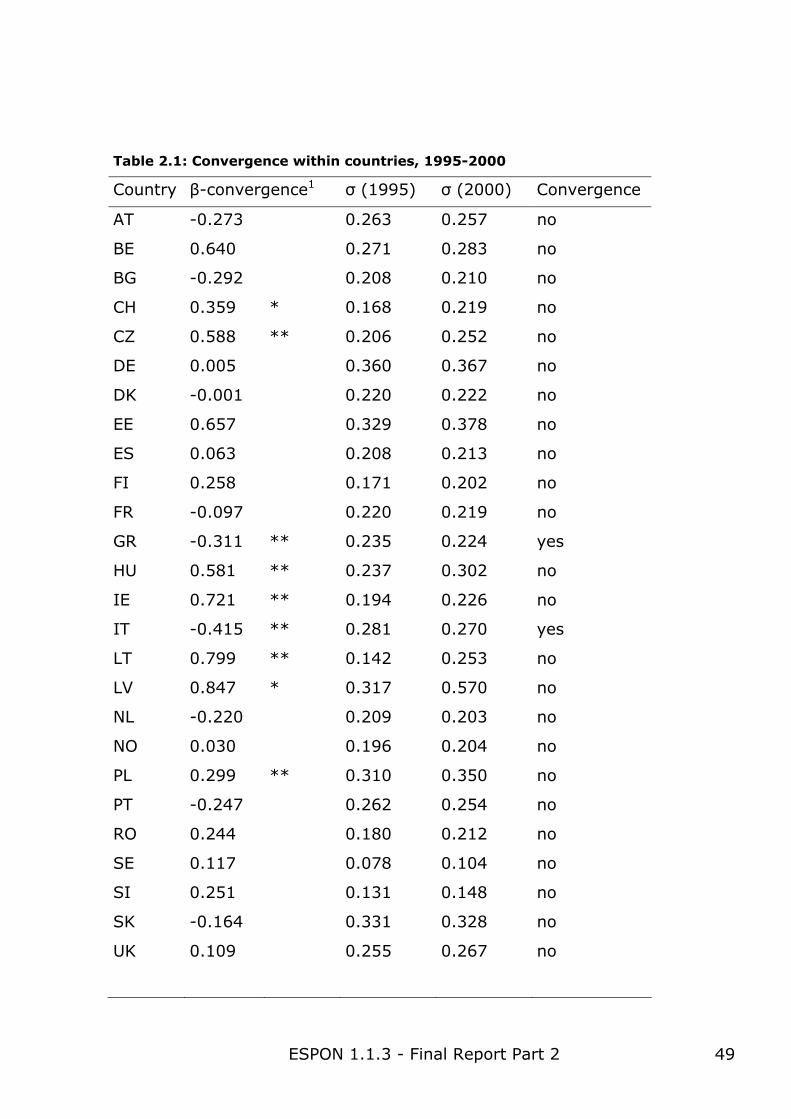
ESPON 1.1.3 - Final Report Part 2 49
Table 2.1: Convergence within countries, 1995-2000
Country β-convergence1 σ (1995) σ (2000) Convergence
AT -0.273 0.263 0.257 no
BE 0.640 0.271 0.283 no
BG -0.292 0.208 0.210 no
CH 0.359 * 0.168 0.219 no
CZ 0.588 ** 0.206 0.252 no
DE 0.005 0.360 0.367 no
DK -0.001 0.220 0.222 no
EE 0.657 0.329 0.378 no
ES 0.063 0.208 0.213 no
FI 0.258 0.171 0.202 no
FR -0.097 0.220 0.219 no
GR -0.311 ** 0.235 0.224 yes
HU 0.581 ** 0.237 0.302 no
IE 0.721 ** 0.194 0.226 no
IT -0.415 ** 0.281 0.270 yes
LT 0.799 ** 0.142 0.253 no
LV 0.847 * 0.317 0.570 no
NL -0.220 0.209 0.203 no
NO 0.030 0.196 0.204 no
PL 0.299 ** 0.310 0.350 no
PT -0.247 0.262 0.254 no
RO 0.244 0.180 0.212 no
SE 0.117 0.078 0.104 no
SI 0.251 0.131 0.148 no
SK -0.164 0.331 0.328 no
UK 0.109 0.255 0.267 no

ESPON 1.1.3 - Final Report Part 2 50
EU15 -0.129 ** 0.328 0.326 yes
EU10+ -0.090 0.388 0.396 no
EU25 -0.248 ** 0.421 0.409 yes 1The concept of ß-convergence refers to the coefficient ß in the linear regression equation that describes
the relationship between initial levels of GDP per capita and growth rates. As such, a statistically significant negative coefficient is an indication of convergence. The concept of σ-convergence relates to the standard deviation of regional levels of GDP per capita at the beginning and the end of the timeframe under consideration (1995 and 2000). When the standard deviation decreases over time σ-convergence applies. When both ß-convergence and σ-convergence apply, regional economic trends are designated as convergence in the right column of the table.
2 * (**) indicates significance at the 10% (5%) confidence level;
3 including Luxemburg; results without are nearly the same; 4 including Cyprus and Malta; results without are nearly the same; 5 including Cyprus, Luxemburg and Malta; results without are nearly the same.
ESPON 1.1.3 - Final Report Part 2 51
2.3 Spatial cooperation and integration: both convergence and divergence
By using indicators of convergence and divergence it is possible to assess continuities and discontinuities in transition processes at various levels, as shown in the preceding section. According to neo-classical economic theory convergence is an indication of integration and more efficient resource allocation. Yet divergence between regions may also be an indicator of increased integration – when the ‘backwash effect’ is larger than the ‘spread effect’ (see e.g. Myrdal, 1957)1.
By analysing cross-border mobility of different types it is also possible to find alternative or complementary indicators of both integration and barriers. Increased mobility – e.g. labour force or residential migration – is generally a sign of increased integration, especially if it is not a one-way process. Increased symmetric migration patterns in combination with convergence in income and wealth provide indications of a well-functioning integration process without abrupt discontinuities. Increased one-way migration in combination with divergence in incomes is instead a sign of an integrative process that is likely to result in spatial polarisation.
Decreased one-way migration in combination with convergence in incomes may be an indication of increased cross-border barriers but it can also be an effect of the integrative process. Asymmetric migration patterns are often a consequence of differences in incomes and job opportunities. Convergence in income and wealth hampers the push and pull factors and in turn, one-way migration.
2.3.1 Flows and transition Processes
Increased economic, social and political integration will result in an expanding trade between the countries in the enlarged EU. With regard to the economies in the EU15, Germany is generally the most important trading partner with regard to the new EU-members. There is, however, a long way to go before we can talk about an integrated enlarged EU according to the
1 Myrdal, G (1957), Economic Theory and Underdeveloped Regions, Macmillan: London.
ESPON 1.1.3 - Final Report Part 2 52
trading patterns as well as mobility patterns, at least concerning labour mobility.
At first sight, we can suppose that the trade between the Western and Eastern parts of Europe will show the pattern of the theory of comparative advantages. The problem in this case, however, is that data about factor endowments are in many ways incomplete. Instead, to get a hint of differing countries’ factor endowments, we are obliged to use some form of ad hoc explanation. The theory of “revealed comparative advantages”, which is more a method than a theory, follows a deduction like this: If there is some power in the theory of comparative advantages, the countries which export capital-intensive products have a lot of capital compared to the importing country and vice versa (Belassa, 1965; for the East-West trade, see e.g. Neven & Röller, 1991).2 The same reasoning is, of course, true with regard to the other factors, including technology and human capital.
Free trade has thus resulted in an adjustment process among labour-intensive branches and also in the regions where these branches are over-represented. There are, however, still branches and regions where an increased trade within an enlarged EU will have negative effects. Some products and branches, which are labour-intensive but not entirely dependent of low wages, will probably be affected by an increased import. This will of course also have regional implications, especially with regard to regions that will experience a more intensive competition from the New Member States. The result will be that at least the industrial expansion in these districts will slow-down or even result in retardation.
2.3.2 Factor Endowments and Factor Mobility
Implications for Capital Mobility
Different regions have differently composed capital and labour markets, which implies that development possibilities are not equal regarding choices of technology available for adoption. Since there exists a mutual dependence 2 Belassa B (1965), ”Trade Liberation and ”Revealed” Comparative Advantage”. Manchester School of Economic and Social Studies, May 1965; Neven D J & Röller L-H (1991), ”The Structure and Determinants of East-West Trade:_A Preliminary Analysis of the Manufacturing Sector” in Winter, L A & Venables A J (eds), European Integration: Trade and Industry. Cambridge University Press.

ESPON 1.1.3 - Final Report Part 2 53
between the competence of the labour force and the introduction of new technology, a lack of competence is a restriction to innovative activities and technology renewal. This relationship applies especially in old industrial regions or rural areas characterised by economic backwardness.
Even if capital moves to labour, this type of investment pattern is not automatically post-industrial. Instead, it is a defensive investment pattern, which to a great extent characterises the early phases of the industrial society in some regions at the same time as it is a sign of the development of a post-industrial investment pattern in other regions - in regions where these types of investments are beginning to be history and standardised cheap labour is no longer a competitive advantage. Such technology may be socially desirable, but the risk exists that regional segmentation and polarisation are reinforced leading to knowledge-based production in the centre and standardised production in the periphery. This polarisation will thus be accentuated by a post-industrial investment pattern where highly educated labour will increasingly be a location factor for mobile capital in the knowledge-based sectors.
On the other side, this investment pattern will stimulate growth of the purchasing power in these countries with an expansion of the home market of both consumer and capital goods. Besides exporting cheap industrial goods these countries and regions are turning into a large market themselves.
To summarise, the composition of the labour force affects the industrial and post-industrial location patterns in an enlarged EU. Post-industrial activities like knowledge-based industries are most frequent in regions with a high share of highly educated labour. Traditional labour-intensive industrial activities are concentrated in areas with low labour costs and a surplus of low educated labour. These differences in factor endowments and labour markets may accentuate both regional segmentation and polarisation, at least in the short term.
On the other hand, the result according to the relation is an increase in both employment and purchasing power in the destination countries. This will serve to promote their economic development, despite increasing specialisation in a labour-intensive direction and even result in economic renewal and transformation if labour begins to become scarce even in these countries. There are signs that the new EU-members will experience a process of labour shortage and ageing in the future (see ESPON 1.1.4). This will also be accentuated if emigration continues to grow.

ESPON 1.1.3 - Final Report Part 2 54
Implications for Labour Mobility
While the barriers with regard to capital mobility are eroded very quickly, there are still very obvious barriers with regard to labour mobility. No common labour market exists within the enlarged EU today and there is still a long way to go before this point is reached. This implies thus that the following reasoning on labour mobility will be very hypothetical.
According to traditional push-pull theories, economic disparities should, in a free labour market, give rise to high migration from some of the new member states and accession countries to Western Europe and the Nordic countries. This implies that labour surplus and low wages in the transition economies will be the determinant factors behind the migration decisions, but even the higher wages in EU15 will give some hopes about the future, which will further stimulate the labour mobility process.
However, according to segmented labour market theories (SLM), those workers, especially blue-collars, who are released in the continued structural transformation of the new EU-countries’ economies will be in demand in neither the private nor the public sectors in Western Europe. It seems that even if a supply of mobile labour should appear in the new EU-countries, the EU15 demand for this kind of labour seems quite limited. This does not, however, imply that no migration from the new EU-members to Western Europe will occur, it only says that such a migration will not be in reply to a demand for the type of labour that the countries can offer. For skilled craftsmen and highly educated labour from the new EU-countries the situation is of course quite different. The problem will in this case be that the new EU-members will be drained of competence and territorial cohesion eroded both within the EU and the different countries.
The economic transformation in the new member states and accession countries not only has implications on the international migration; internal migration will also be affected. If the unemployment increases and the regional unemployment levels and living standard diverge, the internal migration pattern will be changed in a way more alike the migration pattern in development countries. This has already resulted in an out-migration from rural areas to larger towns and metro areas, where the labour market is more diversified. From a human capital approach this is rational even if there are no jobs directly in the destination areas. The more diversified labour market in these areas will give the migrants a better chance to find one compared to staying home. There are also signs of a monocentric development in the Eastern, and even Northern European, periphery (ESPON 1.1.4).

ESPON 1.1.3 - Final Report Part 2 55
Future Mass Migration?
After the collapse of the Soviet Block, many words of fear were heard about a future mass migration from East to West. The large gaps in wages and living standard, the dreams of a new life in the Western World were factors which all gave rise to fears about a mass migration from the former Soviet Bloc to the Western countries. These economic motives were then reinforced by geopolitical factors such as wars and ethnic conflicts – factors that seem to be of much more importance than differences in living standard. It is also much more difficult to stop migratory movements among refugees than it is with respect to migratory movements caused by economic factors. Free migratory movements have neither been a fact in the enlarged EU.
There are thus still several formal obstacles towards to a free common labour market, which of course are hampering factors with regard to the East-West migration. This fact implies that there still is an enormous potential emigration pressure in the candidate countries, which will be released when the borders in the future will be totally opened. This reasoning is in line with the neo-classical push-pull approach with its focus on economic motives and equilibrium. The SLM-approach also pays regard to economic motives but from another point of view; instead of a development towards equilibrium this approach focuses on a development towards disequilibrium. This disequilibrium exists together with a situation where migration has slowed down despite the large differences in wages and living standards.
A future common labour market within an enlarged EU will, of course, stimulate labour mobility as one important obstacle for free migratory movements has disappeared. The effects on one-way migration as a consequence of open borders will, however, diminish if the gap in living conditions will be smaller. Much of the fear for a mass migration can thus be cured by a continued positive economic development in the new member states and accession countries. The latter development will, however, stimulate migration in another way. The catching-up process will stimulate migration and labour mobility in both directions as a consequence of increased similarities in economic structure in EU15 and EU12. This has nothing to do with mass migration - instead it is a natural ingredient in economic development. Unfortunately, even if there are signs of an increased return migration to some of the new EU member states, a situation of two-way migration is far away. Here, a polycentric development will be of utmost importance to stimulate symmetric relations and two-way migratory flows with an enlarged EU.

ESPON 1.1.3 - Final Report Part 2 56
The biggest problem concerning analyses of international migration is shortage of data with respect to origin and destination and the absence of flow data. Instead net-migration data must be used as indications of the migratory movements at least concerning push and pull factors. As can be seen in the figures below (Figure 2.1-2.2-2.3) the net migratory movements in the new and potential EU members from Eastern Europe (with the exception of Slovenia) during the second half of the last century did not show any consistent curves. Instead, it is the differences both with regard to the countries and the periods that are most conspicuous. The Baltic States had in-migration up to the beginning of the 1990s when an emigration wave started that was especially strong in the first part of the 1990s. This wave, however, was not primary oriented towards the West – instead it was Russian inhabitants that returned home after Baltic independence. Poland has experienced an emigration surplus during entire the period, even if the relative size seems to be small.
In East Central Europe the curves are more irregular but on a relatively low level. It must be kept in mind that migratory movements between states in the former Soviet Bloc and Western Europe was low at that time and in many cases consisted of refugees. The same is valid with regard to net-migration in Bulgaria and Romania. Both countries have had emigration surplus during the whole period but it was – as in the case with the Baltic States – accentuated during the first part of the 1990s. Slovenia, on the other hand, exhibits a completely different picture; emigration up to the 1970s, as this was during the large labour immigration to Western Europe. After 1970 there was a change in the flows and Slovenia became an immigration country, which it has been since then. It shall also be kept in mind that Slovenia was not involved in the Balkan war as the other former Yugoslavian countries. Instead it experienced the most well-being of these countries, a phenomenon that ought to be even more accentuated during the 1990s. As data are shaky it is difficult to estimate from which countries the immigrants came. Many of them were probably return migrants that went back home after the collapse of the former Yugoslavia.
From the figure below it is obvious that the fear of mass migration has been more a myth than a reality. This, however, does not mean that migratory flows will not increase in the future when the various national transition rules have disappeared. The outcome of this is greatly dependent on the economic and social development within the enlarged EU, as well as within the various countries. A development towards economic convergence will result in more symmetrical flows while a development towards divergence will result in asymmetrical flows. In the first case, macro-level territorial

ESPON 1.1.3 - Final Report Part 2 57
cohesion will be strengthened while the opposite will be the result in the second case.
Net-migration rate, the Baltic States and Poland
-20,00
-15,00
-10,00
-5,00
0,00
5,00
10,00
1950-1955
1955-1960
1960-1965
1965-1970
1970-1975
1975-1980
1980-1985
1985-1990
1990-1995
1995-2000
Years
Per t
hous
and Estonia
LatviaLithuaniaPoland
Figure 2.1. Net-migration rates in the Baltic States and Poland

ESPON 1.1.3 - Final Report Part 2 58
Net-migration rate, East Central Europe
-5,00
-4,00
-3,00
-2,00
-1,00
0,00
1,00
2,00
3,00
1950-1955
1955-1960
1960-1965
1965-1970
1970-1975
1975-1980
1980-1985
1985-1990
1990-1995
1995-2000
Years
Per t
hous
and
Czech Republic
Hungary
Slovakia
Figure 2.2. Net-migration rates, East Central Europe
Net-migration rate, South East Europe
-8,00
-6,00
-4,00
-2,00
0,00
2,00
4,00
6,00
1950-1955
1955-1960
1960-1965
1965-1970
1970-1975
1975-1980
1980-1985
1985-1990
1990-1995
1995-2000
Years
Per t
hous
and
BulgariaRomaniaSlovenia
Figure 2.3. Net-migration rates, South East Europe

ESPON 1.1.3 - Final Report Part 2 59
2.4 Accessibility
Accessibility is the main 'product' of a transport system. It determines the locational advantage of an area (i.e. in ESPON a region, a city or a corridor) relative to all areas including itself. Indicators of accessibility measure the benefits households and firms in an area derive from the existence and use of the transport infrastructure relevant for their area.
The important role of transport infrastructure for spatial development in its most simplified form implies that areas with better access to the locations of input materials and markets will, ceteris paribus, be more productive, more competitive and hence more successful than more remote and isolated areas. However, the impact of transport infrastructure on spatial development has been difficult to verify empirically.
This section addresses first different accessibility patterns in Europe with a special focus on the new member states and the two accession countries of Bulgaria and Romania. Then regional accessibility is related to regional economic performance.
European accessibility
Accessibility is one of the indicators calculated in ESPON 1.2.1 for NUTS3 regions to express the combined effect of geographical position and locational advantage provided by the transport system (ESPON 1.2.1, 2004). For this analysis multimodal potential accessibility is selected and further developed.
Potential accessibility is based on the assumption that the attraction of a destination increases with size and declines with distance or travel time or cost. Therefore both size and distance of destinations are taken into account. In the ESPON 1.1.3 application the size of the destination is represented by population, the distance between regions is measured in terms of travel time. For the impedance function a negative exponential function is used in which nearby destinations are given greater weight than remote ones. Multimodal accessibility is calculated through aggregation of road, rail and air travel time between regions (Schürmann et al., 1997; Wegener et al., 2001).
Figure 2.4 shows three accessibility maps for NUTS3 regions in the new member states and accession countries and adjacent areas (maps of all

ESPON 1.1.3 - Final Report Part 2 60
European regions are presented in Annex A8). The accessibility presented is multimodal accessibility representing the combined effect of the road, rail and air networks. The three maps differ in the destinations taken into account. In the first map taken from ESPON 1.2.1 (ESPON 1.2.1, 2004) all European regions are considered as destinations. In the two other maps, the destinations are restricted to the fifteen old member states of the European Union and to the new member states and accession countries, respectively. These restrictions can be interpreted as representing accessibility to selected market areas. In each map accessibility is standardised to the average potential accessibility of all NUTS3 regions in the ESPON space. In all cases population is used as destination activity.
The emerging picture of Europe in the top-left map is familiar. It shows the concentration of high-accessibility regions in north-western Europe reaching from the South of England over the Benelux countries and the Rhein-Ruhr area along the Rhine valley to Switzerland and northern Italy (the “Blue Banana”), with another peak in the Paris region. It can be seen that most regions of the new member states and the accession countries belong to the European periphery through the combined effect of their remote geographical location and their underdeveloped transport system. This is particularly evident in the Baltic States and in Bulgaria and Romania. However, the capital regions of Poland, the Czech Republic and Hungary have above-average accessibility because of their integration into the international air network.
The contrast in accessibility between the old member states and the new member states and accession countries becomes even more obvious if two experimental contrafactual accessibility maps are drawn: The top-right map of Figure 2.4 shows the same potential accessibility indicator if only destinations in EU countries are considered. Now it becomes obvious that the regions in the new member states and accession countries are disadvantaged even in comparison with peripheral regions in the old member states, such as Greece, southern Italy, Portugal and rural Spain, Ireland, Scotland and the Nordic countries. The map yields strong evidence that these regions will continue to have difficulties in penetrating west-European markets. The only exception is Prague and its hinterland which have above-average accessibility to the old member states.
The bottom map of Figure 2.4, in contrast, shows the same accessibility indicator if only destinations in the new member states and accession

ESPON 1.1.3 - Final Report Part 2 61
countries are considered. Now the asymmetry in the relationship between the old and new member states becomes obvious. Whereas in the previous map accessibility of the new member states and accession countries was severely reduced, in this map the central areas of the new member states with Poland, the Czech Republic, Slovakia and Hungary have the highest accessibility. Peaks are also visible in Bulgaria and Romania.

ESPON 1.1.3 - Final Report Part 2 62
Figure 2.4 Multimodal accessibility 2001, all destinations (top left), only EU15 destinations (top right) and only new member states and Bulgaria and Romania as destinations (bottom).

ESPON 1.1.3 - Final Report Part 2 63
On the other hand, the Baltic States and Slovenia have accessibility values only slightly above or even below the European average. From the old member states, from border regions to the new member states and from many airport regions, the new member states are more accessible than from many new member states themselves, i.e. the markets of the new member states can be easily approached from them.
Accessibility and economic performance
Are regions with higher accessibility really more successful than other regions? There seems to be a clear positive correlation between transport infrastructure endowment or the location in interregional networks and the levels of economic indicators such as GDP per capita. However, this correlation may merely reflect historical agglomeration processes rather than causal relationships effective today. Figure 2.5 shows for the NUTS3 regions of the ESPON space the relationship between multimodal accessibility and regional economic performance expressed as GDP per capita.
Figure 2.5 Accessibility and GDP per capita 2001.

ESPON 1.1.3 - Final Report Part 2 64
Figure 2.5 seems to support the hypothesis that more accessible regions are economically more successful. Regions in the lower left corner of the diagram have both low accessibility and low GDP per capita. The new member states and the two accession countries Bulgaria and Romania stand out in that they have extremely low GDP per capita. The majority of the regions of southern Europe are also in this category.
Regions in the upper right corner of the diagram are very accessible and have a high GDP per capita. These regions are mainly located in the core of the old member states. However, regions from these countries appear also in all other parts of the diagram. Regions from the Nordic countries are very special: nearly all of them have below-average accessibility, but their economy is not seriously affected by this disadvantage which can be seen by their high GDP per capita.
Figure 2.6 gives more insight in this relationship for the regions of new member states and accession countries. The upper diagram is a zoom-in of Figure 2.5 It becomes apparent that regions with high GDP per capita all have high accessibility to total Europe. However, high accessibility does not guarantee economic performance, as several regions demonstrate. The lower two diagrams relate the destination-restricted accessibility of Figure 2.4 to GDP per capita. The second diagram with accessibility restricted to destinations in the old member states makes it even clearer than the top diagram that access to the 'old' EU is essential for economic performance. The third diagram with accessibility restricted to destinations in the new member states and accession countries supports this view but is less clear. A notable exception is Slovenia: regions from Slovenia have only poor access to the other new member states and Bulgaria and Romania, but the Slovenian economy belongs to the most successful of the new member states, i.e. it seems not to depend much on the links to the rest of the enlargement area.
The conclusion is that through the EU enlargement process the relationship between transport infrastructure and regional economic development has become more complex than ever. There are successful regions in the old member states in the European core confirming the theoretical expectation that location matters. However, there are also centrally located regions in the old member states suffering from industrial decline and high unemployment. On the other side of the spectrum the poorest regions, as theory would predict, are in the new member states and accession countries at the periphery, but there are prosperous peripheral regions in the old member states such as the Nordic countries. To make things even more difficult, some of the economically fastest growing regions are peripheral regions in the new member states.

ESPON 1.1.3 - Final Report Part 2 65
Figure. 2.6 Accessibility and GDP per capita in the new member states and Bulgaria and Romania, all destinations (top), only EU15 destinations (centre) and only new member states and Bulgaria and Romania as destinations (bottom).
ESPON 1.1.3 - Final Report Part 2 66
In the context of ESPON 1.1.3 the issue is how much the reduction of barriers such as border waiting times or customs at the former EU borders or political, cultural or social barriers between regions and countries after the enlargement of the European Union will benefit the new member states.
To analyse these issues in more detail, accessibility will be an important component of Scenario Study II. In Scenario Study II accessibility will be the key variable used in the SASI regional economic model to forecast the spatial impacts of the EU enlargement with particular emphasis on the role of the TEN and TINA network improvements (see Section 4.2).
2.5 Neighbour-dependent growth: empirical evidence from enlargement countries in ESPON space
It is part of the established wisdom in spatial studies that regions with similar development patterns, either positive or negative, tend to locate close to each other (Fujita et.al 1999; Rey & Montouri 1999). In an integrated Europe, and especially as a consequence of the EU’s eastward enlargement, this kind of spatial dependence can be expected to strengthen. Regions become ever more closely connected due to the constantly increasing mobility of goods and production factors, as well as through intensifying interregional cooperation among public and private actors, businesses and institutions. In the EU cohesion policy context, this raises a growing need for analysing the spatial aspects of regional growth, as well as for incorporating the implications of the results into policy recommendations.
This exercise aims at measuring whether, and to what extent, geographical proximity matters in regional development in ESPON space. Does a region benefit – or suffer – from having prosperous regions as its neighbours, or are the spatial patterns of growth in European regions random, without any systematic spatial dependence and clustering? The analysis is supplemented by a presentation of the local types of spatial association, which are depicted by identifying the outliers in the observed general pattern. The focus is on the EU’s enlargement area and the comparisons are made between NUTS3 regions in EU10, EU15 and EU27+2.

ESPON 1.1.3 - Final Report Part 2 67
2.5.1 Neighbour-dependent growth in EU10, EU15 and EU27+2
A number of visual techniques, indicators or indices have been proposed to identify and measure spatial aspects of regional disparities. This analysis is based on one of the most widely used indices of spatial association, the Moran I spatial autocorrelation statistic, which is given by:
where zi is the normalised attribute value of the region i, n is the number of regions, and Wij is the spatial weight matrix, where each element wij represents the nearness between regions i and j.
In general terms, Moran I measures the similarity of attribute values in an area, the degree to which a spatial phenomenon is correlated to itself in space. The mean value of Moran's I is -1/(n-1) which approaches 0 for a large number of regions. Values of I are in the range from approximately -1 to 1 (see Table 2.2). Positive values imply positive spatial autocorrelation, a tendency towards clustering of similar values. The converse is true for negative values indicating that dissimilar values tend to appear in a close association.
Table 2.2: Values and interpretations of Moran I index
-1 0 +1
Negative spatial autocorrelation
Spatial clustering of dissimilar values
Positive spatial autocorrelation
Spatial clusering of similar values
The dataset of this analysis is from the ESPON database and it consists of the following two variables, measured at NUTS3 level in EU27+2:
∑
∑∑
∑∑=
= =
= =
= n
ii
ji
n
i
n
jij
n
i
n
jij z
zzW
W
nI
1
2
1 1
1 1
.
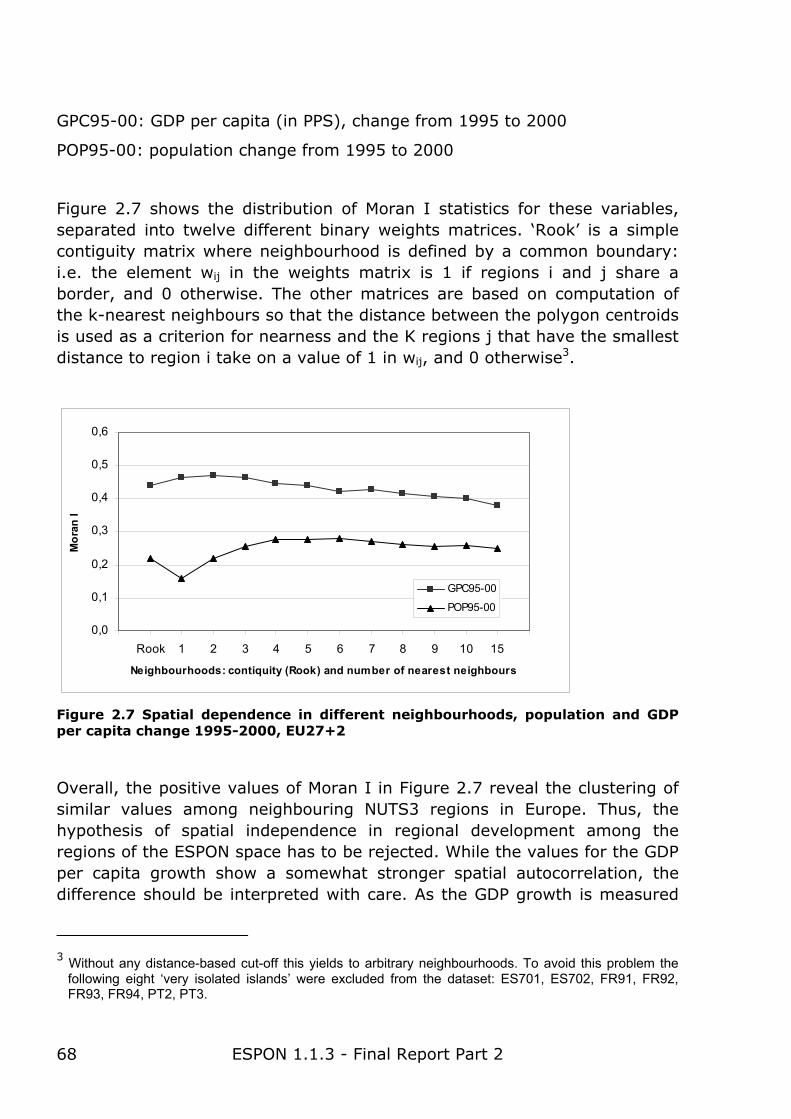
ESPON 1.1.3 - Final Report Part 2 68
GPC95-00: GDP per capita (in PPS), change from 1995 to 2000
POP95-00: population change from 1995 to 2000
Figure 2.7 shows the distribution of Moran I statistics for these variables, separated into twelve different binary weights matrices. ‘Rook’ is a simple contiguity matrix where neighbourhood is defined by a common boundary: i.e. the element wij in the weights matrix is 1 if regions i and j share a border, and 0 otherwise. The other matrices are based on computation of the k-nearest neighbours so that the distance between the polygon centroids is used as a criterion for nearness and the K regions j that have the smallest distance to region i take on a value of 1 in wij, and 0 otherwise3.
0,0
0,1
0,2
0,3
0,4
0,5
0,6
Rook 1 2 3 4 5 6 7 8 9 10 15
Neighbourhoods: contiquity (Rook) and number of nearest neighbours
Mor
an I
GPC95-00
POP95-00
Figure 2.7 Spatial dependence in different neighbourhoods, population and GDP per capita change 1995-2000, EU27+2
Overall, the positive values of Moran I in Figure 2.7 reveal the clustering of similar values among neighbouring NUTS3 regions in Europe. Thus, the hypothesis of spatial independence in regional development among the regions of the ESPON space has to be rejected. While the values for the GDP per capita growth show a somewhat stronger spatial autocorrelation, the difference should be interpreted with care. As the GDP growth is measured
3 Without any distance-based cut-off this yields to arbitrary neighbourhoods. To avoid this problem the
following eight ‘very isolated islands’ were excluded from the dataset: ES701, ES702, FR91, FR92, FR93, FR94, PT2, PT3.

ESPON 1.1.3 - Final Report Part 2 69
in nominal terms, variations in national inflation rates have an impact on results. In the case of Moran I, the size and sign of this effect is more or less unpredictable and case-specific. For example, it depends on the properties of the weights matrix and how the differences in inflation rates are spatially distributed over the relevant territorial space.
Figure 2.7 also shows a very consistent pattern in the distributions with regard to different specifications of the weights matrix. As the number of neighbours is increased, an initial increase in the value of Moran I is followed by only a slight decrease in the value of spatial autocorrelation. While the results are fairly robust with respect to an increase in distance band k, the highest values are measured in the range of small to moderate k-values. Due to a stochastic element associated with a very small number of neighbours, a weights matrix of five nearest neighbours is used as the spatial regime of the neighbourhood effect in the following comparison of the enlargement area in ESPON space (see, Table 2.2). The univariate measure of Moran I describes the situation in which a percentage change of a region is compared to a corresponding change in its neighbourhood. In the case of bivariate measure, in turn, the change of a variable in a region is related to the 1995 level of that variable at the neighbouring locations. This bivariate measure of spatial autocorrelation highlights the space-time correlation, i.e. how strong is the spatial clustering effect in time so that regions with low-level neighbours tend to grow at a slow rate, and vice versa.

ESPON 1.1.3 - Final Report Part 2 70
Table 2.3: Spatial dependence of population and GDP per capita change, values of
univariate and bivariate Moran I indices
POP95-00 GPC95-00
Univariate Bivariate Univariate Bivariate
EU27+2 0,28 0,07 0,44 -0,04
EU15 0,20 0,12 0,32 -0,11
EU10 0,31 0,15 0,30 -0,08
EU27+2Border 0,43 0,03 0,41 0,06
EU27+2NonBorder 0,22 0,08 0,45 -0,10
EU15 Border 0,32 0,13 0,26 -0,10
EU15 NonBorder 0,22 0,12 0,45 -0,12
EU10 Border 0,31 0,12 0,27 -0,02
EU10 NonBorder 0,26 0,10 0,21 0,12
A notable feature in Table 2.3 is that there are significant differences in the values of spatial autocorrelation between the ESPON sub-spaces. The values for the population also show a somewhat different neighbourhood-dependent growth than those for the GDP per capita.
As regards population change the general conclusion is that all the observed indices reveal positive spatial autocorrelation. And as the higher indicator values for the EU10 regions indicate, the population growth in the enlargement area also tends to be slightly more spatially clustered than in the EU15. While the dependence on neighbours seems to be stronger in the univariate than in the bivariate case, the results also show a consistent positive bivariate spatial autocorrelation. Thus, the population growth in European regions seems to be positively correlated both to the initial levels and the growth rates in neighbouring regions. This result is an indication of a path-dependence so that a low population growth is typical in lowly populated neighbourhoods, and vice versa.
A somewhat surprising result is that the neighbourhood dependence for population change is estimated to be stronger among the border than non-border regions. This is not in line with the view that borders are characterised by large variations and disparities and thus being treated as harmful discontinuities in regional developments. This result also holds true for the enlargement countries, so it cannot be considered only as a consequence of the EU integration process. Yet it has to be noticed that an

ESPON 1.1.3 - Final Report Part 2 71
opposite and more conventional inter-country pattern exists with regard to the economic growth.
As noted earlier, the Moran I values for GDP per capita growth contain an inflation effect of uncertain magnitude, so the individual indicator values are more indicative than definitive. However, based on the border/non-border -division, it seems that variation in inflation rates have not had a considerable impact on the estimates, since in the case of systematic and distorting distribution over NUTS3 regions, the values for the border and non-border categories would have been clearly different from each other. This is not the case in Table 2.3 and, in general, univariate Moran I values for economic growth are reasonably well in line with those for population.
Concerning the GDP per capita growth, an interesting finding in Table 2.3 is that all but two bivariate Moran I coefficients are negative. This is a notable result since this bivariate spatial autocorrelation measure is closely related to the concept of convergence. High and positive values indicate that highest growth rates occur in regions surrounded by rich regions, implying increasing income disparities and divergence. Negative values, in turn, indicate a tendency towards convergence: i.e. regions with poor neighbours tend to realise higher growth rates than the ones with rich neighbourhoods. From the viewpoint of European wide cohesion this is clearly a positive result: the more negative the value of this bivariate autocorrelation measure, the higher the growth rates of GDP per capita in the regions surrounded by regions with low GDP per capita in 1995.
2.5.2 Clusters of regions and spatial outliers
The decomposition of the global Moran I into the contributions of individual regions provides a region-specific measure to illustrate to what extent each region in the data set is surrounded by regions with high or low values. Significant values of this local Moran I can be used to identify atypical regions (hot and cold spots), and areas where there appears to be a high tendency for clustering. When decomposed in this way, a local Moran statistic acts like a ‘spatial smoother’, indicating two forms of positive and two forms of negative spatial associations. The resulting typology of four types of regions is presented in Table 2.4

ESPON 1.1.3 - Final Report Part 2 72
Table 2.4: Types of regions and forms of local spatial association
Type of region
Form of spatial association Possible trend
Local Moran I value
High-High High in a region surrounded by high values of the weighted average of the neighbouring regions
Clustering of high values
Positive
Low-Low Low in a region surrounded by low values of the weighted average of the neighbouring regions
Clustering of low values
Positive
Low-High Low in a region surrounded by high values of the weighted average of the neighbouring regions
Cold spot
Negative
High-Low High in a region surrounded by low values of the weighted average of the neighbouring regions
Hot spot Negative
Given the fact that the results of local Moran I are rather sensitive to the significance level and spatial weights (Anselin 1988), the typology is based on compiled information from three weights matrices (3-, 5-, and 7-nearest neighbours) as follows:
POP95-00: Univariate local Moran I
Positive associations: mean significance < 0.2, the same type of spatial association identified in all three weights matrices
Negative associations: the same type of spatial association identified in all three weights matrices
GPC95-00: Bivariate local Moran I
Positive and negative associations: mean significance < 0.3, the same type of spatial association identified in all three weights matrices
The results of this typologisation are presented in Maps 2.5 and 2.6

ESPON 1.1.3 - Final Report Part 2 73
Map 2.5: Spatial association of population growth 1995-2000, regions by type of univariate local Moran I

ESPON 1.1.3 - Final Report Part 2 74
Map 2.6: Spatial association of GDP per capita growth 1995-2000, regions by type of bivariate local Moran I
Table 2.5 lists the distribution NUTS3 regions in the ESPON space according to the type of spatial association. It reveals high proportion of High-High and Low-Low clustering types of regions in the cases of positive global spatial autocorrelation: In spite of a higher criterion used for the population change

ESPON 1.1.3 - Final Report Part 2 75
(see Map 2.5), about 40 percent of the regions in the EU27+2 belong to these categories. In particular, low development seems to appear in distinctive homogenous zones: in addition to the weak performance in the regions of Bulgaria and Romania, significant Low-Low concentrations can be found, for example, in Nordic peripheries, Czech Republic, Hungary, Baltic countries and some parts of Germany.
Table 2.5: Regions by type of local spatial association in EU27+2, EU15 and EU10
POP95-00
Univariate local Moran I
GPC95-00
Bivariate local Moran I
N % N %
High-High 249 18,8 184 13,9
Low-Low 259 19,6 177 13,4
Low-High 156 11,8 252 19,1
High-Low 116 8,8 250 18,9
Type not identified
541 41,0 458 34,7
EU27+2
Total 1321 100,0 1321 100,0
High-High 231 21,3 163 15,0
Low-Low 142 13,1 81 7,5
Low-High 142 13,1 232 21,4
High-Low 97 8,9 169 15,6
Type not identified
473 43,6 440 40,6
EU15
Total 1085 100,0 1085 100,0
High-High 0 0,0 2 1,7
Low-Low 53 43,8 29 24,0
Low-High 4 3,3 0 0,0
High-Low 13 10,7 78 64,5
Type not identified
51 42,1 12 9,9
EU10
Total 121 100,0 121 100,0

ESPON 1.1.3 - Final Report Part 2 76
With respect to the average change in population, the clusters represent the attractiveness of coastal regions, national capitals and Pentagon, vis-à-vis inland peripheries and other less accessible areas. In this respect there is also a clear east-west divide: this High-High category comprises none of the regions in EU10. In the case of GDP per capita change, the spatial pattern is more diverse, but again, the regions in enlargement area are overrepresented in the category of Low-Low.
Map 2.6 illustrates the spatial distribution of the earlier finding that – at least with respect to the EU27+2 average – regions with poor neighbours in 1995 tended to grow faster in the period of 1995-2000. Yet, the spatial pattern is not homogenous. The light red areas, representing convergence, are quite unevenly distributed across the European space. In fact, the convergence in terms of this particular bivariate spatial autocorrelation measure seems to have taken place mainly in two macroregions: in parts of the Mediterranean EU15 cohesion countries in the south, and among the core regions in central European EU10 countries (Czech Republic excluded). In other European peripheries or Objective 1 regions, excluding Ireland and Estonia, the pattern reveals no evidence for the systematic ‘catch-up’ in terms of GDP per capita.
The distribution of spatial outliers – or so called ‘hot and cold spots’ – is, of course, geographically very scattered. Overall, and as a common characteristic across the ESPON space, locations of these High-Low and Low-High -regions reflect the dominant role of capitals, largest cities and some industrial centres. This can be seen in Table 2.6 which presents the top regions in the EU10 area in terms of the most significant negative local spatial association according to the type High-Low.
The policy implications from these findings are not very clear. As hot spots (High-Low) have a particular high potential for economic growth, they may play a prominent role in producing positive growth impulses to the benefit of regions in their geographical neighbourhood. On the other hand, the negative values of local spatial dependence imply that the local spillover effects and knowledge transfers originating from these hot spots were at least in 1995-2000 weak. Since the links between the observable spatial heterogeneity and the spatial boundaries of market processes are complex, this issue remains a task of future empirical research: is the outstanding favourable growth potential in some EU10 hot spot -regions somehow related to the ongoing integration process, does it reflect the local polarisation of the economies in Europe, or does it just reflect the mismatch between the administrative and functional borders?

ESPON 1.1.3 - Final Report Part 2 77
Table 2.6: The most significant ‘hot spot’ -regions in EU10
POP95-00
Univariate local Moran I
GPC95-00
Univariate local Moran I
LT007 Taurages CZ01 Praha
HU012 Pest HU063 Szabolcs-Szatmar-Bereg
PL042 Zielenogórski HU061 Hajdu-Bihar
PL0C1 Pólnocnoslaski LV001 Riga
PL073 Warzawski LT003 Klaipedos
SI00E Osrednjeslovenska PL042 Zielenogórski
PL013 Wroclavski
SK042 Kosický Kraj
PL061 Krakowsko-Tarnowski
SI009 Gorenjska
2.5.3 Key findings and implications of neighbour-dependent growth
In this exercise, growth processes in Europe are observed divergent in terms of NUTS3 regions. The size of these regions, however, is different across countries, and they may not represent the geographical units in which spatial clusters evolve and spatial association prevails. Economic growth is also measured without any corrections or adjustments for price level variations. In addition, commuting is not taken into account, which tends to overestimate the GDP per capita in centres, and lead to systematically biased estimates of spatial association between the commuting centres and their neighbourhoods. Although these qualifications do not invalidate the study, they emphasise the need for a careful interpretation of its results.
The results of this exercise clarify the importance of spatial proximity with respect to the evolution of regional disparities across European space. For the population and economic growth, a positive univariate spatial autocorrelation is detected. This means that growth rates of regions are characterised by a neighbourhood dependence: the more a region is

ESPON 1.1.3 - Final Report Part 2 78
surrounded by regions with positive dynamics, the higher is its own growth rate. This clearly manifests a need both for a systematic analysis of the role of spatial factors in economic growth, and for considering its implications for the EU cohesion policy.
Regarding the specific spatial patterns of regional growth processes in Europe, the key findings can be summarised in following four points:
Firstly, there are clear disparities in spatial growth patterns across European space. Most countries and parts of Europe seem to form clear macro clusters of regional development.
Secondly, the population growth among the border regions appears to be more neighbour-dependent than among the non-border regions. This result also holds true for the enlargement countries, so it cannot be considered only as a consequence of the EU integration process. This finding is not in line with the hypothesis that stresses the importance of national borders in determining the discontinuities in regional developments and population dynamics.
Thirdly, the results indicate some evidence for territorial cohesion at the macro level. The regions surrounded by regions with a low GDP per capita seem to grow faster than regions with more prosperous neighbours. This pattern is also characterised by clusters and country-effects, implying the existence of different spatial regimes between and within the cohesion countries and the EU’s Objective 1 regions. In addition, this holds true for the enlargement area, although the effect is found to be slightly weaker than in the old member states.
Fourthly, the distribution of spatial outliers reflects a strong agglomeration effect. Development trends in the key urban nodes, core coastal areas and capital regions within countries are more positive than in the other parts of countries. This effect seems to be particularly strong in the enlargement countries. The reasons for this are, of course, manifold and again, country-specific, although this result may also indicate some kind of centre-periphery lag so that during the enlargement process and transition, the largest cities have benefited most from the increased economic interaction with the EU, and maybe also from the preaccession aid.

ESPON 1.1.3 - Final Report Part 2 79
2.6 Regional specialisation
2.6.1 Taking up from the Third Interim Report
In this section we extend the analysis on regional specialisation first developed for the 1.1.3 Third Interim Report. The purpose of this analysis is to address the growing concern about the potential vulnerability of European regions due to increasing economic integration and globalisation. The main worry is that the processes of integration and globalisation may affect the degree of regional specialisation and the geographic concentration of economic activities. If regional specialisation increases, industry-specific shocks may become region-specific shocks and sector-specific policies might become region-specific policies making regions more vulnerable. On the other hand, higher specialisation and greater concentration might lead to increased productivity via increasing economies of scale. Regional performance is also related to economic specialisation, even though the nature of this relationship changes with the economic sector and therefore caution should be used in making inferences between the positive or negative impacts of regional specialisation.
2.6.2 Methodology: The ‘P’, ‘S’, ‘C’ and ‘D’ regions
In the TIR we have measured regional specialisation by adapting the Herfindahl Index described by Aiginger (1999), to the analysis of data on regional employment aggregated into three main economic sectors: agriculture (sectors A and B of the NACE classification), manufacturing (sectors C to F) and services (sectors G to P) for the period 1995 to 2001 for NUTS2 regions. The Herfindahl index is calculated as follows:
Hj = Σi
(sij )2
with iji
ijij
E
Es Σ=
where E = employment, i = industry, j = region.
In the final report we have kept the same level of analysis (NUTS2) and time period (1995-2001). We assume that, for the new member states, this period of time represent an “EU accession trial stage” where economic changes due to post-communist regime and the release of Commission’s cohesion and pre-accession funds, already show impact on the economic performance and specialisation of the individual regions.

ESPON 1.1.3 - Final Report Part 2 80
Following the need to further develop the typologies of regional specialisation developed in the TIR we have identified four broad categories based on GDP performance in order to investigate for each category the relation between GDP and specialisation. Rather than calculating a pure quantitative measure of GDP growth, we have applied a mixed quali-quantitative measure based on the deviation from the EU27+2 average GDP per capita (in PPS) at the beginning of the period (1995) and the growth rate during the period 1995-2001. With this approach, the growth rate of GDP per capita assumes different meaning according to the starting point of the region. Through this method we have identified the following categories:
‘P’ (powerful) regions with GDP per capita in 1995 and growth rate of GDP per capita both above average;
‘S’ (slowing) regions, with a GDP per capita above average in 1995 and a growth rate below average;
‘C’ (converging or catching-up) regions, with a GDP per capita below average in 1995 but a growth rate above average.
‘D’ (diverging or declining) regions with both GDP per capita in 1995 and growth rate below average.
For each of these GDP performance categories, we have extended the analysis of regional specialisation by correlating specialisation trends with the presence of the MEGAs categories identified in ESPON 1.1.1 and with the aggregation of NACE sector (AB; CF; GP) that demonstrated the highest growth rate in the period 1995-2001.
The graphs in Figure 2.8 and Figure 2.9 show the logical processes associated with this analysis and the two regional typologies developed within each of the 4 categories of economic performance identified above.

ESPON 1.1.3 - Final Report Part 2 81
Figure 2.8: Building the typology based on specialisation trends and NACE sectors
Figure 2.9: Building the typology based on specialisation trends and presence of MEGAs

ESPON 1.1.3 - Final Report Part 2 82
2.6.3 Results
Figure 2.10 represents the distribution of the P, S, C, D regions according to the degree of specialisation at the beginning and end of the analysis period. The upper right quadrant corresponds to those regions that have maintained their level of specialisation above the EU27+2 average through the period. The opposite bottom left quadrant includes regions whose specialisation level has remained constantly below average.
This approach to measuring specialisation trends is different from the one applied in the TIR (Figure 2.9) based on the rate of change of the Herfindahl indexes between 1995 and 2001. The TIR approach resulted to be too sensitive to the “small number effect” whereby small changes in small values of the index generate high rates of change.
In general the new results show a picture of minimal changes, whereby most NUTS2 regions have not changed their position in terms of overall specialisation during the 5 years. It is to be noted though that “P” and “S” regions are mostly positioned in the “high specialisation” quadrant while “C” and “D” regions are in the “low specialisation” one (Figure 2.10).

ESPON 1.1.3 - Final Report Part 2 83
Spec ialisation trends and GDP performance
-0.20
-0.10
0.00
0.10
0.20
0.30
0.40
-0.30 -0.20 -0.10 0.00 0.10 0.20 0.30 0.40
Deviation from H-index 1995
Devia
tion f
rom
H-I
ndex 2
001
C Regions D Regions P Regions S Regions
Figure 2.10: Specialisation trends and the C, D, S, P regions
0.9
1
1.1
1.2
1.3
0.8 0.9 1 1.1 1.2
diversifying
GD
P/h
grow
th
Southern and Eastern Ireland
LuxembourgLódzkie
BratislavaMoravia
LeipzigCornwallChemnitz
Valle d'Aosta
ÅlandExtremadura
Trøndelag
Flevolandspecialising
GD
P/h
decl
ine
Opolskie
Figure 2.11: Diagrammatic chart of typology 2 in TIR (Herfindahl rate of change and GDP/h growth between 1995 and 2001)

ESPON 1.1.3 - Final Report Part 2 84
Is there a relationship between specialisation trends and economic sector? The above mentioned the analysis shows a very high positive correlation between the position of regions in 1995 and 2001 in terms of specialisation. When we overlay this results with the industry sectors characterised by the highest growth in each NUTS2 region, we can see two new types of information; first there is no correlation between economic sectors and degree of specialisation: both Figure 2.12 and 2.13 show that the three sectoral aggregation distribute equally between the two quadrant of high and low specialisation; second, two distinct patterns emerge for the EU15 (Figure 2.12) and EU12 (Figure 2.13).
In the EU15 the regions characterised by high growth in the service and primary sectors have similar performance: the correlation between the degree of specialisation is positive and higher than 1 meaning that these regions have more than maintained (statistically increased) their degree of specialisation.
The regions characterised by high growth in the manufacturing sectors instead show a positive but lower than 1 correlation coefficient, meaning that these regions have less than maintained (statistically decreased) their degree of specialisation. For the EU12 (here including Norway but excluding Bulgaria and Switzerland) the situation is different (figure 2.13). Here, the agriculture and manufacturing sectors show a correlation coefficient higher than 1, while the service sectors show a coefficient lower than 1. In both cases (EU15 and EU12) the deviation from a perfectly linear correlation are very small, which is a concern with regards to the explanatory power of sector growth for specialisation degree and trends.
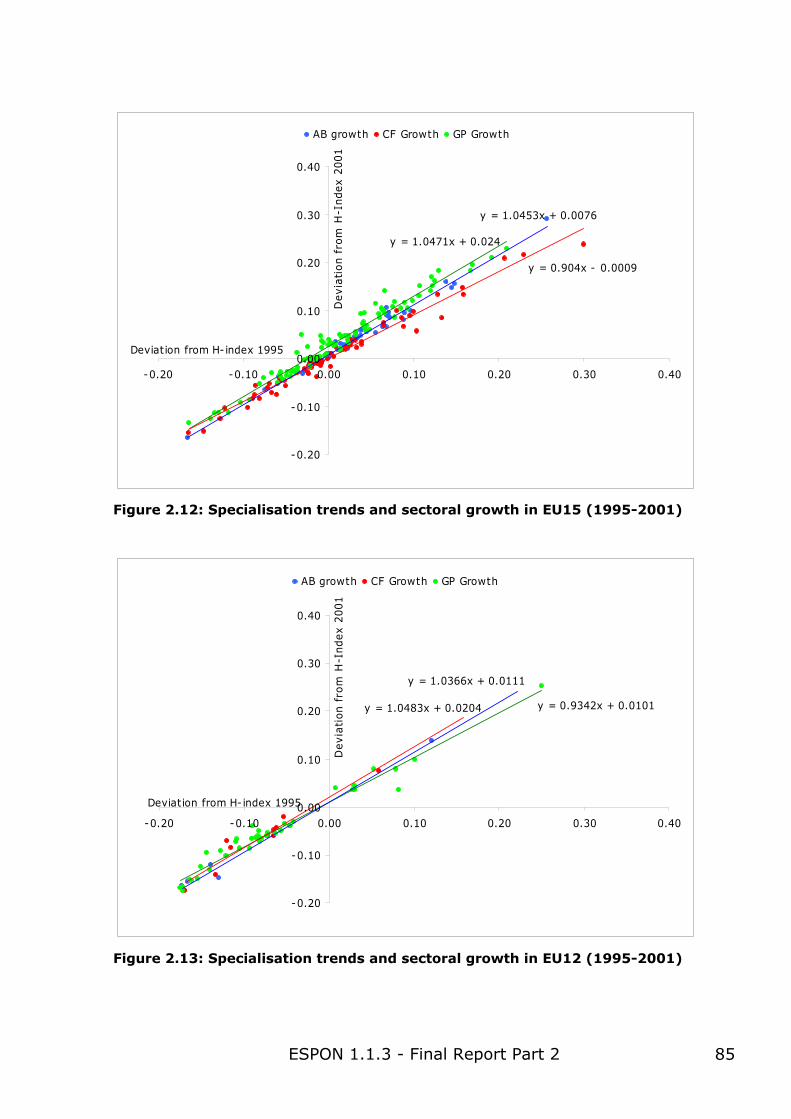
ESPON 1.1.3 - Final Report Part 2 85
y = 1.0471x + 0.024
y = 0.904x - 0.0009
y = 1.0453x + 0.0076
-0.20
-0.10
0.00
0.10
0.20
0.30
0.40
-0.20 -0.10 0.00 0.10 0.20 0.30 0.40
Deviation from H-index 1995D
evia
tion f
rom
H-I
ndex 2
001
AB growth CF Growth GP Growth
Figure 2.12: Specialisation trends and sectoral growth in EU15 (1995-2001)
y = 0.9342x + 0.0101
y = 1.0366x + 0.0111
y = 1.0483x + 0.0204
-0.20
-0.10
0.00
0.10
0.20
0.30
0.40
-0.20 -0.10 0.00 0.10 0.20 0.30 0.40
Deviation from H-index 1995
Devia
tion f
rom
H-I
ndex 2
001
AB growth CF Growth GP Growth
Figure 2.13: Specialisation trends and sectoral growth in EU12 (1995-2001)

ESPON 1.1.3 - Final Report Part 2 86
The characterisation by economic sector provides only a limited insight to the variation in degree and trends of specialisation. A possible further understanding of the recent trends on specialisation might arise by looking at the absence and presence of MEGAs (and at the presence of different MEGAs categories) identified in ESPON 1.1.14. A first step in this analysis is represented in Figure 2.14 which shows the presence of MEGAs in the ‘P’, ‘S’, ‘C’ and ‘D’ regions.
The EU15 and EU12 areas are also identified. The main point to emerge from this analysis is that in the “declining regions” (bottom left quadrant) there are significantly fewer MEGAs than in the rest of the EU27 (+NO –BG). In general category 4 and category 3 MEGAs are present in regions ‘C’ and ‘D’ and category 1 and 2 MEGAs as well as the global nodes in regions ‘P’ and ‘S’. This is consistent with the fact that MEGAs analysis includes GDP as one of the variables used to identify categories of MEGAs. Yet in ESPON 1.1.1 the analysis of MEGAs considers GDP per capita only as a stock variable but does not measure changes in GDP per capita as is the case of our analysis.
The second step of the analysis specifically addresses the following question: is there a relationship between specialisation trends and presence of MEGAs and is the relationship different for old and new member states? In the case of EU15 (figure 2.15 for EU15 and 2.16 for EU12) the majority of the MEGAs are associated with regions that had and still have a high degree of specialisation. In particular the two Global Nodes of Paris and London are at the highest positions.
4 For a detailed description of the MEGAs category, see ESPON 1.1.1 Final Report, pp 116-117

ESPON 1.1.3 - Final Report Part 2 87
-0.15
-0.10
-0.05
0.00
0.05
0.10
0.15
-20000.00 -10000.00 0.00 10000.00 20000.00 30000.00 40000.00 50000.00
Deviation from avergae GDP/hD
evia
tion f
rom
avera
ge
GD
P/h
gro
wth
rate
No MEGAs CAT4 MEGAs CAT3 MEGAs CAT2 MEGAs CAT1 MEGAs Global Nodes
P Regions
S Regions
C Regions
D Regions
EU12
EU15
Figure 2.14: presence of MEGAs in the ‘P’, ‘S’, ‘C’ and ‘D’ regions
-0.20
-0.10
0.00
0.10
0.20
0.30
0.40
-0.20 -0.10 0.00 0.10 0.20 0.30 0.40
Deviation from H-index 1995
Devia
tion f
rom
H-i
ndex 2
001
No MEGAs CAT4 MEGAs CAT3 MEGAs CAT2 MEGAs CAT1 MEGAs Global Nodes
Figure 2.15: Specialisation and presence of MEGAs in the EU15

ESPON 1.1.3 - Final Report Part 2 88
In the case of the new member states, there are two main differences from the EU15: first there are only MEGAs of category 3 and 4 (the only region including a category 2 MEGA being Oslo, not in the new member states). Secondly there is a clear distinction between the two categories of MEGAs whereby category 3 MEGAs are all (except for Warsaw) in the high specialisation group of regions and category 4 are all in the low specialisation group.
-0.20
-0.10
0.00
0.10
0.20
0.30
0.40
-0.20 -0.10 0.00 0.10 0.20 0.30 0.40
Deviation from H-index 1995
Devia
tion f
rom
H-i
ndex 2
001
No MEGAs CAT4 MEGAs CAT3 MEGAs CAT2 MEGAs
Figure 2.16: Specialisation and presence of MEGAs in the EU12 (+NO –BG)
In the following paragraphs we comment the results for the ‘P’. ‘S’, ‘C’ and ‘D’ regions separately with regards to the relationships between specialisation, economic sector growth and presence of MEGAs. (see Maps at Annex A8)
‘P’ regions
The regions with the highest ranks in the MEGAs categories (2 and 1) including the global node of Paris are also the regions where specialisation has increased in the service sectors more than others, even though it must be said that these regions already showed a high degree of specialisation in

ESPON 1.1.3 - Final Report Part 2 89
the service sectors at the beginning of the analysis period. This category also includes the regions of the southeast and eastern part of France or southern Germany characterised by high quality agricultural products. Most of the regions with a decreasing level of specialisation contain MEGAs of the two lowest categories with the exception of the urban regions of Milan, Barcelona and Stuttgart. There are no regions from the new member states that fall in this category.
‘S’ regions
This category includes large parts of the “Pentagon” regions where GDP per capita is growing not as fast as in the rest of the enlarged Europe plus Sweden, northern United Kingdom and the urban areas of Rome, Berlin, Prague, Bratislava. All of these, with the exception of Berlin, have a higher specialisation in the industry sectors rather than in services. There are on average fewer MEGAs of any category compared to the ‘power’ and ‘converging’ regions, suggesting a critical role of MEGAs in sustaining GDP growth per capita.
‘C’ regions
In this category we find the southwest, Bretagne, Lorraine regions in France, Oppland in Norway and Campania and Sardegna in Italy characterised by a higher growth in the industrial sectors, Languedoc and Picardie in France characterised by a higher presence of the primary sectors and the emerging MEGAs of Lisbon and Budapest with a growing service sectors. Included are also most of the regions of Portugal, Spain, Hungary, Poland, Latvia and Estonia. None of these regions shows any trend of specialisation, but these might be a reflection of the decreasing role of the primary in favour of the service sectors. Poland and Spain mirror each other also in the presence of MEGAs of categories 3 and 4, which can have a crucial role “in relaying a more balanced territorial development on the European scale”. (ESPON 1.1.1 Final Report, p.117)

ESPON 1.1.3 - Final Report Part 2 90
‘D’ regions
Not surprisingly there are no MEGAs in this group of regions mostly located in the new member states and in the eastern part of Germany. The latter are almost univocally characterised by an increasing specialisation in the service sectors with the regions on the old border regions more characterised by the primary sector. Also included are the southern regions of Belgium and the Objective 1 regions in the United Kingdom (Wales, Cornwall, Scotland). Due to the overall economic decline and divergence trend, these are clearly the regions most at risk also given the lack of potentials for development embodied by the presence of MEGAs.
2.6.4 Policy implications of regional specialisation
The presence (or absence) of statistical correlation between specialisation and sectoral growth on one hand and between specialisation and type of MEGAs on the other should not be interpreted as a causal relation: the three dimensions have more simply developed in parallel during the period 1995-2001. However, if we assume that increasing GDP per capita, especially in the new member states, is a desirable target, then listing the conditions under which such trend has occurred, can inform the reasoning around policy recommendations. As mentioned in the TIR, caution should be used in the definition of any policy recommendation because not all regions, especially in the new member states, will respond equally to policies that promote specialisation or differentiation of the economic structure or indeed the promotion of metropolitan and urban regions. The latter have demonstrated to be more highly associated with “good” specialisation, that is specialisation associated with maintenance of above-average GDP per capita.
In regions whose GDP per capita is “catching-up” (mainly Poland, a new member state, and Spain, one of the latest country to join the EU before enlargement) this relation is less evident and MEGAs are associated with GDP per capita growth but not with specialisation. This confirms the crucial difference of behaviour in terms of specialisation between the EU15 countries and the new member states, already discussed in the TIR.

ESPON 1.1.3 - Final Report Part 2 91
2.7 Financial system, exchange rate and polycentricity in the context of European enlargement
Will financial and monetary integration have beneficial repercussions for all the regions that make up the European economy or will it provoke on the contrary some spatial discontinuities and exclusions? The main objective of this section is to identify the effects of the enlargement process on economic and urban structures in a context of financial and monetary integration. Although this topic is relatively neglected in the current literature it raises important questions about the spatial consequences of the enlargement process in a world where monetary and financial variables play an increasingly great role. On the one hand, as observed by Alessandrini, Papi and Zazzaro (2003) there is repeated talk of more decentralised economic development and localised industrial development policies being the only means of redress for regional disequilibria. On the other hand, there has been an attitude of “benign neglect” vis-à-vis the disappearance of local and autonomous banking systems and the concentration of financial activities in the main financial centres. These last transformations are generally considered to be the natural consequences of ensuring the efficiency and competitiveness of financial markets.
The “exchange rate” topic is important as well because the level at which new EU member states will peg their currency or integrate the euro will influence their economic development for decades. Two recent distinct historical examples for entering a fixed exchange rate area with an overvalued exchange rate were relatively disastrous for the countries involved (Hoelscher and Jarmuzek, 2003). The first example concerns the UK entry into the European Exchange Rate Mechanism (ERM) with a rate around 1£ for 3 DM. This rate proved to be unsustainable already after two years when the UK had to leave the ERM under massive speculative attacks (in September 1992). The second example for an overvalued entry into a fixed rate regime is provided by East Germany. Through unification East Germany became part of the Deutsche Mark area – consequently part of the ERM – with a determined conversion rate, which was highly overvalued. Among other reasons this overvalued exchange rate parity conducted to the breakdown of the East German production base while this part of the country is still suffering today. Indeed a too strong currency or a currency pegged at a too high level can seriously impede economic development and provoke more regional disparities and spatial discontinuities within the different regions of a country.

ESPON 1.1.3 - Final Report Part 2 92
The overarching postulate of this research project is that meso-level polycentricity in new EU member states will depend heavily on financial and monetary variables and on the impacts of the latter on the different sectors (agriculture, manufacturing and services) that constitute the economy of a country. Our research hypotheses are mainly based on previous works and studies realised in Switzerland and in the United Kingdom (Dow, 1998 and 1999; Crevoisier, Corpataux and Thierstein, 2001; Corpataux and Crevoisier, 2001; Corpataux, Crevoisier and Thierstein, 2002; Corpataux and Crevoisier, 2005).
This section is organised in three stages. In the first phase a theoretical/conceptual framework will be shortly introduced. In the second phase the importance and evolution of some financial and monetary variables in the new EU Member States will be described. Note that in our complete report in Annex B we highlight the economic structures of the different countries – their main economic specialisations in agriculture, manufacturing, tourism and/or finance as well their capacity to export – in order to catch their potential differentiated reactions under different financial and monetary constraints. Conclusion will emphasise the territorial challenges that these different countries will face in a context of monetary and financial integration.
2.7.1 What are the spatial connections and barriers due to financial and monetary integration?
Conceptual framework
In the geographical literature, the extent to which financial unevenness occurs is explained by the structure of the financial sector. Thus, from a general point of view and spatially-speaking, bank-based systems are generally more polycentric and decentralised than finance-based systems. Moreover a polycentric banking system can better irrigate the whole economy of a country. A liberalisation process and the corollary move to a more financial market based system generally provoke the concentration of financial activities in the main financial centres at the national scale as well as at the international scale. Peripheral regions and SMEs could therefore suffer from credit rationing (Dow, 1999; Klagge and Martin, 2005). Such a move to a more finance-based system – even in countries with a relatively decentralised banking system such as Poland – opens questions concerning

ESPON 1.1.3 - Final Report Part 2 93
the possibility of credit rationing vis-à-vis both non-central regions and SMEs (Dabrowska and Gruszczynsky; 2003).
If banks are not able to sustain economic development – via traditional credits – foreign financing could be a possible substitute. Foreign direct investment has been, for example, an important element in the transition process and has often been an alternative to domestic financing (Caviglia and al., 2002). The FDI spatial distribution is an important topic too: their concentration on the capital cities could support a monocentric national development while a more diffused distribution could favour a more polycentric national development.
The exchange rate plays a determining role in a country’s competitiveness. The choice of the exchange rate level is consequently an important issue. While a strong currency or a currency with an underlying tendency to appreciate suits the development of financial activities in some cities – as we have shown for Switzerland (Crevoisier et al., 2001; Corpataux et al., 2002), it can have diverse effects on the other regions. Two criteria can be used to assess the regional impact of an appreciating currency:
First criterion: Regional sectoral specialisation. While an appreciation in the national currency supports, and has a positive influence on, international financial centres, regions that specialise in traditional productive activities, particularly industry and tourism are negatively exposed, as we also alluded to earlier in section 2.6 on regional specialisation. Faced with an appreciation in the external value of their currency, their exports, whether in terms of manufactured goods or tourist numbers, are penalised.
Second criterion: the SME/LE dichotomy. Traditionally, theory teaches us that an increase in the external value of a currency prompts companies to invest abroad. Practically, only large firms (LEs) have the financial and organisational capacity to implement a strategy of international expansion and relocation, even though they already have privileged access to national and international financial markets. Conversely, SMEs do not have the financial and organisational capacity to even consider relocation. Faced with an appreciating currency, a region mainly made up of SMEs will be confronted with additional problems in exporting. Moreover regions could become especially vulnerable to plant closures.

ESPON 1.1.3 - Final Report Part 2 94
Figure 2.17: A conceptual framework to highlight the spatial impact of financial and monetary variables
Source: own elaboration.
Figure 2.17 summarises our conceptual framework. From a theoretical point of view it is possible to imagine two radically opposite scenarios:
A) The monocentric scenario: In this first case a country could develop a strategy of hard currency and promote the move to a more finance-driven economy. In such a situation a monocentric development could be expected within the country: the development of financial activities will occur in the main financial centres, surely in the capital cities (Warsaw, Prague, Budapest, etc.). FDI inflows will be mainly in service-oriented activities and the capital cities will attract most of them. At the same time regions specialised in agriculture, manufacturing and tourism will suffer from a lack of – national or foreign – finance and know some difficulty to export due to the strength of their currency.
B) The polycentric scenario: In this the second case a country could pursue a weak currency strategy and try to maintain a strong bank-based system. In such situation a more diffused and polycentric development could occur in the whole country: agricultural and industrial regions could know a relative autonomous growth while international tourism could develop in cities from more peripheral regions. At the same time a low currency will favour FDI inflows in non-central regions.
Country X and its economic and
regional structures
Level of inward FDI;their spatial distribution
Banking and financialsystem development
Level and evolution of exchange rate
Two polar scenarios
A) The monocentric oneB) The polycentric one

ESPON 1.1.3 - Final Report Part 2 95
In summary, countries with a rather low currency and a decentralised financial system may encounter a decentralised economic development. On the contrary, countries with rather strong currency and a finance-based system may see the development occurring mainly in their capital city.
2.7.2 Highlighting the evolution of some financial and monetary variables
Our empirical work is focused mainly on the ten new member states (Cyprus, the Czech Republic, Estonia, Hungary, Latvia, Lithuania, Malta, Poland, Slovakia, Slovenia) and the accession countries who are slated to join the EU in 2007 (Bulgaria and Romania).
2.7.2.1 Financial system development
Banking sectors in most of the new EU member states differ widely from those of the Western countries due to their past. New EU member states’ banking systems are today on average to a higher degree concentrated, state owned, but also show a high degree of foreign penetration (Haselmann, 2003). Moreover financial systems in new member states are still heavily bank-based (Demirgüc-Kunt and Levine, 2001). Stock markets still play a secondary role compared to the banking sector within the financial systems of those countries (Haselmann, 2003). An indicator such as market capitalisation to GDP shows that stock markets are still underdeveloped by Western European standards in the transition economies (Bulgaria, the Czech Republic, Estonia, Hungary, Latvia, Lithuania, Poland, Romania, Slovakia and Slovenia). Note that Cyprus and Malta, which are not transition economies, possess a financial sector whose structure is more closely in line with that of the euro area (Caviglia and al., 2002).
Considering the future of many stock exchanges in Europe and especially in new EU member states the situation remains unclear. Stock exchanges in Eastern Europe are establishing different types of alliances with other stock exchanges, as in the case of the Warsaw Stock Exchange (WSE) with Euronext, and some of the Baltic exchanges with the HEX Group (the holding company for the Helsinki Exchange) (Claessens, Lee and Zechner, 2003) while the HEX itself merged with the Swedish Stock Exchange – OM – in May 2003 (Vihnas de Souza, 2004). At the same time large Eastern European firms chose to be cross-listed. In early 2000, more than 140 firms (just over

ESPON 1.1.3 - Final Report Part 2 96
35% of all listings) from eight new member states (CZ, EE, HU, LV, LT, PL, SI, SK) were cross-listed, mostly in New York and London (Claessens, Lee and Zechner, 2003).
Thus in a context of strategic alliances between stock exchanges and while some domestic large corporations continue to seek foreign listing – as trading is diverted abroad – some of them could know a decline in local liquidity and could go through a period of decline.
2.7.2.2 Level of inward foreign direct investments
If we look at FDI inflows received by the new member states we notice that in 2001 three countries received almost 80% of FDI inflows: Poland got the most important part (almost 34%) followed by the Czech Republic (29.2%) and Hungary (14.5%). All the others countries received less than 10% of the whole. Compared to the size of their population Malta has the highest position with 894 EUR per head while three countries are between 400 and 600 EUR, respectively Cyprus with 552 EUR, the Czech Republic with 533 EUR and Estonia with 441 EUR. The poorest position is occupied by Latvia with 84 EUR per head.
Table 2.7 presents FDI inflows in 2001 for each new EU Member State. Regarding FDI inflows over GDP in 2001, four countries are able to drain a high level of investment: Estonia (9.8), Malta (8.7), Czech Republic (8.6) and Slovakia (7.2). All the others are below five percent.

ESPON 1.1.3 - Final Report Part 2 97
Table 2.7: Inward FDI flows in candidate countries in 2001
Country
Inward FDI
(euro
million) in
2001
Inward
FDI to
GDP (%)
in 2001
Inward
FDI flows
in NMS
total (%)
in 2001
Inward FDI
flows per
head
(euro) in
2001
CY 419 4.1 2.2 552
CZ 5 489 8.6 29.2 533
EE 603 9.8 3.2 441
HU 2 730 4.7 14.5 268
LT 497 3.8 2.6 142
LV 198 2.3 1.1 84
MT 350 8.7 1.9 894
PL 6 377 3.1 33.9 165
SI 486 2.2 2.6 244
SK 1 647 7.2 8.8 306
Total
NMS 18 796 4.6 100.0 251
UE-15 403 824 4.6 1 068
Source: Lovino (2003)/Eurostat.
While manufacturing was traditionally the main sector of activity attracting foreign investors, the share of financial FDI increased strongly in the second half of the nineties. By the early 21st century as a by-product of the banking sector privatisation, the presence of foreign banks’ affiliates in the transition economies has become massive in all countries – with the partial exception of Slovenia – leading to foreign ownership of more than two-thirds of the banking system of these countries taken as a whole (Baudino and al., 2004) compared with about 20% in the Eurozone (Gal, 2004).

ESPON 1.1.3 - Final Report Part 2 98
Moreover inward foreign direct investments are not generally spread homogeneously on a country’s territory. Pavlinek (2004) shows within four countries – the Czech Republic, Hungary, Poland and Slovakia – that during the second half of the 1990s FDI inflows remained highly concentrated in capital cities and other metropolitan areas. FDI in the form of banking, financial and services types of investments was concentrated in the capital cities, thus increasing their primacy. Other big cities were also the target of FDI into the service-related activities but expensive urban areas tend to be less favoured by manufacturing investment. In the Czech Republic, for example, Prague and Brno, the two largest cities, attracted over 60 percent of service-oriented foreign-owned firms but only 24 percent of manufacturing FDI. In the three Baltic countries, Cornett and Snickars (2002) show that the hubs of investments by western firms – and particularly Scandinavian ones – were mainly the capitals and the largest cities in 1999. While Riga, Tallinn and Vilnius represented respectively 40 percent, 31 percent and 22 percent in terms of national population shares, the corresponding shares of total FDI were 82 percent, 72 percent and 66 percent respectively. In Lithuania, Kaunas and Klaipeda were also receiving relatively major shares of FDI, perhaps indicating the presence of a more decentralized urban system in Lithuania, as compared to Estonia and Latvia.
2.7.2.3 Regional impact of exchange rate variations
A first indicator to assess the sensitivity of a country to exchange rate variation concerns its degree of openness. Thus, Malta, Estonia, Slovakia, Hungary, the Czech Republic and Lithuania have a high degree of openness and could suffer strongly from currency variations. Slovenia and Bulgaria are characterised by an intermediate position while four countries (Romania, Poland, Latvia and Cyprus) seem really less sensitive.
If we consider the index of the real effective exchange rate5 and its evolution from 1995 to 2003, most of the new EU Member States knew a relatively strong appreciation of their currency during the last decade – Lithuania knew an especially strong appreciation while Cyprus, Malta and Slovenia had a more or less stable exchange rate evolution – such a situation could definitively impede the future development of their non-central regions, especially those ones specialised in industry, agriculture or tourism.
5 In order to catch the evolution of real exchange rate variation we used a trade-weighted currency index
deflated by consumer prices. Such an index track changes in the value of a country’s currency relative to the currencies of its principal trading partners.

ESPON 1.1.3 - Final Report Part 2 99
2.7.3 What territorial challenges for the new member states?
If we were able to put in parallel the evolution of some monetary and financial variables with the spatial and economic structures of these different countries, some important methodological problems remain. In particular the lack of data at a regional – even at a national-sectoral – scale is a serious problem. In such a situation it is particularly difficult to get a clear idea of what could be the effects of the enlargement process on regional outcomes. Nevertheless and from a theoretical point of view it is possible to imagine two radically opposite scenarios.
On the one hand a country could develop a strategy of hard currency and promote the move to a more finance-driven economy. In such a situation a monocentric development could be expected within the country: the development of financial activities will occur in the main financial centres, surely in the capital cities (Warsaw, Prague, Budapest, etc.). FDI inflows will be mainly in service-oriented activities and the capital cities will attract most of them. At the same time regions specialised in agriculture, manufacturing and tourism will suffer from a lack of – national or foreign – finance and know some difficulty to export due to the strength of their currency.
On the other hand a country could pursue a low currency strategy and try to maintain a strong bank-based system. In such situation a more diffused and polycentric development could occur in the whole country: Agricultural and industrial regions could know a relative autonomous growth while international tourism could develop in cities from more peripheral regions. At the same time a low currency will favour FDI inflows in non-central regions.
At a general level the current financial and monetary trends (currency’s appreciation, high concentration of FDI in capital cities and the potential decline of some national stock exchanges) could play in favour of a monocentric development. In most transition economies (CZ, EE, HU, LV, LT, PL, SL, SK, BG, RO) mainly specialised in manufacturing, agriculture and/or tourism, such trends could impede the development of their numerous non-central regions. Malta and Cyprus seem to be in a good position to develop their role as international services centers and to expand activities such as finance, higher education, tourism. From a concrete point of view new member states face four territorial challenges.
• Firstly, if the move to a more finance-based system is not confirmed – at least in the transition economies – the massive entry of foreign banks and the consequent process of “foreignisation” brings with it advantages (injection of capital, skills, expertises, new technology…) but disadvantages too. Funding could concentrate on large firms and

ESPON 1.1.3 - Final Report Part 2 100
main metropolitan areas while SMEs and non-central regions could know some rationing, a process called “cherry picking” (see, for example, de Haas and van Lelyveld, 2002). Such a situation leads to an important question: will foreign institutions be able to support/favour the development of all regions, all sectors and all types of firms? Or will they concentrate their lending and related financial services to large firms mainly located in large cities?
• Secondly, an important competition between the different Eastern European capital cities to keep and promote their own stock exchange is going on. Stock exchanges in the new member states are characterised by a low liquidity with the strong risk to see some of them disappearing. Large firms could raise capital abroad (foreign listing). What about the others?
• Thirdly, inward FDI tends to cluster in the main metropolitan areas. The increase in financial FDI has accelerated such a process. Thus while connections between new EU member states large cities and Western Europe seem now well established, will these large cities be able to diffuse their growth in their hinterland and in the other non-central regions of their country? In other words, how to be sure that the clustering of FDI in large cities will favour a more balanced development within the regions?
• Fourthly, if most of the new member states experienced a relatively strong appreciation of their currency during the last decade – Lithuania knew an especially strong appreciation while Cyprus, Malta and Slovenia had a more or less stable exchange rate evolution – such a situation could seriously impede the future development of their non-central regions, especially those specialised in industry, agriculture or tourism. Moreover a strong currency doesn’t help to attract FDI. While the aim to achieve a greater stability of their exchange rate vis-à-vis the euro over the long term could favour their economic development, an important question remains: at which level to peg? If they peg at a too high level, they will threaten their external competitiveness and future economic development with a strong risk to provoke higher disparities and spatial discontinuities.

ESPON 1.1.3 - Final Report Part 2 101
2.8 Some characteristics of ESPON space macro border areas
Apart from substantial cultural differences, borders constitute the main aspect separating the European space from that of e.g. the United States. Border regions in Europe are also for the most part lagging and relatively speaking peripherally located within their respective countries and far from e.g. national capitals (Copenhagen and Bratislava constituting the obvious exceptions). For example, the border regions identified hereunder constitute roughly a quarter of all NUTS3 level regions within the ESPON space but their share in the number of lagging regions (ESPON 2.1.1/3.1) amounts to nearly 40%. Thus the analysis of border regions and the understanding of their functionality and role remains an important aspect in understanding European territorial cohesion.
Borders (and border regions) within the ESPON space are hence hereunder for analytical purposes divided into four main macro border regions, namely: 1) internal borders between the 15 old member states including the two ESPON participating EFTA countries of Norway ad Switzerland; 2) internal borders between the 10 new member states including the accession countries of Bulgaria and Romania; 3) the “traditional” east-west border separating the former planning economies from their westerly neighbours; and finally 4) the total external border of the present ESPON space including Outré-Mer land borders. These national borders and adjacent regions are illustrated in Map 2.7. For the sake of simplicity only “pure” land borders are considered, i.e. excluding de facto border regions such as Øresund or the English Channel. Additionally, Community land borders with San Marino, the Vatican State, Liechtenstein, Gibraltar, Andorra and Monaco are excluded from the list of external borders.

ESPON 1.1.3 - Final Report Part 2 102
Map 2.7: ESPON space land borders and border regions, 2005
Of these four main groups the sum of all internal EU15/EFTA borders is the longest, also containing the largest share of the ESPON population (12.5% of total). Population density however is highest along the east-west border (on average 93 inhabtants/km²) and lowest at the external ESPON space border (35 inh./km²), largely owing to Finland, northern Norway and Guyana being included in this category. On average population density in non-border

ESPON 1.1.3 - Final Report Part 2 103
regions within the ESPON space is some 2.3 times higher than in corresponding border ones, further accentuating the relative peripheral position of border areas.
Expectedly cross border economic disparities are largest along the east-west border, although they are also substantial along the external borders. Taken as a group the poorest (in terms of GDP per capita) macro border area are those forming the external border, followed closely by the internal borders of the new member states and the accession countries.
The relative economic weight of these macro border regions has also changed considerably during the latter half of the 1990s as the share of the total recorded economic activity within the ESPON space has during the six-year period 1995-2000 shifted substantially in favour of non-border regions (Table 2.8). Although seemingly small (+0.5 percentage units), measured in year 2000 prices it is nonetheless some 44 billion euros in favour of non-border areas within the entire ESPON space, indicating a relative economic marginalisation of border regions in general. Looking at the changes from the point of view of EU enlargement, the relative strength of the “new” border regions has due to rapid economic growth nevertheless increased vis-à-vis the corresponding “old” ones, most so for the external borders (albeit these also include e.g. Finland and northern Norway).

ESPON 1.1.3 - Final Report Part 2 104
Table 2.8: Relative change of GDP shares of macro border regions 1995-2000
Macro border region Change
in %-units1995 2000
EU15 and EFTA countries internal border regions 13.7 13.5 -0.2New Member States and Accession Countries internal border regions 2.8 2.7 -0.1"East-west" border regions 2.5 2.4 -0.1ESPON space external border regions 1.9 1.8 0.0
All border regions 19.5 19.0 -0.5All non-border regions 80.5 81.0 0.5
Total ESPON space 100.0 100.0 0.0
Gross Domestic product expressed in Purchasing Power Standards
ESPON space GDPShare (%) of total
However, taking into account the differing roles that these macro regions play in the ESPON space economy, the relative losses of the internal borders of the new member states and the accession countries have, taken as a group, been most dramatic. Consequently the internal EU15/EFTA macro border region displays in relative terms the least negative development.
Also in terms of population change, border regions have witnessed a relative setback between 1995 and 2000. Whereas the total population change within the entire ESPON space amounted to 1.1% during the period, a lion’s share of this growth occurred in non-border areas. In non-border areas’ population increased on average 1.2% in comparison with merely 0.5% for border regions. More importantly, worst hit were the internal borders of the new member states and accession countries as well as the entire external ESPON border (graph in bottom right corner of Map 2.8). The only macro border region to experience an average increase in population was the internal EU15/EFTA one.

ESPON 1.1.3 - Final Report Part 2 105
Map 2.8: Population change 1995-2000 in ESPON space land border regions
These figures are however averages for the entire border length and large differences do exist. Map 2.8 depicts the population change between 1995 and 2000 for all border regions within the ESPON space. Not unexpectedly a

ESPON 1.1.3 - Final Report Part 2 106
clear core-periphery pattern emerges with high growth rates in the central parts of Western Europe and generally decreasing dittos further away from the core. The border regions of Sweden, Finland, the Baltic States, Hungary, Romania and Bulgaria demonstrate generally the most unfavourable development. Parts of Poland as well as several border regions on the Iberian Peninsula are also included in this category.
When these regional changes are related to their respective national averages the pattern changes however. The border regions in the Nordic countries, Spain and Portugal, north-eastern France, northern Italy as well as the Bulgarian-Romanian border display the worst performance vis-à-vis their respective average national performance. On the other hand, the relatively disadvantaged situation for the border regions in e.g. the Czech Republic is improved. All in all slightly over half of all border regions have had a worse performance than their countries on average.
2.9 The potential of border regions
The dominant role and increasing importance of borders and border regions is one of the most distinguishing features of the enlargement area. Today, the permeability of these borders is fairly high; although in some places natural barriers (mountain ranges; rivers lacking bridges) and administrative shortcomings still inhibit cross-border interaction. Border regions bear the brunt of the tension created by the wide disparities in income levels and benefit from the additional opportunities of efficient factor allocation, which helps them to achieve above-average positions within their countries in most cases, while at the same time experiencing below-average levels of security and frequently even creating additional ecological strains.
With the enlargement in 2004 the structure of European Union borders changed substantially. In the EU with 15 member states 81,5 % of all borders were coastlines and only 18,5 % land borders. This looks quite different in an EU with 25 member states where 41% are coastlines and 59% are land borders. So with the enlargement the importance of borders increased especially because more the 50% of the European land borders are in the new member states. This increasing importance is underlined by the fact that these new EU internal borders are not only numerous, but also have changed a lot during the 20th century. Parts of this land borders have specific characteristics because large parts where separated through decades by the so-called “Iron Curtain” which was known as a largely impermeable border that separated two different political and economic systems. These

ESPON 1.1.3 - Final Report Part 2 107
areas still face specific challenges, as the borders also demarcate the prosperity edge of the gap in income and economic power towards Western Europe.
Therefore it seems necessary to specifically deal with border regions in the enlargement area. As far as possible a quantitative approach was used to come to a first attempt towards a border typology. The analysis is dealing with 118 border regions defined on NUTS3 level for the 10 new member states and Romania and Bulgaria.
2.9.1 Coming to a border typology for the enlargement area
The aim of the research task was to deal with the different situations in border regions in the enlargement area and to come to a typology. So the objective of the analysis by selected criteria in a first step and of the typology in a second one is to show, how – with justifiable costs – a border typology could be developed. However, it should be emphasised already in advance that the results of this first approach described here are considered in no way to be appropriate for immediate policy application.
The components
In a first step, six different components of border characteristics were identified and analysed, namely: geographic type of borders, ethnic-historical types of borders, density of border crossing points, degree of economic disparity, integration into the EU funding system6 and membership in transnational activities. Concerning these components only the borderlines between countries (so the national borderlines) were taken into account. If there was no homogenous information along the national border it was classified according to the dominant type.
6 The criterion integration into the EU funding system has not been applied for the typology because the
data are only available for the whole country and not for border regions. In addition, in the mean while the conditions for integration into the EU funding system have changed anyway considerably by the accession of the former candidate countries to the EU.

ESPON 1.1.3 - Final Report Part 2 108
Geographic types of borders
Concerning the geographic characteristics of the national border areas, three types of borders have been distinguished:
-river borders where the border is constituted by a river of substantial breadth and rate of flow (and possibly, but not necessarily navigable);
-mountain borders constituted by a mountain range of more than 1000m height;
-borders with no natural barriers of crossing (called “green” borders).
As a result of the data gathered, 55% of the borders do not constitute any substantial natural obstacle of cross-border transportation and contacts and are so called green borders (see Map 2.9). Such open borders can be found mostly along the new external border of the EU, at the same time substantial natural barriers are to be found mostly along the new internal borders. It was not taken into account whether in a mountainous border region a tunnel or in a river border region a bridge exists which would lead to a potential of high integration. These aspects were combined in the Draft Typology #1 “geographical-physical border typology” which will be introduced later.

ESPON 1.1.3 - Final Report Part 2 109
Map 2.9: Geographical Type Borders

ESPON 1.1.3 - Final Report Part 2 110
Map 2.10: Dimension of economic disparities

ESPON 1.1.3 - Final Report Part 2 111
Ethnic-historical types of borders
Three ethnic-historical types of borders were distinguished for the analysis:
-different ethnic groups: border regions, where the ethnic groups on the two sides of the border are different, they speak different languages, but they live side by side to each other since centuries and normal to good relations have developed between them;
-changed ethnic composition: border regions where the ethnic composition of the population changed substantially during the twentieth century. Border regions are classified to belong to this group, if the majority ethnic group changed in the region during the 20th century.
-same ethnic group: border regions where the majority ethnic group on the two sides of the border is the same. This category was the most difficult to identify. In some countries, there is no statistics about the ethnic composition of the regions. The other difficulty is the definition of border regions. In several countries, NUTS3 regions comprise large areas, far beyond the proper border zones. In some countries it is a deliberate intention to define and delineate administrative regions in a way that in none of them should the ethnic minority constitute the majority.
The results summarised in map “ethnic-historical types of border regions” in Annex C show that 70% of the border regions (84 out of 118 border regions) are dividing different ethnic groups which lived there for centuries, 22% are border regions where ethnic composition changed substantially during the 20th century (mostly Polish, Czech and Lithuanian) and there are only 8 regions in the whole enlargement area where the majority ethnic group is the same on both sides of the border.
Density of road border crossing points
In the analysis, border-crossings are defined as international road border crossings, permanently crossable for citizens of every nation. Border crossings, crossable only for citizens of the two neighbouring countries and open only on certain days, or for some hours are not considered. The regional breakdown of the length of border is the result of estimations, because official data on every country are not available. The indicator is: border-crossing points per 100 km of border. The reason for choosing this indicator and not the reciprocal one (border length per crossing) is that there are several regions, where no crossing exists and division by zero is an undefined mathematical operation.

ESPON 1.1.3 - Final Report Part 2 112
The results show (see map “density of border crossing points” in Annex C) that even now, there are still nine NUTS3 border regions in the enlargement area existing where there are no international road border crossings: three in Bulgaria and Romania, 2 in Poland and 1 in Lithuania. The highest density of border crossings can be found – despite the unfavourable geographic conditions – in Slovenia, the lowest in Romania and Bulgaria.
It is important to point out that the density of border crossing points does not say anything about actual usage, capacity, usability for different groups and quality of infrastructure. Furthermore within this analysis no data was gathered for crossing the borders by rail or ships.
Degree of economic disparities
From the economic point of view, the decisive criterion is the size of the gap in economic welfare and development level between the two sides of the border. So the development level as a percentage of the EU15 average was used whereby the quotient of the two numbers on both sides of the borders was the number classified. Map 2.10 shows that the largest gap exists on the new and former external border of the EU. The income gap between the respective countries was 2:1 as an average: in the case of Poland, Hungary and Slovakia larger, in the case of Slovenia and the Czech Republic smaller. In the case of Hungary and Slovakia, however, the gap at regional level is substantially smaller, because the most developed regions of Hungary and Slovakia and the least developed region7 of Austria, Burgenland meet at the border.
Membership in transnational activities (see Annex C for more detailed information)
There are 118 border regions and 63 regional cross-border cooperation organisations (58 Euroregions and three transnational Working Communities) in enlargement area. The “density” of this type of organisation is even higher than in the Western part of Europe. Unfortunately, the actual progress in cross-border developments and cooperation is not always keeping pace with the development of the organisational framework. (Actually, there are Euroregions on some border sections, where there is no international border crossing point in the region).
7 Based on regional GDP data of EUROSTAT

ESPON 1.1.3 - Final Report Part 2 113
More than 90 percent of the border regions are members of one or more of these organisations. In the Czech Republic, Estonia, Poland, Slovakia and Slovenia, actually all border regions are members of one or more organisation. 28 regions are members in two, 4 regions in three organisations. It means that there are also overlapping Euroregion organisations, especially in the Baltic states and in Southeast Europe. Membership in Working Committees (Arbeitsgemeinschaften) is less complete. The reason for this is, that there are only 3 such organisations in the enlargement area, with geographically clearly defined activity areas: the Alps-Adriatic Working Community, the Danubian Regions Working Committee and the Carpathian Euroregion. The name of the letter is though Euroregion, but its size and activities can be clearly defined as Working Committee.
It must be emphasised that the membership alone does not say anything about the quality and quantity of activities going on within the Euregions and Working Communities. Especially with regard to Euregions it is known that there are rare cases where they only exist on paper and have nearly no implementation stage reached so far.
Coming to a typology
The second step takes four of the components described above as the basis in order to develop first draft typologies of border regions8. In order to illustrate how the results can be presented in a more comprehensive way, two versions of a “draft border typology for integration potential” have been elaborated.
Based on the assumption that any kind of typology has to be related to the context of its usage the following double approach tries to summarise the observed characteristics in two different ways. The first one addresses physical characteristics that may be considered to be related with infrastructure policy interventions. The second one addresses socio-economic disparities as the target of structural policies and transnational activities.
From that point of view it is just necessary to keep the typologies separated. The rationale for the integrated typology is as follows:
8 The indicator ‘ethnic-historical type of borders’ is not applied in the integrated typology because of its
empirical weakness and ambiguity.

ESPON 1.1.3 - Final Report Part 2 114
Table 2.9: Dimensions and criteria
Dimensions Criteria
Starting position Density of border crossing
points
Intensity of transnational
activities
Potential for change Geographic type of border Economic disparities
… applied in Draft Typology 1 … applied in Draft Typology 2
The following tables show two different approaches (version 1 and 2 typology) used in order to come to different types of border regions.
Table 2.10: Draft Typology # 1: border typology for integration potential –
geographical-physical border typology
Potential for change
Starting position
High:
Green border
Low:
Mountain/River border
Good: High density of border
crossing points
Forerunners of
integration
Hardworkers of
integration
Bad: Low density of border
crossing points
Candidates of
integration
Handicapped for
integration

ESPON 1.1.3 - Final Report Part 2 115
Map 2.11: Draft Typology # 1: border typology for integration potential
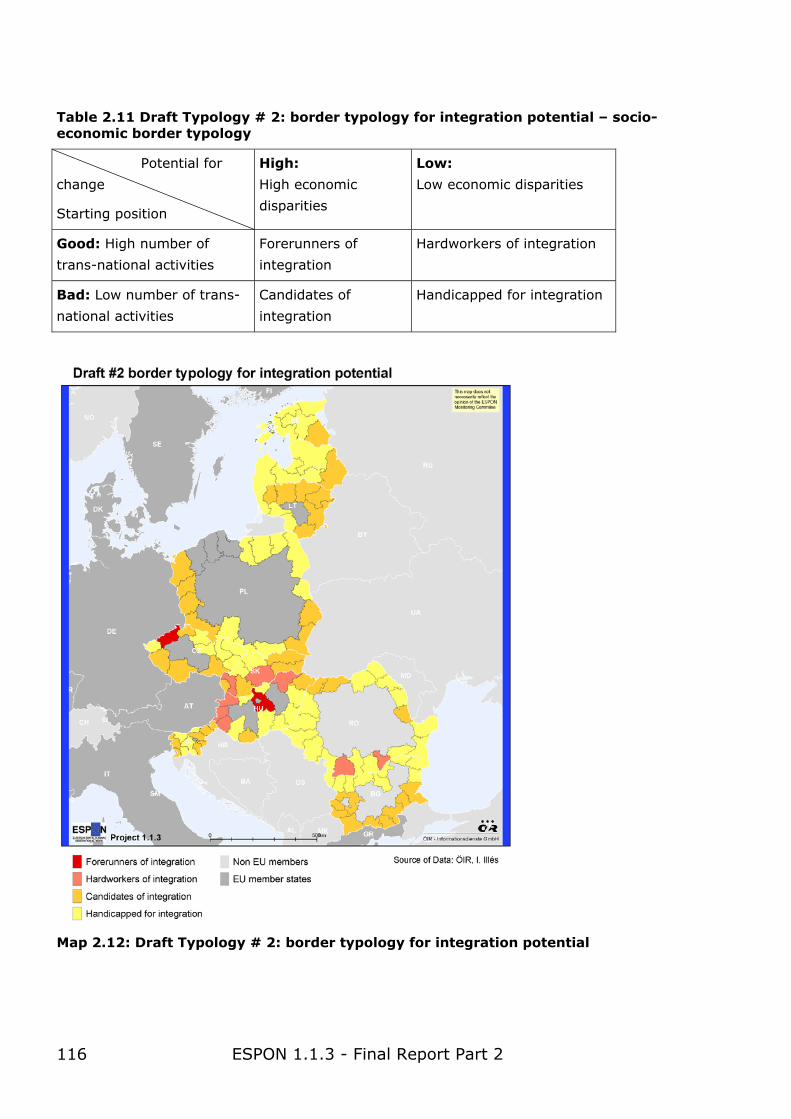
ESPON 1.1.3 - Final Report Part 2 116
Table 2.11 Draft Typology # 2: border typology for integration potential – socio-economic border typology
Potential for
change
Starting position
High:
High economic
disparities
Low:
Low economic disparities
Good: High number of
trans-national activities
Forerunners of
integration
Hardworkers of integration
Bad: Low number of trans-
national activities
Candidates of
integration
Handicapped for integration
Map 2.12: Draft Typology # 2: border typology for integration potential

ESPON 1.1.3 - Final Report Part 2 117
2.9.2 Comments to geographical-physical and socio-economic border region typologies
The results of the first attempt developing a typology of the border regions in the two maps might be considered pretty appealing9. Obviously, the pictures have kind of a seductive effect concerning immediate policy usability. Therefore, from a scientific point of view a warning may be useful: one has to keep in mind some of the conditions crucial for developing the pictures:
1) Some relevant criteria are missing, as e.g. rail border crossings, shipping relations represented by harbours
2) Already the comments on the single criteria recorded – see a) – contain some restraining indications
3) The assignment of the regions to four types (two times) means an additional reduction of information – not to say simplification
4) Some of the assignments might be questioned, as e.g. that high economic disparities imply a higher potential for change than low
5) Some neighbouring border regions of two different countries fall into different classes/types although the (common) criteria are just the same on both sides of the border (e.g. density of border crossings) – only because of differing border lengths and territorial features of the two regions to which the data are related
What has been said above under a) concerning separated typologies for different usages proves true by the comparison of two examples. The border region HU 031 Györ-Moson-Sopron appears both in the #1 and #2 typology as a ‘hardworker of integration’. This is the result of having a ‘green border’ with Austria, a ‘river border’ with Slovakia and showing an average density of border crossing points on the one hand, and showing low economic disparities and a high number of transnational activities on the other hand.
Contrary to that, the border region CZ 080 Ostravsky appears in the #1 typology as ‘forerunner of integration’ due to a ‘green border’ and a high density of border crossing points, whereas it turns out as ‘handicapped for integration’ in the #2 typology, because of a low number of transnational activities and low economic disparities.
9 This effect might be supported by the names given to the types (‘forerunners’, ‘hardworkers’ of
integration ...). In a way they function as appetizers to enforce the expectations for such a typology. However, at the first attempt the empirical and methodological shortcomings still to be solved do not justify a policy usage of the results illustrated.

ESPON 1.1.3 - Final Report Part 2 118
Thus, a further integration of the two typologies into one has been omitted, because it is quite unclear what the added value of integration into one single typology should be. The methodological concerns mentioned above would multiply in any case.
To sum up, despite of considerable shortcomings the experiment :
• Illustrates anyway that the situations along the borders of CADSES differ substantially and represent a huge variety of situations, that never could be covered by one single strategy or policy instrument.
• Shows the feasibility of certain typologies for certain policy applications -presumed better empirical support.
2.9.3 Future research questions
Faced with the expectation to outline an efficient way research should proceed in order to be usable for policy makers the basic assumption is that a kind of an own ‘border regions policy’ is envisaged. The shortcomings and weaknesses identified by this first analysis represent at the same time the starting points for further research improving the empirical basis and tailoring a methodology coming up with the variety.
Further research endeavours may be differentiated referring to
1) empirical data
2) indicator building
3) theoretical rationale
1) Complement and improvement of empirical data – additional inquiry
As one example for that kind of objective may be serve the indicator ‘Density of road border crossing points’. It should be possible to survey additional data about actual usage, capacity, usability for different groups and quality of infrastructure. Another example is to collect data about existing mountain passes and tunnels as well as bridges overcoming the natural barriers of mountain ranges and rivers. In addition the compilation of rail border crossings and shipping relations (harbours) would be desirable.

ESPON 1.1.3 - Final Report Part 2 119
2) Indicator building – methodological rationale
Methodological provisions are necessary to avoid distortions of indicator values only by the differences of the reference areas at both sides of the border (see the issue mentioned above).
3) Theoretical argument
The qualification and assessment of the potential for change in two adjacent border regions referring to the economic disparities between them needs a sound theoretical justification. This in turn leads to the request of more information about the economic structure and endowment of the regions. Is the economic structure likely to make the regions at the two sides of a border rather competing (concerning e.g. development funds, infrastructure investments, labour force) than complementing each other (e.g. R&D).
Sources for additional information useful for improving the assessment of border regions’ integration may be found in the results of some ESPON projects. In particular this is true for:
ESPON 3.1 “Integrated tools for European spatial development” – Regional Classification Analysis (RCE)
ESPON 2.4.2 “Integrated analysis of transnational and national territories based on ESPON results” – Further developed approach of RCE
ESPON 2.2.2 Territorial effects of the ‘Aquis communitaire’, pre-accession aid and Phare/Tacis/Meda programmes” – Potential oriented Cluster Analysis
2.9.4 Conclusions regarding border regions
There is no question that border regions play a crucial role within the process of integration striving for territorial cohesion. In particular this is true for the enlargement area with its outstanding significance of borders and territorial disparities compared to the EU15. Thus, the border regions of the new member states and accession countries are to be considered disposing of a specific ‘regional capital’ referring to the integration potential

ESPON 1.1.3 - Final Report Part 2 120
of the countries involved and the EU at the whole. This ‘regional capital’ may be considered sometimes virtually hidden.
Therefore, analysis focussed on border regions makes a lot of sense in terms of policy efficiency. Although the first analysis shows considerable shortcomings of relevant data, in particular concerning the geographic-physical conditions constituting barriers. What may be considered for the availability of physical territorial data availability in general, comes to a head concerning the border issue. The results of the analysis presented in this report, illustrating the rather differentiated conditions in the border regions of the enlargement area, are considered a first valid and attractive information.
As a second step two typologies have been developed. It is plausible to try to process the criteria values recorded in the analysis in a next step in a typology of border regions. But there (in the context policy oriented research) the question raises: for what kind of policy application should serve the typology, as typology always means focussing, if not to say reducing information.
Thus, typologies have to have a reference to the certain policy areas envisaged for application. Without any doubt, Community policy areas with territorial impacts, as e.g. Structural Funds, TEN and transport policy, CAP, R&D, have to be considered addressees, requested to take into account the specific situation and potentials of border regions. This makes a selection of relevant criteria and respective classification of border regions necessary (it means a crucial difference, whether infrastructure measures or treatment of cross-border labour market regulations or accessibility of higher education should be addressed). On the other hand, in case a specific border regions policy instrument has to be addressed (e.g. in the framework of SF), again a selection of criteria connected to the measures envisaged is necessary.
The lesson learned out of the typology exercise is that any kind of policy application needs its own typology. With other words, the respective policy application needs to be indicated as a constituting condition for the design of a certain typology. Without such a focus typologies – in the context of policy oriented research – could turn out not only opaque but also irrelevant. Thus we plead for several typologies tailored to the respective purpose instead of trying to achieve one single border regions typology that may be an interesting methodological exercise but would not serve any operating user.

ESPON 1.1.3 - Final Report Part 2 121
2.10 Border region illustrations from the “ground”
In order to “test” the feasibility and validity of the typologies and to enrich the border region study, we present two illustrations of cross-border regions covered by the typologies: The Hungarian-Slovakian border regions and the Greek-Bulgarian border regions.
2.10.1 Hungarian – Slovakian border region
The illustration is based on the Planning Study of the Hungarian – Slovakian Border Region, a probust of the joint program undertaken in 1999-2004, to the commission of the Hungarian Office for Spatial and Regional Development and the Slovakian Ministry of Construction and Regional Development, by VÁTI (Hungary) and SAŽP Urbion (Slovakia).
The Hungarian–Slovakian border region stretches along the whole northern border of Hungary and southern border of Slovakia.
The integration potential in the border region is strengthened by the following factors:
• Both countries are new member states of the EU.
• The countries share the experience of the same political and economic system after World War II.
• There is no language difference in the region, especially in the communities along and near the border.
The Border Region comprises the following administrative areas:
• krajs (regions) of Bratislava, Trnava and Nitra in the west, Banská Bystrica in the middle, and Košice on the eastern side of Slovakia, and
• Counties of Győr – Moson – Sopron, Komárom – Esztergom in the west, County Pest and Budapest the capital city in the middle, and Nógrád, Heves and Borsod – Abaúj – Zemplén County in the eatren side of Hungary.
The number of population in each kraj is the following:

ESPON 1.1.3 - Final Report Part 2 122
Table 2.12
Bratislavský kraj 599 015
Trnavský kraj 551 003
Nitriansky kraj 713 422
Banskobystrický kraj 662 121
Košický kraj 766 012
In total, 3,291,573 people. 61.2 per cent of the national population of Slovakia.
The number of population by megye (county) is the following:
Table 2.13
Győr – Moson – Sopron megye 435.256
Komárom – Esztergom megye 317.110
Budapest 1739.569
Pest megye 1089.478
Nógrád megye 220.600
Heves megye 326.800
Borsod – Abaúj – Zemplén m. 749.104
The total number of inhabitants in the planning area is 4,877,917: 47.9 per cent of the total national population.
1.) Interpretation of typologies
Draft #1 typology Flow accessibility
Both the western and the eastern parts of the border region belong to the same geographical units of the Carpathian basin. The western, “Transdanubian” parts constitute the so-called “Small Plain” and extend to a hilly area on both sides of the border, whereas the eastern part is a section

ESPON 1.1.3 - Final Report Part 2 123
of the North-Western Carpathian Highland (the eastern sections of the Highlands are in Ukraine and Romania).
In the western part the dividing line is the Danube, in the middle a small section of river Ipoly (Ipel), and further to the east there is no geographical division.
In 1918, when the Carpathian Basin was divided into several parts, including the division of the territory which is now Hungary and Slovakia, in terms of the infrastructure, primarily all the transport connections, were cut, the cross-border road and railroad lines were nearly all lifted. This situation remained (and further deteriorated) up until the end of the 20th century. Since then the connections have been gradually re-established.
On the main road network there are four border crossings in the western and six border crossings in the east, on the railway network three border crossing are in the western and four in the eastern parts on the border region. All are in heavy use and never of sufficient capacity. On the border region of about 400 km east-west width now there are 56 local crossings (either in place or in preparation).
In spite of the geographical barrier, the western part of the border region can be regarded as a “forerunner of integration” due to the capacity and turnover of the border crossings, whereas the eastern part is a “candidate of integration” in need of further capacities of border crossings.
Draft #2 typology Economic disparities
On the Hungarian side the planning area is of heterogeneous character. The metropolitan region of Budapest is in sharp difference from the North-Hungarian Region, which suffers from the impact of industrial restructuring. On this eastern side of the planning area the influence of Budapest is gradually decreasing. Meanwhile the new M3 speedway, the last section of which is currently under construction, has already beneficial effect on development. Towards east – northeast the characteristics of industrial decline and underdevelopment are prevailing stronger and stronger. On the western side of the planning area (along river Danube) development is dynamic. This part of the planning area has multiple contacts with both Austria and Slovakia.
On the Slovakian side the western part of the planning area is determined by the national capital. This is the most advanced and dynamic region of the country. Its very characteristic feature is the vicinity of Austria and of the

ESPON 1.1.3 - Final Report Part 2 124
Austrian capital, in particular. Towards the east the rate of development is gradually decreasing and is centred on cities mainly. Košice is an important, large steel production as well as service centre and a potential multimodal transport node with development potential due to its location advantage. On the eastern part the belt along the national border is characterised by acute problems of development. These problems are felt less in the northern parts, and very intensive in the south and east.
The economic disparities between the Hungarian and Slovakian sides of the border region are therefore not great in many cases. The most advanced part of Slovakia (Bratislava kraj) and the dynamically developing county of Hungary (Győr-Moson-Sopron) are neighbours, and the areas on the eastern side are problem regions in both countries. This similarity does not involve barriers of integration, especially on the western side. Because of relatively higher unemployment and lower wages in Slovakia, there is a substantial, organised commuting from the neighbouring Slovakian NUTS3 regions of Bratislava, Trnava and Nitra to the employment centres Győr in the western border counties (County Győr-Moson-Sopron), Esztergom and Tatabánya (County Komárom-Esztergom) of Hungary.
The County of Pest has somewhat less attraction for the neighbouring krajs of Slovakia (Nitra and Banska Bystrica), except for inter-community activities on the national border. Budapest the capital of Hungary has a wide range of transnational activities with Slovakian cities and regions, especially with Bratislava.
On the eastern side of the border region the situation is different. Here, on both sides of the border industrial restructuring has involved the shrinking of local economy, which is restricted to a few medium-size cities. On the Slovakian side Kosice and the small industrial communities in its neighbourhood have maintained their importance as heavy industrial centres (steel production, energy), though they provide less jobs than before. The city of Kosice is becoming more and more the commercial centre of the northern stretch of the North Hungarian region.
Banska Bistrica is first of all a service centre (tourism, financial services). On the Hungarian side the former centres of heavy industry (Salgótarján and the mining communities in County Nógrád and Miskolc, Ózd and others in County Borsod-Abaúj-Zemplén) have practially lost their former industrial base. Economic recovery and moderate growth can be observed, however, in several small and medium-sized towns. There are great demands for transnational activities and cooperation. Nevertheless, resources are scarce, which puts limits on the satisfaction of this need. Therefore transnational

ESPON 1.1.3 - Final Report Part 2 125
activities are limited to inter-community events, to tourism and to cooperation in landscape management.
From the point of view of the number of transnational activities and economic disparities the Hungarian-Slovakian border region can be regarded as a “hardworker of integration”. Actually, this term is very appropriate for this region, in view of the great efforts on both sides of the border, to strengthen links and cooperation.
An important aspect determining the links in this region are the cultural and language commonalities. They share the same cultural background and speak and understand each other’s language (particularly the Hungarian language, and there are also Slovakian minorities in Hungary). Therefore there is an interaction in the use of cultural and educational facilities, especially since the establishment of the Hungarian University in Komarno, Slovakia.
2.10.2 Greek-Bulgarian border regions
The EU border regions analysis using an appropriate typology highlighted very satisfactorily the nature of barriers and the potential for change in the regionsm which are of crucial importance for transnational integration of the new member states into the EU.
As it is recognised, the typology used should be further elaborated referring to empirical data, indicator building and theoretical rationale. On the other hand, it is obvious that results of the above exercise present several insufficiencies which come from, in our opinion, the fact that some crucial spatial restructuring processes in EU border regions during the accession process (before and after the official accession) should inevitably be studied in more depth using additional official data not available until now in ESPON and others which are not recorded in the official statistics. This need could be covered by case studies. Therefore, case illustrations could contribute substantially to a second step of elaboration of a border regions typology as well as to further enrich the conclusions concerning the barriers and potentials in border regions and, therefore, to enrich the relevant policy implications and recommendations.
This case illustration of border regions of Greece-Bulgaria concerns borders between a country of the EU25 and a country of the next round of the EU accession in 2007. Since we know now that Bulgaria will be included in the EU in 2007, the spatial interactions between the border regions of the two

ESPON 1.1.3 - Final Report Part 2 126
countries have some elements in common with the cases of border regions within the current EU25.- Non EU countries and have some other elements in common with the border regions between the EU15 and the EU10 (accessed in 2004).
In any case, many elements of the above interaction are representative of a lot of important aspects of the socio-economic and spatial interactions between border regions during the enlargement process. We will focus on these widely representative interactions.
We will further discuss the different types of barriers (geographic, ethnic- historical etc) identified in the first section of this chapter, on the socio- economic and spatial development barriers and possibilities.
The border region of Greece consists of almost all of the Region of Anatoliki Makedonia-Thraki, and includes the prefectures (Greek “nomoi”) (NUTS3) of Drama, Xanthi, Rodopi, and Evros and part of the Region of Kentriki Makedonia, which includes the prefecture (NUTS3) of Serres (Figure 2.18).
For Bulgaria, the border region consists of the South Central (Yugo Tsentralen) Region which includes Kardzhali, Smolyan and Haskovo Prefectures (NUTS3) and of the South West (Yugozapaden) Region, which includes the Prefecture of Blagoevgrad.
Geographic type of borders
From geographic aspect, barriers between the Greece-Bulgaria border constitutes a mountainous area with a few natural passages, and which are crossed by important, but non navigable rivers, as the Nestos river.

ESPON 1.1.3 - Final Report Part 2 127
Figure 2.18: Greece- Bulgaria Border Regions: administrative units (NUTS2, NUTS3), population of the Functional Urban Areas (FUAs) 2000.
Source: NTUA Workgroup. Source of the data for the FUAs population 2000: ESPON 1.1.1 project
Ethnic-historical types of borders
The border between Greece and Bulgaria constitutes simultaneously a national barrier and a historical barrier. The residents of two border regions speak different languages.
2.10.2.1 Degree of economic disparities – economic interactions during the accession process
Population
The total population of the border NUTS3 areas of Bulgaria (2004) is about 900.000 inhabitants. The total population of the corresponding NUTS2 areas is about 4.050.000 (Table 2.14- 2.15).

ESPON 1.1.3 - Final Report Part 2 128
Table 2.14: Population of the border regions
(Bulgaria - for the year 2004, Greece - for the year 2004)
Regions NUTS2, NUTS3* Total
Bulgaria
South Central (Yugo Tsentralen) 1 933 271
Kardzhali 159 878
Smolyan 133 015
Haskovo 268 335
South-West (Yugozapaden) 2 114 815
Blagoevgrad 334 907
Total of Border regions 896135
Greece
East Macedonia and Thrace 611067
Evros 149354
Rodopi 110828
Xanthi 101856
Drama 103.975
Central Macedonia 1871952
Serres 200916
Total of Border region 1666929
* Bulgaria: NUTS2: programme regions, NUTS3: districts, Greece: NUTS2: administrative regions, NUTS3: prefectures (nomoi) Source of data: Population census Greece 2001 Bulgaria 2004

ESPON 1.1.3 - Final Report Part 2 129
Table 2.15: Border regions: Regions codes, population by sex
(Bulgaria - for the year 2004, Greece - for the year 2001)
Regions NUTS2, NUTS3 Total
Code Total Male Female
Bulgaria
South Central (Yugo Tsentralen) BG22 1 933 271 940 653 992 618
Kardzhali BG226 159 878 79 129 80 749
Smolyan BG225 133 015 64 602 68 413
Haskovo BG223 268 335 130 617 137 718
South-West (Yugozapaden) BG21 2 114 815 1 016 316 1 098 499
Blagoevgrad BG213 334 907 164 708 170 199
Total of Border regions 896135
Greece
East Macedonia and Thrace GR11 611067 305.947 305.120
Evros GR11 149354 78.233 71.121
Rodopi GR113 110828 54.209 56.619
Xanthi GR112 101856 50.739 51.117
Drama GR114 103.975 51.107 52.868
Central Macedonia GR12 1871952 922.393 951.821
Serres GR126 200916 99.968 100.948
Source of data: Population census Greece 2001 Bulgaria 2004
The total population of the border NUTS3 areas of Greece (2001) is about 1.670.000 inhabitants.
The population density is slightly higher at the NUTS3 border regions of Bulgaria (2001), ranging from 37 (inhab./Km2) at Smolyan and 66 at Haskovo (it is even higher at the NUTS2 regions: 103 in the South West and 71 at the South Central region) (Table 2.16).

ESPON 1.1.3 - Final Report Part 2 130
Table 2.16: Surface and population density of the border regions
Regions NUTS2 Surface Population density
Bulgaria 71.3
Yugozapaden (SW) 103.4
Kardzhali 4101,0 39,0
Smolyan 3615,6 36,8
Haskovo 4041,6 66,4
Yuzhen Tsentralen (SC) 71.8
Blagoevgrad 6573,1 51,0
Greece 83.1
Anatoliki Makedonia and 42.3
Evros 4014,4 37,2
Rodopi 2516,4 44,0
Xanthi 1760,3 57,9
Drama 3467,1 30,0
Kentriki Makedonia 100.0
Serres 3961,7 50,7 Source of data: For NUTS2 regions EC, Third Cohesion Report, 2003, For NUTS3 regions our calculations
At the corresponding regions of Greece the population density ranges between 30 inhab./Km2 at Drama and 58 inhab./Km2 at Xanthi. The density of the NUTS2 region of Anatoliki Makedonia and Thraki amounts in 42 inhab./Km2. It amounts in 100 inhab./Km2 at the NUTS2 region of Kentriki Makedonia in which Thessalonica is situated.
Economy
In the period 1995-2001 the GDP in the two NUTS2 regions of Bulgaria remained almost stable: 1,0% change per year in the South West region and -1,7% in the South Central region. In Greece, on the contrary, the GDP in the NUTS2 regions increased with satisfactory average rates per year of 2,5% for Anatoliki Makedonia-Thraki and 4,2% for Kentriki Macedonia (in which Thessalonica is included).
GDP disparities between the two countries’ border regions remain exceptionally high. In 2001 the GDP per capita (PPS) of the two NUTS2 Bulgarian regions in relation to the EU25 average (EU25=100) was 39,9 for the SW and 23,8 for the SC. The corresponding indicators for the two NUTS2 Greek regions were more than double: 58,6 for AM-T (Anatoliki Makedonia-Thraki) and 73,6 for KM (Kentriki Macedonia).

ESPON 1.1.3 - Final Report Part 2 131
Table 2.17: GDP / head (PPS) of the border regions
Source of data: EC, Third Cohesion Report, 2003
Employment
The employment rate (2002) (ages 15-64 as % of pop. aged 15-64), is higher in An. Makedonia and Thrace (GR): 58.6% than in South Central (BU) :49.9%. (Table 2.18)
Table 2.18: Employment rate of the border regions
Regions NUTS2 Employment rate
Total Female Male
Bulgaria 50.6 47.5 53.7
Yugozapaden (SW) BG21 56.4 53.9 58.9
Yuzhen Tsentralen BG22 49.9 47.5 52.4
Greece 56.7 42.5 71.4
Anatoliki Makedonia, GR11 58.6 46.6 71.4
Kentriki Makedonia GR12 54.2 39.3 70.1
Source of data: EC, Third Cohesion Report, 2003
The employment in Bulgaria (2002), which covers the largest part of the cross border region NUTS3 is limited - 12% in Agriculture, remarkable in Industry – 35%- and important -52,7%- in Services. (Table 2.19)
The Greek region which covers the largest part of the cross border region NUTS3 is more agricultural: 35,5% in Agriculture, only 20% in Industry and 44,5% in Services.
The NUTS2 regions SW of Bulgaria and K. Makedonia (in which Thessalonica is included) of Greece are more specialised in services than the other two regions.
Regions NUTS2 GDP growth 2001, Average 1999- 2001, EU25=100
Bulgaria 0.0 26.0 24.9 28.6
Yugozapaden (SW) 1.0 36.3 33.9 39.9
Yuzhen Tsentralen (SC) -1.7 21.7 20.7 23.8
Greece 3.5 67.1 66.3 73.7
Anatoliki Makedonia, Thraki 2.9 53.4 52.9 58.6
Kentriki Makedonia 4.2 67.1 66.5 73.6

ESPON 1.1.3 - Final Report Part 2 132
Table 2.19: Employment by sector of the border regions
Regions NUTS2 (% of total), 2002
Agriculture Industry Services
Bulgaria 9.6 32.7 57.7
Yugozapaden (SW) 3.3 31.4 65.2
Yuzhen Tsentralen (SC) 12.3 35.0 52.7
Greece 16.1 22.5 61.5
Anatoliki Makedonia, 35.5 20.0 44.5
Kentriki Makedonia 16.2 24.9 58.9
Source of data: EC, Third Cohesion Report, 2003
Socio-economic and spatial interactions
Basic elements of the Greek border region are that:
(a) It is facing important development and restructuring problems in the rural/ agricultural sector, which causes loss of jobs.
(b) It is facing important development problems in industrial sector which have considerably worsened because of the increasing shift of industries over the Bulgarian border regions. A significant number of Greeks working in industry are being replaced by Bulgarians who are engaged with lower wages.
Basic elements of the Bulgarian border region are:
(a) It faces important development problems in the rural sector
(b) The industrial sector has been shrinking during the transition to the free market economy and the result is loss of jobs.
The total loss of jobs leads to immigration mainly to Greece and particularly to Greek border regions.
Beyond the above elements, consequences of Bulgaria’s transition to the free market economy, which have become more intense since Bulgaria has become an accession country are:
Greek Direct Investments (DI) in Bulgaria was increased from about 3 millios USD on average in three-year period 1992-1994 to about 200 million

ESPON 1.1.3 - Final Report Part 2 133
USD on average in four-year period 2001-2004. Greek DI is directed at 40% to industry, at 32% to trade, at 24% to services (particularly important is the presence of Greek banks) and at 4% to Construction.
Greek DI in industry concern to a large extent Greek enterprises located in the Greek border region which either transfer their industrial unit (s) in Bulgaria (more usually in the Bulgarian border region) or they found new units in Bulgaria. Special mention should be made of the transfer of clothing factories (about 80) which profit mostly from the low wages in Bulgaria10. It should be emphasized that immigration of Bulgarian workers to the Greek side as well as the level of wages paid to them are not very controlled. These workers are often employed in the “informal economy” sector.
Commercial exchanges between the two countries, tourist flows (particularly from Greece to Bulgaria) and Greek private investments in real estate in Bulgaria were increased substantially. Mainly during the last two years, the number of residents of the Greek border region who gooes to the opposite side in order to be supplied with commercial products and services in lower prices has increased.
Some aspects of the above interactions between the two border regions, particularly the shift of industries from the Greek border region to the Bulgarian one and the presence of Bulgarian workers with low wages in the Greek border region have created tensions which are representative of tensions that are presented generally in EU in the current period immediately after the enlargement with the ten new countries.
The first section of this chapter, based on the criteria of economic disparities and transnational activities (starting position and potential for change), classified all of the territories of the border region of Bulgaria as Candidates of integration11.
According to the present case study findings, a more in-depth estimation can be done. Because the interactions with the Greek border region are growing very fast (as well as the stricto sensu transnational activities – see in next
10 According different organisations of Greece - Bulgaria economic cooperation, up to today, in Bulgaria,
about 1.000 Greek or mixed Greek-Bulgarian enterprises have been founded, 450 from which are activated in the sectors of trade, industry of food, brewery, clothing, foot ware, medicines and hospital equipment, tyres, plastic, chemical products, steel production, energy, transports, services, telecommunications and tourism. It is estimated that the employment in these enterprises ranges in about 22.000; most of them are occupied in factories, mainly in the Southern Bulgaria where 80 Greek companies of clothing production work for their customers who come from the Western Europe and the USA.
11 Because they combine: High economic disparities and Low transnational activities.

ESPON 1.1.3 - Final Report Part 2 134
chapter), the characterization “Forerunners of integration”12 could be more appropriate for the entire Bulgarian border region.
The urban systems (including major transport links) and their interaction exhibit the following patters:
• The urban centers of the Greek border region are relative as related to the population: The most important centers are: Serres: 56100 inhabitants (pop. 2001), Drama: 55600, Xanthi: 52300, Komotini: 52700 Alexandroupoli: 52700 and Orestiada: 21.700. All these urban centres are classified as regional/local FUAs according to the ESPON project 1.1.1 criteria. We should note that there is a University in the Thraki region with installations in Komotini, Xanthi and Alexandroupoli. Alexandroupoli allocates an important harbour. This, as Kavala’s, constitutes access points to the Bulgarian side in the Aegean Sea.
• The urban centres of the Bulgarian border region are more important than the Greek ones in terms of population: Blagoevgrad: 78.100 (pop. 2004), Petirich: 57.700, Kardjali: 69.800, Haskovo 99.200 and Smolyan: 47.200. The first four are classified by ESPON project 1.1.1 as regional/local FUAs.
All the above Greek cities are connected immediately or indirectly with the important motorway "Egnatia" which connects the Western “gate” of Greece (Igoumenitsa) with the Eastern one.
The road network of the Bulgarian border region is less powerful. The upgrade of road axes to Bulgaria, vertical to the Egnatia Road, which will interlink very satisfactorily the urban systems of two border regions, is imminent.
Finally, Thessalonica has a very important role in the urban system of the Greek border region and a small but increasing role in the urban system of the Bulgarian border region. This role will be probably increased enough in the future. Sofia has considerable influence in the urban system of the Bulgarian border region; however, very limited in the Greek urban system.
12 Because they combine: High economic disparities and High transnational activities. In our opinion, it is
not easy to choose between the two characterizations: “Candidates of integration” and “Forerunners of integration”

ESPON 1.1.3 - Final Report Part 2 135
Density of road border crossing points
Nowadays, there are three important cross border points. Two of them are older while the third one (Exohi – Ilinten) was inaugurated in June 200513. However, the roads that span them need improvement.
The first section of this chapter, based on the criteria of density of border crossing points (starting position and potential for change), concludes that three of the territories of the border region of Bulgaria: Blagoevgrad, Smolyan and Kardzhali are handicapped for integration and the fourth, Haskovo, is forerunner of integration.
According to our analysis, the total length of the border line amounts in 410,5 Km. Taking into account the creation of the new border crossing point, two crossing points could be used by the inhabitants of Blagoevgrad, Smolyan and Kardzhali, that means they are now better served.
We should stress, more in general, that the influence of the density of the road border crossing points is undoubtedly important. However, according to the present case study analysis, this influence is lower then that of the economic disparities and transnational activities.
Membership in transnational activities
The Greek border regions have participated very actively in transnational activities. The Bulgarian border region had lesser, but still satisfactory participation. The numbers of bilateral collaborations and of participations of both sides in transnational activities are high. INTERREG IIIA of Greece - Bulgaria prioritised the following sectors: trans-border infrastructures, economic development, employment, quality of life, environment, tourism and culture. Cooperation in transnational spatial development planning is supported by the ESTIA and ESTIA SPOSE projects covering areas located in CADSES. Although these two last projects as wide transnational activities promoted transnational governance and specifically focus on spatial planning, cooperation of the two border regions in spatial planning activities remains extremely weak compared to the needs created by the rapid changes in spatial interactions between the two border regions.
13 The driving of the relevant tunnel was financed by INTERREG.

ESPON 1.1.3 - Final Report Part 2 136
2.10.2.1 Conclusions/ Some recommendations for the improvement of the border regions typology
As we have already stressed, according to the present case study findings, the “economic disparities/transnational activities” typology plays a more important role in the Greek-Bulgarian case, as components of the trans-border interaction/integration than other components. High levels of economic disparities between the border regions represent a great potential for fast economic integration.
High levels of unemployment and low wages are very usual in border regions of the EU10, Bulgaria and Rumania and the neighbouring countries. These factors considerably speed up the transfer of both enterprises and workers between the two sides of borders. Therefore, we should use in the analysis of the evolution of the trans-border integration an important number of socio- economic indicators in a diachronic basis. It would also be desirable to use indicators referring to the workers and enterprises flows between the two sides, although this data is not available on the European scale.
Finally, the “membership in transnational activities” should be enlarged in scope so as to include all the transborder/transnational cooperation / governance aspects. In this section, more emphasis should be given in the trans-border / transnational spatial planning for strategic development.

ESPON 1.1.3 - Final Report Part 2 137

ESPON 1.1.3 - Final Report Part 2 I
PART 2 Results of the Project
Chapter 3

ESPON 1.1.3 - Final Report Part 2 II

ESPON 1.1.3 - Final Report Part 2 III
Table of Contents for Part 2 Chapter 3
3 Polycentricity and Enlargement 138 3.1 The new peripheries of Europe 139 3.2 Polycentricity and goal conflicts 140 3.3 Rethinking some aspects of polycentricity 142 3.3.1 A polycentric picture of the new member states 147 3.3.1.1 Polycentricity in transnational regions: New possibilities
with enlargement 150 3.3.1.2 A potential Baltic Sea Integration Zone? 151 3.3.1.3 A potential SE Europe / Balkans Integration Zone 154 3.4 How to measure polycentricity in the enlarged Europe 157 3.4.1 National polycentricity 158 3.4.2 European polycentricity 169 3.4.3 Conclusions 172 3.5 Illustration: Polycentricity in Slovenia 173 3.5.1 Polycentric development of Slovenian urban system 174 3.5.2 Interpreting national polycentricity from the “ground” 179
Figures Figure 3.1: MEGAs categories and FUAs in Europe, highlighting the Baltic
Sea Region and the Potential Baltic Sea Integration Zone 152
Figure. 3.2: The Major Urban Systems of the Balkan countries 156
Figure. 3.3: Rank-size distribution of population of FUAs in the new member states and accession countries 160
Figure 3.4: Rank-size distribution of GDP of FUAs in the new member states and accession countries 162
Figure 3.5: Service areas of FUAs in the new member states and accession countries 163
Figure 3.6: Population and accessibility of FUAs in the new member states and accession countries 165
Figure 3.7: Rank-size distribution of population of MEGAs in Europe 170
Figure 3.8: Rank-size distribution of GDP of MEGAs in Europe 170
Figure 3.9: Service areas of MEGAs in Europe 171
Figure 3.10: Population and accessibility of MEGAs 172
Figure 3.11: Polycentric development of Slovenia is based on a balanced urban network with eight functional regions 175

ESPON 1.1.3 - Final Report Part 2 IV
Figure 3.12: Functional urban areas (FUA) and significance of urban centres in Slovenia 177
Tables
Table 3.1: Goal conflicts of polycentricity policies 141
Table 3.2: Classification of FUAs per country of the New Member States 149
Table 3.3: Polycentricity sub-indicators 166
Table 3.4: Value functions of polycentricity sub-indicators 167
Table 3.5: Composition of the Polycentricity Index 167
Table 3.6: Component indices and Polycentricity Index 168
Table 3.7: Functional urban areas (FUA) and significance of urban centers in Slovenia 178

ESPON 1.1.3 - Final Report Part 2 138
3 Polycentricity and Enlargement
“Polycentricity is not a goal in itself but one of the means to achieve policy objectives such as economic competitiveness, social equity and sustainable development” (ESPON 1.1.1 Final Report p. 7-8).
The extensive research performed by ESPON project 1.1.1 has illuminated and operationalised many of the various contexts in which polycentricity as both morphological and functional concepts, but also as a very political concept, play as part of EU, national and regional strategies to operationalise the norms of the ESDP. Thus polycentric development can be considered the key substantive planning concept to achieve the goals of economic and social cohesion, conservation of natural resources and cultural heritage and more balanced competitiveness (ESPON 1.1.1, FR, Part B, p. 20).
As such polycentricity is conceptualised as both an ongoing process and as a normative goal to be achieved and is alleged to help in reducing regional disparities and in increasing competitiveness for integration. Yet it is important to bear in mind that polycentricity at heart is a political concept. While polycentricity is a main research object of ESPON, the verdict is still out if it can reduce economic and social disparities and lead to balanced competitiveness and sustainable development in each and every region in the European territory.
Nonetheless the concept is entrenched in European spatial planning as it is also a highly useful term in the sense that it can be interpreted and operationalised differently at various levels to achieve a multitude of political goals. At the EU level (and sometimes at the national level) polycentricity can be characterised as a norm or something the EU as a whole should pursue, while at lower levels, such as the regional or local levels polycentricity can be operationalised to a greater extent as an planning “tool”. In the long-term, such a tool is related to the morphology of settlement structures of a region, while in the short-term a polycentric strategy can be employed to deal with some of the effects of externalities such as economic cycles and market forces.
This chapter takes both a qualitative and a quantitative view of polycentricity, and builds upon some of the results of ESPON 1.1.1 although we go further into specifying a few of the quantitative and qualitative aspects of polycentricity and relate them to the unique situations of the new member states and accession countries.

ESPON 1.1.3 - Final Report Part 2 139
Processes of globalisation, European integration and enlargement bring to the forefront ideas of polycentric development and the centre-hinterland dichotomy with a focus on territorial networks and transnational and cross-border cooperation. The key theme in the ESDP and the ESPON Programme is that territorial cohesion can be achieved through polycentric development processes and promoting global economic integration zones outside of the “Pentagon”1. Although these zones are largely due to long-term processes of specialisation and economies of scale, they could be facilitated by policy actions aimed at polycentric development and by more intensified cooperation.
Achieving polycentricity at all levels may have inherent contradictions built in. As the 1.1.3 Third Interim Report found, carte blanche policy interventions to achieve polycentricity may lead to conflicts between the goals of competitiveness, cohesion and sustainability at various levels2. Prioritising polycentricity at European level could lead to strengthening the role and function of capital cities in the new member states and accession countries and may well may be the quickest road to economic growth for the regions in this area, but such a focus could prove unsustainable in the long-run when the needs of regions outside of the large metropolitan areas become apparent.
3.1 The new peripheries of Europe
At the European level, polycentricity of the European territory is related to other key concepts such as the classic core-periphery divide. This is particularly relevant for the new member states, many of which, while finding themselves now included within Europe, are still located at the geographical and function peripheries of the EU. Just as is the concept of polycentricity depends on a delineation of a certain analytical level in order to be applicable, so do the concepts of core and periphery. The core-periphery dichotomy is largely a social construction that has been reinforced at the political level and “used to characterise asymmetrical relationships and the disparities of regional systems”3 with its emphasis on distance, difference and socio-economic dependency. According to this construction, the new member states and accession countries tend to be very much on 1 Faludi, A. (2005) Polycentric territorial cohesion policy in Town Planning Review Volume 76,
number 1, 2005. Liverpool University Press. 2 Polycentricity and goal conflicts ESPON 1.1.3 TIR ch.2 p. 21 3 Eskelinen, H., and Snickars, F. (1995) Competitive European Peripheries? An Introduction, in
Eskelinen and Snickars (1995) Competitive European Peripheries. Springer:Verlag, Berlin, Heidelberg, New York.

ESPON 1.1.3 - Final Report Part 2 140
the periphery of Europe, while at the same time making previously peripheral countries, such as Sweden or Austria much more centered in the European space.
Like many concepts or models used to give a spatial sense of the world, what is a core or what is a periphery is largely dependent on which spatial scale lens one is looking through. Each peripheral area has its own core and periphery patterns of functional urban areas and hinterlands. This reinforces again the essentialness of the ESPON three-level approach (macro, meso and micro levels).
Core-periphery models can be geographic, functional, economic, political, social or cultural. Notwithstanding the plethora of conceptualisations of core-periphery, at the heart is the normative notion of the greater developmental potential of the core relative to the peripheral area. However we do not see the core-periphery gap as a barrier to territorial cohesion. Rather we choose a rather neutral position that sees the periphery not as something to be overcome, but as regions that simply have different pre-conditions and potentials than the central areas, as shown in section 3.9 on border regions.
Likewise we do not see the core-periphery conceptualisation as being at odds or being “replaced” with the concept of polycentric development. Since we use neither of these concepts as spatial “models”, the polycentricity paradigm does not replace traditional core-periphery concepts (such as the “blue banana”)4. Rather the two conceptualisations live side by side one another. Polycentric areas on any scale still contain geographic centres and hinterlands. And a peripheral area may in fact be quite polycentric on a regional scale.
3.2 Polycentricity and goal conflicts
Polycentricity is associated with major policy objectives of the European Union: Countries with a polycentric urban system are in general economically more successful and environmentally more sustainable than countries with a dominant capital city, but not necessarily spatially more equitable if also rural regions are included (see ESPON 1.1.1, 2004).
As will be shown in Section 4.3 of this report, the polarisation of the urban systems in the new member states and accession countries has increased
4 Meijers, E. Waterhout, B., and Zonneveld, W. (2005) Polycentric Development Policies in European
Countries: An Introduction in Built Environment, Vol. 31, no. 2. 2005.

ESPON 1.1.3 - Final Report Part 2 141
since their transition from planned to market economies in the 1990s and is likely to further increase in the future.
This creates serious goal conflicts for future EU spatial policy oriented at a balanced polycentric territorial structure of Europe (see Table 3.1). If, for instance, the goal is to strengthen major urban centres outside the 'Pentagon' to ensure European-wide polycentric development, this may increase spatial disparities between the already too dominant capital cities and other large cities in countries such as the Baltic states, Hungary or the Czech Republic. However, if the promotion of balanced urban systems in these countries is a common goal, in line with strategies for national polycentricity, a greater share of Structural Funding and transport infrastructure have to go to medium-sized cities of the new member states, and this may be at the expense of their capitals.
Table 3.1: Goal conflicts of polycentricity policies
Goal Policy Goal conflict
Competitiveness
at global scale
('Lisbon')
Strengthen highest-level global
cities in the 'Pentagon'
Polarisation between the global
cities in the 'Pentagon' and the
cities in the rest of Europe will
increase. The European urban
system will be less balanced and
polycentric.
Territorial cohesion
at European scale
Strengthen major cities outside
of the 'Pentagon'
The competitiveness of the
global cities in Europe may
decrease. The urban systems of
individual countries will be less
balanced and polycentric.
Territorial cohesion
at national scale
Strengthen medium-level cities
in the new member states and
accession countries
Competitiveness of major cities
in the new member states and
accession countries may
decrease.
Sustainability
('Gothenburg')
Strengthen lower-level cities in
the new member states and
accession countries
Competitiveness of major cities
in the new member states and
accession countries may
decrease.
It is the responsibility of the future spatial policy of the European Union to find a rational solution to this goal conflict. This solution cannot be the one-

ESPON 1.1.3 - Final Report Part 2 142
sided pursuit of one of the two conflicting goals at the expense of the other. Rather, the task is to develop a balanced strategy which is differentiated in both space and time and takes account of the specific needs of different types of regions. We explore one such possible strategy as a policy recommendation in Chapter 5 of this report.
3.3 Rethinking some aspects of polycentricity
Our purpose here is to put the ESPON work on polycentricity into a wider approach in line with the theme of competition vs. cohesion and goals of the ESDP, in order to better discern firstly the contributions of ESPON 1.1.15 and the components of polycentricity which have not been investigated by ESPON 1.1.1 and other projects. It must be mentioned that while we re-think many of the aspects of polycentricity in this section based on theoretical and qualitative information, time and budget constraints have made it impossible to conduct the analyses needed to substantiate the comments by in-depth studies. However what we would like to demonstrate is that there is a plethora of approaches to polycentricity and our goal is to widen the scope to those areas that could be of special importance to the situations of the new member states and accession countries, as well as to point out issues ripe for further research.
Worldwide and more particularly European spatial development during the two or three last decades creates new territorial patterns and therefore novel territorial problems and potentials. The ESDP attempted to address these problems and potentials through a normative spatial strategy aiming at better territorial competitiveness, cohesion and sustainability. Polycentric development objectives are used to operationalise the rather imprecise aims of the ESDP- therefore it is more appropriate to divide the discussion of the polycentricity in the context of the ESDP in three parts dealing, respectively, with the polycentricity aspects of competitiveness, cohesion and sustainability. In this sense we go a bit deeper into the potential goal conflicts inherent in the competitiveness (efficiency) and cohesion (equity) aspects of polycentricity described in the previous section (3.2).
Competitiveness and polycentricity In spatial development terms, cities (and urban networks) are the main factor creating and, at the same time, polarising spatial development. Cities are not only growing faster than their adjacent territories but they often
5 “The role, specific situation and potentials of urban areas as nodes in a polycentric development”
ESPON 1.1.3 - Final Report Part 2 143
diffuse development in their wider territories, multiplying the development of the respective regions. Therefore, the development of cities (and urban networks) explains to a considerable extent the emergence of territorial disparities as well as patterns of convergence.
Until the 1960s the development of a great number of dynamic cities was based on industrial development. This trend continued on slightly longer in many of the new member states and accession countries. A more limited number of cities, the international metropolises, although they often retained a developing industrial sector, were beginning to base their development on high level activities as the decision-making functions, or RTD (Research-Technology-Development) activities etc. In the new framework of globalisation (and European integration) which is related to the growing influence of new technologies (focused mainly in Information/Teleinformatics/Internet activities), much research has attempted to determine the new factors making the cities and to a greater extent, metropolitan regions, more dynamic and influential, particularly in light of the Lisbon goals to make Europe the most dynamic, knowledge-based economy in the world.
It is widely accepted that globalised networks influence a growing number of cities. As Sassen6 (2002, page 8) argues: “A growing number of cities today play an increasingly important role in directly linking their national economies with global circuits. As cross-border transactions of all kinds grow, so do the networks binding particular configurations of cities. This in turn contributes to the formation of new geographies of centrality in which cities are the key articulators”. These new centralities as a main factor of a new hierarchy of cities/urban networks determining the territorial development disparities, obliges us to reformulate the empirical criteria/ indicators used to assess territorial disparities.
Let’s make a brief description of these criteria/ indicators. We could include in a first category the dynamic/multiplier factors that are more related to the impacts of cities as single entities and in a second category the connectivity/accessibility factors which express more closely the urban networking effects. We should obviously add as a third category the physical – geographical and historical factors.
These factors can be measured, to a certain degree, by indicators (see for instance section 2.5 on neighbour-dependent growth). Some of these last are “direct”, that is to say they express directly the importance of each factor. It is often difficult to measure these “direct” indicators, because they interplay with each other or because it is difficult to find reliable information. 6 S.Sassen (2002), Global networks, linked cities, Routledge, New York - London

ESPON 1.1.3 - Final Report Part 2 144
Thus, we use “indirect” indicators, which, however, often disguise the “real” effects of the factors. A proper example in this matter is the use of the size of the cities as an indirect indicator.
The spatial configuration of the factors’ effects also raises very important methodological problems. Many spatial analyses have demonstrated that different natured effects are important, as spot (point) effects, axial effects, network effects and cluster effects.
ESPON project 1.1.1 analyses have been confined (as numerous other spatial analyses do) to the study of one or two kinds of the above spatial effects, mainly the spot (point) effects and the network effects. We should also pinpoint that it is difficult to convert the effects of physical-geographical and historical factors or the results of division of labour analyses into appropriate indicators. These deficiencies of the factors/indicators are transposed to some extent on the ESPON 1.1.1 models based upon them.
Furthermore, analyses concerning urban networks as single entities have been done mainly on the basis of the size of cities as well as factors/indicators concerning each city (FUA). In contrast, these analyses could be complemented by taking more deeply into account the effects of the flows among cities (mainly, but not only, using the transport/ communication infrastructures: the existing ones and mainly those which are included in the new TEN-T) and not only the accessibility indicator. However within the ESPON programme it has been very difficult to access comparable data on these types of flows for the entire ESPON space, as we also mentioned in section 2.3.
Territorial complementarities through governance
An urban network significantly, often determinately, affects its surrounding countryside space. Networks’ productive activities are often interlaced, on the basis of complementarities, forming a “productive system”, which defines the boundaries of a respective “region”. It is about a “real” region, the boundaries of which do not always coincide with those of an administrative region.
Complementarity relationships in networks and regions are crucial for regional/spatial planning. A central ingredient of polycentric development is the interconnected nature of towns and built-up areas where urban-rural development is not contradictory but rather, complementary7. Strengthening the complementarities through territorial governance in these cases could lead to the formation of entities that could profit from the positive effects 7 M. Johansson, “Facing ESPON, Polycentric Urban Structures in Sweden”, Nordregio Report 2002:1

ESPON 1.1.3 - Final Report Part 2 145
comparable to those of single strong cities. This way, we can improve the competitiveness and the cohesion of a network of cities (and their hinterlands) while at the same time improving the stronger cities (which often implies population movements to these later). While ESPON 1.1.18 studied in depth the governance aspect of polycentricity this has not yet been integrated into the overall analysis based on indicators.
Social aspects of polycentricity
Territorial cohesion in the framework of the EU Cohesion Policy and the ESDP includes the provision of equal opportunities of economic and social development to all the regions. The provision of equal economic opportunities, that is the economic aspect of polycentricity, is related to “balanced competitiveness” which is discussed in the previous paragraphs. Notwithstanding, the social aspect of polycentricity is equally important in the framework of the ESDP.
Globalisation and European integration create new social territorial patterns9 which may alleviate certain inherited social problems, but also at the same time could intensify existing social problems and create new challenges to overcome these. At national level, most of the new member states and accession countries have faced a transition from a centrally planned economy to a modern market economy. The main features have been the privatisation of some stated-owned companies, liberal laws to encourage the development of the private sector and liberalisation of the labour market. This has resulted in often-times difficult problems with restructuring of the economic base and ensuing unemployment and population loss of cities outside the major urban cores.
Unemployment is on the rise nearly everywhere in the EU space, not only in the new member states and accession countries. In many cases unemployment and social disparities between regions (as between different neighbourhoods of cities) are increasing. Social spatial exclusion, often related to a high rate of immigration, is also on the rise. Public efforts to deal with these problems is expressed through various redistributive policies. Many of these policies are included under the objective of provision of equal opportunities or “quality of life” of the population in all the territories.
8 Our purpose is by no means to evaluate the work done in ESPON polycentricity projects (ESPON
1.1.1 and ESPON 1.1.3 –see in references). We only attempt to make more precise which additional analyses could be done so as to better support polycentricity policy specification.
9 See in this matter, among others, in Castells M. (1996), The Information Age: Economy, society and culture: Volume 1- The rise of the network society, Blackwell Publishers, Massachusetts – Oxford.

ESPON 1.1.3 - Final Report Part 2 146
Included in this objective are often parameters related to the quality of the natural and cultural environment10.
Polycentric development policies of the past often included the objective of provision “equal quality” of services to the population in all territories at all spatial levels through appropriate centers of service provision, be it cities or small settlements11. This is seen clearly in the polycentric policy of Slovenia (see section 3.5), which since 1973 has been based on the principle of equal distribution of jobs in industry and services (central place theory), not favouring the growth of Ljubljana, but other regional and municipal centers. Polycentricity (or, more specifically in this case a kind of “decentralised concentration” –mainly in the countryside) is clearly a means to achieve this goal. Such an objective is included in many national spatial development plans12, and even among the new member states, as we present in Annex D of this report.
The social aspects of polycentricity have not been a primary focus for ESPON 1.1.1. In the overall analysis based on indicators, social condition indicators have not been enough taken into account13. See for a discussion of this issue Grasland C. and Hamez G. (2005)14.
Environmental aspects of polycentricity
Environmental issues are of high importance for the new member states and accession countries facing a fast restructuring of urban – rural territorial patterns associated with the degradation of the environment in both the urban and rural areas.
The environmental aspects of polycentricity are more difficult to investigate. Undoubtedly, globalisation processes are related to the further concentration of population and activities in the big cities, mainly the metropolitan areas, as well as rising pollution which further disarticulates urban ecosystems and deteriorates urban cultural heritage and identity. On the other hand, the rise of the dispersal of urban functions (activities installations, habitat) in peri-
10 Cf. for this issue, among others, in: Tobelem – Zanib Chr. (1995), La qualité de la vie dans les villes
françaises, Publications de l’Université de Rouen, Rouen. 11 Governments guarantee a minimum of social services e.g. education, health etc. 12 See, among others, in: DATAR (1995), Schéma National d’Aménagement et de Développement du
Territoire – Chapitre: L’organisation des services collectives, La Documentation Française, Paris. 13 We should note that the Terms of reference of this project had not emphasized the use of social
indicators. 14 Grasland C. - Hamez G. (2005), Vers la construction d’un indicateur de cohesion territoriale
europeen ? Report presented in the XLème Colloque of ASRDLF (Association de Science Régionale De Langue Française): Convergence et disparités régionales au sein de l’espace européen; Les politiques régionales à l’épreuve des faits, Bruxelles – 1, 2 et 3 Septembre 2004

ESPON 1.1.3 - Final Report Part 2 147
urban areas is increasing the consumption of primarily oil-based natural resources.
These issues could be seen as the sustainability aspect of the polycentricity. Therefore, the entire polycentricity concept could be further elaborated15. We should stress here that environmental aspects are closely related to the social ones, both being components of the territorially equitable “quality of life” of the population. Studies on environmental justice and sustainable cities address these aspects and could perhaps be fruitfully integrated into the ESPON II programming at some point.
3.3.1 A polycentric picture of the new member states
The objective of the ESPON 1.1.1 project was to establish the background for a more informed discussion of polycentric development in Europe. This has provided an overview of the European urban system with regard to functional specialisations and current degrees of polycentricity, as well as a prospective analysis of possible effects of regional polycentric integration in different parts of Europe. We focus here in the results of the project which are applicable for the new member states
The point of departure for this project was that of the European scale. The project used as a main building block the Functional Urban Areas (FUAs) (see in detail in the project Final report). The analysis classified firstly the FUAs according to population density, transportation, tourism, manufacturing, knowledge, decision making. The FUAs with the highest average score and labelled as Metropolitan European Growth Areas (MEGAs).
The remaining FUAs were classified in two categories: (a) FUAs with transnational or national significance and (b) FUAs with regional or local significance (ESPON 111 TIR).
The strengths of the 76 MEGAs were further analysed in a discussion of where the most likely counterweights to the “Pentagon” were to be found. The analysis here was based on indicators concerning: mass, competitiveness, connectivity, and knowledge basis. The MEGAs are compared with each other for each quality, ranked and divided into five groups: global nodes (London and Paris), 17 Category 1 (European Engines)
15 See for an approach integrating the economic, social and environmental aspects of the
urban development in: Hall P. – Pfeiffer Ulr. (2000), Urban Future 21: A global agenda for twenty-first century cities, E & FN Spon, London.

ESPON 1.1.3 - Final Report Part 2 148
MEGAs, 8 Category 2 (Strong) MEGAs, 26 Category 3 MEGAs (Potential) and 23 Category 4 (Weak) MEGAs.
MEGAs located in the new member states constitute possible “accelerators’’ of the respective areas’ development vis-à-vis the “Pentagon”. In the new member states area, there are neither “Global nodes” nor “European Engines”. Only four “potential MEGAs” and eleven “weak MEGAs” are located in this area. Warsaw, Budapest, Prague and Bratislava are classified as “Potential MEGAs”. These are all capital cities. FUAs classified as “Weak MEGAs” are: Bucharest, Tallinn, Sofia, Ljubljana, Katowice, Vilnius, Krakow, Riga, Gdansk-Gdynia, Wroclaw and Valletta.
The majority of the new member states have few FUAs with transnational or national significance, as shown in Table 3.2.
It is therefore obvious that the urban systems of the new member states are weak on a European scale, when analysed according to the FUA/MEGA classifications.

ESPON 1.1.3 - Final Report Part 2 149
Table 3.2: Classification of FUAs per country of the new member states
Country Observations
Bulgaria Bulgaria has one MEGA, three FUAs with transnational or national significanceand 27 FUAs with regional or local significance. The total number offunctionally significant functional urban areas is 31.
Cyprus Cyprus has no MEGA, but four FUAs with transnational or nationalsignificance (the total number of functionally significant functional urbanareas is four).
Czech Republic
The Czech Republic has one MEGA, four FUAs with transnational or nationalsignificance and 20 FUAs with regional or local significance. The total numberof functionally significant functional urban areas is 25.
Estonia Estonia has one MEGA, one FUA with transnational or national significanceand eight FUAs with regional or local significance. The total number offunctionally significant functional urban areas is ten.
Hungary Hungary has one MEGA, four FUAs with transnational or national significanceand 72 FUAs with regional or local significance. The total number offunctionally significant functional urban areas is 77.
Lithuania Lithuania has one MEGA, two FUAs of transnational or national significanceand five FUAs of regional or local significance. The total number offunctionally significant functional urban areas is eight.
Latvia Latvia has one MEGA, no FUAs of transnational or national significance andseven FUAs of regional or local significance, totalling eight functionallysignificant functional urban areas in country.
Malta Malta has one FUA, which is classified as MEGA.
Poland Poland has five MEGA, 14 FUAs of transnational or national significance and29 FUAs of regional or local significance. The total number of functionallysignificant functional urban areas is 48.
Romania Romania has one MEGA, nine FUAs of transnational or national significanceand 49 FUAs of regional or local significance. The total number of functionallysignificant functional urban areas is 59.
Slovenia Slovenia has one MEGA, one FUA of transnational or national significance andfour FUAs of regional or local significance. The total number of functionallysignificant functional urban areas is 6.
Slovakia Slovakia has one MEGA, six FUAs of transnational or national significance andtwenty FUAs of regional or local significance. The total number of functionallysignificant functional urban areas is 27.
Source: (Adapted from ESPON 111 TIR Table no 16. Typology of Functional Urban Areas
(FUAs) – country reports)
A small number of cities of the new member states could significantly increase their position in the European urban hierarchy through polycentric integration; the majority of them being situated inside the extended “Pentagon” area.
The analysis of the transnational networks of cooperation concluded that these networks are particularly important for the development of

ESPON 1.1.3 - Final Report Part 2 150
polycentricity if networking is established between second order cities and are thus able to contribute to stabilising the position of these cities in the national urban hierarchies. The transnational networking within meso-regions contributes to the development of polycentricity if regional integration and competitiveness results from such cooperation. Participation of cities of the new member states in transnational networking within meso-regions is growing fast, as witnessed by their participation in INTERREG IIIB programmes, among other types of cooperation.
Governance capacity for polycentricity and policies is assessed in ESPON 1.1.1 through the analysis of the experience of inter-municipal, inter-regional and trans-national co-operation and partnership in spatial policies as well as the analysis of the implementation of polycentricity policies in national contexts. It appeared that the new member states presented at the period of the project relatively restricted governance capacity for polycentricity and ensuing policies, although national development strategies often made this a priority.
3.3.1.1 Polycentricity in transnational regions: New possibilities with enlargement
The ESPON research on polycentricity has unequivocally shown that scale matters. Policies and measures carried out to evoke polycentric development on a European level, i.e. by stimulating zones of economic development beyond the “Pentagon”, may increase polycentricity of the European territory in the sense of developing FUAs (Functional Urban Areas) and MEGAs (Metropolitan European Growth Area) outside of the Pentagon. Such a strategy would stimulate further growth in macro-regions or transnational regions such as in the Baltic Sea Region or SE Europe and the Balkans. The latest enlargement and the enlargements of the near future bring with them new possibilities for further strengthening the role on a European scale of new macro or transnational regions, which are compsed of a combination of both old member states, new member states and accession countries. With a focus on such regions it could be that by connecting the potentials of the MEGAs with efficient accessibility and complementary functionality, a Potential Integration Zone could be possible in some of the more peripheral areas of Europe.

ESPON 1.1.3 - Final Report Part 2 151
3.3.1.2 A potential Baltic Sea Integration Zone?16
Demographic developments in the Baltic Sea Region (BSR) determine to a large degree the patterns of human settlements and economic power of regions. An important element of territorial cohesion is that not only the metropolitan areas experience a positive rate of population change, but that second and third tier cities, as well as rural areas are able to halt the current depopulation movement that characterises these areas in most of the European territory. Within the European “Pentagon” there are signs of a polycentric development with regard to migratory movements. Outside the “Pentagon” – and especially in the Nordic periphery and the Baltic States the opposite is valid. Here the dominating trend is of a monocentric character. The metropolitan areas and the big cities tend to grow at the expense of the small and middle-sized towns and especially in the most peripheral rural areas.
This reinforces an already discernable pattern. In much of the BSR the urban structure is already mostly characterised by a dominant position of capitals at the national level and conflicting goals for spatial equality at national, regional and local levels. Cities have different roles in relation to the urban system and capital cities top the hierarchy of the urban systems.
All in all, there are 1039 cities in the BSR with more than 10,000 inhabitants. Of the 75 million urban inhabitants in the BSR, 63 million live in cities with more than 10,000 inhabitants.17 There is a high share of small cities and dominant capital cities mainly due to concentration of population and business centres. This is the situation in Latvia, Estonia, Denmark, Russia (BRS) and the metropolises in Germany. The upper regions of Belarus also suffer from this phenomenon. Lithuania, Poland, Sweden, Norway and Finland have dominant cities to a lesser degree. It is often the case that the capital cities offer better conditions than the smaller ones and in many cases having favourable concentration of direct foreign investment (FDI) and R&D. Capital cities may differ in size and functional endowment but they share similar tasks and contain the main functions of the state.
For the BSR area there are 256 cities that are classified as FUAs according to the ESPON 1.1.1 definition and 22 of these are deemed as MEGAsin the resulting four categories.
16 This section is based on the work by Cortés Ballerino, C., Johansson, M., and Van Well, L. (2005).
Polycentric Development and Territorial Cohesion in the BSR: Strategies and Priorities. Prepared for the Swedish Ministry of Industry, Employment and Communications, July 2005.
17 http://vasab.leontief.net/background/indexback.htm

ESPON 1.1.3 - Final Report Part 2 152
As shown from maps figure 3.1, the BSR contains no Global nodes. However the MEGA typology in the BSR is thus:
Category 1 MEGA – 4 cities (Hamburg, Berlin, Copenhagen, Stockholm)
Category 2 MEGA– 3 cities (Oslo, Gothenburg, Helsinki)
Category 3 MEGA - 4 cities (Malmö, Aarhus, Bergen, Warsaw)
Category 4 MEGA - 11 cities (Tallin, Katowice, Vilnius, Krakow, Riga, Lodz, Poznan, Szczecin, Gdansk, Kwroklaw, Turku)
Figure 3.1: MEGAs categories and FUAs in Europe, highlighting the Baltic Sea Region and the Potential Baltic Sea Integration Zone
(Adapted from ESPON 1.1.1)
Of the total 76 European MEGAs according to the ESPON classification, 22 or 29% are located in the BSR space, while only 18 are located in the “Pentagon”. Granted the MEGAs of the “Pentagon” are primarily Category 1 and 2 MEGAs, while those of the BSR are mainly Category 3 and 4 MEGAs (the majority in Poland). The PUSH areas (ESPON 1.1.1) are also weakly populated as compared the Pentagon, but still this points to the great possibilities of the BSR in terms of a potential Baltic Integration Zone that, while not pretending to rival the “Pentagon”, could at least be a formidable
Pentagon area
Global node Category 1 MEGA Category 2 MEGA Category 3 MEGA Category 4 MEGA MEGA : Metropolitan Europe Growth Area
Potential Baltic Metropolitan Growth Area
Baltic Sea Region
ESPON 1.1.3 - Final Report Part 2 153
globally competitive complement. Perhaps while not able to compete fully on global markets, a Baltic Integration Zone, would be capable of participating fully in the wider European economy. Moreover such an integration zone could boost economic competitiveness in the European territory and foster economic cohesion of the BSR, particularly within the cores of the region.
It is notable that the MEGAs forming a Baltic Sea “Pentagon” (see figure 3.1) to a large degree composed by important port cities: Helsinki, Copenhagen, Stockholm, Tallinn, Riga and Gdansk, thus stressing the primacy of accessibility by waterway and the historic importance of the Baltic Sea as a connective element, rather than a barrier to integrative cooperation.
Although large cities and capital areas are the engines of growth, territorial cohesion in the long-term will not be achieved without a complementary focus on the small and medium sized cities in the BSR. If the goal is to develop a Baltic Integration Zone in the BSR, it cannot be stated often enough that a main focus must be on the role of medium-sized and small cities in the periphery, in addition to the metropolitan areas. While large metropolitan areas primarily do generate the majority of wealth in the BSR and are the engines that make the region competitive on a European and even global basis, there is little evidence that this wealth sufficiently “spills over” in the short-term to the hinterlands without policy interventions. Territorial cohesion can only be achieved by a specific focus on the special circumstances of small peripheral cities and towns throughout the territory.
Thus there is a need in the BSR to improve the functions of second-rank cities in order to achieve territorial cohesion in the cores, but especially in the peripheries of the BSR. To avoid the national dimension of polycentricity is to even further exasperate socio-economic differences within countries in the BSR- discontinuities that are rapidly expanding. National programs for regional development could achieve this with an emphasis on the functional growth of these areas, along with the necessary transport infrastructure to increase accessibility of smaller FUAs.
A well known effort in the Baltic Sea Region that has highlighted the potentials of the area is VASAB (Visions and Strategies around the Baltic Sea). VASAB 2010 and VASAB 2010+ have played a unique role in European spatial analysis and cooperation with regard to visions. Indeed VASAB 2010 (Committee of Spatial Development of the Baltic Sea Region 1995) was the very first transnational vision document and as such had a great influence on the European Commission in its support for transnational visions18.
18 Nadin, Vincent (1992) “Visions and Visioning in European Spatial Planning” in Faludi, A (ed)
European Spatial Planning, Lincoln Institute of Land Policy, Cambridge, Mass. p. 121.

ESPON 1.1.3 - Final Report Part 2 154
Indeed VASAB has long conceptualised existing and/or desired spatial structures in terms very like those of ESPON. In VASAB nomenclature the four main spatial structures are “pearls”, “strings” and “patches” and “system”, which roughly correspond to some of the main ESPON concepts.
The goal of VASAB is to “…promote action oriented spatial planning which contributes to sustainable development of the BSR and which strengthens transnationality”19. Two of the challenges presented by the VASAB 2010+ document regarding the settlement system are to increase competitiveness of urban regions and to counteract growth concentration in a few urban centers by development of regions lagging behind20. Thus the twin goals of European competitiveness and national territorial cohesion are being addressed within the BSR. Even if a Baltic Transnational Integration Zone is not realised in full, national and regional policy interventions in support of the VASAB goals will go a long way in boosting the sustainable and equitable economic and social development of the region. These visions and goals have the possibility of being further implemented by territorial cooperation efforts such as INTERREG IIIB.21
3.3.1.3 A potential SE Europe / Balkans Integration Zone
From a geographical point of view, South Eastern Europe covers mainly the Balkan countries. Today only Greece and Slovenia belong to EU, Bulgaria
19 Wismar Delaration and VASAB 2010+ (2001), Visions and Strategies around the Baltic Sea 2010:
Conference of Ministers for Spatial Planning and Development, Wismar 20-21 September 2001.p. 2. 20 Ibid. p. 11 21 In fact as of 2005, 14% of all INTERREG IIIB projects in the BSR programme had
polycentric development or urban development networks as a main theme.
The system of urban settlements (pearls)
The interlinking networks (strings)
Uses of land use (patches) in non-urban areas
Comprehensive spatial planning function (system)
Cities or FUAs Accessibility Border areas, islands, coastal zones, cultural landscape Territorial cohesion
VASAB ESPON

ESPON 1.1.3 - Final Report Part 2 155
and Romania will enter in the EU in 2007 and Croatia most likely will enter few years later. The Western Balkans countries (which include Croatia, Bosnia-Herzegovina, FYROM, Serbia and Montenegro and Albania) are wiling to access EU in the next years.
In these countries, the capital cities usually play a very important role at national level. Only the capitals and a small number of other cities have an influence at the transnational level and rarely at European level (see in more extend in the ESPON 1.1.3 FIR, SIR and TIR). According to the ESPON project 1.1.1 classification of the FUAs, there are only five MEGAs (Athens, Sofia, Bucharest, Timisoara and Ljubljana22) and 19 FUAs with transnational / national significance23 in the SE Europe/Balkans region. There are also 117 FUAs with regional/local significance24. In the non-ESPON space there are about 50 urban regions which could be assimilated with FUAs. A small number of these could be assimilated with MEGAs or FUAs with transnational/national significance while the others have a regional/local importance (Figure 3.2).
The non-integration of considerable parts of Balkans in the EU has delayed the transnational integration of the urban systems of the Balkan countries. However the prospect of impending accession of three of these countries and medium-term accession of the remaining non-EU countries, within the framework of INTERREG and other EU cooperation programs, has strengthened the possibilities of further integration of their urban systems.
The urban systems of the northern Balkan countries (Slovenia, Croatia, and Romania) are connected with the urban systems of the neighbouring EU25 countries and the powerful structural element of these last, the "Triangle", encompassing Warsaw, Prague and Budapest. However they are also well connected with the urban systems of the central and southern Balkans.
These spatial interactions spur the possibility of the creation of a SE Europe/Balkans Integration Zone which could be based in a Transnational Urban System (TUS) with a relatively complex structure –in comparison with that of the Baltic countries, since this TUS will have relatively strong connections with the Triangle and the urban systems of the neighbouring
22 We should note that also Thessalonica meets substantially the criteria used for the classification in
MEGAs. 23 Including Thessalonica – see in previous note 24 Greece has one strong MEGA (category 2 of MEGAs), Athens, 7 FUAs of Transnational / National significance and 37 FUAs of Regional / Local significance. Bulgaria has one weak MEGA (category 4), Sofia, 3 FUAs of Transnational / National significance and 27 FUAs of Regional / Local significance. In Romania there are two weak MEGAs (category 4), Bucharest and Timisoara, 8 FUAs of Transnational / National significance and 49 FUAs of Regional / Local significance. Slovenia has one weak MEGA, one FUA of transnational / national significance and four FUAs of regional / local significance.

ESPON 1.1.3 - Final Report Part 2 156
countries of Central Europe as well as with those of Cyprus, Italy, Malta and Turkey.
Figure. 3.2: The Major Urban Systems of the Balkan countries
Source: ESPON 1.1.1 project and other sources (see in the ESPON 1.1.3 SIR) Syntax of the Figure: NTUA Workgroup
A geographically central part of the TUS of this potential Transnational Integration Zone could be constituted by Sofia, Belgrade, Bucharest, Skopje, Tirana and Thessalonica25. As it is argued in ESTIA-SPOSE (2005), “In this area spatial transformations are expected to take place combining the
25 The first five are capitals of the respective countries while Thessalonica is the second in
importance metropolitan region of Greece. See for this proposal in: Transnational Project Group (LP: UEHR Institute, Panteion Univ., Athens) (2005), ESTIA-SPOSE project, Athens.

ESPON 1.1.3 - Final Report Part 2 157
impact of transport corridors with the urbanization and more general territorial trends and pressures”. It should also be emphasised that for this network, as well as for the wider Balkans, TUS the relationships among these cities created during a long lasting historical period are of great importance. Of equal weight is the reinforcement of the relationships of these FUAs with Athens, Zagreb and Ljubljana. as well as with Nicosia and Istanbul and widely with the urban poles of the neighbouring parts of Central Europe and Italy.
As in the case of the Potential Baltic Sea Integration Zone, the fostering of the integration in the SE Europe/Balkans area would enhance the capability of the interested countries of participating fully in the wider European economy. Moreover such an integration zone could boost economic competitiveness in the European territory and foster economic cohesion” in this region. Finally, in the framework of the EU Cohesion Policy, the support of the integration process in this region should be prioritised as the region entirely includes lagging behind countries.
3.4 How to measure polycentricity in the enlarged Europe
Until today the concept of polycentricity has remained largely at the level of rhetoric without a precise operational definition (which puts it into a class with similarly vague concepts such as 'city networks' or 'industrial clusters'). There exists neither a method to identify or measure polycentricity at different spatial scales nor a method to assess the impacts of polycentricity (or the lack of it) with respect to policy goals such as efficiency (competitiveness), equity (cohesion) and sustainability. It is therefore not possible to determine an optimal degree of polycentricity between centralisation and decentralisation or, in other words, between the extremes of monocentricity and dispersal. This makes it difficult to formulate well-founded policy recommendations as to which cities should be developed with priority.
It is therefore necessary to develop an operational concept of polycentricity and operational methods for identifying and measuring the existing polycentricity of European urban systems. The methodology should allow (i) to measure the degree of polycentricity of a region, a national urban system or the European urban system at large, (ii) to evaluate it with respect to the policy objectives of European Spatial Development Perspective competitiveness, cohesion and environmental sustainability and (iii) to forecast the likely impacts of European, national or regional economic,

ESPON 1.1.3 - Final Report Part 2 158
transport and telecommunications policies on the degree of polycentricity and the three policy goals.
This section consists of three parts. In the first subsection a methodology developed in ESPON 1.1.1 is used to measure the degree of polycentricity of the current urban systems of the new member states and accession countries individually. In the second section the same methodology is used to measure the polycentricity of the European urban system as a whole at the highest level of the urban hierarchy. Finally we end with a discussion of polycentricity in Slovenia as an illustrative example of some of the problems of interpreting polycentricity on various levels.
The method to measure polycentricity can also be used to forecast the likely future development of polycentricity for different scenarios of urban growth and linkages between cities taking account of macro trends such as the enlargement of the European Union, further integration of the world economy and intensification of the competition between regions and cities and the development of energy cost, transport technology and telecommunications. This was done with respect to the impacts of EU enlargement and different scenarios of development of the European transport infrastructure. The results of these forecasts are presented in Section 4.3.
3.4.1 National polycentricity
The developed approach measures polycentricity by identifying three dimensions of polycentricity: the size or importance of cities (population, economic activity), their distribution in space or location and the spatial interactions or connections between them. Cities in this analysis were 1,588 Functional Urban Areas (FUAs) defined in ESPON 1.1.1 (ESPON 1.1.1, 2004). Malta was excluded because it has only one FUA. Cyprus was included, but because it is presently a divided country, the results have to be used with caution.
Size Index’
The first and most straightforward prerequisite of polycentricity is that there is a distribution of large and small cities. It can be shown empirically and postulated normatively that the ideal rank-size distribution in a territory is loglinear. Moreover, a flat rank-size distribution is more polycentric than a steep one. Finally, a polycentric urban system should not be dominated by
ESPON 1.1.3 - Final Report Part 2 159
one large city. To operationalise this, two sub-indicators were defined: (a) the slope of the regression line of the rank-size distribution of population and (b) the degree by which the size of the largest city deviates from that regression line. When calculating the regression line, all but the largest city are considered.
Figure 3.3 shows the rank-size distribution of FUAs in the new member states and accession countries. It can be seen that the rank-size distributions of population of cities in the new member states and accession countries differ significantly. Hungary has a relatively polycentric urban system, but Budapest as the former capital of a much larger territory is very dominant. Bulgaria has a large number of provincial cities, yet Sofia is too large for the urban system of the country. Poland has the least dominant capital city, in fact Warsaw is too small for the size of the country. In the Czech Republic the rank-size distribution is also relatively flat, but Prague is about the right size. Smaller countries, such as Estonia and Slovenia, have steeper rank-size distributions and in most cases too dominant capital cities.
An alternative is to perform the same analysis not for population but for GDP. As with the rank-size distribution of population, two sub-indicators were defined for GDP: (c) the slope of the regression line of the rank-size distribution of GDP and (d) the degree by which the GDP of the city with the largest GDP deviates from that regression line. When calculating the regression line, all but the city with the largest GDP are considered. Here, the primacy rate is interpreted in terms of economic dominance: a primacy rate above one indicates that the primate city is "too rich" for the urban system of the country.

ESPON 1.1.3 - Final Report Part 2 160
Figure. 3.3: Rank-size distribution of population of FUAs in the new member states and accession countries

ESPON 1.1.3 - Final Report Part 2 161
Figure 3.4 shows the rank-size distributions of GDP of FUAs in the new member states and accession countries. Again Hungary stands out by its dominant capital city, which is not only too large in terms of population but also too dominant economically from the point of view of a balanced polycentric urban system. A similar picture emerges for Romania, but with a much lower primacy rate of Bucharest. The distribution of economic wealth over cities in Slovakia is very balanced. In the Czech Republic, Prague is economically very dominant, although not in terms of population. Lithuania and Latvia differ greatly with respect to their capital cities: Whereas Vilnius under-performs compared with its position in the Lithuanian urban hierarchy, Riga overshadows all other cities in Latvia.
Location Index
The second prerequisite of a polycentric urban system is that its centres are equally spaced from one another – this prerequisite is derived from the optimal size of the service or market area of centrally provided goods and services. Therefore a uniform distribution of cities across a territory is more appropriate for a polycentric urban system than a highly polarised one where all major cities are clustered in one part of the territory.
A second step in the analysis of polycentricity is therefore to analyse the distribution of cities over space. One possible approach is to subdivide the territory of each country into service areas such that each point in the territory is allocated to the nearest centre – such areas are called Thiessen polygons. Thiessen polygons can be constructed by dividing the territory into raster cells of equal size and to associate each cell with the nearest urban centre. In this way the area served by each centre can be measured.
In the present analysis airline distance was used to allocate raster cells to centres. As measure of inequality of the size of service areas (e) the Gini coefficient of inequality was used. The Gini coefficient measures the degree of inequality of a distribution between zero and one (or zero and 100), where zero indicates perfect equality and one (or 100) maximum polarisation.
Figure 3.5 shows the service areas of the FUAs in the new member states and accession countries. It can be seen that the service areas are relatively equal. The inequality is largest in the Czech Republic and in Hungary. In both countries cities are highly clustered, in the Czech Republic in the western part of the country, in Hungary around Budapest. The Baltic states, Poland and Slovenia have the most balanced territorial structures.

ESPON 1.1.3 - Final Report Part 2 162
Figure 3.4: Rank-size distribution of GDP of FUAs in the new member states and accession countries

ESPON 1.1.3 - Final Report Part 2 163
Figure 3.5: Service areas of FUAs in the new member states and accession countries
Latvia Gini = 11.8
Slovakia Gini = 23.8
Poland Gini = 20.2
Estonia Gini = 13.1
Lithuania Gini = 19.9
Slovenia Gini = 15.1
Czech Republic
Hungary Gini = 35.4
BulgariaGini = 21.9
RomaniaGini = 21.4
Cyprus Gini = 9.7

ESPON 1.1.3 - Final Report Part 2 164
Connectivity Index A third property of polycentric urban systems is that there is functional division of labour between cities, both between higher-level centers and the lower-level centres in their territory and between cities at equal levels in the urban hierarchy. This implies that the channels of interaction between cities of equal size and rank, but in particular between lower-level and higher-level cities, are short and efficient. It is obvious that this requirement may be in conflict with the postulate that cities of equal size and rank should be equally spaced over the territory.
There are principally two ways to measure connectivity. One is to measure actual interactions. Ideally, the analysis would reveal functional relationships between cities of equal size or rank and between cities of different size or rank in the urban hierarchy. Appropriate indicators of such interactions would be flows of goods or services, travel flows or immaterial kinds of interactions, such as telephone calls or e-mails. The second possibility is to measure the potential for interactions. Measures of interaction potential could be infrastructure supply, i.e. the level of road connections (motorways, roads) or the level of service of rail (number of trains) or air (number of flights) connections. An urban system with good connections between lower-level centres is more polycentric than one with mainly radial connections to the dominant capital. In polycentric urban systems also lower-level centres have good accessibility.
For measuring interaction potential the multimodal accessibility of FUAs calculated for ESPON 1.1.1 was used. Two sub-indicators were defined: (f) the slope of the regression line between population and accessibility of FUAs and (g) the Gini coefficient of accessibility of FUAs. The two sub-indicators have similar meaning: the flatter the regression line, the more accessible are lower-level centres compared to the primate city, and the lower the Gini coefficient, the less polarised is the distribution of accessibility.
Figure 3.6 shows the correlation between population size and accessibility of FUAs in the new member states and accession countries. In all countries the largest cities are also the most accessible. In Bulgaria, the Czech Republic, Poland and Romania the regression line is rather flat, which means that there is only a relatively small difference between the accessibility of the capital city and the rest of the urban system.

ESPON 1.1.3 - Final Report Part 2 165
Figure 3.6: Population and accessibility of FUAs in the new member states and accession countries
This is different in Lithuania and Slovakia, where the capital city is much better linked to international transport networks than the other cities.

ESPON 1.1.3 - Final Report Part 2 166
Summary of sub-indicators
The results of the analysis of polycentricity of the new member states and accession countries are summarised in Table 3.3. The columns of the table contain the sub-indicators of polycentricity (a) to (g) defined above.
Table 3.3: Polycentricity sub-indicators
Rank-size
distribution of
population
Rank-size
distribution of
GDP
Size of
service
areas
Population
and
accessibility
Country
No. of
FUAs Slope
(a)
Primacy
(b)
Slope
(c)
Primacy
(d)
Gini
(e)
Slope
(f)
Gini
(g)
Bulgaria
Cyprus
Czech Republic
Estonia
Hungary
Lithuania
Latvia
Poland
Romania
Slovenia
Slovakia
31
4
25
10
77
8
8
48
59
6
27
-0.78
-1.78
-0.92
-1.14
-0.67
-1.64
-1.02
–0.95
-0.85
-1.49
-1.04
1.54
0.46
0.94
1.66
2.58
0.44
3.81
0.59
1.47
0.76
0.54
-0.90
-1.79
-0.96
-1.09
-0.72
-1.86
-1.20
-1.23
-0.90
-1.35
-1.04
2.31
0.46
2.18
4.16
5.39
0.51
8.61
0.83
1.95
1.30
1.24
21.9
9.7
39.0
13.1
35.4
19.9
11.8
20.2
21.4
15.1
23.8
14.8
0.9
13.1
50.7
14.8
59.0
23.3
9.6
13.5
23.3
46.5
18.8
5.2
13.9
19.9
19.9
21.1
16.0
17.5
22.2
6.3
13.7
The Index of Polycentricity
With the three component polycentricity indices, the Size Index, the Location Index and the Connectivity Index, a comprehensive Index of Polycentricity can be constructed. For each sub-indicator a z-shaped value function was defined. Table 3.4 shows the threshold values defined for each of the seven sub-indicators:

ESPON 1.1.3 - Final Report Part 2 167
Table 3.4: Value functions of polycentricity sub-indicators
Rank-size
distribution of
population
Rank-size
distribution of
GDP
Size of
service
areas
Population
and
accessibility
Slope
(a)
Primacy
(b)
Slope
(c)
Primacy
(d)
Gini
(e)
Slope
(f)
Gini
(g)
Indicator value at which
polycentricity is 0
–1.75 7.5 –1.75 10 70 75 25
Indicator value at which
polycentricity is 100
–0.5 0 –0.5 0 10 0 0
Table 3.5 shows the weights for the composition of the Polycentricity Index from the three component indices. Additive aggregation was used at the lower levels, whereas the three component indices were aggregated to the Polycentricity Index multiplicatively.
Table 3.5: Composition of the Polycentricity Index
Index Indicator Weights Weights
Size Slope of regression line of population
Primacy rate of population
Slope of regression line of GDP
Primacy rate of GDP
10%
40%
10%
40%
33%
Location Gini coefficient of service areas 100% 33%
Connectivity Slope of regression line of accessibility
Gini coefficient of accessibility
50%
50%
33%
Table 3.6 shows the results of the evaluation for the three component indices and the Index of Polycentricity for the new member states and accession countries. The last two rows of the table show the weighted average scores of the new member states and accession countries and, for comparison, the weighted average scores of the old member states (EU15).

ESPON 1.1.3 - Final Report Part 2 168
Table 3.6: Component indices and Polycentricity Index
Country
No. of
FUAs
Size
Index
Location
Index
Connectivity
Index
Polycentricity
Index
Bulgaria
Cyprus
Czech Republic
Estonia
Hungary
Lithuania
Latvia
Poland
Romania
Slovenia
Slovakia
31
4
25
10
77
8
8
48
59
6
27
77.1
75.7
79.2
64.7
61.6
76.5
35.5
84.1
78.3
76.0
83.5
80.2
100.0
51.7
94.8
57.7
83.5
97.0
83.1
80.9
91.6
77.0
52.6
89.1
63.5
26.4
50.4
18.5
52.4
58.7
46.6
72.0
41.6
68.8
87.7
63.8
54.5
56.3
49.0
56.5
74.3
66.6
79.4
64.4
NMAC average
EU15 average
303
1,200
77.5
77.7
77.1
57.2
52.7
68.1
67.3
66.1
Table 3.6 shows that the new member and accession countries on average have urban systems that are more polycentric than those of the old member states. This is mainly because their cities are more evenly distributed over space. With respect to connectivity, however, they are on average more polarised. Except for the special case of Cyprus, the most polycentric countries are Poland and Slovenia. Poland scores high in the Size Index and the Location Index but is weak in the Connectivity Index because all transport lines are oriented towards Warsaw. Slovenia has high scores in all three polycentricity dimensions. The Baltic states and Hungary are the least polycentric of the new member states and accession countries. Estonia and Lithuania suffer from the poor accessibility of their peripheral areas, Latvia from the dominance of Riga, and Hungary is weak in all three dimensions.

ESPON 1.1.3 - Final Report Part 2 169
3.4.2 European polycentricity
Figures 3.7 to 3.10 show the results of the same analysis of polycentricity as performed for the FUAs of each country in Figures 3.3 to 3.6 for the 76 Metropolitan Growth Areas (MEGAs) defined in ESPON 1.1.1 (ESPON 1.1.1, 2004) for the whole of Europe.
Figure 3.4 shows the rank-size distributions of population of the MEGAs. Also at this level the polycentric pattern of cities in Europe is clearly visible. The system of MEGAs is rather balanced, and the largest cities are in no way too large for the remaining cities. However, at the lower end of the two rank-size distributions there are many smaller FUAs which might not really qualify as MEGAs. The MEGAs in the new member states are in the lower ranks of the urban hierarchy in Europe.
Figure 3.8 shows the rank-size distribution of GDP of MEGAs in Europe. Now medium-sized economic centres, such as Stuttgart, Frankfurt and Hamburg score higher than their population size would indicate. Here, even more than in the rank-size distribution of population, the MEGAs in the new member states find themselves at the tail end of the distribution.
Figure 3.9 shows the service areas of MEGAs. When calculating the Thiessen polygons, it was assumed that national borders still act as barriers; therefore no service area cuts across national boundaries. Again the polycentric structure of the European urban systems is apparent, However, it becomes visible that the European urban system is highly clustered in the curved zone between south-west England, the Benelux countries, the Rhein-Ruhr and Rhine-Main regions, Switzerland and northern Italy – the 'Blue Banana' and not the 'Pentagon'. At the outer periphery, however, there are large areas served only by one MEGA.
Figure 3.10, finally, shows the correlation of population and accessibility of the MEGAs. The diffuse cloud of dots confirms again that the largest cities are not always the most accessible – or that accessibility is relatively equally spread over large and small cities as it should be in a polycentric urban system. It can also be seen that the MEGAs with the highest accessibility are in the old EU member states, whereas the MEGAs in the new member states and accession countries are relatively poorly connected.

ESPON 1.1.3 - Final Report Part 2 170
Figure 3.7: Rank-size distribution of population of MEGAs in Europe
Figure 3.8: Rank-size distribution of GDP of MEGAs in Europe
EU27+2 Slope = -144 Primacy = 0.37
EU27+2 Slope = -1.19 Primacy = 0.39
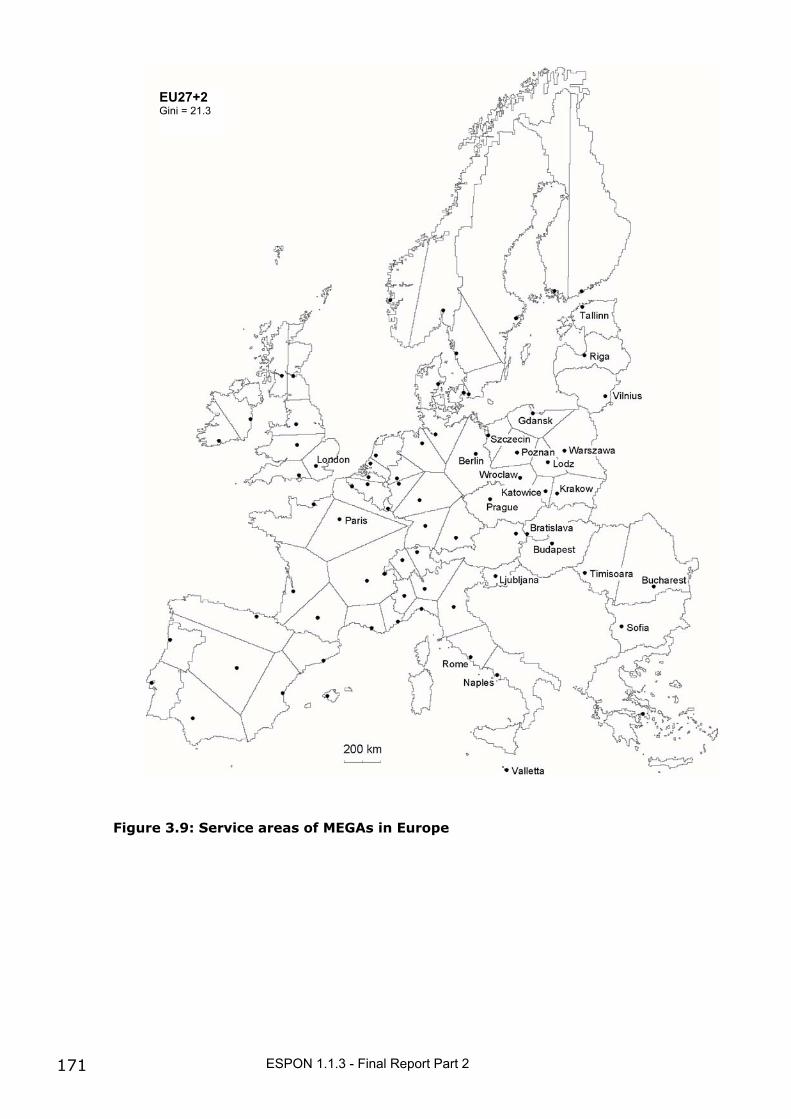
ESPON 1.1.3 - Final Report Part 2 171
Figure 3.9: Service areas of MEGAs in Europe
EU27+2 Gini = 21.3

ESPON 1.1.3 - Final Report Part 2 172
Figure 3.10: Population and accessibility of MEGAs
In summary, the system of MEGAs is rather balanced, and the largest cities are in no way too large or economically dominant for the remaining cities. Both with respect to population and economic performance the MEGAs in the new member states are in the lower ranks of the urban hierarchy in Europe. However, the European urban system is highly clustered in north-western Europe, whereas there are large areas served only by one MEGA at the periphery. Accessibility is relatively equally spread over large and small cities, but the MEGAs in the new member states and accession countries are poorly connected.
3.4.3 Conclusions
In this section the comprehensive indicator of polycentricity consisting of the components size, location and connectivity developed in ESPON 1.1.1 was applied to functional urban regions (FUAs) in the new member states and accession countries and to MEGAs in whole of Europe. Polycentricity so defined is associated with major policy objectives of the European Union,
EU27+2Slope = 11.1
Gini = 8.0

ESPON 1.1.3 - Final Report Part 2 173
such as economic competitiveness, social equity and environmental sustain-ability (see ESPON 1.1.1).
The analysis of national polycentricity shows that the new member states and accession countries on average have urban systems that are more polycentric than those of the old member states because their cities are more evenly distributed over space, though they are on average more polarised with respect to connectivity. Except for the special case of Cyprus, the most polycentric countries are Poland and Slovenia. The Baltic states and Hungary are the least polycentric of the new member states and accession countries. Estonia and Lithuania suffer from the poor accessibility of their peripheral areas, Latvia from the dominance of Riga, and Hungary is weak in all three dimensions.
At the highest level of the urban hierarchy, the European system of cities is rather polycentric in terms of size and accessibility but highly clustered in north-western Europe. The largest cities in the new member states are in the lower ranks of the urban hierarchy and relatively poorly connected.
The Polycentricity Index can be used to forecast polycentricity trends and the impacts of EU policies on polycentricity. In ESPON 1.1.3 this was done for EU transport policies with particular reference to EU enlargement and the effects for the new member states and accession countries. The results of these forecasts are presented in Section 4.3.
3.5 Illustration: Polycentricity in Slovenia
The Republic of Slovenia is a Central European state with a total surface area of 20,256 km2. It borders four countries: Italy (the common border length is 232 km), Austria (330 km), Hungary (102 km) and Croatia (670 km), and the Adriatic Sea (coastal length is 46.6 km). Geographically, it is at the crossing of the Alpine, Pannonian and Mediterranean regions. It is extremely variable geologically and in terms of climate. Over one half of the territory is covered with forest. About 40% of the surface area is used for farming, with a variety of meadows, pastures, orchards, and viticultural areas. Urban areas and infrastructure account for only a small percentage of the country’s total land mass.
Geographical diversity and the natural variety of the terrain are reflected in the development of all spheres of life and work: in the economic structure, territorial distribution of the population, types of populated areas, variety of

ESPON 1.1.3 - Final Report Part 2 174
architectural design, and the polycentric development of Slovenia as a whole. With an average population density of 98 inhabitants/km2, Slovenia is relatively densely populated. Its capital, Ljubljana, is also its largest town with approximately 273,000 inhabitants. It is followed by Maribor with slightly over 100,000 inhabitants. There are 12 other towns in Slovenia with over 10,000 inhabitants and 20 towns with over 5,000 inhabitants.
3.5.1 Polycentric development of Slovenian urban system
In 1973 the parliament of the Socialist Republic of Slovenia adopted the Guidance’s for Polycentric Development (1973) and the Polycentric concept for urbanisation (1975). Therefore in Slovenia the application of the concept of polycentricity has been based on the principle of equal distribution of jobs in industry and services (central place theory), not favouring the growth of Ljubljana, but other regional and municipal centres (medium and small towns). The objective of this instrument was to eliminate regional disparities, diminish rural-urban migrations and curb pressure for provision of housing in the largest urban areas.
Polycentric development and the movement towards a balanced development of towns and settlements in Slovenia have been continued in the long-term and mid-term plan of the Republic of Slovenia in the year 1986.
After the adoption of the new Spatial Planning Act in 2003, Slovenia continues to develop a balanced and connected urban system based on a polycentric structure of towns and other settlements. The polycentric structure is a prerequisite for the coherent development of both state and individual areas, and for a functional and physical interconnection of space. It is developed at the national, regional and local levels. Towns and other settlements cooperate in performing common missions on all levels. Sustainable economic and social development in the entire country requires spatial balance, along with the distribution of services, supplies and other activities. The functional and physical interconnection of towns and other settlements in the urban network is ensured, among other things, by good transportation and telecommunication links.

ESPON 1.1.3 - Final Report Part 2 175
Figure 3.11: Polycentric development of Slovenia is based on a balanced urban network with eight functional regions
(Source: Strategy of Slovenian Spatial Development, MOPE, 2004, www.sigov.si/mop)
At the national level, the urban network comprises towns and cities of regional or national relevance: Ljubljana, Maribor, Koper, Celje, Nova Gorica, Novo mesto, Murska Sobota and Kranj. This is particularly the case for Ljubljana, as the capital of the nation; Maribor, which is already connecting at the international level with neighbours Austria, Hungary and Croatia; and Koper, as a cargo and transport node and major Northern Adriatic port. Each of these regional centres is in its own functional region a motor of economic, social and spatial development. Their specific identity and unique nature make them the cultural and perceptional centers of their respective regions.
Functional regions (8) Narrow regional areas (21) National urban centre of international significant

ESPON 1.1.3 - Final Report Part 2 176
Text Box 4.1
Guidelines for achieving polycentric development in Slovenia
- To establish a balanced urban network of centers with adequate access to
urban functions and prominent regional centers as significant generators of economic, social, cultural and environmental development in their respective areas
- To ensure harmonious spatial development in areas with common developmental characteristics, especially in geographically enclosed areas (border areas, coastal and hilly areas), protected areas, and areas threatened by natural phenomena
- To enhance the quality of towns and other settlements as a pleasant living and working environment through internal developmental potential (renovation of city centres, rehabilitation of degraded urban areas, renovation of old industrial and mining areas)
- To strengthen, in particular, the border areas, and to increase their comparative advantages and competitiveness in a broader international environment
Slovenia aims to enhance its polycentric development at the regional level as well. Providing conditions for economic efficiency, a balanced distribution of jobs, supply, service activities and housing, as well as caring for the quality of the environment and space are the priorities to equalize living conditions, especially in areas with structural problems (e.g. coastal and hilly areas, areas threatened by natural phenomena, border areas, demographically threatened areas). The housing construction in particular will adhere to the policy of a more harmonious regional development, since the accelerated development of only one, or only a few regions, would lead to the excessive concentration of settlement in one particular region.
At the local level, special attention is devoted to developing the areas with an extremely dispersed population, and the areas with structural problems. A major effort is being made to provide suitable service and supply functions, and to create jobs. Special incentives are intended for settlements in areas with developmental problems and in the border areas, where direct economic cooperation with neighbouring countries can be fostered.


ESPON 1.1.3 - Final Report Part 2 177
Figure 3.12: Functional urban areas (FUA) and significance of urban centres in Slovenia, NUTS5
FUA – functional urban areas Urban canters with potential for FUA National urban centres of international significant
Urban canters of national significant
Urban centers of regional significant
Urban canters of inter-municipal significant
Conurbation

ESPON 1.1.3 - Final Report Part 2 178
Table 3.7: Functional urban areas (FUA) and significance of urban centers in Slovenia
Name of the urban centre (NUTS 5 level)
Hierarchy of Urban Centers* FUA **
LJUBLJANA national centre of international importance MEGA
MARIBOR national centre of international importance transnational/national KOPER - CAPODISTRIA, IZOLA-ISOLA, PIRAN - PIRANO (conurbation) national centre of international importance transnational/national
CELJE urban centre of national importance transnational/national
KRANJ urban centre of national importance transnational/national
VELENJE urban centre of national importance transnational/national
NOVO MESTO urban centre of national importance transnational/national
NOVA GORICA urban centre of national importance transnational/national MURSKA SOBOTA urban centre of national importance transnational/national KRSKO, BREŽICE, SEVNICA (conurbation) urban centre of national importance transnational/national
PTUJ urban centre of national importance regional/local with potential for transnational/national
TRBOVLJE, HRASTNIK, ZAGORJE (conurbation) urban centre of national importance
regional/local with potential for transnational/national
JESENICE, RADOVLJICA (conurbation) urban centre of national importance
regional/local with potential for transnational/national
POSTOJNA urban centre of national importance with potential for transnational/national
RAVNE NA KOROŠKEM, SLOVENJ GRADEC, DRAVOGRAD (conurbation) urban centre of national importance
regional/local with potential for transnational/national
SKOFJA LOKA urban centre of regional importance regional/local
KAMNIK, DOMŽALE (conurbation) urban centre of regional importance regional/local
KOCEVJE urban centre of regional importance regional/local
AJDOVŠČINA urban centre of regional importance regional/local TRŽIČ urban centre of regional importance regional/local
ORMOŽ urban centre of regional importance regional/local
ŽALEC urba centre of local importance regional/local
IDRIJA urban centre of regional importance with potential for regional/local
CRNOMELJ urban centre of regional importance with potential for regional/local
SEŽANA urban centre of regional importance with potential for regional/local
ILIRSKA BISTRICA urban centre of regional importance with potential for regional/local ROGAŠKA SLATINA, ŠMARJE PRI JELŠAH (conrubation) urban centre of regional importance with potential for regional/local
TOLMIN urban centre of regional importance with potential for regional/local
LJUTOMER urban centre of regional importance with potential for regional/local
LENDAVA - LENDVA urban centre of regional importance with potential for regional/local
GORNJA RADGONA urban centre of regional importance with potential for regional/local
* - according to the Strategy of Slovenian Spatial Development, MOPE, 2004, www.sigov.si/mop ** - according to the FUA analysis by own research and calculations
Currently, Slovenia has a well developed polycentric urban system with a prevalence of small towns, as shown in Table 3.7. Regarding the size, the discrepancy between Ljubjlana, Maribor and other urban centres is still too

ESPON 1.1.3 - Final Report Part 2 179
large. There is a lack of medium-sized towns in Slovenia, which would enhance a more balanced regional development. Note that the differences between the number of FUAs in Slovenia in table 3.7 and in table 3.2 are primarily due to the more detailed and updated data from Slovenian sources.
3.5.2 Interpreting national polycentricity from the “ground”
As seen earlier in this chapter, on a national level, Slovenia is one of the most polycentric countries in the new member states and accession countries (excluding the special case of Cyprus), with high scores on all three dimensions of polycentricity: size, location and connectivity. However from the “ground” and at the very moment, the situation is a bit more complex. Ljubljana, Maribor and other urban centres are still too big. There is a lack of medium-sized towns in Slovenia, which would enhance a balanced regional development.
Transitional processes exert an important influence on further development, and since 1990 these processes have promoted the tendency of polarization of the urban system. The centralization of public services into the state centre has become the biggest threat to the urban system. Work places are also concentrated in large urban centres, thus adversely affecting a balanced regional development.
This has resulted in a higher daily mobility of the work force that makes use of the existing road and railway transport system. It can be thus established that transport networks support the polycentric development of urban systems, economic development, and increased competitiveness of regions and the entire country. The road and railway networks, airports, seaports, and other transport systems interconnect cities and other settlements, urban and rural areas, regions, and other strategically or otherwise significant areas into a balanced spatial structure. The problems of the traffic system are best evident in transversal (road and railway) connections which cannot be performed due to natural obstacles (e. g. the Alps).
Another discrepancy should be given some attention, i.e . the understanding of the polycentric development in areas of different sizes. The problem first emerges in the comparison between countries of different sizes, since even the size class of single towns and urban centres is often incomparable. Another, even larger conflict is in the comparison of the European urban network and urban networks at the level of single countries. Smaller countries and countries outside of “Pentagon”, including Slovenia, have had

ESPON 1.1.3 - Final Report Part 2 180
large problems in trying to meet the strategic goals ('Lisbon') on the one hand, and, on the other hand, meeting their own guidelines for achieving polycentric development.

ESPON 1.1.3 - Final Report Part 2 181

ESPON 1.1.3 - Final Report Part 2 I
PART 2 Results of the Project
Chapter 4

ESPON 1.1.3 - Final Report Part 2 II

ESPON 1.1.3 - Final Report Part 2 III
Table of Contents for Part 2 Chapter 4
4 Scenario Studies 182
4.1 Introduction to the Models 182
4.2 Scenario Study I (RESSET) 183
4.2.1 The RESSET Approach 183
4.2.2 The Calibration Summarized 185
4.2.3 Aggregate Model Scenario Results 187
4.2.3.1 Trend Scenarios 188
4.2.3.2 Examples of ‘What If’ Scenarios: Sampling the Scenario Space 193
4.2.4 Limitations of the Model Scenario Results 196
4.3 Scenario Study II: Transport (SASI) 197
4.3.1 The SASI model 198
4.3.2 Transport scenarios 200
4.3.3 Scenario results 201
4.3.4 Conclusions 217
Figures
Figure 4.1: The Three Level Model Structure 184
Figure 4.2: Normalised Accessibility Potentials 1981 185
Figure 4.3: Activity Shares and Calibrated Model Fit at 1996 187
Figure 4.4: Illustrative Linkages at the NUTS0 Level Controlling the Weights on the Accessibilities The Same Structure is also used at the NUTS3 Level (The circles are consistent with the normalised accessibility potentials as in figure 4.2) 188
Figure 4.5: 100 year + Trend Scenario: The Very Long Term Redistribution of Employment Activity 190
Figure 4.6: Very Long Term Trend Projections in the ESPON Space 192
Figure 4.7: Percentage Differences from the Trend Scenario Due to Exogenous Investments as Specified Over a 20 year Period to 2021 194
Figure 4.8: The SASI model 199

ESPON 1.1.3 - Final Report Part 2 IV
Figure 4.9: Development of accessibility rail/road/air, travel in the old member states (EU15) and the new member states and accession countries (NMAC) 1981-2031 202
Figure 4.10: Accessibility rail/road/air, travel in the Reference Scenario 00 (million) and accessibility effects of Scenarios A1, B1 and B5 in 2031 (%) 204
Figure 4.11: GDP per capita in the Reference Scenario 00 and absolute GDP per capita effects of Scenarios A1, B5 and B6 in 2031 (Euro of 2005) 208
Figure 4.12: GDP per capita in the Reference Scenario 00 (Euro of 2005) and relative GDP per capita effects of Scenarios A1, B5 and B6 in 2031 (%) 209
Figure 4.13: GDP per capita in the Reference Scenario 00 (EU27+7=100) and relative GDP per capita effects of Scenarios A1, B5 and B6 in 2031 (%) 210
Figure 4.14: Development of polycentricity in the old member states and in the new member states and accession countries 1981-2031 215
Figure 4.15: Development of polycentricity of MEGAs in Europe 1981-2031 217
Tables
Table 4.1: Decanal Percentage Shifts in Activity Shares Due to Investment and Migration: first row is employment, second row is population 194
Table 4.2: Decanal Percentage Shifts in Activity Shares for crude aggregations of the SASI Scenarios B1 and B2: first row is employment, second row is population 196
Table 4.3: SASI model: accessibility rail/road/air, travel 2031 202
Table 4.4: SASI model: GDP per capita 2031 206
Table 4.5: SASI model: accessibility cohesion effects 2031 212
Table 4.6: SASI model: GDP/capita cohesion effects 2031 213
Table 4.7: SASI model: Polycentricity Indicator 2031 215

ESPON 1.1.3 - Final Report Part 2 182
4 Scenario Studies
4.1 Introduction to the Models
In this chapter the methodologies and results for examining the regional and spatial effects of the enlargement of the European Union on the development of GDP, sectoral structure, trade, investment, employment, population and migration flows on the regions in the new member states, in particular least favoured regions and border regions, are discussed and demonstrated in preliminary examples.
To forecast the effects of enlargement, two scenario studies are conducted in ESPON 1.1.3 using two different but complementary forecasting models of regional socio-economic development:
- The RESSET model used in Scenario Study 1 is a new model which is designed primarily for ESPON 1.1.3. It is a preliminary sketch of a planning model which enables any casual user with a view about the future urban and regional development of the ESPON space to engage in information speculation: to explore the scenario space. Submodels in RESSET are similarly described. The model has not been developed further. The following is simply a cursory evaluation and a comparison with the SASI model.
-The SASI model also used in ESPON 2.1.1 is a model of regional socio-economic development particularly designed to show the impacts of European transport policies. It has since been used specifically to forecast the socio-economic development of the regions in the new member states after their entry into the European Union taking account of the expected reduction of border barriers, such as waiting times and customs procedures as well as different scenarios of implementation of the TEN-T and TINA projects
The two models are made as much as possible comparable by using a harmonised spatial database and similar assumptions about the overall economic and demographic development of the enlarged European Union as a whole.

ESPON 1.1.3 - Final Report Part 2 183
4.2 Scenario Study I (RESSET)
4.2.1 The RESSET Approach
The scenarios generated by the RESSET Model (REgional Scenario Simulations for the European Territory) are quite different in conception from those produced by SASI which follows in 4.3 RESSET is a sketch planning model that enables the user to very quickly test a scenario at different levels of detail by specifying different scales of change in population, employment, and accessibility. Whereas SASI is a large scale simulation model which is operated by professional model builders, RESSET is a sketch planning tool that is tiny in comparison, being delivered to any user over the net and designed to be run over and over again to generate a sense of the future development of Europe rather than very detailed results at the subregional level. The model is available in various forms at http://www.casa.ucl.ac.uk/resset/. In this section we will report the model results for the pilot study at the country level (NUTS0) which suffices to demonstrate the way scenarios are developed and then for the full model runs which are detailed at the NUTS3 level. Only a cursory evaluation of the model results is included here but some comparisons with the SASI model are given.
RESSET simulates change in the European space at three levels: first at the entire EU29 level (EU15+CH+NO+AC12) which involves a demo-economic forecasting model of the 29 countries based on simple extrapolation of population and employment under various plausible scenarios about aggregate growth rates – fertility and mortality, net migration and economic development. This model is one that forecasts DEmographic and eCOnomic activity aspatially in Europe with respect to global and regional issues and we refer to this as the DECO submodel. The second model which we refer to as the CORE of the system is a submodel that is a spatial simulation of growth and change in population and employment at the country level but is informed by accessibilities and relative COuntry/REgion level attractions. CORE is simply an intermediate model that acts to make the DECO results consistent with those produced at the third level which is a disaggregation of CORE, referred to as URAL, which involves simulating an apportionment of URban and ruRAL growth/change from the country level to the NUTS3 regions. This model is also a spatial accessibility-based model but it effectively moderates the forecasts made at the two higher levels by factoring in urban and rural differences as well as the unevenness of national
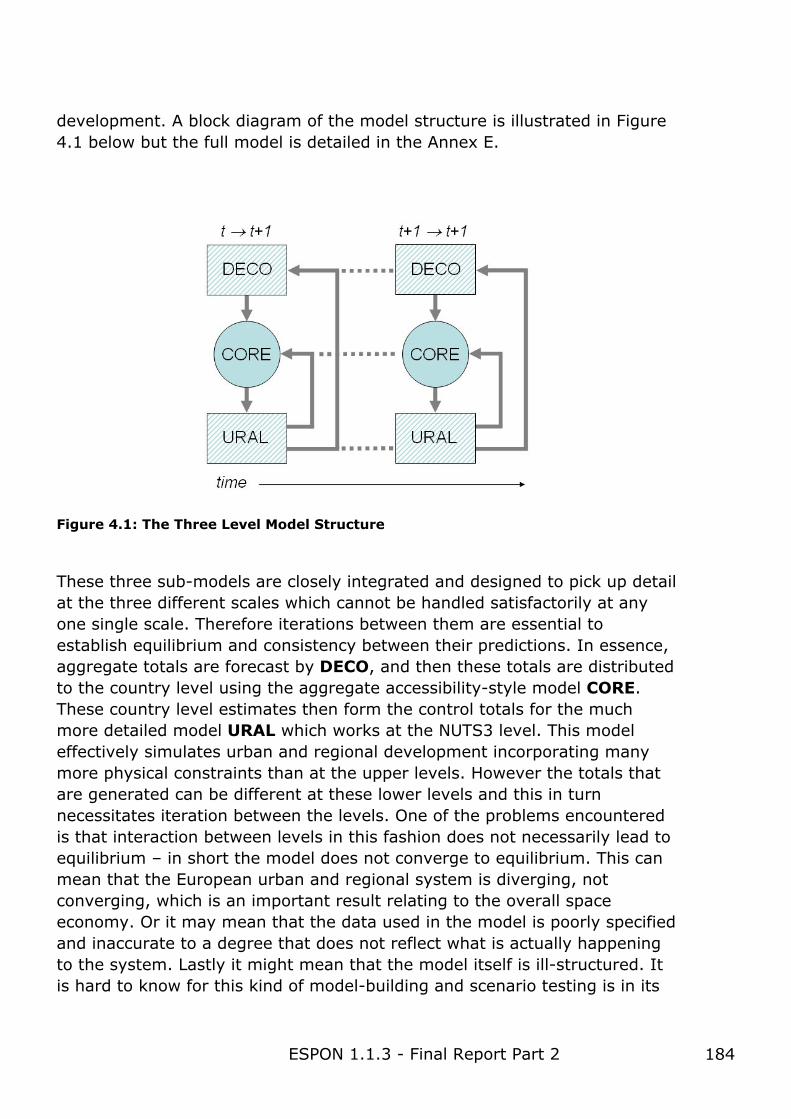
ESPON 1.1.3 - Final Report Part 2 184
development. A block diagram of the model structure is illustrated in Figure 4.1 below but the full model is detailed in the Annex E.
Figure 4.1: The Three Level Model Structure
These three sub-models are closely integrated and designed to pick up detail at the three different scales which cannot be handled satisfactorily at any one single scale. Therefore iterations between them are essential to establish equilibrium and consistency between their predictions. In essence, aggregate totals are forecast by DECO, and then these totals are distributed to the country level using the aggregate accessibility-style model CORE. These country level estimates then form the control totals for the much more detailed model URAL which works at the NUTS3 level. This model effectively simulates urban and regional development incorporating many more physical constraints than at the upper levels. However the totals that are generated can be different at these lower levels and this in turn necessitates iteration between the levels. One of the problems encountered is that interaction between levels in this fashion does not necessarily lead to equilibrium – in short the model does not converge to equilibrium. This can mean that the European urban and regional system is diverging, not converging, which is an important result relating to the overall space economy. Or it may mean that the data used in the model is poorly specified and inaccurate to a degree that does not reflect what is actually happening to the system. Lastly it might mean that the model itself is ill-structured. It is hard to know for this kind of model-building and scenario testing is in its

ESPON 1.1.3 - Final Report Part 2 185
infancy., In short models of the European space economy have not been built before and thus the sheer size and scale of the area is such that a comprehensive model of the system is much less relevant than models that have been developed for finer scales at the level of region or metropolis.
4.2.2 The Calibration Summarized
In essence, the model is calibrated by choosing accessibility parameters for the two inked sectors of employment and population which reflect the linkages between economic and demographic sectors as accessibility potentials and their relevant weights through the parameters linking these sectors together mirroring generic spatial relationships. The calibration period is from 1981 to 1996 based on the data available which has been provided by the SASI model. The model is iterated between NUTS0 and NUTS3 levels and for all runs, we have enabled this iteration over two loops. Here we show the results only for the NUTS0 level and these are consistent but not quite the same as those reported in the Third Interim Report. The problem of iteration to equilibrium over many loops is such that the model does not converge and tends to drain areas of economic and demographic activity, thus implying that the kind of inertia that we see in the real European space economy is considerably greater than is implied by the predictions from this model.
Population
Employment
Figure 4.2: Normalised Accessibility Potentials 1981
ESPON 1.1.3 - Final Report Part 2 186
As potentials have such an important role in the model, we show those computed for the start of the calibration period (1981) in figure 4.2 at the NUTS0 level. What is immediately clear is that these potentials are biased to the areal core of the ESPON space. This is not so surprising but what it does imply is that this core will be much favoured in any projections with these models. Examining the calibration results shows immediately that
• population and employment are under-predicted in countries with the largest populations and employments
• the western European heartland as well as the north-western, west and southern peripheries tend to under-predict while the central Austrian corridor and eastwards over-predicts
• smaller countries in area tend to over-predict
These results are shown in figure 4.3. A word about all the maps is in order. We do not intend to give specific predictions in terms of values at this stage. Like in the SASI model, we are concerned with shifts and differences. In general in calibration in figure 4.3, blue shows a lesser share than observed, red a greater share in terms of the difference map. We also urge caution with respect to our definitions of potential in that we have used a distance/travel cost adjacency matrix which is between capital cities to start the simulation at the NUTS0 level and we then use a finer matrix at the NUTS3 level when we iterate the model structure. We show the equivalent results which are consistent with these aggregates in the Annex E for the NUTS3 level. As our purpose here is to simply show the general trends in terms of scenarios tested then these aggregate results suffice to give a feel for how the model is working. They are of course consistent with the disaggregate results in the Annex E.

ESPON 1.1.3 - Final Report Part 2 187
Employment Share 1996 Population Share 1996 Ratio Fit of Model 1996
Figure 4.3: Activity Shares and Calibrated Model Fit at 1996
4.2.3 Aggregate Model Scenario Results
The essence of the scenario testing is based on changing the exogenous inputs to the model and then assessing changes in the distribution of population and employment. In fact the most obvious way to change these inputs is through changing the accessibilities which is a very central way in which models of this kind operate. We can also move population and jobs directly in the model by specifying and controlling these inputs to the initial (starting) conditions for the model. However to give some idea of how we proceed, then in terms of accessibilities we have the possibility as in the SASI model of changing the relative accessibility relationships between any pair of zones – at the NUTS0 level these are country wide accessibilities – and then using these changes as the basis of the various scenarios. In essence the matrix of distances (which are in fact travel costs in this model) are altered and policies reflecting regional advantage and disadvantage in terms of linkage are embodied in the model in this way. For example, at the NUTS0 level these potentials computed in figure 4.4 are composed in linkages between the various countries which we show illustratively in figure 4.4 as crow-fly lines – it is these which are weighted to reflect changing access policies. The same kind of linkage pattern but at a local level is specified for the NUTS3 level but we are cannot show this as it is composed of over 1000 zones. The major problem that we have in developing scenarios however is that this level of detail is so rich that all we are able to do is change a tiny fraction of these interzonal links to reflect policy bundles which determine the scenarios.

ESPON 1.1.3 - Final Report Part 2 188
Figure 4.4: Illustrative Linkages at the NUTS0 Level Controlling the Weights on the
Accessibilities The Same Structure is also used at the NUTS3 Level (The circles are
consistent with the normalised accessibility potentials as in figure 4.2)
In fact in what follows we develop two kinds of scenario – first a trend-based scenario which is the baseline and then a series of other illustrative scenarios which reflect positive policies for job and populations movements. In the first instance, these scenarios are the same as those reported in the Interim Report although here we a series of new scenarios which are tuned to mirror similar ones to those tested by the SASI model. The results however are a little different from the Interim Report in these are now moderated in the looping with the lower level sub-model running at the NUTS3 level.
4.2.3.1 Trend Scenarios
A key stage following calibration is to project the calibrated values into the medium and long-term future. This gives some idea of where the system is

ESPON 1.1.3 - Final Report Part 2 189
heading. In a sense, what it will show is a kind of long-term equilibrium if the ESPON space were as mirrored in the model. We know that this can never be the case as the model is extremely crude and does not take account of any rest of the world sector. The calibrated model is a little bit like treating Europe as an entirely closed, homogeneous system, and it is fairly obvious that in this case, there would be a restructuring towards its areal centre as implicit in the potentials in figure 4.2. In fact this presents rather a nice contrast with the scenarios we intend to illustrate here which are ones in which exogenous growth is injected to counter such introversion of development.

ESPON 1.1.3 - Final Report Part 2 190
Figure 4.5: 100 year + Trend Scenario: The Very Long Term Redistribution of
Employment Activity
Nevertheless, what we have done is to show what this future will look like. In figure 4.5, we show what happens to employment when we project forward into the very long term future. This is more than 100 years into a future that redistributes everything according to the calibrated model. This has no inertia whatsoever. Basically the patterns noted above reinforce themselves although the growth of the central Austrian belt, and the decline of Italy, UK, Germany and France, all stabilise as expected in this kind of model. This is the implication of a closed Europe with no barriers to movement and a completely mobile population. All we can take from this is that this is the trend in the absence of any other drivers of development. It is a world where smaller countries get bigger and larger get smaller in terms of shares. In a sense, this is a picture of a regional bloc diffusing and diversifying as activity spreads, notwithstanding the fact that the picture is still pretty uneven in the long-term steady state.
Here we encounter the problem of treating the European space economy in this way for what is happening is that the heartland is sucking activity out of the periphery and that this show that not enough inertia is reflected in the model. It is a long-term divergence in that rather than the heartland diffusing and spreading out; migration is greatest from the periphery. In a sense, this is what has been happening certainly in the east of Europe and to a lesser extent from the Mediterranean countries. Populations are moving

ESPON 1.1.3 - Final Report Part 2 191
rapidly towards the more accessible European spaces with the exception of the UK and some other counter outside the Eurozone where the local economies are more flexible and still attracting migration. In figure 4.6, we show pictures of absolute activity volumes and shifting shares for employment and population which illustrate this draining from the periphery. This shows that the model cannot capture differences in economic structure posed by capital markets and related factors. This is purely and accessibility based model and does not account for differences in interest rates and other economic flows which are central to the impact the enlarged EU will have on urban and regional development throughout the Union.

ESPON 1.1.3 - Final Report Part 2 192
Employment 1996 to Circa 2121
Population 1996 to Circa 2121
Now: End of 20th Century Twenty Five Years On End of the 21st Century
and Beyond
Employment (left) and Population (right) Share Change During 21st Century
Figure 4.6: Very Long Term Trend Projections in the ESPON Space

ESPON 1.1.3 - Final Report Part 2 193
4.2.3.2 Examples of ‘What If’ Scenarios: Sampling the Scenario Space
First we have defined three major and somewhat radical long term scenarios which we list as follows:
• Policies to move jobs from western Europe to the east: injections of employment at levels of 15% or more in the key eastern countries of Poland, Czech, Slovakia, and Hungary. This we assume is a consequence of a declining agricultural base and the need for subsidy to bring employment levels back up.
• The natural growth of western Europe, particularly the Low Countries, UK, France and Germany from East Asian and North American investment, presumably in financial services and related tertiary, quaternary and quinary sectors, adding 15% to employment levels.
• The growth of the south in terms of migrating population to Greece, Spain, Portugal and the islands, adding 15% to these population levels.
We have run the integrated model using these assumptions which imply an injection of increased shares to the appropriate countries. Note that the Scenario Manager is actually designed to receive data in the form in which these scenarios are predicated. In these three runs, we have not implemented any changes in interaction potentials related to accessibility largely because at this stage we consider the SASI model to be much superior in this regard. Our role with RESSET we believe is to generate ‘off-the-wall’ thinking about the future and to use this model to inquire about radical alternatives. The detail of these scenarios is represent in crude map terms and in terms of percentage changes for the same large blocks used in the SASI model results below. In terms of spatial distributions, the injections of employment and population lead to increases in their equivalents as expected but the spatial spill-over effects are largely confined to the Scandinavian and Baltic Republics and south east Europe in all cases. In fact, accessibility does not impact very greatly in terms of spreading these relevant benefits as figure 4.7 implies.

ESPON 1.1.3 - Final Report Part 2 194
15% Employment
Increase in East
15% Employment
Increase in West
15% Population Increase
in Mediterranean Areas
Figure 4.7: Percentage Differences from the Trend Scenario Due to Exogenous
Investments as Specified Over a 20 year Period to 2021
The next analysis we will produce here shows the impact of these changes on four different regional blocks. In table 4.1, we show the percentage gain or loss over the steady state share for each scenario for the following three regions: EU15, CH+NO, AC12 which compose the entire 29 country ESPON Area.
Table 4.1: Decanal Percentage Shifts in Activity Shares Due to Investment and Migration: first row is employment, second row is population
Scenario EU15 CH+NO AC12
0.49 2.54 0.51 Eastern
Growth 0.53 2.19 0.57
0.47 1.88 -1.32 Western
Growth 0.49 1.92 -1.87
-0.28 -0.54 0.43 Southern
Migration -0.19 -0.98 0.44
Table 4.1 shows that the shifts are quite small with the western growth having the biggest impacts on the west itself and on CH+NO. In fact it would appear from these impacts that it is more difficult to generate spill-over effects in the eastern than the western or southern regions of the EU but that the non-EU members benefit most from any investment in jobs in the

ESPON 1.1.3 - Final Report Part 2 195
west or east. These results are highly tentative and in the spirit of the model we are developing, we consider that these sorts of informed speculation on the future must be the basis for considered discussion, no more and, of course, no less. More detail is contained in the Annex E.
The last set of scenarios we have developed relate to tests of those used on the SASI model. It has not been possible to coordinate these entirely with the SASI model as the structure of these models is very different but that these are offered in the same spirit and are comparable. Again detail is included in the Annex E. As SASI is a transport related model, we have changed the detailed NUTS3 accessibility weights to reflect two of the 6 scenarios structures and the reference. The SASI reference scenario is essentially the same as our trend scenario but without the original TEN transport projects. The difference between Scenario 00 in section 4.3 and our own trend is that the accessibility improvements do not figure and therefore the effect of polarisation in the new candidate countries is not as pronounced In fact the draining effect from the periphery to the heartland is clearly modified by these transport improvements as seen in section 4.3. However what the RESSET model is probably better at mirroring although this is extremely crude is the potential for intercountry migration and in this sense; it would appear that the SASI model might underestimate migration effects. However in both models, labour market effects are implicit and there are no financial movements explicitly simulated. This means that countries outside the Eurozone are handled no differently from those within and this is clearly unrealistic. What this implies is that fully fledged econometric modelling is needed it these results are to be tempered by what is actually happening at present. As we implied earlier, there is no guarantee that scaling model forecast to an entire continent will capture the effects that actually are happening: this is uncharted territory.
Nevertheless what we have tried to test are two scenarios which are similar to the SASI scenarios B1 and B2. These involve testing respectively the impact of the new set of TEN policies and all TEN and TINA policies in the new member states. However because we do not have the capability in this model to incorporate all the effects only the 20 most significant changes to the network structure have been incorporated. This is possible in this model because the detailed representation of the network as reflected in the SASI model is not the same as the RESSET model in that we always deal with direct distances between zones rather than a detailed transportation network.

ESPON 1.1.3 - Final Report Part 2 196
We summarise at aggregates of the country level the effects of the two scenarios on population and employment shifts in table 4.2 in similar matter to previously. These show:
Table 4.2: Decanal Percentage Shifts in Activity Shares for crude aggregations of the SASI Scenarios B1 and B2: first row is employment, second row is population
Scenario EU15 CH+NO AC12
1.55 4.56 0.25 B1
1.89 3.26 0.34
0.76 3.65 4.32 B2
0.43 2.12 6.87
Essentially what these show is that the new countries AC12 do gain differentially once transport policies are put in place as in B2 but do not gain as much if the new TEN projects are implemented simply for the original EU15. This is not surprising. In so far as it is possible, the SASI predictions are borne out at least in aggregate terms although the effect of the periphery is still much stronger in the RESSET predictions. Before we launch in the SASI analysis in section 4.3, we will comment briefly by way of conclusion as to the limitations of these kinds of model and their further development.
4.2.4 Limitations of the Model Scenario Results
Essentially aggregate spatial demo-economic forecasting of the kind employed here which is informed by lower level- finer scale simulation is limited in its representation of labour markets, financial flows and instruments, and of course the rest of the world sector. The SASI model predicts that transport improvements will raise GNP in the candidate countries and although the RESSET model does not simulate this, we consider that employment and population growth in an enlarged Europe would correlate strongly with GNP. In fact there data used is highly correlated in the past. In RESSET, we also tentatively found that there is polarisation in capital cities – see the Annex E – and that generally there is a rising tide of increased wealth throughout the enlarged community but differentials between EU15 and ASC12 remain substantial over a 50 year time span. The biggest worry in these models is that the kind of divergence

ESPON 1.1.3 - Final Report Part 2 197
seen in Europe at the present time is not captured in these spatial simulations – how could it be for this excludes aggregate monetary and immigration policy as well as quality of life issues. However we consider that this model and the one that follows provide a robust framework for further work. Considerably more detailed data is required and much more effort should be focused in the multilevel modelling consequences of this approach. Finally, we are concerned that we do not have the correct tools to simulate entire continental areas such as the enlarged Europe and that this is new territory for all forms of spatial forecasting
4.3 Scenario Study II: Transport (SASI)
One of the main obstacles for the integration of the candidate countries in eastern Europe is the poor quality of transport infrastructure in these countries and between these countries and western Europe. This problem has been addressed by the Transport Infrastructure Needs Assessment (TINA) programme of transport infrastructure corridors for the accession countries (TINA, 1999; 2002). However, the territorial impacts of the TINA projects and the related trans-European transport network (TEN-T) projects are not clear at all. The outcome might be a higher level of cohesion but as well an increase in spatial disparities.
Therefore a second scenario study was conducted to assess the impacts of the TEN-T and TINA projects on the regions in the accession countries. The method used was the regional economic model SASI used already in ESPON 2.1.1 (ESPON 2.1.1, 2004). Here the SASI model was used specifically to forecast the socio-economic development of the regions in the new member states after their entry into the European Union taking account of the expected reduction of border barriers, such as waiting times and customs procedures as well as different scenarios of implementation of the TEN-T and TINA projects.

ESPON 1.1.3 - Final Report Part 2 198
4.3.1 The SASI model
The SASI model is a recursive simulation model of socio-economic development of regions in Europe subject to exogenous assumptions about the economic and demographic development of Europe as a whole and transport infrastructure investments and transport system improvements, in particular of the trans-European transport networks (TEN-T) and TINA networks. For each region the model forecasts the development of accessibility and GDP per capita. In addition cohesion indicators expressing the impact of transport infrastructure investments and transport system improvements on the convergence (or divergence) of socio-economic development in the regions and polycentricity indicators expressing the impact of transport infrastructure investments on the polycentricity of national urban systems are calculated.
The main concept of the SASI model is to explain locational structures and locational change in Europe in combined time-series/cross-section regressions, with accessibility indicators being a subset of a range of explanatory variables. Accessibility is measured by spatially disaggregate accessibility indicators (Schürmann et al., 1997; Wegener et al., 2001). The focus of the regression approach is on long-term spatial distributional effects of transport policies. Factors of production including labour, capital and knowledge are considered as mobile in the long run, and the model incorporates determinants of the redistribution of factor stocks and population. The model is therefore suitable to check whether long-run tendencies in spatial development coincide with spatial development objectives of the European Union.
The SASI model differs from other approaches to model the impacts of transport on regional development by modelling not only production (the demand side of regional labour markets) but also population (the supply side of regional labour markets). A second distinct feature is its dynamic network database based on a 'strategic' subset of highly detailed pan-European road, rail and air networks including major historical network changes as far back as 1981 and forecasting expected network changes according to the most recent TEN-T and TINA planning documents.
The SASI model has six forecasting submodels: European Developments, Regional Accessibility, Regional GDP, Regional Employment, Regional Population and Regional Labour Force. A seventh submodel calculates Socio-Economic Indicators with respect to efficiency and equity. Figure 4.8 visualises the interactions between these submodels.

ESPON 1.1.3 - Final Report Part 2 199
Figure 4.8: The SASI model
The spatial dimension of the model is established by the subdivision of the European Union into regions at the NUTS-3 level. The study area of the model consists of the original 15 EU member states (1,085 regions), the 10 new member states (121) regions, the two accession countries Bulgaria and Romania (70 regions), Norway and Switzerland (45 regions) and the western Balkan countries Albania, Bosnia-Herzegovina, Croatia, Macedonia and Yugoslavia (9 regions), in total 1,330 regions. The regions are connected by road, rail and air networks. The temporal dimension of the model is established by dividing time into periods of one year duration. The base year of the simulations is 2001, and the forecasting horizon is 2031, however, in a backcast also the period 1981-2001 is modelled. In each simulation year the seven submodels of the SASI model are processed in a recursive way, i.e. sequentially one after another, i.e. within one simulation period no equilibrium between model variables is established; in other words, all endogenous effects in the model are lagged by one or more years.

ESPON 1.1.3 - Final Report Part 2 200
More detailed information on the SASI model and its implementation and calibration for ESPON can be found in Wegener and Bökemann (1998) and the Final Report of ESPON 2.1.1 (ESPON 2.1.1, 2004).
4.3.2 Transport scenarios
In ESPON 1.1.3 one Reference Scenario and six policy scenarios were simulated:
- Scenario 00: The Reference Scenario (Scenario 00) is defined as the fictitious development that would have taken place if there had been no EU enlargement and only the transport projects of the old ('Essen') priority list of TEN projects (European Commission, 2002) would be implemented. The Reference Scenario serves as the benchmark against which all policy scenarios are evaluated.
Scenario A1: The first policy scenario is not a transport scenario in the narrow sense of the term but examines the impacts of the EU enlargement itself on transport and hence accessibility and economic development. In the enlargement scenario no transport infrastructure projects beyond the projects already contained in the Reference Scenario are implemented. However, it is assumed that the process of enlargement started in 2004 gradually reduces the barriers to economic exchange and travel as well as waiting times and costs at border crossings between the old and new member states and between the new member states themselves.
All remaining policy scenarios include Scenario A1, i.e. assume the same integration affects as Scenario A1:
- Scenario B1: This scenario assumes that all transport infrastructure projects of the new TEN priority list (HLG, 2003), which includes more projects in the new member states, will be implemented.
- Scenario B2: This scenario assumes that, in addition to the TEN priority projects of Scenario B1, all TEN and TINA projects in the new member states as documented in the latest revisions of the TEN-T and TINA programmes (European Union, 2004; TINA, 2002) will be implemented.
- Scenario B3: This scenario assumes that, in addition to the TEN priority projects of Scenario B1, all TEN and TINA projects in the old and new member states as documented in the latest revisions of the TEN-T and TINA programmes (European Union, 2004; TINA, 2002) will be implemented.

ESPON 1.1.3 - Final Report Part 2 201
- Scenario B4: This scenario assumes that, in addition to the projects included in Scenario B3, further transport infrastructure projects in the new member states will be implemented. This scenario is a modification of a scenario proposed by Tomasz Komornicki and Piotr Korcelli of the Institute of Geography and Spatial Organisation of the Polish Academy of Sciences for the EU 5th Framework project IASON (Bröcker et al., 2004).
- Scenario B5: This scenario assumes that, in addition to the projects of Scenario B4, an extended list of transport infrastructure projects in the new member states will be implemented. Also this scenario is a modification of a scenario proposed by Tomasz Komornicki and Piotr Korcelli for IASON (Bröcker et al., 2004).
4.3.3 Scenario results
This section presents the results of the simulation runs of the six policy scenarios. The presentation starts with the impacts of the scenarios on accessibility and GDP per capita of the 1,330 model regions until 2031. Then the results are summarised with respect to their effects on territorial cohesion and polycentricity.
Accessibility
Table 4.3 shows summary results for accessibility (rail/road/air, travel) of the six policy scenarios. The numbers are differences between the policy scenario and the Reference Scenario in 2031 in percent for the old EU member states (EU15), Switzerland and Norway (CH+NO), the ten new member states and the accession countries Bulgaria and Romania and the total model region (EU27+7). Figure 4.9 shows the development of regional accessibility averaged over EU15 and new member states and accession countries between 1981 and 2031. Figure 4.10 shows the spatial distribution of accessibility in the Reference Scenario and the impacts of the enlargement scenario and two infrastructure scenarios in the new member states and the accession countries. Maps showing the accessibility effects on all European regions are contained in Annex A8.

ESPON 1.1.3 - Final Report Part 2 202
Table 4.3: SASI model: accessibility rail/road/air, travel 2031
Accessibility difference between policy
scenario and Reference Scenario (%)
Scenario EU15 CH+NO NMAC EU27+7
A1 Enlargement +8.9 +22.4 +19.1 +11.1
B1 A1 + all new priority projects +11.3 +26.8 +28.2 +14.6
B2 A1 + B1 + TEN/TINA projects in NMAC +12.4 +29.5 +36.8 +17.0
B3 A1 + all TEN/TINA projects +15.8 +33.6 +39.7 +20.3
B4 A1 + B3 + additional TINA projects +16.2 +37.5 +42.6 +21.3
B5 A1 + B3 + maximum TINA projects +16.5 +38.2 +45.1 +21.9
Figure 4.9: Development of accessibility rail/road/air, travel in the old member
states (EU15) and the new member states and accession countries (NMAC) 1981-
2031
The two heavy black lines in Figure 4.9 represent the development of accessibility in the Reference Scenario in EU15 and new member states and

ESPON 1.1.3 - Final Report Part 2 203
accession countries between 1981 and 2031, the thinner blue and red lines show how the enlargement scenario and the five transport policy scenarios deviate from the Reference Scenario. All scenarios improve accessibility everywhere, with the greatest improvements in the new member states and the accession countries. The largest effect has the enlargement process itself (Scenario A1), but also the infrastructure scenarios (Scenarios B1 to B5) have stronger effects in the new member states and accession countries.

ESPON 1.1.3 - Final Report Part 2 204
Figure 4.10: Accessibility rail/road/air, travel in the Reference Scenario 00
(million) and accessibility effects of Scenarios A1, B1 and B5 in 2031 (%)

ESPON 1.1.3 - Final Report Part 2 205
Projects in the new member states themselves and corridors linking the accession countries to western Europe (Scenario B2) contribute most to this improvement. If the number of projects in the accession countries is increased (Scenario B5), the effect is larger. In all infrastructure scenarios the gap in accessibility between western and eastern Europe is reduced; in Scenario B5, in which maximum additional infrastructure projects in the new member states are implemented, it is actually closed.
GDP per capita
Table 4.4 shows the results for GDP per capita of the three scenarios as differences between the policy scenarios and the Reference Scenario in 2031 in percent for the old member states (EU15), Switzerland and Norway (CH+NO), the new member states and accession countries and the total study region (EU27+7). The effects are shown in three ways: unstandardised as absolute differences in Euro (of 2005) per year, unstandardised as relative differences in percent and standardised as relative differences in percent of average GDP per capita in the total study region.

ESPON 1.1.3 - Final Report Part 2 206
Table 4.4: SASI model: GDP per capita 2031
GDP per capita difference between policy
scenario and Reference Scenario
Scenario
EU15 CH+NO NMAC EU27+7
Unstandardised (Euro of 2005) absolute
A1 Enlargement +810 +868 +228 +709
B1 A1 + all new priority projects +1,010 +1,037 +325 +887
B2 A1 + B1 + TEN/TINA projects in NMAC +1,092 +1,105 +407 +968
B3 A1 + all TEN/TINA projects +1,358 +1,311 +437 +1,187
B4 A1 + B3 + additional TINA projects +1,396 +1,356 +465 +1,224
B5 A1 + B3 + maximum TINA projects +1,416 +1,371 +488 +1,244
Unstandardised (Euro of 2005) relative (%)
A1 Enlargement +2.02 +2.97 +2.88 +2.10
B1 A1 + all new priority projects +2.51 +3.54 +4.11 +2.63
B2 A1 + B1 + TEN/TINA projects in NMAC +2.72 +3.77 +5.15 +2.87
B3 A1 + all TEN/TINA projects +3.38 +4.48 +5.52 +3.52
B4 A1 + B3 + additional TINA projects +3.47 +4.63 +5.87 +3.63
B5 A1 + B3 + maximum TINA projects +3.52 +4.68 +6.16 +3.69
Standardised (EU27+7=100) relative (%)
A1 Enlargement –0.09 +0.84 +0.76 0.00
B1 A1 + all new priority projects –0.12 +0.88 +1.44 0.00
B2 A1 + B1 + TEN/TINA projects in NMAC –0.15 +0.88 +2.21 0.00
B3 A1 + all TEN/TINA projects –0.14 +0.92 +1.93 0.00
B4 A1 + B3 + additional TINA projects –0.16 +0.96 +2.16 0.00
B5 A1 + B3 + maximum TINA projects –0.16 +0.95 +2.38 0.00
The unstandardised values include generative effects, whereas the standardised values shows distributional effects that would occur if there were no generative effects (zero-sum game). The standardised representation shows the relative winners and losers among the regions.

ESPON 1.1.3 - Final Report Part 2 207
The first thing to note in table 4.4 is that the relative large changes in accessibility of table 4.3 translate into only very small changes in economic activity. If only distributional effects are considered, the changes are even smaller. But again the new member states and accession countries are the winners. In relative terms, i.e. in percent, they gain most from both the enlargement and the transport infrastructure policies examined. If only distributional effects are considered, the old member states even become relative losers. However, a look at the absolute economic effects in constant Euro (of 2005) per year shows that high growth rates of the new member states are due to their low initial GDP per capita values. In absolute terms their gains are only about one third of those of the old member states. If one compares the scenarios, Scenario B5 with maximum additional infrastructure projects in the new member states produces the largest gains for the new member states, as to be expected.
Figures 4.11 to 4.13 show the spatial distribution of the three indicators of economic effects indicated in table 4.4. In each figure, the distribution of GDP per capita in the Reference Scenario is shown in the upper right-hand corner. The other three maps show, as in figure 4.10, the economic effects of the enlargement scenario and two infrastructure scenarios, Scenario B1 (A1 + all new priority projects) and B5 (A1+ all TEN/Tina projects + maximum additional TINA Projects). Maps showing the economic effects on all European regions are contained in Annex A8.
The maps of unstandardised GDP per capita in the Reference Scenario in figures 4.11 and 4.12 show the gap in wealth between the old and new member states. The other three maps in figure 4.11 indicate that the economic effects in the new member states are much smaller than those in the old member states. However, with the exception of the capital cities Ljubljana, Budapest, Bratislava, Prague, Warsaw, Vilnius, Riga and Tallinn, they are relatively evenly distributed over the new member states.
In contrast to this, the maps of the relative effects in figure 4.12 seem to indicate that the more peripheral regions in eastern Europe gain most. The explanation for this seeming contradiction is that the these regions have even lower initial values than the more central new member states, so that even a small improvement represents a great percentage change. This is particularly true for the west Balkan countries, which gain from their neighbourhood to the new member states and accession countries.

ESPON 1.1.3 - Final Report Part 2 208
Figure 4.11: GDP per capita in the Reference Scenario 00 and absolute GDP per
capita effects of Scenarios A1, B5 and B6 in 2031 (Euro of 2005)

ESPON 1.1.3 - Final Report Part 2 209
Figure 4.12: GDP per capita in the Reference Scenario 00 (Euro of 2005) and
relative GDP per capita effects of Scenarios A1, B5 and B6 in 2031 (%)

ESPON 1.1.3 - Final Report Part 2 210
Figure 4.13: GDP per capita in the Reference Scenario 00 (EU27+7=100) and
relative GDP per capita effects of Scenarios A1, B5 and B6 in 2031 (%)

ESPON 1.1.3 - Final Report Part 2 211
The maps of standardised GDP per capita (EU27+7=100) in figure 4.13 show the distributional effects of the enlargement and transport policy scenarios. In the map of standardised GDP per capita in the upper right-hand corner yellow and green shades indicate GDP per capita below the European average. It can be seen that even parts of the old member states, such as east Germany and southern Italy, have below-average GDP per capita. The three other maps show the relative winners (red) and relative losers (blue) among the regions. It can now be seen that parts of Poland and the Czech Republic, except the capitals Warsaw and Prague, become relative losers, i.e. grow less than the European average. As already shown in table 4.4, the new member states and accession countries gain more if more infrastructure projects on their territory are implemented. However, none of the scenarios closes the gap in economic performance between the old and new member states. This underlines that transport infrastructure alone is not enough to significantly reduce the existing economic disparities between the old and new member states. However, massive provision of transport infrastructure as in Scenario B5 would significantly contribute to that goal.
Cohesion
The SASI model calculates a range of cohesion indicators to measure the convergence or divergence of economic conditions under different scenarios. Two dimensions are relevant if cohesion indicators are to be compared:
- The first dimension is the area considered. Cohesion at the level of individual countries looks at the economic disparities within these countries. Cohesion at the European level means a reduction of economic disparities between the rich regions in the European core and the poorer regions at the European periphery or, after the enlargement of the EU, between the old and new member states. Unfortunately, both types of cohesion may be in conflict (see Section 3.2).
- The second dimension is the cohesion indicator used. It has been demonstrated in the IASON project and in ESPON 2.1.1 that different cohesion indicators give different results (Bröcker et al., 2004; ESPON 2.1.1, 2004). Some commonly used indicators even indicate convergence where in fact divergence has occurred. One important distinction is whether the indicator measures relative or absolute convergence or divergence – if, for instance, all regions gain in relative terms by the same percentage, the richer regions gain more in absolute terms.
Tables 4.5 and 4.6 show the cohesion effects of the six policy scenarios with respect to the distribution of accessibility and GDP per capita, respectively, compared to the Reference Scenario.

ESPON 1.1.3 - Final Report Part 2 212
Table 4.5: SASI model: accessibility cohesion effects 2031
Accessibility cohesion effects (+/–)
Scenario CoV Gini G/A RC AC
Total study area (EU27+7)
A1 Enlargement ++ ++ ++ + -
B1 A1 + all new priority projects ++ ++ ++ + -
B2 A1 + B1 + TEN/TINA projects in NMAC ++ ++ ++ + -
B3 A1 + all TEN/TINA projects ++ ++ ++ + -
B4 A1 + B3 + additional TINA projects ++ ++ ++ + -
B5 A1 + B3 + maximum TINA projects ++ ++ ++ + -
New member states and accession countries
A1 Enlargement + + · + --
B1 A1 + all new priority projects + + + ++ --
B2 A1 + B1 + TEN/TINA projects in NMAC + + + ++ --
B3 A1 + all TEN/TINA projects + + + ++ --
B4 A1 + B3 + additional TINA projects + ++ + ++ --
B5 A1 + B3 + maximum TINA projects ++ ++ + ++ --
+/++ Weak/strong cohesion effect: disparities reduced CoV Coefficient of variation (%) –/–– Weak/strong anti-cohesion effect: disparities increased Gini Gini coefficient (%) · Little or no cohesion effect G/A Geometric/arithmetic mean RC Correlation relative change v. level AC Correlation absolute change v. level

ESPON 1.1.3 - Final Report Part 2 213
Table 4.6: SASI model: GDP/capita cohesion effects 2031
GDP/capita cohesion effects (+/–)
Scenario CoV Gini G/A RC AC
Total study area (EU27+7)
A1 Enlargement + + + + --
B1 A1 + all new priority projects + + + + --
B2 A1 + B1 + TEN/TINA projects in NMAC + + ++ + --
B3 A1 + all TEN/TINA projects + + ++ + --
B4 A1 + B3 + additional TINA projects + + ++ + --
B5 A1 + B3 + maximum TINA projects + + ++ + --
New member states and accession countries
A1 Enlargement - + · + --
B1 A1 + all new priority projects + + + ++ --
B2 A1 + B1 + TEN/TINA projects in NMAC + + + ++ --
B3 A1 + all TEN/TINA projects + + + ++ --
B4 A1 + B3 + additional TINA projects + + + ++ --
B5 A1 + B3 + maximum TINA projects + + ++ ++ --
+/++ Weak/strong cohesion effect: disparities reduced CoV Coefficient of variation (%) –/–– Weak/strong anti-cohesion effect: disparities increased Gini Gini coefficient (%) · Little or no cohesion effect G/A Geometric/arithmetic mean RC Correlation relative change v. level AC Correlation absolute change v. level

ESPON 1.1.3 - Final Report Part 2 214
For easier reading the information in Tables 4.6 and 4.7 is simplified: a plus-sign indicates a pro-cohesion effect (i.e. disparities become smaller) and a minus-sign indicates an anti-cohesion effect (disparities grow). Five different cohesion indicators were calculated for the total study area (EU27+7) and the new member states and accession countries. The five indicators are indicators commonly used in the literature; the first four measure relative convergence or divergence, the last one measures absolute convergence or divergence.
The message of both tables is clear: If relative cohesion indicators are used, the enlargement of the European Union and all infrastructure projects examined reduce the disparities in accessibility and economic development both between the regions in the old and the new member states and between the regions in the new member states. However, in absolute terms, the regions in the old member states gain more, both in accessibility and GDP per capita, because of the much lower levels of accessibility and GDP per capita in the new member states.
Polycentricity
A methodological difficulty in forecasting polycentricity is that polycentricity is studied with cities as geographical units (see Section 3.4), whereas the SASI model is based on NUTS3 regions. Therefore the following assumptions were made to bridge the gap between NUTS3 regions and cities:
- Size Index. The population and GDP of a city change as the population and GDP of the NUTS3 region in which it is located.
- Location Index. The number of cities and hence the number and size of service areas remain constant.
- Connectivity Index. The accessibility of a city changes as the accessibility of the NUTS3 region in which it is located.
Table 4.7 shows the effects of the six policy scenarios on the Polycentricity Index of national urban systems (see section 3.4) calculated on the basis of functional urban areas (FUAs) defined by ESPON 1.1.1 (ESPON 1.1.1, 2004). The forecasts of accessibility and GDP of the FUAs were taken from the results of the SASI model for 2031 using the above assumptions, and averaged, as in table 4.3 and 4.4, over the old member states (EU15), Switzerland and Norway (CH+NO), the new member states and accession countries and the whole of Europe, as in Section 3.4 without the western Balkan countries (EU27+2) because no FUAs were identified in these countries by ESPON 1.1.1. Figure 4.14 shows the development of the index

ESPON 1.1.3 - Final Report Part 2 215
between 1981 and 2031 for the old member states (EU15) and the new member states and accession countries.
Table 4.7: SASI model: Polycentricity Indicator 2031
Polycentricity difference between policy
scenario and Reference Scenario (%)
Scenario EU15 CH+NO NMAC EU27+2
A1 Enlargement –0.34 –0.42 –2.15 –0.67
B1 A1 + all new priority projects –0.34 –0.52 –3.01 –0.84
B2 A1 + B1 + TEN/TINA projects in NMAC –0.33 –0.55 –3.18 –0.86
B3 A1 + all TEN/TINA projects –0.03 –0.48 –3.35 –0.66
B4 A1 + B3 + additional TINA projects –0.03 –0.48 –3.68 –0.72
B5 A1 + B3 + maximum TIUNA projects –0.04 –0.48 –3.58 –0.70
Figure 4.14: Development of polycentricity in the old member states and in the
new member states and accession countries (NMAC) 1981-2031
The two heavy black lines in figure 4.14 represent the development of the Polycentricity Index of national urban systems between 1981 and 2031 in the Reference Scenario 00 averaged over the old member states (EU15) and

ESPON 1.1.3 - Final Report Part 2 216
the new member states and accession countries. The thinner blue and red lines indicate how the enlargement scenario (Scenario A1) and the five transport infrastructure scenarios (Scenarios B1 to B5) deviate from the Reference Scenario between 2001 and 2031.
The diagram confirms that the urban systems of the accession countries are at present on average more polycentric than those of the old member states (see section 3.4). According to the backcast, they were even more polycentric in the past, probably because of their history as planned economies in which there was no market-driven spatial development.
However, after the opening of the Iron Curtain in the early 1990s, their capital cities and major agglomerations attracted formerly suppressed rural-to-urban migration with the effect that these cities grew at the expense of smaller urban centres.
Moreover, if the forecasts of the model are correct, polycentricity in the new member states and accession countries will further decline due to market forces and even become lower than that of the old member states. Polycentricity in the old member states declines, too, but much more slowly than in the new member states because of their longer experience with market-driven spatial development.
This is possibly also the reason why the infrastructure improvements in the three scenarios have only little effect on polycentricity in the old member states. Another reason may be that the transport networks in the old member states are already highly developed and can only marginally be improved. However, in the accession countries there is still a great demand for transport infrastructure and so infrastructure improvements have much larger effects. As it has already been observed in the discussion of cohesion, infrastructure improvements tend to be oriented towards the largest cities with the effect that polycentricity goes down in proportion to the volume of infrastructure improvements in the scenarios.
Figure 4.15 shows the development of the global Index of Polycentricity based on MEGAs (see section 3.4) between 1982 and 2031 in the Reference Scenarios and the six policy scenarios. Unlike the forecasts of national polycentricity in figure 4.14, polycentricity at the highest level of the urban hierarchy in Europe has increased in the past and is likely to increase in the medium-term future. This is mainly due to the fast economic growth of the capital cities and other large cities in the new member states. Already the opening of the Iron Curtain in the 1990s and the integration effects of the EU enlargement in 2004 (Scenario A1) have moved these cities up in the urban hierarchy. The transport infrastructure scenarios B1 to B5 add momentum to this process.
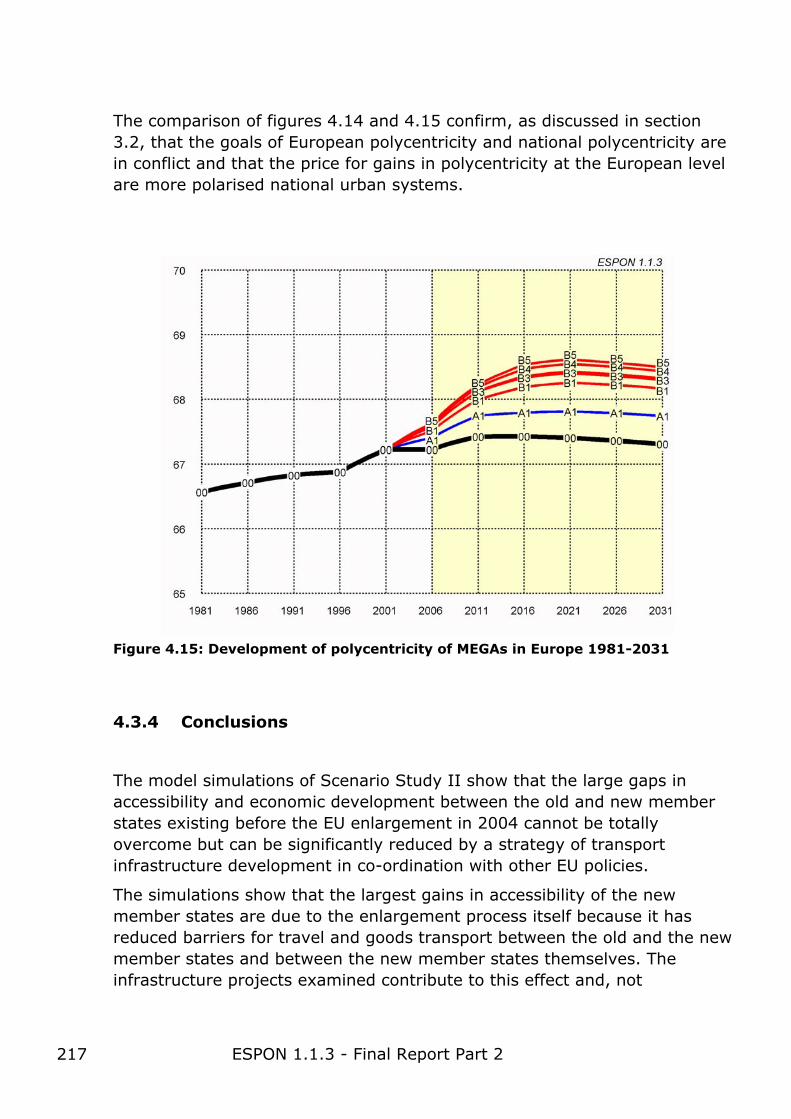
ESPON 1.1.3 - Final Report Part 2 217
The comparison of figures 4.14 and 4.15 confirm, as discussed in section 3.2, that the goals of European polycentricity and national polycentricity are in conflict and that the price for gains in polycentricity at the European level are more polarised national urban systems.
Figure 4.15: Development of polycentricity of MEGAs in Europe 1981-2031
4.3.4 Conclusions
The model simulations of Scenario Study II show that the large gaps in accessibility and economic development between the old and new member states existing before the EU enlargement in 2004 cannot be totally overcome but can be significantly reduced by a strategy of transport infrastructure development in co-ordination with other EU policies.
The simulations show that the largest gains in accessibility of the new member states are due to the enlargement process itself because it has reduced barriers for travel and goods transport between the old and the new member states and between the new member states themselves. The infrastructure projects examined contribute to this effect and, not

ESPON 1.1.3 - Final Report Part 2 218
surprisingly, the more infrastructure projects are implemented in the new member states, the better for them.
The forecasts of the effects on cohesion, however, show that the goal conflict between competitiveness and territorial cohesion discussed in section 3.2 are relevant. All policy scenarios examined, including the enlargement scenario, reduce disparities in accessibility and GDP per capita between the old and new member states in relative terms. However, in absolute terms, they widen the gap in accessibility and GDP per capita between the old and new member states.
Similarly, all policy scenarios examined contribute to increasing polycentricity at the European level by accelerating the economic development of the capital cities and other large cities in the new member states. However, the price to be paid for this is that the national urban systems of the new member states become more polarised.
These results confirm the need for a spatially differentiated spatial policy following the phase model outlined in section 3.2. Such a strategy implies that in the already highly developed and urbanised old member states existing or emerging polycentric structures are strengthened by predominantly improving the accessibility of medium-level central places and compensating the accessibility deficits of rural and peripheral regions. In the still urbanising new member states, however, for a transition period of ten to fifteen years it is justified to enhance the growth dynamics of these countries by fast and efficient transport connections between the capital cities and major agglomerations in the new member states and the economic centres in western Europe. After that period, however, the risk of over-dominance of these cities will have to be reduced by shifting the focus of investments first to medium-size cities and later, as in the old member states, to rural and peripheral regions.

ESPON 1.1.3 - Final Report Part 2 I
PART 2
Results of the Project
Chapter 5

ESPON 1.1.3 - Final Report Part 2 II

ESPON 1.1.3 - Final Report Part 2 III
Table of Contents for Part 2 Chapter 5
5 Policy Conclusions ............................................................ 219
5.1 Spatial consequences of the EU enlargement ............................ 219
5.2 A phase strategy of European spatial development .................... 222
5.3 Policy combinations............................................................... 224
5.4 Principle-based policy combinations......................................... 225
5.4.1 Macro level policy combinations .............................................. 225
5.4.2 Meso level policy combinations ............................................... 228
5.5 Capacity-based policy combinations ........................................ 229
5.5.1 Macro-level capacity-based policy combinations: Providing the knowledge...................................................................... 229
5.5.2 Meso-level capacity-based policy combinations- Creating the strategy ......................................................................... 230
5.5.3 Micro-level capacity-based policy combinations: Capacity for implementation .................................................................. 2322

ESPON 1.1.3 - Final Report Part 2 IV

ESPON 1.1.3 - Final Report Part 2 219
5 Policy Conclusions
When the fifteen old member states of the European Union were joined by ten new member states on 1 May 2004, new challenges and possibilities have advanced to the forefront of European spatial development. This chap- ter summarises the main conclusions and policy recommendations resulting from the research of ESPON 1.1.3.
5.1 Spatial consequences of the EU enlargement
How do EU enlargement and processes of European integration affect territo-rial cohesion and more specifically polycentric development at various levels in the European space?
Territorial Cohesion
According to the Third Cohesion Report (CEC, 2004a:27) Territorial cohesion in an objective that will “…help achieve a more balanced development by re-ducing existing disparities, preventing territorial imbalances and by making both sectoral policies which have a spatial impact and regional policy more coherent”. In light of this goal we have examined the existing economic dis-parities within the ESPON space.
We find that there are concurrent process of convergence at the level of the European territory and divergence at the national and regional territorial levels, particularly within the new member states
The ten new member states of the European Union, taken together, have a gross domestic product (GDP) per capita of less than on fifth of the average of the fifteen old member states, and through the enlargement the ratio be-tween the per-capita income of the poorest and the richest regions in the European Union has widened from 1:10 to 1:30. However, even between the new member states there are large economic disparities between the most economically successful countries Cyprus, Malta and Slovenia and the re-maining countries, and within the new member states between the capital cities and other large agglomerations and the peripheral rural regions. In particular Budapest, Prague and Warsaw are quickly catching up with cities in Western Europe at the price of widening economic gaps within their own countries.
ESPON 1.1.3 - Final Report Part 2 220
The disturbing prospect is that, if only market forces are at work, the EU enlargement will, as it is hoped for, reduce the economic disparities between the old and new member states, thus increasing territorial cohesion on a macro or European level, but at the same time it is likely to increase meso-level disparities between and within the new member states.
In order to make sense of this somewhat confusing message, ESPON 1.1.3 has collected other evidence of the forces at work in the integration of the new member states and accession countries, as it applies to territorial cohe-sion:
- The monetary, financial and economic integration of the new member states into the extended European market as well as further liberalisa-tion of exchange of products and services and capital flows has already stimulated rapid economic growth in these countries and is likely to continue to do so – but also to reinforce the process of economic di-vergence between and within the new member states.
- The hypothesis that higher specialisation and greater concentration lead to increased productivity via increasing economies of scale could not be confirmed for the new member states. Rather industry-specific shocks may make highly specialised regions more vulnerable.
- The analysis of neighbour-dependent growth has underlined the im-portance of spatial proximity in the new member states: the more a region is surrounded by regions with positive economic development, the higher is its own growth rate.
- Border regions are disadvantaged. Regions at borders between the old and new member states and in particular between the new member-states have experienced less economic and population growth and tend to be more neighbour-dependent than non-border regions, a find-ing which is not in line with the hypothesis that national borders are important for determining the discontinuities in regional development and population dynamics.
- The reduction of barriers for travel and goods transport between the old and new member states and between the new member states through the enlargement itself as well as through infrastructure im-provements will, as intended, reduce the gap in accessibility and eco-nomic development between the old and new member states but is also likely to aggravate the economic disparities between successful and lagging regions in the new member states.

ESPON 1.1.3 - Final Report Part 2 221
Polycentric development
The hypothesis put forward in the ESDP is that polycentric urban systems are more efficient, more sustainable and more equitable than both mono-centric urban systems and dispersed small settlements. While the verdict is still out on the extolled benefits of a polycentric system in terms of equity, efficiency and sustainability, we have come to several conclusions regarding the diagnosis of polycentricity on the European tissue at the levels the Euro-pean Union as a whole and within the member states and accession coun-tries.
While the new member states and accession countries on average have ur-ban systems that are more polycentric than the EU15, at least with regard to spatial dispersion of cities, they are still more polarised in terms of the con-nections between the cities. Large differences between the old and new member states also exist also in the field of transport and telecommunica-tions infrastructure. Whereas the old member states enjoy the high accessi-bility achieved by fifty years of massive infrastructure improvement, the road, rail and telecommunications networks in the new member states are underdeveloped because of many years of lack of capital and neglect, and the resulting low accessibility represents a serious impediment to their eco-nomic development.
In terms of polycentric development, ESPON project 1.1.3 has come to the following conclusions in its research:
- At the meso level, although the new member states still have more polycentric urban systems than the old member states, their urban systems have become more polarised since the opening of the Iron Curtain and are likely to continue to do so due to rapid economic growth of the capital cities and rural-to-urban migration. The moderni-sation of their transport infrastructure largely oriented towards the capital cities contributes to this development.
- The move to from centralised, bank-based financial systems to liberal finance-based systems in the new member states will encourage further monocentric development. FDI tends to cluster in main metropolitan areas, also exaborrating monocentric trends.
- Regions in the new member states that are converging in terms of GDP per capita 1995 and GDP growth from 1995 to 2001, show no signs of growing regional specialisation (except Budapest in service sectors). In new member states presence of MEGAS has little effect on growing specialisation, the opposite of the effect on the EU15 regions.

ESPON 1.1.3 - Final Report Part 2 222
- Regional specialisation and greater sector concentration, especially in the presence of MEGAs can lead to increased productivity. But the risk is that industry-specific shocks may make highly specialised regions more vulnerable.
- At the macro European level there are several potential transnational integration zones, based on the existance of MEGAS and their fucntional relations. Two of these potential transnational zones could be in the Baltic Sea Region and the Balkans Region, although they in no way could compete on the level of the ”Pentagon”. A greater focus on the MEGAs in these zones could also decrease polycentric development within the respective countries.
- There are inherent goal conflicts in pursuing polycentric development policies at the global scale, the European scale and the national and regional scales.
These observed and foreseeable consequences of the EU enlargement ex-pose once more the inherent conflict between the stated EU goals of com-petitiveness and territorial cohesion/polycentricity. This goal conflict cannot be resolved by the one-sided pursuit of either one of the two conflicting goals. It requires a more sophisticated strategy.
5.2 A phase strategy of European spatial development
It is a recurrent theme of many ESPON projects (e.g. ESPON 1.1.1 and ESPON 2.1.1) that the stated EU goals of competitiveness and territorial co-hesion/polycentricity are in conflict. This conflict is nowhere so explicit as in the case of the EU enlargement. If, for instance, the goal is to strengthen major urban centres outside the 'Pentagon', this will increase spatial dispari-ties between the already too dominant capital cities and other large cities in countries such as the Baltic states, Hungary or the Czech Republic. However, if the promotion of balanced urban systems in these countries is a common goal, more Structural Funds and transport infrastructure have to go to me-dium-size cities of the new member states, and this will go at the expense of their capitals.
As briefly discussed in Chapter 3 of this report, It is the responsibility of the future spatial policy of the European Union to find a rational solution to this goal conflict. This solution cannot be the one-sided pursuit of one of the two conflicting goals at the expense of the other. Nor is it a solution to indis-criminately try to serve both objectives at the same time – the result would

ESPON 1.1.3 - Final Report Part 2 223
be to achieve neither. Rather, the task is to develop a balanced strategy which is differentiated in both space and time and takes account of the spe-cific needs of different types of regions.
Such a strategy starts from a phase model of spatial development according to which in early stages of economic development of a country the promo-tion of growth poles, in later stages, however, the development of a poly-centric spatial structure is appropriate. This allows to set different priorities in the old and the new member states: Whereas in the old member states decentralised, polycentric spatial structures are promoted, in the new mem-ber states for a limited transition period the capital cities and other major cities may be strengthened until later also in these countries balanced poly-centric spatial structures can be developed. The rationale behind this is that scientific and technical innovations are not restricted to large agglomerations but can also, or even better, be achieved in well connected cities of medium size, which is demonstrated by the fact that the economically most success-ful countries in Europe are those with the most polycentric urban systems (see ESPON 1.1.1, 2004). Such a strategy is not in conflict with the competi-tiveness goal of the European Union but achieves it in a more sophisticated way than by the one-sided promotion of the largest agglomerations. From such a spatial strategy differentiated in space and time new challenges for European spatial policy arise.
We thus present the idea of such a phase model as a “meta” policy recom-mendation as it is one way of dealing with the goal conflicts between com-petitiveness, cohesion and sustainability that are deep-rooted in pursuing polycentric development across the board in Europe. However an important caveat must be made: we are in no way advocating the phase model for all countries or regions in Europe, simply presenting an alternative that might profitably be used with caution to deal with spatial planning goal conflicts. As such the phase model will colour our policy recommendations (combinations) as described below, thus adding the essential temporal dimension to policy recommendations as expounded in the Nijmegen Guidance Paper.

ESPON 1.1.3 - Final Report Part 2 224
5.3 Policy combinations1
The ESPON programme encourages a multi-level approach to policy formula-tion with implications and options directed at the EU level (macro), the na-tional or trans-regional level (meso) and the regional-local level (micro), as well as a cross-sectoral approach to ensure that stated EU goals competi-tiveness, territorial cohesion and environmental sustainability are reflected in all policy areas of the EU and the member states.
A multi-level approach to policy formulation requires more than the recom-mendation of isolated individual policies but integrated strategies consisting of co-ordinated combinations of policies which in a synergetic way interact with each other across policy levels and policy fields.
To respond to this challenge, ESPON 1.1.3 proposes a coherent policy frame-work based on policy combinations. The term policy combinations was cho-sen as it best describes the process of co-ordinating coherent combinations of policies that are both multi-level, spanning the vertical levels of govern-ment and administration, and inter-sectoral, with the integration of tradi-tional policy areas, as well as integrating a temporal framework. In norma-tive terms, policy combinations also implicitly reflect ways to bridge the gap between policies primarily oriented to competition within the European terri-tory and cohesion of the territory on all levels.
There are two kinds of policy combinations:
- Principle-based policy combinations are based on top-down governance processes by EU and national institutions or implemented via EU pro-grammes such as the Structural Funds. Principle-based combinations work to achieve a concrete goal-oriented measure with a greater focus on what is to be achieved, compared to providing the tools of how the measure is to be achieved.
- Capacity-based policy combinations are implemented by national, re-gional or local governments, private businesses and civil society organisa-tions and focus on the capacity to implement EU funding opportunities. Thus capacity-based combinations, while also obviously-goal oriented, have a specific orientation on providing the necessary capacity, be it organisa-tional or governance aspects, to show how the goals could be met.
1 Based on Persson, L.O., Neubauer, J. and Van Well, L. (2004): Making policy recommen-
dations for regions at risk and with potential in the enlargement of the European Union. Presented at the 7th Uddevalla Symposioum, “Regions in Competition and Cooperation, June 17-19, Fredrikstad, Norway.

ESPON 1.1.3 - Final Report Part 2 225
The phase model of spatial policy proposed in Section 5.1 and the concept of policy combinations will also be used to structure the policy recommenda-tions in the remainder of this section.
5.4 Principle-based policy combinations
Principle-based policy combinations contain policies by the European Union or national, regional or local governments to achieve stated EU goals by leg-islation or fiscal and monetary measures, such as subsidies, taxation, in-vestments or Community funding opportunities.
5.4.1 Macro level policy combinations
Structural policy
European structural policy is particularly affected by the goal conflict be-tween competitiveness and territorial cohesion. If the goal of global competi-tiveness is the only guiding principle, predominantly the major agglomera-tions within the “Pentagon” attract the largest part of the Structural Funds, and this will further widen the existing gap between economic performance between the old and new member states. If, however, the cohesion goal re-ceives highest priority, most Structural Funds go into the poorest regions in the new member states and this may reduce the global competitiveness of the European Union as a whole.
Following a phase model of spatial policy, European structural policy is more focused on the specific potentials and deficits of the supported regions with-out losing sight of the inherent goal conflict between competitiveness and territorial cohesion.
Following the phase model, Structural Funds will in the near future have to be concentrated on the capital cities and other major agglomerations in the new member states; this will facilitate convergence at the European level but is likely to increase economic disparities within these countries and can therefore be justified only for a limited transition period. In the old member states, structural policies will not further strengthen the already highly de-veloped cities in the “Pentagon”, which have hardly deficits in economic de-velopment potential, but be targeted at cities in regions with restructuring problems or suffering from their peripheral location and so promote polycen-tric development.

ESPON 1.1.3 - Final Report Part 2 226
In this first phase of spatial policy for the new member states, polycentricity at the European level should be increased by promotion of the network of major cities in the “Triangle of Central Europe” between Warsaw, Prague and Budapest with its potentially high level of integration in order to strengthen the relationships of this trans-national region with the 'Pentagon', the wider Balkan area and the Balkan region as well as the trans-national region formed by the three Baltic states. Transnational co-operation with the Rus-sian enclave Kaliningrad as well as with St. Petersburg and Kiev is important in this context.
During this transition period, however, preparations should be made for the next phase of spatial policy in the new member states. Each new member state should be encouraged to draft a national programme for regional de-velopment with emphasis on the functional growth of second-tier cities. EU funding should be provided to partnerships at the regional level – both to draft the plan and to secure its implementation. The smaller new member states should profit from drafting plans in co-operation with neighbouring countries. Plans should be based on an analysis of the potential functions and contributions to positive spatial association of the second-tier cities.
In doing this, special attention should be paid to the exploitation and further strengthening of the economies of scale of regional economic specialisation, cultural assets and environmental resources, tourism and the multiplier ef-fects of universities and research centres, functional linkages between neighbouring regions and existing or possible trans-national networks of co-operation between cities in border regions. Also possibilities to decentralise government agencies from the capital cities to second-tier cities should be considered.
Infrastructure policy
The goal conflict between competitiveness and territorial cohesion is equally relevant for European transport and telecommunications infrastructure pol-icy. If the competitiveness goal has highest priority, the already fast, high-capacity transport corridors between the largest agglomerations are up-graded even further. If, however, the goal of territorial cohesion has the highest priority, predominantly the connections to and between the capitals of the new member states are improved – at the expense of regional con-nections within these countries. Both strategies have the negative side effect of further growth in traffic, in particular goods transport. To concentrate transport investment, however, on peripheral regions to promote territorial cohesion leads to unacceptable congestion bottlenecks in the agglomerations both within and outside the 'Pentagon'.

ESPON 1.1.3 - Final Report Part 2 227
A transport policy following the phase model differentiates between the old and new member states:
In the already highly developed and urbanised old member states existing or emerging polycentric structures are to be strengthened by predominantly improving the accessibility of medium-level central places and compensating the accessibility deficits of rural and peripheral regions. In the still urbanis-ing new member states, however, a phased strategy is appropriate. For a transition period of ten to fifteen years it is justified to enhance the growth dynamics of these countries by fast and efficient transport connections be-tween the capital cities and major agglomerations in the new member states and the economic centres in western Europe. After that period, however, the risk of over-dominance of these cities will have to be reduced by shifting the focus of investments first to links between medium-size cities and later, as in the old member states, to rural and peripheral regions. This would not only mean to link these regions to major cities but also to develop local ac-cessibility including sustainable transport options such as public transport and cycling. A particular challenge would be to preserve still existing railway lines threatened by being closed down. This is a field for co-operation be-tween all three levels, the EU, the nation state and the regional centres.
Both strategies have to be combined with Europe-wide co-ordinated meas-ures to control the expected further rise of person travel and goods trans-port on roads by internalising the external costs of road transport and pro-moting the use of environment-friendly transport modes and regional eco-nomic circuits and so contribute to the sustainability goal of the European Union and prepare Europe for future fuel scarcity and higher fuel prices.
Similar differentiated principles apply to European telecommunications pol-icy. Here, too, different priorities for the old and new member states are ap-propriate. In the old member states telecommunications infrastructure of the highest standards is now available almost everywhere. Here European tele-communications policy can only help to overcome deficits in very low-density peripheral regions. In the new member states, however, the telecommunica-tions infrastructure has to be installed from the ground up. Just as in trans-port policy it is justified to first help the new member states to provide high-level telecommunications services in their capital cites and major agglom-erations and later improve services also in medium-size cities and rural ar-eas.

ESPON 1.1.3 - Final Report Part 2 228
5.4.2 Meso level policy combinations
Monetary and financial integration
It is assumed that the spatial development of the new member states and accession countries will also be affected by monetary and financial integra-tion. Based on their planned-economy history, the financial institutions in new member states are highly centralised. The ongoing liberalisation and move to a more financial-market based system is likely to provoke the fur-ther concentration of financial activities in the main financial centres at the national and international scale.
Similar consequences are to be expected from the liberalisation of capital flows. Liberal finance-based economic systems tend to encourage further monocentric development. Inward foreign direct investment tends to cluster in the main metropolitan areas and so impedes the development of periph-eral regions, especially those with strong specialisation in agriculture, tour-ism or manufacturing industries.
In the near future these centralising effects of liberalisation have to be ac-cepted as a necessary condition for the stimulation of rapid economic growth. In the long run, however, decentralisation plans at the national and regional level will be required to ensure that equity concerns are not com-pletely overshadowed by strategies for efficient competition.
Boosting border regions
ESPON 1.1.3 has developed a typology of border regions in the new member states resulting in four types of border regions based on their integration po-tential: forerunners of integration, hardworkers of integration, candidates of integration and handicapped for integration.
This typology, while still in an embryonic stage could have important impli-cations for policy formulation with regard to Structural Funds, for instance: Should greater funding be placed in cross-border regions that are already forerunners of integration in order to produce the largest, most cost-effective results? Or will more social and spatial justice be achieved by fo-cusing on the cross-border regions that are handicapped for integration, even if the return on these projects does not yield as much on the European (macro) scale?
What has even more so become apparent as the result of the border region typology exercise is that it has become clear that no single strategy or policy instrument can serve the different needs of all the various types of border

ESPON 1.1.3 - Final Report Part 2 229
regions. Instead there is a need for more diverse and phased policy combi-nations with respect to the Structural Funds or transport, agricultural and R&D policy. In the short run, the most successful forerunner regions may have to be promoted, but in the medium- and long-term the focus could be shifted to the support of the most disadvantaged border regions handi-capped for integration. Ideally, as shown by the illustrations of the Hungar-ian-Slovakian and Greek-Bulgarian border regions (section 2.10), policy in-terventions should preferably be formulated at the transnational or cross-border level. In such a scheme combinations of policies can be based on more detailed data, such as flows of workers and enterprises and their likely response to available policy options.
5.5 Capacity-based policy combinations
The Third Cohesion report alludes to some aspects of capacity building in its conceptualisation of the territorial cohesion as a focus on making “…both sectoral policies which have a spatial impact and regional policy more coher-ent. The concern is also to improve territorial integration and encourage co-operation between regions” (CEC, 2004a:27). Thus territorial cohesion is not just about ameliorating disparities, but encouraging coherency between poli-cies as well as various types of cooperation as a means to achieve the goal.
Capacity-based combinations are thus addressed to a wider scope of gov-ernance actors as well as the cooperation, partnerships and networks devel-oped among them for strategic problem solving. As Kohler-Koch states “The EU is… a system of “network governance” which thrives on co-ordinating a multitude of actors and approximating diverse interests” (Kohler-Koch 2002: 4). These combinations should also address the problem coordinating policy intervention vertically across sectors and horizontally in a multi-level system of governance.
5.5.1 Macro-level capacity-based policy combinations: Providing the knowledge
The ESPON 1.1.3 research on neighbourhood dependence (section 2.5) as-serts that economic and population growth rates do show neighbourhood dependency. The more a region is surrounded by regions with positive dy-namics, the higher is its own growth rate.

ESPON 1.1.3 - Final Report Part 2 230
The manifestation of this is that there is a need for more systematic analysis of the role of spatial factors in economic growth, and the implications that these factors play on EU Cohesion Policy. Thus capacity for EU Structural Programmes could be boosted by a greater research emphasis on these fac-tors. Other possible policy uses of the spatial factors of economic growth could be foreseen in delineating the future of territorial cooperation pro-gramme.
5.5.2 Meso-level capacity-based policy combinations- Creating the strategy
The combination of the phase strategy of spatial policy and the multi-level and cross-sectoral integration of policies in policy combinations advocates focusing on the competitiveness of the major urban agglomerations in the new member states and accession countries in the initial stage, and pursuing the goal of balanced and polycentric regional development in the subsequent stages. However implicit in the first stage is the idea that growth in the capi-tal city and urban areas would somehow also “spill-over” into the less ad-vantaged regions.
Yet if this is to take place, it is imperative that territorial governance recog-nise the complementarities between policies and act upon these through na-tional and regional strategies.
To examine the extent to which the new member states have incorporated both efficiency and equity aspects of spatial development in their national strategies and development plans, the pertinent national plans in these countries were studied and cross-checked with the country studies in ESPON 2.4.2 and ESPON 1.1.1 dealing with these similar issues. The synopses of these national documents are found in Appendix D.
The analysis of the national strategic plans showed that all new member states have developed strategies for (more or less explicitly stated) polycen-tric development and express goals in accordance with those of the Euro-pean Spatial Development Perspective (ESDP). Although most of the plans were written prior to their accession to the EU (Slovenia, for instance, has had a strategy for the polycentric concept for urbanisation since 1975), all countries have anticipated the goals of competitiveness, territorial cohesion and sustainable development, not because they had to (as these, unlike the sectoral policies, were not part of the acquis) but because they realised that these goals form an important part of a European “identity” and that eco-

ESPON 1.1.3 - Final Report Part 2 231
nomic and social integration make them imperative in an expanding Euro-pean territory.
Many of these strategic territorial plans are several years old. While they still serve their purpose as visionary guiding documents, many of them will have to be updated in their operational aspects shortly. Transport infrastructure, a main funding concern of the Structural and Cohesion Funds, has changed the tissue of Europe faster than other EU policies. While increased accessibil-ity has facilitated mobility of people and goods and economic integration in the short term, national processes such as monetary and financial integra-tion have not been able to assimilate at the same rate.
Most national strategies also recognise the importance of the cross-sectoral approach. For example in Estonia the challenge at the administrative level is the need to integrate and coordinate different plans regarding infrastructure, land consolidation and land use while finding a path towards convergence of the monetary system in anticipation of the introduction of the Euro. Estonia recognises that it is important to build up capacity and local initiatives for the co-ordination of various sectors. Lithuania’s strategy mentions the chal-lenges of implementing cross-sectoral policies and the role of further decen-tralisation of administrative functions in this process.
Many national strategies contain an implicit plan for a phase strategy of pur-suing the goals or competitiveness and cohesion. While both efficiency and equity are major goals of the national strategies, in nearly all countries the main concern seems to be regional economic growth and better economic integration with Europe, with the territorial cohesion of all regions in the country as a somewhat secondary objective. However, in a few countries the phase strategy is more explicitly formulated. Bulgaria states that regional economic growth is a platform to improve socio-economic conditions. And Poland’s documents discuss how, while sustainable polycentric development of the entire territory is a long-term goal, the medium-term strategy is rapid economic growth and increased competitiveness.
To create awareness in the new member states of the unique challenge and opportunity offered to them by their accession to the EU to develop their spatial structure towards a higher level of accessibility and competitiveness without repeating the mistakes made by some old member states, “soft” policies of capacity building and networking should be applied:

ESPON 1.1.3 - Final Report Part 2 232
5.5.3 Micro-level capacity-based policy combinations: Capacity for implementation
As shown in the illustration of the Greek accession process in Chapter 1, Structural Funds, particularly those directed towards transport infrastruc-ture, certainly made the national transport system more powerful, their im-pact on restructuring the urban system was limited. However in the periph-eral centers, changes in the territorial governance system were more of rein-forcement as it insured that regional and local authorities could have at their disposal the sufficient institutional capacity to implement Community aid programmes, or territorial cooperation schemes. It is thus imperative at the meso level to not only provide opportunities to increase economic develop-ment in regions, but also to imbue measures to make sure that regions can carry them out.
Also as seen in the illustration of the Portuguese accession process, Euro-pean integration precipitated a decline in traditional economic sectors (such as fishing or shipbuilding), but stimulated other industries and opportunities (such as the automobile industry or tourism.). In the face of such restructur-ing of the economic base, as is now happening in the new member states and accession countries, national efforts should be put forth to assist regions and local actors to cope and in fact capitalise on the socio-economic changes that are brought about by European integration.
Capacity building measures should also take the cautious attitude that, not all regions, especially in the new member states will respond equally to poli-cies that promote specialisation or differentiation of the economic structure. As we presented in section 2.6, while regional specialisation is one way to cope with the processes of European integration and globalisation, it may not be an applicable strategy in all regions. In this sense, capacity building measures should be uniquely specified for the regions at hand.
At the local level, efforts to adopt Local Agenda 21 plans to increase aware-ness of the long-term importance of preserving and developing the environ-mental and cultural heritage even in times of rapid economic growth should be encouraged and supported.
Finally, it is of highest importance that the necessity and potential of a phase strategy to assimilate the goals of competitiveness and cohesion in the spatial development of the new member states is recognised in their spatial development plans. ESPON 1.1.3 has not been able to analyse the micro-level governance aspects of implementing such a strategy in the nec-essary depth and detail. Such an analysis would require the examination of a wide range of multi-level policy options: at the macro level EU structural pol-icy support, at the national level policies to first promote the growth of ma-

ESPON 1.1.3 - Final Report Part 2 233
jor urban areas and later support peripheral regions and at the regional and local level policies to strengthen the bottom-up capacity to profit from the growth of capital and central cities. This would be an appropriate theme for a whole new ESPON project.

ESPON 1.1.3 – Annex A -E
I
ESPON project 1.1.3 Enlargement of the European Union and
the wider European Perspective as regards its Polycentric Spatial Structure
Part 3 Annexes A-E
Co-financed by the European Community through the Interreg III ESPON Programme

ESPON 1.1.3 – Annex A -E
II

ESPON 1.1.3 – Annex A -E
III
ESPON project 1.1.3
Enlargement of the European Union and the wider European Perspective as regards its Polycentric
Spatial Structure
Final Report
Volumes
Part 1: Summary
Part 2: Results of the Project
Part 3: Annexes A-E
December 2005
Contact Information:
Lisa Van Well KTH, The Royal Institute of Technology SE-100 44 Stockholm, SWEDEN Tel:+46 8 790 9430 Fax:+46 8 970 6761 E-mail: [email protected] Web: www.infra.kth.se

ESPON 1.1.3 – Annex A -E
IV
This report represents the final results of a research project conducted within the framework of the ESPON 2000-2006 programme, partly financed through the INTERREG programme. The partnership behind the ESPON programme consists of the EU Commission and the Member States of the EU25, plus Norway and Switzerland. Each partner is represented in the ESPON Monitoring Committee. This report does not necessarily reflect the opinion of the members of the Monitoring Committee. Information on the ESPON programme and projects can be found on www.espon.lu” The web side provides the possibility to download and examine the most recent document produced by finalised and ongoing ESPON projects. ISBN number: 2-9599669-3-7 This basic report exists only in an electronic version. Word version: © The ESPON Monitoring Committee and the partners of the projects mentioned. Printing, reproduction or quotation is authorized provided the source is acknowledged and a copy is forwarded to the ESPON Coordination Unit in Luxembourg.
ESPON 1.1.3 – Annex A -E
V
ESPON 1.1.3 Partners
• Lead Partner: KTH, The Royal Institute of Technology (SWEDEN)
• Faculty of Civil and Geodetic Engineering, Chair of Spatial Planning, Ljubljana (SLOVENIA)
• Institute of Geography and Spatial Organization (IGSO),
• Polish Academy of Sciences (POLAND)
• Centre for Advanced Spatial Analaysis (UCL) (UNITED KINGDOM)
• National Technical Univ.of Athens (NTUA) (GREECE)
• Spiekermann & Wegener, Urban and Regional Research (S&W) (GERMANY)
• Austrian Institute for Regional Studies and Spatial Planning (ÖIR) (AUSTRIA)
• Global Urban Development (formerly the Prague Institute for Global Urban Development) (CZECH REPUBLIC)
• Centre for Urban and Regional Development Studies, Ltd. (CEDRU) (PORTUGAL)
• IRER, University of Neuchâtel (SWITZERLAND)
• Karelian Institute, University of Joensuu (FINLAND)
• TNO Inro (THE NETHERLANDS)
• Hungarian Public Nonprofit Company for Regional Development and Town Planning (VÁTI) (HUNGARY)
• Nordregio (SWEDEN)
• Swedish Institute for Growth Policy Studies (ITPS) (SWEDEN)

ESPON 1.1.3 – Annex A -E
VI
The Content of this paper does not necessarily reflect the opinion of the ESPON Monitoring Committee

ESPON 1.1.3 – Annex A -E
VII
PART 3 Annex A
Indicators, maps, missing data, abbreviations, references,
publications of TPG members

ESPON 1.1.3 – Annex A -E
VIII

ESPON 1.1.3 – Annex A -E
IX
Table of Contents for Part 3 Annex A
A.1 Indicators (please see A.7) 1 A.2 List of Map and tables 2 A.3 Missing data 8 A.4 Abbreviations and glossary 9 A.5 References 188 A.6 Publications of the TPG 188 A.7 Indication of Performance 199 A.8 Additional Maps 20 A.8.1 Maps for Chapter 2.3.1 20 A.8.2 Maps for Regional Specialisation 24 A.8.3 Maps for SASI Model 31 A.9 Bibliography 47 A.10 Expert Info 55 A.10.1 Methodological notes on the use and the interpretation
of the GDP per capita per country and per region for long term comparisons 55
A.10.2 Neighbour-dependent growth: empirical evidence from enlargement countries in ESPON space: Methodology 59
Maps
Map A8.1: Potential accessibility, multimodal, 2001 ............................21
Map A8.2: Potential accessibility to EU 15, multimodal, 2001................22
Map A8.3: Potential accessibility to NMAC, multimodal, 2201................23
Map A8.4: Specialisation trends by NACE sectors in ‘P’ regions .............24
Map A8.5: Specialisation trends and presence of MEGAs in ‘P’ regions....25
Map A8.6: Specialisation trends by NACE sectors in ‘S’ regions .............26
Map A8.7: Specialisation trends and presence of MEGAs in ‘S’ regions ...27
Map A8.8: Specialisation trends by NACE sectors in ‘C’ regions .............28
Map A8.9: Specialisation trends and presence of MEGAs in ‘C’ regions ...29
Map A8.10: Specialisation trends by NACE sectors in ‘D’ regions ...........30
Map A8.11: Scenario 00: Accessibility rail/road/air travel (million) 2031 32
Map A8.12: Scenario A1: Accessibility rail/road/air travel: relative difference (%) 2031...................................................................33
Map A8.13: Scenario B1: Accessibility rail/road/air travel: relative difference (%) 2031...................................................................34

ESPON 1.1.3 – Annex A -E
X
Map A8.14: Scenario B5: Accessibility rail/road/air travel: relative difference (%) 2031...................................................................35
Map A8.15: Scenario 00: GDP per capita (Euro) 2031..........................36
Map A8.16: Scenario A1: GDP per capita: relative difference (%) 2031..37
Map A8.17: Scenario B1: GDP per capita: relative difference (%) 2031..38
Map A8.18: Scenario B5: GDP per capita: relative difference (%) 2031..39
Map A8.19: Scenario A1: GDP per capita: absolute difference (Euro) 2031...............................................................................................40
Map A8.20: Scenario B1: GDP per capita: absolute difference (Euro) 2031...............................................................................................41
Map A8.21: Scenario B5: GDP per capita: absolute difference (Euro) 2031...............................................................................................42
Map A8.22: Scenario 00: GDP per capita: (EU27+7=100) 2031 ............43
Map A8.23: Scenario A1: GDP per capita (EU27+7=100): relative difference (%) 2031...................................................................44
Map A8.24: Scenario B5: GDP per capita (EU27+=100): relative difference (%) 2031...................................................................45
Map A8.25: Scenario B5: GDP per capita (EU27+=100): relative difference (%) 2031...................................................................46

ESPON 1.1.3 – Annex A -E
XI
Tables Table A10.1: Regional disparities within Member States (1995-2002) -
ratio between GDP shares of the wealthiest 20% of regional population and the least wealthy 20%. 56
Table A10.2: GDP and population growth in cohesion countries, 1988-2003 57
Table A10.3: Regional GDP per capita in Greece 1983 - 2002 (PPS, EU15=100*) 58
Table A10.4 National GDP per capita in Greece 1981-2002 (PPS, EU-15=100*) 58


ESPON 1.1.3 – Annex A -E
1
A.1 Indicators (please see A.7)
Number of spatial indicators developed: - in total covering - the EU territory - more than the EU territory
Number of spatial indicators applied: - in total covering - the EU territory - more than the EU territory
Number of spatial concepts Defined Number of spatial typologies Tested Number of EU maps produced Number of ESDP policy options addressed in that field

ESPON 1.1.3 – Annex A -E
2
A.2 List of Map and tables
Maps Part 1
Map 1.1: Redistribution of GDP 1995-200, NUTS3 6 Map 1.2: Population change 1995-2000 in ESPON space land border regions 9
Maps Part 2 Chapter 1 No maps Maps Part 2 Chapter 2 Map 2.1: Redistribution of population 40 Map 2.2: Redistribution of GDP 41 Map 2.3: GDP per capita in PPS, 2000 (EU average = 100) 44 Map 2.4: GDP per capita in PPS, annual growth rate 1995-2000 (%) 48 Map 2.5: Spatial association of population growth 1995-2000, regions by
type of univariate local Moran I 73 Map 2.6: Spatial association of GDP per capita growth 1995-2000, regions
by type of bivariate local Moran I 74 Map 2.7: ESPON space land borders and border regions, 2005 102 Map 2.8: Population change 1995-2000 in ESPON space land border
regions 105 Map 2.9: Geographical Type Borders 109 Map 2.10: Dimension of economic disparities 110 Map 2.11: Draft Typology # 1: border typology for integration potential 115 Map 2.12: Draft Typology # 2: border typology for integration potential 116 Maps Part 2 Chapter 3 No maps Maps Part 2 Chapter 4 No maps Maps Part 2 Chapter 5 No maps

ESPON 1.1.3 – Annex A -E
3
Figures Part 1 Figure 2.1 The SASI model 34 Figures Part 2 Chapter 1 Figure 1.1: Framework for Analysis 5 Figure 1.2: Functional Urban Areas in Greece 18 Figure 1.3: Per head Community aid -CSF- in Greece 1994-1999 (Ecus per
head) 19 Figure 1.4: Per head regional GDP (PPS – EU15=100) change in Greece
1988-2002 20 Figure 1.5: Real Convergence in the Cohesion Countries, 1988-2003 26 Figure 1.6: GDP Annual Growth in EU15 and Portugal, 1988-2003 26 Figure 1.7: GDP per capita by region in Portugal, 1995-1999 29 Figure 1.8: GDP per person employed by region in Portugal, 1995-1999 30 Figure 1.9: GDP per capita, NUTS III, in Portugal, 2001 31 Figures Part 2 Chapter 2 Figure 2.1. Net-migration rates in the Baltic States and Poland 57 Figure 2.2. Net-migration rates, East Central Europe 58 Figure 2.3. Net-migration rates, South East Europe 58 Figure 2.4 Multimodal accessibility 2001, all destinations (top left), only
EU15 destinations (top right) and only new member states and Bulgaria and Romania (NMAC) as destinations (bottom). 62
Figure 2.5 Accessibility and GDP per capita 2001. 63 Figure. 2.6 Accessibility and GDP per capita in the new member states and
Bulgaria and Romania, all destinations (top), only EU15 destinations (centre) and only new member states and Bulgaria and Romania as destinations (bottom). 65
Figure 2.7 Spatial dependence in different neighbourhoods, population and GDP per capita change 1995-2000, EU27+2 68
Figure 2.8: Building the typology based on specialisation trends and NACE sectors 81
Figure 2.9: Building the typology based on specialisation trends and presence of MEGAs 81
Figure 2.10: Specialisation trends and the C, D, S, P regions 83 Figure 2.11: Diagrammatic chart of typology 2 in TIR (Herfindahl rate of
change and GDP/h growth between 1995 and 2001) 83 Figure 2.12: Specialisation trends and sectoral growth in EU15 (1995-
2001) 85

ESPON 1.1.3 – Annex A -E
4
Figure 2.13: Specialisation trends and sectoral growth in EU12 (1995-2001) 85
Figure 2.14: presence of MEGAs in the ‘P’, ‘S’, ‘C’ and ‘D’ regions 87 Figure 2.15: Specialisation and presence of MEGAs in the EU15 87 Figure 2.16: Specialisation and presence of MEGAs in the EU12 (+NO–BG) 88 Figure 2.17: A conceptual framework to highlight the spatial impact of
financial and monetary variables 94 Figure 2.18: Greece- Bulgaria Border Regions: administrative units (NUTS
2, NUTS 3), population of the Functional Urban Areas (FUAs) 2000. 127
Figures Part 2 Chapter 3 Figure 3.1: MEGAs categories and FUAs in Europe, highlighting the Baltic
Sea Region and the Potential Baltic Sea Integration Zone 152 Figure. 3.2: The Major Urban Systems of the Balkan countries 156 Figure. 3.3: Rank-size distribution of population of FUAs in the new
member states and accession countries 160 Figure 3.4: Rank-size distribution of GDP of FUAs in the new member
states and accession countries 162 Figure 3.5: Service areas of FUAs in the new member states and accession
countries 163 Figure 3.6: Population and accessibility of FUAs in the new member states
and accession countries 165 Figure 3.7: Rank-size distribution of population of MEGAs in Europe 170 Figure 3.8: Rank-size distribution of GDP of MEGAs in Europe 170 Figure 3.9: Service areas of MEGAs in Europe 171 Figure 3.10: Population and accessibility of MEGAs 172 Figure 3.11:Polycentric development of Slovenia is based on a balanced
urban network with eight functional regions 175 Figure 3.12:Functional urban areas (FUA) and significance of urban
centres in Slovenia 177

ESPON 1.1.3 – Annex A -E
5
Figures Part 2 Chapter 4 Figure 4.1: The Three Level Model Structure 184 Figure 4.2: Normalised Accessibility Potentials 1981 185 Figure 4.3: Activity Shares and Calibrated Model Fit at 1996 187 Figure 4.4: Illustrative Linkages at the NUTS0 Level Controlling the
Weights on the Accessibilities The Same Structure is also used at the NUTS3 Level (The circles are consistent with the normalised accessibility potentials as in figure 4.2) 188
Figure 4.5: 100 year + Trend Scenario: The Very Long Term Redistribution of Employment Activity 190
Figure 4.6: Very Long Term Trend Projections in the ESPON Space 192 Figure 4.7: Percentage Differences from the Trend Scenario Due to
Exogenous Investments as Specified Over a 20 year Period to 2021 194
Figure 4.8: The SASI model 199 Figure 4.9: Development of accessibility rail/road/air, travel in the old
member states (EU15) and the new member states and accession countries (NMAC) 1981-2031 202
Figure 4.10: Accessibility rail/road/air, travel in the Reference Scenario 00 (million) and accessibility effects of Scenarios A1, B1 and B5 in 2031 (%) 204
Figure 4.11: GDP per capita in the Reference Scenario 00 and absolute GDP per capita effects of Scenarios A1, B5 and B6 in 2031 (Euro of 2005) 208
Figure 4.12: GDP per capita in the Reference Scenario 00 (Euro of 2005) and relative GDP per capita effects of Scenarios A1, B5 and B6 in 2031 (%) 209
Figure 4.13: GDP per capita in the Reference Scenario 00 (EU27+7=100) and relative GDP per capita effects of Scenarios A1, B5 and B6 in 2031 (%) 210
Figure 4.14: Development of polycentricity in the old member states and in the new member states and accession countries 1981-2031 215
Figure 4.15: Development of polycentricity of MEGAs in Europe 1981-2031 217 Figures Part 2 Chapter 5 No Figures

ESPON 1.1.3 – Annex A -E
6
Tables Part 1
Table 1.1: Goal conflicts of polycentricity policies 16 Table 2.1: Dimensions and criteria for border region typologies 36
Tables Part 2 Chapter 1 Table 1.1: Population change of in the "Capital Region", the Rest of
Attica, the total of Attica (MRA) and the total of Greece 1991-2001. 22
Table 1.2: Impact of CSF III in GDP (prices 1995) 27 Tables Part 2 Chapter 2 Table 2.1: Convergence within countries, 1995-2000 49 Table 2.2: Values and interpretations of Moran I index 67 Table 2.3: Spatial dependence of population and GDP per capita change,
values of univariate and bivariate Moran I indices 70 Table 2.4: Types of regions and forms of local spatial association 72 Table 2.5: Regions by type of local spatial association in EU 27+2, EU15
and EU10 75 Table 2.6: The most significant ‘hot spot’ -regions in EU10 77 Table 2.7: Inward FDI flows in candidate countries in 2001 97 Table 2.8: Relative change of GDP shares of macro border regions 1995-
2000 104 Table 2.9: Dimensions and criteria 114 Table 2.10: Draft Typology # 1: border typology for integration potential–
geographical-physical border typology 114 Table 2.11 Draft Typology # 2: border typology for integration potential–
socio-economic border typology 116 Table 2.12 122 Table 2.13 122 Table 2.14: Population of the border regions 128 Table 2.15: Border regions: Regions codes, population by sex 129 Table 2.16: Surface and population density of the border regions 130 Table 2.17: GDP / head (PPS) of the border regions 131 Table 2.18: Employment rate of the border regions 131 Table 2.19: Employment by sector of the border regions 132 Tables Part 2 Chapter 3 Table 3.1: Goal conflicts of polycentricity policies 141 Table 3.2: Classification of FUAs per country of the New Member States 149 Table 3.3: Polycentricity sub-indicators 166 Table 3.4: Value functions of polycentricity sub-indicators 167

ESPON 1.1.3 – Annex A -E
7
Table 3.5: Composition of the Polycentricity Index 167 Table 3.6: Component indices and Polycentricity Index 168 Table 3.7:Functional urban areas (FUA) and significance of urban centers
in Slovenia 178 Tables Part 2 Chapter 4 Table 4.1: Decanal Percentage Shifts in Activity Shares Due to Investment
and Migration: first row is employment, second row is population 194
Table 4.2: Decanal Percentage Shifts in Activity Shares for crude aggregations of the SASI Scenarios B1 and B2: first row is employment, second row is population 196
Table 4.3: SASI model: accessibility rail/road/air, travel 2031 202 Table 4.4: SASI model: GDP per capita 2031 206 Table 4.5: SASI model: accessibility cohesion effects 2031 212 Table 4.6: SASI model: GDP/capita cohesion effects 2031 213 Table 4.7: SASI model: Polycentricity Indicator 2031 215 Tables Part 2 Chapter 5 No Tables

ESPON 1.1.3 – Annex A -E
8
A.3 Missing data
Socio-economic data at municipal level
Socio-economic and spatial interactions at municipal level Data of flows of people, goods and services at regional at municipal level Density cross border: As one example for that kind of objective may be serve the indicator ‘Density of road border crossing points’. It should be possible to survey additional data about actual usage, capacity, usability for different groups and quality of infrastructure. Another example is to collect data about existing mountain passes and tunnels as well as bridges overcoming the natural barriers of mountain ranges and rivers. In addition the compilation of rail border crossings and shipping relations (harbours) would be desirable.

ESPON 1.1.3 – Annex A -E
9
A.4 Abbreviations and glossary
Abbreviation Term
AC Accession Country
DGREGIO Directorate General
CADSES Central European, Adriatic, Danubian and South-East Space
CAP Common) Agricultural Policy
CEC Commission of the European Communities
CSF Community Support Framework
EC European Commission
ECP ESPON Contact Point
EFTA European Fair Trade Association
EMU European Monetary Union
ERDF European Regional Development Fund
ESDP European Spatial Development Perspective
ESTIA European Space and Territorial Integration Alternatives
EU15 Old Member States
EU12 EU10 + Rumania and Bulgaria
EU10 New Member State
EU27+2 All Members States and the Candidate States + Norway and Switzerland
ESPON European Spatial Planning Observation Network
DI Greek Direct Investments
FR Final Report
FUA Functional Urban Area
GDP Growth Domestic Product
INTERACT INTERACT stands for INTERREG Animation Cooperation and Transfer. INTERACT has a wide geographic scope covering the 25 current and new EU Member States and neighbouring countries.
IR Interim Report
LEs Large Enterprises
LP Lead Partner
MC Monitoring Committee
MEGA Metropolitan European Growth Area
METREX Network of European Metropolitan Regions and Areas
MSM Multiscalar Smoothing Method
MUS Major Urban System
NACE Statistical classification of economic activities in the European Community
NMs New Member States
NMACs New Member States and Accession Countries
NUTS Nomenclature of Territorial Units for Statistics
OMC Open Method of Co-ordination
Phare Programme for Central and Eastern European Countries
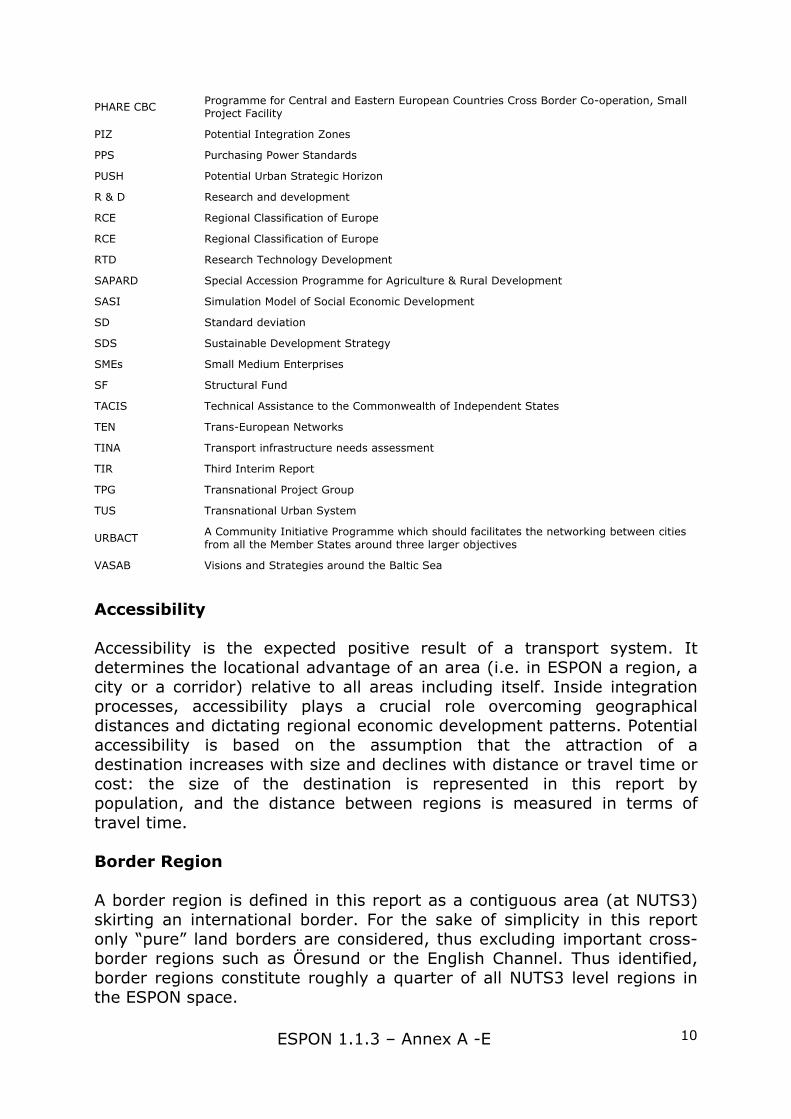
ESPON 1.1.3 – Annex A -E
10
PHARE CBC Programme for Central and Eastern European Countries Cross Border Co-operation, Small Project Facility
PIZ Potential Integration Zones
PPS Purchasing Power Standards
PUSH Potential Urban Strategic Horizon
R & D Research and development
RCE Regional Classification of Europe
RCE Regional Classification of Europe
RTD Research Technology Development
SAPARD Special Accession Programme for Agriculture & Rural Development
SASI Simulation Model of Social Economic Development
SD Standard deviation
SDS Sustainable Development Strategy
SMEs Small Medium Enterprises
SF Structural Fund
TACIS Technical Assistance to the Commonwealth of Independent States
TEN Trans-European Networks
TINA Transport infrastructure needs assessment
TIR Third Interim Report
TPG Transnational Project Group
TUS Transnational Urban System
URBACT A Community Initiative Programme which should facilitates the networking between cities from all the Member States around three larger objectives
VASAB Visions and Strategies around the Baltic Sea
Accessibility Accessibility is the expected positive result of a transport system. It determines the locational advantage of an area (i.e. in ESPON a region, a city or a corridor) relative to all areas including itself. Inside integration processes, accessibility plays a crucial role overcoming geographical distances and dictating regional economic development patterns. Potential accessibility is based on the assumption that the attraction of a destination increases with size and declines with distance or travel time or cost: the size of the destination is represented in this report by population, and the distance between regions is measured in terms of travel time. Border Region A border region is defined in this report as a contiguous area (at NUTS3) skirting an international border. For the sake of simplicity in this report only “pure” land borders are considered, thus excluding important cross-border regions such as Öresund or the English Channel. Thus identified, border regions constitute roughly a quarter of all NUTS3 level regions in the ESPON space.

ESPON 1.1.3 – Annex A -E
11
Capacity-based and Principle based policy combinations There are two kinds of policy combinations: the so called Principle-based policies combinations are based on top-down governance processes by EU and national institutions or implemented via EU programmes such as the Structural Funds. The so called Capacity-based policy combinations are implemented by national, regional or local governments, private businesses and civil society organizations and focus on the capacity to implement EU funding opportunities. Competitiveness In this case concerning to the EU, competitiveness refers to the capacity of identifying, keeping and improving systematically and effectively, a territory’s comparative advantages in order to reach, maintain and improve its position in every possible aspect (social, economical environmental, cultural, etc) in relation to other macro-regions around the world. Convergence and Divergence The concept’s focus on the analysis of the presence of dispersion or non-dispersion patterns in terms of wealth between regions or nations across time. This report conceptualises convergence as the process of achieving territorial cohesion, particularly its economic element. It is the dynamic aspect of cohesion in the way that it is based on the analysis of gross domestic product per capita, economic discontinuities or disparities, and barriers identified at European and national levels. The lower the discontinuities are, a higher level of convergence is achieved. On the other hand, but using the same bases of analysis, divergence represents exactly the opposite phenomenon in which a higher presence of disparities generates a higher divergence pattern between regions or countries. Cross-border cooperation Type of cooperation usually arranged between adjacent border regions, authorities and communities located along international borders, taking advantage of their implicit potential to participate inside several bilateral or multilateral programs in which common goals are decided to be developed in benefit of all the interested participant actors. With cross border cooperation, neighbouring regions are able then to achieve a positive reinforcement of their relationships in order to facilitate the necessary agreements and arrangements for the common efforts. The integration flows and possibilities for cooperation can be identified according to some factors of analysis, for instance geographic type of border, density of crossings, and even disparities of indicators, which instead of being considered as obstacles for cooperation are taken as an important potential for future changes.

ESPON 1.1.3 – Annex A -E
12
Disparities As it name says, it refers to the perceived inequalities between certain areas, regions, nations or any other level of analysis in every aspect possible. The identification and measurement of them is then fundamental inside the design of policies focused towards its reduction. Although there could be many types, disparities can be classified into physical disparities, associated with natural geographical issues; economic disparities, associated with differences in terms of economic indicators, outputs, inputs, etc of certain regions; social disparities, associated to differences in, for example standards of living of the population or any other possible social indicator; or territorial disparities associated with differences inside urban systems and its relationships with the countryside, land uses, localization of economic activities and infrastructures among others. European enlargement European enlargement has occurred several times in the history of the EC/EU. In our ESPON 1.1.3 project we make reference specifically to the fifth wave of enlargement of the European Union marked by the process of integration of ten new member states, Estonia, Latvia, Lithuania, Poland, Hungary, The Czech Republic, Slovakia, Slovenia, Cyprus and Malta on May 1, 2004, as well as the imminent accession of Bulgaria and Romania in 2007. European polycentricity (macro level) Depending on the level or scale analyzed, polycentricity may vary. At the macro level, the European territory intends to develop a polycentric model able to decentralise the concentrated activities in the so called “Pentagon”, the current central core of the European territory, into a more diverse polycentric model. The idea is to drive the structure more to the so called ‘bunch of grapes’ model, stimulating zones of economic development beyond the Pentagon, attempting an equal distribution of activities based on specialization patterns, developing FUAs (Functional Urban Areas) and MEGAs (Metropolitan European Growth Area) outside of the Pentagon, expecting to reach all regions in Europe without distinction, even the most isolated or peripheral areas of the territory. Financial and Monetary integration In the European context, financial and monetary integration makes reference to the construction of an economic scenario of common standards, structures, regulations, and institutions able to guarantee the continuos convergence in financial and monetary terms. It goes beyond
ESPON 1.1.3 – Annex A -E
13
just the adoption of a single common currency, but at the same type relates the concepts for an appropriate integration to the role of Member States in processes of price stability, participation in exchange rate mechanism, government budgetary position and convergence of long-term interest rates, pursuing at the same time a financial market integration generated from a continuous process of development and strengthening of financial institutional structures of the financial system of the union. As for the recent new member states, most of them economies in transition, it constitutes an interesting challenge towards their own integration inside an already stable monetary and financial union. It is expected then with this process that the enlarged EU will face increasingly levels of territorial cohesion able to guarantee better efficiency and competitiveness of the financial markets. Integration Integration in the European space means the expanding, widening and deepening of possibilities for a joint action in both inter-governmental and supranational levels, concerning social, economical, political, financial, monetary and spatial matters. Increased integration and territorial cooperation inside a polycentric development model is a clear desirable approach that is said to lead to convergence and consequent reduction of several disparities. Macro-border regions Borders (and border regions) within the ESPON space are divided into four main macro border regions:1) internal borders between the 15 old Member States including the two ESPON participating EFTA countries of Norway ad Switzerland; 2) internal borders between the 10 New Member States including the Accession Countries of Bulgaria and Romania; 3) the “traditional” east-west border separating the former planning economies from their westerly neighbors; and 4) the total external border of the present ESPON space including Outré-Mer land borders. National polycentricity (meso level) The meso level for ESPON corresponds to the national level, or transnational level. In a desired European polycentric structure, the role of urban areas is fundamental. And nationally the strengthening of networks of cooperation is particularly important when developing a polycentric structure, in which a wide range of cities from all levels is expected to increase their position inside urban hierarchies through certain type of polycentric integration, recognizing the importance of rural areas which could be directly influenced by the development of the closest relevant or influencing urban node, or viceversa. Furthermore, the emerging regional integration and competitiveness along the meso level appears as one of the bases to create transnational networks of cooperation that as well are

ESPON 1.1.3 – Annex A -E
14
expected to contribute in the development of the desired polycentric model inside the meso level. Neighbour-dependent growth Neighbour-dependent growth is a concept that determines how geographic location affects patterns of economical growth. In some cases the results could be favorable in the way that similar countries or regions can form clusters of development by growing together; but at the same time it could also strengthen disparities between regions in favour of the best performing ones. Norms Norms describe the collective expectations for the proper behavior of actors with a given identity. They prescribe or proscribe the range of acceptable actions for such identities. This report specifies the norms of the European Spatial Development Perspective (ESDP) which are related to 1) balanced and effective competition across the community territory; 2) territorial cohesion (covering also economic and social cohesion concepts); and 3) conservation of the natural and cultural heritage, emphasising with particular interest the territorial cohesion component, and taking polycentricity as a political tool to achieve the mentioned norms. Periphery / Peripheralization Refers to highly differing levels reflected by several differences, geographic functional in any possible activity between regions within the territory of the European Union putting an intensive pressure to reinforce and speed up the catching up process of them. Usually conceptualised as those regions and areas that are far from centers of economic or social power in terms of geography or functionality. Phase strategy / Phase model The phase strategy focuses mainly on working at first on the competitiveness of the major urban agglomerations in the New Member States and accession countries, in order to achieve then a balanced polycentric regional development in a second stage. The strategy was developed after the discussion over the implementation of the polycentric model in the European territory which at first appeared to be highly positive in the macro level, in the sense that counteracting nodes would appear from the strengthening of major urban centers in the accession countries; but at the same time highly negative in the meso level concerning the New Member States, in which the same strengthening would increase the disparities between the major national urban nodes and the medium and small sized cities in a bigger proportion and within

ESPON 1.1.3 – Annex A -E
15
each national urban network. With that on mind the phase model attempts to develop and work first with major urban nodes improving their accessibility to the central core of Europe in order to create appropriate conditions to facilitate, in a second stage the balanced polycentric structure that will be developed in the national level of the new member states. Policy combinations In order to ensure the norms for spatial development intended for the EU, competitiveness, territorial cohesion and environmental sustainability, ESPON proposes through this report a multi-level framework based on policy combinations, understood as a process of coordinating coherent combinations of policies based on both a multi level strategy, that attempts to span the vertical levels of government and administration, and cross sectoral strategy that attempts to integrate traditional policy areas. As multi-level ESPON refers to the EU level (macro), national or transregional level (meso) and the regional-local level (micro); and as a cross-sectoral strategy in all policy areas, it refers to the formulation of integrated strategies able to interact within each other across policy levels and policy fields and on a temporal scale. Polycentric Development A polycentric model attempts to distribute territorial development as equally as possible across all the territory of the EU (at the European, national and regional levels) through cooperation based on concepts of global integration zones, polycentric urban networks, clusters, or any other appropriate concept able enough to cooperate and support a territorial balanced polycentric structure, focusing mainly on the role of cities and urban networks relationships. As a policy strategy, it attempts to join together the goals of both cohesion and competitiveness, but at the same time it is constituted by these two factors. In this sense polycentric development could be seen as both an intervening variable (policy strategy) and as a dependent variable (functional state of affairs). Regional specialisation In this report, regional specialisation refers to some regions that achieve certain level of specialisation according to the measurement of regional employment aggregated indicators into three main economic sectors: agriculture, manufacturing and services. It is also measurable according to the analysis of the relation between specialisation and GDP, which as a result in this report classifies the regions across the European territory into four categories: powerful, slowing, converging/catching-up and diverging/declining.

ESPON 1.1.3 – Annex A -E
16
Territorial Cohesion The concept is a broad one which joins social and economic cohesion all together, understanding it as the capacity to generate certain type of stability in every of the mentioned aspects, able to reaffirm the union as a whole. Cohesion can be measured physically according to natural geographic or demographic conditions; economically, associated with GDP indicators or any other type of economic indicators; and socially according to unemployment rates and quality of labor force among the most relevant ones. The concept attempts to generate a balanced distribution of human activities across the European Union, no matter to which territory they belong to. As its main objective, territorial cohesion attempts to achieve a more balanced development by reducing existing disparities (for instance between urban networks), preventing territorial imbalances (for instance geographical imbalances between regions), and by making both sectoral policies, which have a spatial impact, and regional policies more coherent. The goal is also to improve territorial integration and encourage cooperation between all regions taking special care of the least favored ones, which usually are the ones containing a considerable amount of the rural areas of the European territory. Transnational regions A transnational region like the Baltic Sea Region, SE Europe or the Balkans, is formed when territorial cooperation and transnational functional relationship provide possibilities for more institutionalized patterns of trade or cooperation. Their particular interest for ESPON is due to the clear potential of them in terms of further development in the future, according to strategies based on the stimulation of FUAs (Functional Urban Areas) and MEGAs (Metropolitan European Growth Area) outside of the Pentagon. The latest enlargement of the EU and the ones coming in the future may strengthen the role of transnational regions in a continental scale, focussing in connecting the potentials of the MEGAs with a efficient accessibility, leading then to Potential Integration Zones, that will put particular interest in the more peripheral areas of Europe. Urban networks An urban network is a type of structure constantly searching productive interlaced activities under the basis of complementarities forming in this way a productive system able to contribute and accelerate its own economical development. Urban networks are the main creators and polarising elements inside spatial development, affecting both positively or negatively its surrounding territories and countryside. The effectiveness of an urban network is marked by an appropriate functional interconnection

ESPON 1.1.3 – Annex A -E
17
between the participants involved towards the creation of a balanced structure with adequate access to one or various relevant urban regional centers, generators as well of relevant economic, social, cultural and environmental development.
ESPON 1.1.3 – Annex A -E
18
A.5 References
See A9
A.6 Publications of the TPG
Angelidis M. (2005), Polycentricity in Policies: The Greek Case, in Zonneveld W. - Meijers E. - Waterhout B. (Guest editors) (2005), Polycentric Development Policies across Europe, Built Environment Vol. 31 Number 2, Oxon, Alexandrine Press (editors: Hall P. & Banister D.) Angelidis Minas (2004), European Union’s spatial development policies: A threat to Europe and Greece, NTUA University Press, Athens (In Greek + English summary). Corpataux J. and Crevoisier O. (2005), "Increased Capital Mobility/liquidity and its Repercussions at Regional Level. Some Lessons from the Experiences of Switzerland and the United Kingdom (1975-2000), European Urban and Regional Studies, 12(4), pp. 315-334. Eskelinen, Heikki & Hirvonen, Timo (2005): Laajentunut unioni – säilyykö kahtiajako? [Enlarged Union – unchanging disparity?] in Eskelinen, H. & Hirvonen, T. (eds.): ESPON Maantieteen Päivillä Joensuussa 2004. University of Joensuu, Reports of Karelian Institute N:o 2/2005, 48-62. Mourato, J. and Besussi, E. (2005) "Territorial Cohesion revisited in an enlarged Europe: Assessing its conceptual implications for spatial planning" paper presented at the AESOP Conference, Vienna, 13-17 July, 2005

ESPON 1.1.3 – Annex A -E
19
A.7 Indication of Performance
Number of performance indicators achieved 9 9
Number of spatial indicators developed: - in total covering - the EU territory - more than the EU territory 9
30 30
Number of spatial indicators applied: - in total covering - the EU territory - more than the EU territory 28
Number of spatial concepts defined 13
Number of spatial typologies tested 6 Number of EU maps produced 26
Number of ESDP policy options addressed in that field 3

ESPON 1.1.3 – Annex A -E
20
A.8 Additional Maps
A.8.1 Maps for Chapter 2.3.1
Accessibility maps
This annex contains accessibility maps in ESPON standard map design. The maps were presented in Chapter 2.3.1 as zoom-in maps and are shown now for the whole of Europe. In the first map taken from ESPON 1.2.1 (ESPON 1.2.1, 2004) all European regions are considered as destinations. In the two other maps, the destinations are restricted to the fifteen old member states of the European Union (EU15) and to the new member states and accession countries (NMAC), respectively.

ESPON 1.1.3 – Annex A -E
21
Map A8.1: Potential accessibility, multimodal, 2001

ESPON 1.1.3 – Annex A -E
22
Map A8.2: Potential accessibility to EU 15, multimodal, 2001

ESPON 1.1.3 – Annex A -E
23
Map A8.3: Potential accessibility to NMAC, multimodal, 2201

ESPON 1.1.3 – Annex A -E
24
A.8.2 Maps for Regional Specialisation
Referred to Section 2.6
Map A8.4: Specialisation trends by NACE sectors in ‘P’ regions

ESPON 1.1.3 – Annex A -E
25
Map A8.5: Specialisation trends and presence of MEGAs in ‘P’ regions

ESPON 1.1.3 – Annex A -E
26
Map A8.6: Specialisation trends by NACE sectors in ‘S’ regions

ESPON 1.1.3 – Annex A -E
27
Map A8.7: Specialisation trends and presence of MEGAs in ‘S’ regions

ESPON 1.1.3 – Annex A -E
28
Map A8.8: Specialisation trends by NACE sectors in ‘C’ regions

ESPON 1.1.3 – Annex A -E
29
Map A8.9: Specialisation trends and presence of MEGAs in ‘C’ regions
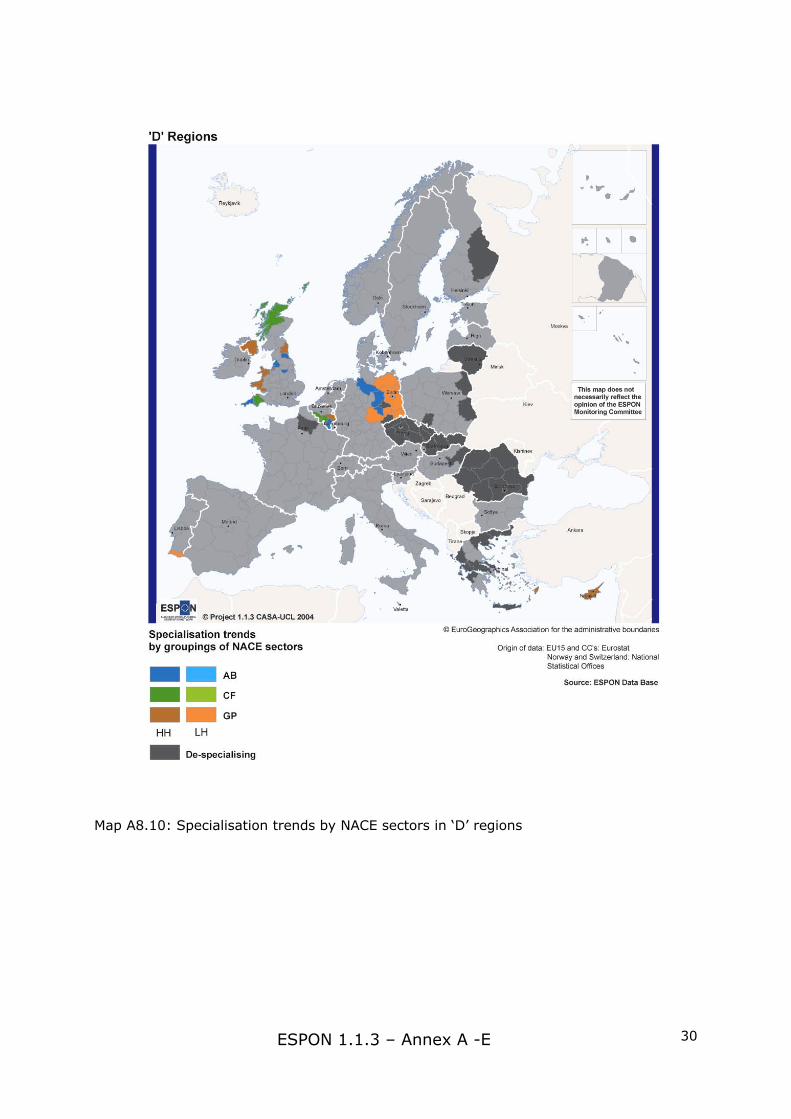
ESPON 1.1.3 – Annex A -E
30
Map A8.10: Specialisation trends by NACE sectors in ‘D’ regions

ESPON 1.1.3 – Annex A -E
31
A.8.3 Maps for SASI Model
This annex contains maps of SASI model results in ESPON map design. The maps were presented in Chapter 4 as zoom-in maps and are shown here for whole of Europe.

ESPON 1.1.3 – Annex A -E
32
Map A8.11: Scenario 00: Accessibility rail/road/air travel (million) 2031

ESPON 1.1.3 – Annex A -E
33
Map A8.12: Scenario A1: Accessibility rail/road/air travel: relative difference (%) 2031

ESPON 1.1.3 – Annex A -E
34
Map A8.13: Scenario B1: Accessibility rail/road/air travel: relative difference (%) 2031

ESPON 1.1.3 – Annex A -E
35
Map A8.14: Scenario B5: Accessibility rail/road/air travel: relative difference (%) 2031

ESPON 1.1.3 – Annex A -E
36
Map A8.15: Scenario 00: GDP per capita (Euro) 2031

ESPON 1.1.3 – Annex A -E
37
Map A8.16: Scenario A1: GDP per capita: relative difference (%) 2031

ESPON 1.1.3 – Annex A -E
38
Map A8.17: Scenario B1: GDP per capita: relative difference (%) 2031

ESPON 1.1.3 – Annex A -E
39
Map A8.18: Scenario B5: GDP per capita: relative difference (%) 2031

ESPON 1.1.3 – Annex A -E
40
Map A8.19: Scenario A1: GDP per capita: absolute difference (Euro) 2031

ESPON 1.1.3 – Annex A -E
41
Map A8.20: Scenario B1: GDP per capita: absolute difference (Euro) 2031

ESPON 1.1.3 – Annex A -E
42
Map A8.21: Scenario B5: GDP per capita: absolute difference (Euro) 2031

ESPON 1.1.3 – Annex A -E
43
Map A8.22: Scenario 00: GDP per capita: (EU27+7=100) 2031

ESPON 1.1.3 – Annex A -E
44
Map A8.23: Scenario A1: GDP per capita (EU27+7=100): relative difference (%) 2031

ESPON 1.1.3 – Annex A -E
45
Map A8.24: Scenario B5: GDP per capita (EU27+=100): relative difference (%) 2031

ESPON 1.1.3 – Annex A -E
46
Map A8.25: Scenario B5: GDP per capita (EU27+=100): relative difference (%) 2031

ESPON 1.1.3 – Annex A -E
47
A.9 Bibliography
Alessandrini, P., Papi, L. and Zazzaro, A. (2003), Banks, Regions and Development , Banca Nazionale del Lavoro Quarterly Review, No. 224, pp. 23-55.
Andrikopoulou, E. and Kafkalas, G. (2000), Spatial effects of the European policies: the Greek experience 1989-1999, Ziti publ., Thessalonica (In Greek).
Angelidis, M. (2004a), European Union’s spatial development policies: A threat to Europe and Greece, NTUA University Press, Athens (In Greek + English summary).
Angelidis, M. (2004b), New centralities in Greece: urban regions, small
and medium-sized cities, countryside areas, in NTUA - Univ. Paris X - Min. of Environment, Spatial Planning and Public Works (MERPPW) - Ministry of Economy (2004)
Angelidis, M. (2005), Polycentricity in Policies: The Greek Case, in Zonneveld, W., Meijers, E. and Waterhout, B., (Guest editors) (2005).
Angelidis M., Karka G., Komilis P., Pantazis A., Burgel G., Vayonis N. et al (1998), The urban network in Greece: existing situation, policy recommendations, (Research program of the National Technical Univ. of Athens), NTUA - MERPPW (in Greek).
Angelidis M., Wassenhoven L., Karka G., Ioannou B. and Milionis S.
(2001), Strategic action plan for the development of small and medium size towns and of the surrounding countryside, especially in islands, (Research program of NTUA), NTUA - MERPPW (in Greek).
Baudino, P., Caviglia, G., Dorrucci, E. and Pineau G. (2004), Financial FDI to the EU Accession Countries, Directorate General International and European Relations, European Central Bank, Frankfurt am Main.
Böhme, K. (2003), Discursive European integration: the case of Nordic spatial planning, Town Planning Review, Vol. 74, No. 1, January 2003. Liverpool University Press.
Bröcker, J., Meyer, R., Schneekloth, N., Schürmann, C., Spiekermann, K. And Wegener, M. (2004), Modelling the Socio-economic and Spatial Impacts of EU Transport Policy, IASON Deliverable 6. Kiel/Dortmund.
Bröcker, J., Meyer, R., Schneekloth, N., Schürmann, C., Spiekermann, K. and Wegener, M. (2004), Modelling the Socio-Economic and Spatial Impacts of EU Transport Policy. Deliverable D6 of IASON (Integrated Appraisal of Spatial Economic and Network Effects of Transport

ESPON 1.1.3 – Annex A -E
48
Investments and Policies). Kiel/Dortmund: Christian Albrechts University of Kiel/Institute of Spatial Planning.
Castells, M. (1996), The rise of the network society: Volume 1 – The information Age: economy, society and culture, Blackwell Publishers, Massachusetts – Oxford.
Caviglia, G., Krause, G. and Thimann, C. (2002), Key features of the financial sectors in EU accession countries, in Thimann C. (ed.), Financial Sectors in EU Accession Countries, European Central Bank, Frankfurt am Main.
CEC (1996), First Report on Economic and Social Cohesion, Commission of the European Communities, Brussels.
CEC (2004a), Environment Policy Review: Consolidating the environmental pillar of sustainable development, Communication from the Commission to the Council and the European Parliament, COM (2003) 745 final (2 Feb.), Commission of European Communities, Brussels.
CEC (Commission of the European Communities) (2004), A New Partnership for Cohesion: Convergence, Competitiveness, Cooperation: Thrid Report on Economic and Social Cohesion 8COM/2004/107), Luxembourg, Office of Official Publications of the European Communities.
Claessens, S., Lee R. and Zechner, J. (2003), The future of Stock Exchanges in European Accession Countries, Discussion Report to the Corporation of London, May.
Commission of the EC (1997) First Cohesion Report, Office for Official Publications of the EC.
Commission of the EC (1999) 6th periodic report on the economic and social situation and the development of the EU regions, Office of Official Publ. of the EC, Luxembourg.
Commission of the EC (2000), Second Cohesion Report, Luxembourg, Office for Official Publications of the EC
Commission of the EC (2003), Second progress report on economic and social cohesion, Communication from the Commission COM (2003) 34 final Brussels.
Commission of the EC (2005), Third progress report on economic and social cohesion, Communication from the Commission.
Committee on Spatial Development in the Baltic Sea region (CSD/BSR), (2001), VASAB2010 Plus - Spatial Development Action Programme'. http://vasab.leontief.net/background/indexback.htm

ESPON 1.1.3 – Annex A -E
49
Committee on Spatial Development in the Baltic Sea region (CSD/BSR), (2001), Wismar Delaration and VASAB 2010+, Visions and Strategies around the Baltic Sea 2010, Conference of Ministers for Spatial Planning and Development, Wismar 20-21 September 2001.p. 2.
Cornett, A. and Snickars, F. (2002), Trade and foreign direct investments as measures of spatial integration in the Baltic Sea Region, Geographia Polonica, Vol. 75, No. 2.
Corpataux, J. and Crevoisier, O. (2001), Place financière ou économie de production ? Les mécanismes de la dualisation économique et spatiale de la Suisse (1975-2000), Economie, Géographie et Société, vol. 3, no 1, pp. 3-30.
Corpataux, J. and Crevoisier, O. (2005), Increased capital mobility/liquidity and its repercussions at regional level: some lessons from the experiences of Switzerland and the United Kingdom (1975-2000), European Urban and Regional Studies, forthcoming.
Corpataux, J., Crevoisier, O. and Thierstein A. (2002), Exchange Rate and Regional Divergences : the Swiss Case, Regional Studies, vol. 36, no 6, pp. 611-626.
Cortés Ballerino, C., Johansson, M. and Van Well, L. (2005). Polycentric Development and Territorial Cohesion in the BSR: Strategies and Priorities. Prepared for the Swedish Ministry of Industry, Employment and Communications, July 2005.
Crevoisier, O., Corpataux J. and et Thierstein A. (2001), Intégration monétaire et régions: des gagnants et des perdants, L’Harmattan, Paris.
Dabrowska, K. and Gruszczynsky M. (2003), Benefits and Disadvantages of a Single Dominating Financial Centre – the Polish Case, in Thierstein A and Schamp, E., W. (eds.), Innovation, Finance and Space, Selbstverlag des Instituts für Wirtschafts- und Sozialgeographie der Johann Wolfgang Goethe-Universität Frankfurt/Main, Frankfurt/Main.
DATAR (1995), Schéma National d’Aménagement et de Développement du Territoire – Chapitre: L’organisation des services collectives, La Documentation Française, Paris.
de Haas R.T.A and van Lelyveld I.P.P. (2002), Foreign Bank Penetration and Private Sector Credit in Central and Eastern Europe, De Nederlandsche Bank Staff Report, No. 91.
Demirgüc-Kunt A. and Levine R. (2001), Financial Structure and Economic Growth, MIT Press, Cambridge, Mass.

ESPON 1.1.3 – Annex A -E
50
Department of Prospective and Planning (DPP) (2001), O Impacto Macroeconómico do Quadro Comunitário de Apoio (1994-1999). DPP, Lisboa. www.dpp.pt.
Different Study Groups (1997), Spatial effects of the Community Policies and Programs to 12 Greek Regions, MERPPW (fin.: 2nd CSF) (in Greek)
DIW and EPRC (2001), The Impact of EU Enlargement on Cohesion, Berlin and Glasgow, 2001.
Dow, S., C. (1998), Financial Structure and the Economic Performance of Peripheral Economies: the Case of Europe, in Hill S. and Morgan B. (eds.), Inward Investment, Business Finance and Regional Development, Mc Millan, London.
Dow, S., C. (1999), The Stages of Banking Development and the Spatial Evolution of Financial Systems, in Martin R. (Ed.), Money and the Space Economy, John Wiley & Sons, New York.
Eskelinen, H. and Snickars, F. (1995), Competitive European Peripheries?, an introduction in Eskelinen and Snickars (1995), Competitive European Peripheries, Springer:Verlag, Berlin, Heidelberg, New York.
ESPON 1.1.1 (2004), Potentials for Polycentric Development in Europe. Final Report. Stockholm: Nordic Centre for Spatial Development. http://www.es-pon.lu/on-line/documentation/ projects/thematic/1873/fr-1.1.1_revised.pdf.
ESPON 1.1.1 (2005), The Role, Specific Situation and Potentials of Urban Areas as Nodes in a Polycentric Development: Potentials for polycentric development in Europe, www.espon.lu.
ESPON 1.1.1 Coding key (3rd_ir_111_annexes1-10.pdf)
ESPON 1.1.1 Transnational Project Group (2004), The Role, Specific Situation and Potentials of Urban Areas as Nodes of Polycentric Development, Final Report, Nordregio, Stockholm.
ESPON 1.2.1 (2004), Transport Services and Networks, Final Report. Tours: CESA, Université François-Rabelais de Tours. http://www.espon.lu/on-line/documentation/projects/thematic/1950/fr-1.2.1-summary.pdf.
ESPON 2.1.1 (2004), Territorial Impacts of EU Transport and TEN Policies. Final Report. Kiel: Institute of Regional Research, Christian Albrecht University of Kiel. http://www.espon.lu/on-line/documentation/ projects/policy_ impact/ 1867/fr-2.1.1_revised.pdf.
ESPON 2.1.1 (2005), Territorial Impact of EU Transport and TEN Policies. Christian Albrecht University of Kiel, Institute of Regional Research, Kiel (Germany). www.espon.lu

ESPON 1.1.3 – Annex A -E
51
ESPON 3.1 (2005), Integrated Tools For European Spatial DEVELOPMENT. Bundesamt fuer Bauwesen und Raumordnung (BBR), Bonn (Germany). www.espon.lu
ESTIA-SPOSE (2005), European Space Territorial Indicators And Actions To The Spatial Planning Observatory In Southeast Europe, (a Workshop Meeting), held on January 21st-22nd, 2005, Lubljana.
European Commission (2002), Revision of the Trans-European Transport Networks “TEN-T”. Community Guidelines. http://europa.eu.int/comm/ transport/themes/network/english/ten-t-en.html.
European Union (2004), Decision No 884/2004/EC of the European Parliament and of the Council of 29 April 2004 amending Decision No 1692/96/EC on Community guidelines for the development of the trans-European transport network. Official Journal of the European Union L 167, 1–38.
Faludi, A. (2005), Polycentric territorial cohesion policy in Town Planning Review Volume 76, number 1, Liverpool University Press.
Faludi, A. (2005), Territorial cohesion: an unidentified political objective. Introduction to the special issue, Town Planning Review, Vol. 76, No. 76, 2005. Liverpool University Press.
Gal, Z. (2004), Spatial Structure and the Expanding European Integration of the Hungarian Banking System , Paper presented at European Science Foundation Exploratory Workshop on Economic Geography and European Finance, Oxford, 17-18th September.
Grasland, C. and Hamez, G. (2005), Vers la construction d’un indicateur de cohesion territoriale europeen ? Report presented in the XLème Colloque of ASRDLF (Association de Science Régionale De Langue Française): Convergence et disparités régionales au sein de l’espace européen; Les politiques régionales à l’épreuve des faits, Bruxelles – 1, 2 et 3 Septembre 2004
Hajer, M., A. (1989), City Politics, Newcastle upon Tyne, Athenaeum Press.
Hall, P. and Pfeiffer, U. (2000), Urban Future 21: A global agenda for twenty-first century cities, E & FN Spon, London.
Haselmann, R (2003), The role of financial markets in the growth process of the Eastern European Economies, Paper presented at the EAEPE Annual Conference, Maastricht, 7-10th November.
HLG, High Level Group on the Trans-European Transport Network (2003): Report. Brussels, European Commission. http://www.europa.eu.int/comm/ ten/transport/revision/hlg/2003_report_kvm_en.pdf.

ESPON 1.1.3 – Annex A -E
52
Hoelscher, J. and Jarmuzek, M. (2003), Over- or Undervalued Euroland Entry? Paper presented at Economics for the future Conference, Cambridge, UK, 17-19th September.
Inotai, A. (2003), The Eastern Enlargement of the EU, in Cremona, M., 2003, The Enlargement of the European Union, Oxford University Press.
Johansson, M. (2002), Facing ESPON, Polycentric Urban Structures in Sweden, Nordregio Report 2002:1
Katzenstein, Peter J. (ed.)(1996), The Culture of National Security: Norms and Identity in World Politics, New York: Columbia University Press.
Klagge, B. and Martin, R. (2005), Decentralised versus Centralised Financial Systems: Is there a Case for Local Capital Markets? Journal of Economic Geography, vol. 5, no 4, pp. 387-421.
Korcelli, P. (2005), The Urban System of Poland, Built Environment, Vo. 31, No.2, 2005.
Kratochwil, F. (1989), Rules, Norms and Decisions. Cambridge. Cambridge University Press.
Kratochwil, V. (1989), Rules, Norms, and Decisions: On the Conditions of Practical and Legal Reasoning in International Relations and Domestic Affairs, Cambridge: Cambridge University Press, 1989.
Meijers, E. Waterhout, B. and Zonneveld, W. (2005) Polycentric Development Policies in European Countries: an introduction in Built Environment, Vol. 31, no. 2. 2005.
MERPPW (2002), General Framework of Spatial Planning and Sustainable Development, (GFSPSD) (in Greek).
NTUA - Univ. Paris X - MERPPW - Ministry of Economy (2004), Proceedings of the Conference: The new polycentricity and spatial development: Urban areas, small and medium size towns and the countryside, Athens (in Greek and French).
Pavlinek, P. (2004), Regional Development Implications of Foreign Direct Investment in Central Europe, European Urban and Regional Studies, 11(1), pp. 47-70.
Quah, D.T. (1996), Empirics for economic growth and convergence, European Economic Review, 40, pp. 1353-1375.
RECLUS (1989), Les villes Europeeénes: Rapport pour la DATAR, Montpellier: Réseau dÉtude des Changements dans les Localisations et les Unités Spatiales.

ESPON 1.1.3 – Annex A -E
53
Sala-i-Martin, X. (1996), Regional cohesion: evidence and theories of regional growth and convergence, European Economic Review, 40, pp. 1325-1352.
Sassen, S. (2002), Global networks, linked cities, Routledge, New York – London
Schürmann, C., Spiekermann, K. and Wegener, M. (1997), Accessibility Indicators. SASI Deliverable D5. Berichte aus dem Institut für Raumplanung 39. Dortmund: Institute of Spatial Planning.
Statistical Office of Republic of Slovenia, www.stat.si
Strategy of Slovenian Spatial Development, MOPE, 2004, www.sigov.si/mop
TINA Secretariat (1999), TINA Transport Infrastructure Needs Assessment. Identification of the Network Components for a Future Trans-European Transport Network in Bulgaria, Cyprus, Czech Republic, Estonia, Hungary, Latvia, Lithuania, Poland, Romania, Slovakia and Slovenia, Final Report, Vienna, TINA Secretariat.
TINA Secretariat (2002), Status of the Pan-European Transport Corridors and Transport Areas. Developments and Activities in 2000 and 2001. Final Report. Vienna: TINA Secretariat.
Tobelem – Zanib Chr. (1995), La qualité de la vie dans les villes françaises, Publications de l’Université de Rouen, Rouen.
Vihnas de Souza, L. (2004), Financial Liberalization and Business Cycles: The Experience of Countries in the Baltics and Central Eastern Europe, Deutsche Bundesbank Discussion Paper, Serie 1, No. 23.
Vincent, N. (1992), Visions and Visioning in European Spatial Planning, in Faludi, A (ed) European Spatial Planning, Lincoln Institute of Land Policy, Cambridge, Mass. p. 121.
Waterhout, B. (2002), Polycentric Development: What is behind it? in European Spatial Planning, Faludi, A. ed. Cambridge, Mass.
Wegener, M. and Bökemann, D. (1998), The SASI Model: Model Structure. SASI Deliverable D8. Berichte aus dem Institut für Raumplanung 40. Dortmund: Institut für Raumplanung, Universität Dortmund. http://www.raumplanung.uni-dortmund.de/irpud/pro/sasi/ber40.pdf.
Wegener, M., Eskelinen, H., Fürst, F., Schürmann, C. and Spiekermann, K. (2001), Criteria for the Spatial Differentiation of the EU Territory: Geographical Position. Study Programme on European Spatial Planning. Forschungen 102.2. Bonn: Federal Office for Building and Regional Planning.

ESPON 1.1.3 – Annex A -E
54
Wegener, M., Eskelinen, H., Fürst, F., Schürmann, C. and Spiekermann, K. (2001), Criteria for the Spatial Differentiation of the EU Territory: Geographical Position. Study Programme on European Spatial Planning. Forschungen 102.2. Bonn: Federal Office for Building and Regional Planning.
Zavodnik Lamovšek, A., Sustainable Spatial Development in Slovenia, Ministry of Environment and Spatial Planning, National office for Spatial Planning, Ljubljana, 2003
Zonneveld, W., Meijers, E. and Waterhout, B. (2005), Polycentric Development Policies across Europe, Built Environment Vol. 31 Number 2, Oxon, Alexandrine Press (editors: Hall P. & Banister D.).

ESPON 1.1.3 – Annex A -E
55
A.10 Expert Info
A.10.1 Methodological notes on the use and the interpretation of the GDP per capita per country and per region for long term comparisons
See section 1.5.1 1. We use here the PPS adjustment of the GDP. This use is a “common practice to compare GDP data in order to reflect living standards more closely in the presence of differing price levels between countries (EC (2005), Third progress report on economic and social cohesion).
2. We should note, more in general, that the comparisons for a long time period of the per capita GDP both per country and per region present some insufficiencies because of the use by the EC (Eurostat, DG Regio) of different methodologies / standards – see in detail in next. Also the GDP per capita indicator is by nature more appropriate for comparisons between different spatial units (countries, regions) at the same years than for comparisons across time.
Therefore, the estimations presented here (as well as the Figure 1 and the Tables 1 and 2 in Annex) should be understood in this scope.
In an effort to diminish these comparability problems, the authors of the “ Third progress report” (2005) stress that: “A reasonably comparable picture of internal disparities within Member States can be established … comparing shares in national GDP of regions accounting for 20% of population substantially reduces the comparability problems resulting from differing number and sizes of regions in the Member States. Four new Member States are included in this analysis. Viewed in this way, disparities are highest in Hungary, where the most prosperous 20% of regional population accounted for 2.6 times the GDP share of the least wealthy. This figure has also increased most markedly in Hungary since 1995. The Czech Republic, Slovakia, the UK and Belgium also have high levels of internal disparities, while they are lowest in Greece, Germany, the Netherlands, Finland and Sweden”. See in the Table.

ESPON 1.1.3 – Annex A -E
56
Table A10.1: Regional disparities within Member States (1995-2002) - ratio between GDP shares of the wealthiest 20% of regional population and the least wealthy 20%.
BE CZ DE EL ES FR IT HU NL AT PL PT SK FI SE UK 2002 2.3 2.1 1.4 1.8 2.0 2.0 2.6 1.5 1.8 1.9 1.8 2.2 1.5 1.6 2.1 1995 2.3 1.8 1.4 1.8 2.0 2.1 2.0 1.4 1.8 1.6 1.8 2.2 1.4 1.4 1.9
Source: EC (2005), “ Third progress report”. 3. The interpretation of the “degree” of regional disparities in a country –e.g. in Greece- both at a given year in comparison with other countries and across time is an even more complicated issue. Let’s see the interpretation of the GDP per capita per region in the case of Greece. As it is stressed by the “Third progress report” (see previously), comparing the GDP of the wealthiest 20% and the poorest 20 % of each country population, inter-regional disparities in Greece are lower than in the majority of the other EU-15 countries. In addition, the comparison of the Standard deviation (SD) of the indicator GDP per capita per region (EU15=100) – see in Table 2 in next- leads in the same conclusion (SD in the case of Greece is lower than in the other EU countries).
However, we should take into account that regions in Greece differ highly as for the population; the share of the population of one region, the region of Athens (Attica) in the total population of the country amounts in 40 %. This singularity reduces the value both of the comparison between the GDP of the wealthiest 20% and the poorest 20 % of the country population and the value of the SD comparison.
4. As for the long-term comparisons, the above SD in the case of Greece was growing in the interval 1988 and 2000 (see in Table 2 in next). However, apart from the precautions (mentioned above) necessary for the use of the SD, this raise of the SD is not statistically significant. Therefore, we could stress either that regional disparities (in Greece) “increased slightly” or that they “remain unchanged”).
In conclusion, in order that our conclusions are useful for policy recommendations for Greece as well as for the accession countries, what is more important is that regional disparities in Greece after its accession in the EU remain very important and persistent (whether they “increase slightly” or they “remain unchanged”) despite the support given to the country by the EU Cohesion policy. The more important disparity, between the Capital region and the other regions of the country, remains very strong

ESPON 1.1.3 – Annex A -E
57
Table A10.2: GDP and population growth in cohesion countries, 1988-2003
Period EL
(Greece)E
(Spain) IRL
(Ireland)P
(Portugal) EU3 (1) EU12 (2)
EU15 (2)
Annual average % change in GDP 88-98 1.9 2.6 6.5 3.1 2.6 2.0 2.0 88-93 1.2 2.0 4.4 2.6 2.0 1.7 1.7 93-98 2.7 3.1 8.7 3.6 3.1 2.4 2.5 projections 98-03 3.9 3.1 6.8 2.1 3.1 2.0 2.1 Annual average % change in population 88-98 0.5 0.1 0.5 0.0 0.2 0.4 0.4 88-93 0.7 0.1 0.2 -0.2 0.2 0.6 0.5 93-98 0.3 0.1 0.7 0.2 0.2 0.3 0.3 projections 98-03 0.9 0.7 1.4 0.8 0.8 0.4 0.4 GDP per head (PPS), EU15=100 (3) 1988 58.3 72.5 63.8 59.2 67.8 106.6 100.0 1989 59.1 73.1 66.3 59.4 68.4 106.4 100.0 1990 57.4 74.1 71.1 58.5 68.6 106.4 100.0 1991 60.1 78.7 74.7 63.8 73.0 105.2 100.0 1992 61.9 77.0 78.4 64.8 72.3 105.3 100.0 1993 64.2 78.1 82.5 67.7 74.0 105.0 100.0 1994 65.2 78.1 90.7 69.5 74.4 104.9 100.0 1995 65.9 78.2 93.3 69.7 74.6 104.8 100.0 1996 66.6 79.3 93.5 70.0 75.5 104.7 100.0 1997 65.9 79.9 103.7 73.3 76.3 104.5 100.0 1998 66.9 79.2 106.1 72.2 75.9 104.6 100.0 1999 68.2 82.1 112.2 71.9 77.9 104.2 100.0 2000 67.7 82.2 115.2 68.0 77.3 104.3 100.0
2001 (4) 64.7 84.1 117.9 69.0 78.1 104.2 100.0
projections 2002 69.0 83.4 119.1 72.5 79.0 104.1 100.0 2003 70.4 83.8 119.9 72.1 79.5 104.0 100.0
Source of the Table: Commission of the EC (2003), Second progress report on economic and social cohesion, Communication from the Commission COM (2003) 34 final Brussels, 30.1.2003 (1) EL + E + P (2) Growth rates 88-98 and 88-93: excluding new German Länder (3) ESA95 methodology from 1995 onwards. This change made the analysis of the GDP evolution from 1988 onwards more difficult – see in detail in the Report (4) Greece: new population figure for 2001 (provisional census result) Source: Eurostat (national accounts) + calculations DGREGIO Updated data – from the EC (2004) Third Cohesion Report (see in Bibliography): GDP per head (PPS) EU15=100 for the year 2001: EL (Greece): 67.1 E (Spain): 84.2 P (Portugal): 70.7. See also in: (a) EC (2005), Third progress report on economic and social cohesion; (b) Eurostat site for updated data and methodological details

ESPON 1.1.3 – Annex A -E
58
Table A10.3: Regional GDP per capita in Greece 1983 - 2002 (PPS, EU15=100*) Regions 1983 1986 1988 1995 1998 2000 2001 2002 Total Greece 61,9 59,2 58,1 65.9 66,0 67,7 67,1 70,9 Anat. Makedonia, Thraki 59 55,8 52,2 55.6 55,4 54,6 53,4 54,0 Kentriki Makedonia 58 58,3 58,3 64.4 67,6 67,9 67,1 72,1 Dytiki Makedonia 57 58,1 62,6 63.0 59,9 67,0 68,7 73,7 Thessalia 57 55,2 53,8 57.1 57,4 61,4 60,2 59,2 Ipeiros 50 47,4 43,5 43.0 41,8 47,1 54,0 56,7 Ionia Nisia 56 51,9 54,6 56.2 55,7 59,2 59,9 61,8 Dytiki Ellada 56 48,9 48,2 52.7 52,6 51,1 52,7 53,3 Sterea Ellada 73,5 71,6 82.7 84,2 76,4 94,9 99,5 Peloponnisos 60,7 58,0 51.8 52,7 57,7 63,9 70,7 Attiki 62,8 61,1 75.7 73,8 77,1 71,2 75,2 Voreio Aigaio 44,0 44,5 58.9 60,8 65,6 62,0 72,5 Notio Aigaio 65,1 68,4 73.9 76,9 79,8 76,5 83,2 Kriti 58 56,6 57,3 65.2 66,8 66,1 64,4 68,6 Standard deviation** 6,10 10,40 10,20 9,60
* For the year 1983: EC (1997) First Cohesion Report For the year 1986: EC (1999) 6th periodic report on the economic and social situation
and the development of the regions of the EU For the years 1988, 1998: EC (2000) Second Cohesion Report. GDP 1988: Methodology
ESA79 1998, ESA95. For the years 1995, 2000: EC (2003) Second progress report on econ. and social
cohesion For the year 2001: EC (2004) Third Cohesion Report For the year 2002: Eurostat site (2005) **For the years 1988, 1995, 1998: EC (2000) Second Cohesion Report. For the year 2000: EC (2003) Second progress report on econ. & social cohesion
Table A10.4: National GDP per capita in Greece 1981-2002 (PPS, EU-15=100*) 1980 1981 1982 1983 1984 1985 1986 1987 1988 1989 1990 1991 1992
52** 52** 52** 51** /61,9
51** 51** 51** /59,2
49** 58,3 59,1 57,4 60,1 61,9
1993 1994 1995 1996 1997 1998 1999 2000 2001 2002 64,2 65,2 65.9 66,6 65,9 66,9 68,2 67,7 67,1 70,9
* For the years 1988-2000: EC (2003) Second progress report on econ. and social
cohesion For the year 2001: EC (2004) Third Cohesion Report For the year 2002: Eurostat site (2005) For the year 1983 (without **): EC (1997) First Cohesion Report For the year 1986: EC (1999) 6th periodic report on the economic and social situation
and the development of the regions of the EU **For the years 1980-85 and 1987 (with **) EU16=100: (Greek) Ministry of Nat.
Economy – MERPPW (1995) – see in References. The data used by this document are compiled by
the 5th periodic report on the economic and social situation and the development of the regions of the EU

ESPON 1.1.3 – Annex A -E
59
A.10.2 Neighbour-dependent growth: empirical evidence from enlargement countries in ESPON space: Methodology
Neighbour-dependent growth: empirical evidence from enlargement countries in ESPON space
The analysis is based on the Moran I spatial autocorrelation statistic:
where zi is the normalised attribute value of the region i, n is the number of regions, and Wij is the spatial weight matrix, where each element wij represents the nearness between regions i and j. The weight matrices in this application are based on computation of the k-nearest neighbours so that he distance between the polygon centroids is used as a criterion for nearness and the K regions j that have the smallest distance to region i take on a value of 1 in wij, and 0 otherwise. To avoid the problem of arbitrary neighbourhoods the following eight ‘very isolated islands’ were excluded from the dataset: ES701, ES702, FR91, FR92, FR93, FR94, PT2, PT3.
In general terms, univariate Moran I measures the degree to which a spatial phenomenon is correlated to itself in space. The expected value for Moran's I is -1/(n-1) which approaches 0 for a large number of regions. Values of I are in the range from approximately -1 to 1. Positive values imply positive spatial autocorrelation, a tendency towards clustering of similar values. The converse is true for negative values indicating that dissimilar values tend to appear in close association.
The bivariate measure of spatial autocorrelation highlights the space-time correlation, i.e. how strong is the spatial clustering effect in time so that for example regions with poor neighbours tend to grow slow rate, and vice versa. Particularly, in the case of positive neighbourhood dependence, this bivariate spatial autocorrelation statistic is closely related to the concept of convergence. High and negative values indicate that highest growth rates occur in regions surrounded by regions with low attribute values,
∑
∑∑
∑∑=
= =
= =
= n
ii
ji
n
i
n
jij
n
i
n
jij z
zzW
W
nI
1
2
1 1
1 1
.

ESPON 1.1.3 – Annex A -E
60
implying increasing disparities and divergence. Negative values, in turn, indicate a tendency towards convergence: i.e. regions with low attribute values in their neighbourhoods tend to realise high growth rates.
The decomposition of the global Moran I into the contributions of individual regions provides a region-specific measure to illustrate to what extent each region in the data set is surrounded by regions with high or low values. Significant values of this local Moran can be used to identify atypical regions (hot and cold spots), and areas where there appears to be a high tendency for clustering. When decomposed in this way, a local Moran statistic acts like a “spatial smoother”, indicating two forms of spatial associations. Positive forms of spatial associations are observed in the following areas:
1. High-High, i.e. a high rate in a region surrounded by high values of the weighted average rate of the neighbouring regions, and
2. Low-Low, i.e. a low rate in a region surrounded by low values of the weighted average rate of the neighbouring region.
Two forms of negative spatial associations are:
3. Low-High, i.e. a low rate in a region surrounded by high values of the weighted average rate of the neighbouring regions, and
4. High-Low, i.e. a high rate in a region surrounded by low values of the weighted average rate of the neighbouring regions.

Part 3 Annexes A-E
Annex D
National Polycentricity Strategies with reference to the ESDP goals
Camila Cortés Ballerino
KTH, Royal Institute of Technology
December 2005

ESPON 1.1.3 – Annex report D II

ESPON 1.1.3 – Annex report D 1
Republic of Bulgaria Bulgaria is a parliamentary democracy composed of 264 municipalities (obshtina) and 28 administrative regions (oblast). According to the Law on Regional Development, promulgated in State Gazette No.14/ 20.02.2004 there are 6 Planning Regions (NUTS 2 level): 1 North-Western; 2 North-Central; 3 North-Eastern; 4South-Eastern; 5 South-Central; 6 South-Western. The Regional Council for Development is a body responsible for the implementation of the government policy for regional development at planning region level. Documents that define strategies and long-term perspective up to 2015 are : Regional Development Plan (RDP) at NUTS2 , District Development Strategies (DDS) at NUTS3, Municipal Development Plan at LAU1 level. In general the main strategic development objectives for the planning regions are to achieve regional economic growth (competitiveness) as a platform to improve socio-economic (cohesion) conditions and ensure preservation of natural cultural and historic heritage. The strategies could be condensed as follow: 1.- Balanced development through achieving regional economy growth encouraging economic activity, attracting new investments, development of human resources 2.-Overcome inter-regional disparities, modernizing technical and social infrastructure, access and quality of public services (region 2 addresses spatial de-concentration of the town functions) 3.-Decrease disparities in socio-economic development and taking part in transnational networks for partnerships 4.- Conserving and improving the conditions of environment in line with EU standards At macro level the vision is: “Strengthening of the leading position of the South-Western planning region in the socio-economic development of the Republic of Bulgaria and turning Sofia city into one of the most attractive economic and cultural center in South-Eastern Europe.” At the national level settlement network is relatively evenly developed across the entire country. Nevertheless, the network of large cities is unevenly distributed. This brings the problem of “periphery-centre” and it becomes a factor for intra regional disparities, creating challenges for regional policies. It is expected that the development of 7 major cities (over 100,000 inhabitants) will foster the development across the region integrating the surrounding territories and less urbanized areas and accelerating their economic social, spatial and environmental development. There is no goal-oriented policy for development for rural areas in the context of EU interpretation At micro level mainly economic and demographic main indicators are observed. The strategy is that 27 medium sized cities could be also drivers for cohesive regional development. Tourism potential areas will also assist in promoting more balanced development. The restructuring and renewal of the manufacturing zones in the cities includes the evacuation of some of the production facilities to provide space for other, an issue on which policy of urban development should focus. Spatial plans of the human settlements and their central areas are obsolete, new design and regulation is urgent. Source: Ministry of Development and Public Works, “Bulgarian Planning Regions”, and planning regions documents http://www.mrrb.government.bg/pageen.php?P=377&SP=379 Operational Program ”Regional Development 2007-20013”

ESPON 1.1.3 – Annex report D 2
Republic of Cyprus Cyprus is composed of 33 municipalities, 350 villages and 6 districts. The responsibility for spatial planning and urban policy rests with the Minister of Interior, who has delegated certain of his responsibilities to the larger Municipalities, the Department of Town Planning and Housing, as well as the Planning Board, an independent body with advisory power over large areas of planning policy. A three-tier hierarchy of development plans is based on the concepts of the “Island Plan,” which refers to the national territory and the regional distribution of resources and development opportunities, the “Local Plan,” for major urban areas or regions undergoing intensive development pressures, and the “Area Scheme,” at the lower end of the hierarchy. A series of new urban policies have been introduced in order to integrate the goals and objectives of the current Strategic Developed Plan into the Spatial Planning System. A wide spectrum of spatial policies is integrated within the developed plans such as housing, transportation, commercial, industry, agricultural, tourism, education, environmental, conservation and landscape policies. Additional there are some area-specific urban policies are addressed such as urban areas in decline and disadvantages mountain areas. The overall strategy of the developed plan has the overall goal to economic and social regeneration in both rural and urban areas. The strategic objectives include: enhance the competitiveness and macroeconomic stability of the economy, achieve balance regional development, embedding social cohesion and full employment conditions, protection of the environment and improving quality of life. The development priorities are: expansion and upgrading of basic infrastructure enhance competitiveness, development of human capital, balance regional development, protection of the environment and improving quality of life. For rural and urban areas the expansion and upgrading of basic infrastructure and the enhancement of the competitiveness play an important role mainly because the predominance importance of the services sectors and the tourism. Furthermore, regional development is very much linked to economic growth and competitiveness of the Cyprus economy constitutes a decisive factor for its further economic growth. In rural areas the aim is to a more diverse economy base, improve business support infrastructure-accessibility and develop thriving local communities. In urban areas the aim is to improve the built environment and cultural infrastructure; provision community facilities (infrastructure and services specially transport); support entrepreneurship and innovation. Economic growth has been different for the regions; it has been concentrated in the urban and coastal regions resulting in regional inequalities. At the same time urban centres have experimented degradation of some areas negatively influence in the quality of life. Major territorial challenges affecting Cyprus today include the continued physical division of the island and the persistence of a dividing line, the decline of historic urban centres, the gradual abandonment of mountain villages, continued urban dispersal and associated periurban sprawl, lagging implementation of nature protection and insufficient agricultural restructuring. Source: “Urban policy in Cyprus, urban policy sectors and their horizontal integration”, Department of Town Planning and Housing, Nicosia, Cyprus National Urban Policy in Cyprus, http://www.eukn.org/cyprus , access November 2005 , contact ECP Mr. Constantinos Alkides “Strategic Development Plan 2004-2006”, contact ECP Mr. Constantinos Alkides “Cyprus Single Programming for objective 2 - 2004-2006”, Planning Bureau, December 2003

ESPON 1.1.3 – Annex report D 3
Czech Republic Czech Republic is a parliamentary democracy composed of 6200 municipalities (obec) and 14 regions (kraje)
The regional policy and physical planning is in responsibility of the Minister of Local Development. There are other ministries and government agencies which programs include important regional elements.
In 2000, the Act of Regional Development Plan and the Strategy of the Regional Development were adopted. The Act on Support to Regional Development stipulated that Regional Councils would be set up at NUTS II level, ensuring programming and implementation of regional development programmes.
The Strategy for Regional Development shows that within its horizon, i.e. around 2010, the ”Czech Republic wants to be a fully-fledged, economically performing member of the European Union with parameters coming close to the average of the Union for all basic criteria (GDP per capita, employment, social security, etc.) with the way and quality of life corresponding to the historical tradition and the position of the Czech Republic in Europe”.(4)
The aim of regional programmes will be above all to reduce high levels of unemployment, support the restructuring of industry, provide support for SMEs at levels proportionate to regional need, remove past ecological burdens and kick-start new economic activities in these regions (1). Thus, special attention will have the creation of new job opportunities in production and services as well as assistance for building business infrastructure.
The principles for regional development are focus in mainly two types of regions: structurally affected regions areas with high concentration of traditional industry and high level of unemployment and, lagging regions or economically weak regions characterized by low standard of living and high share of unemployment. Attention will continue to be paid to former military installations.
Probably problems in Czech regional policy are still those related with coordination of regional development measures and implementation programs. Furthermore, is seems that the interpretation of balance development is more focus to provide a better economic integration: “The effort to achieve a balanced development cannot be understood as an effort to secure completely equal development in all regions, instead the aim is to give equal chances to all regions and make full use of their democratic, natural, economic and any other potential.”(3)
Note: The former Czechkoslovakia was probably the country with the strongest equalisation policy in Central and East Europe region. The regional development in the year following the end of Second Word War was influenced by the attempts to repopulate western frontier zone. Until 1960s regional development was an outcome of a single national plan of economic development. Since the beginning of the 1960s the national plan also included regional development projections and later the plans selected urban agglomerations and frontier district. In 1990 creation of self-governmental units (municipalities) was developed. Finally, in 1991regional policy as an integral part of general economic and social development policy with the main aim to create preconditions for adequate living conditions (2) . The introduction of market system brought an increase of regional disparities. Territorial disparities also emerged with growing unemployment in old industrial regions and backward areas and concentration of foreign investment on the capital. Thus, in 1992 with the Act on Principles of Government Regional Economic Policy was defined as an activity of the state aimed at supporting the effective functioning of the market economy taking into account the regional economic differences (3). Note: The regional policy of the Czech Republic was designed to respect the basic principles of the structural policy of the EU and the overall aim of economic and social cohesion.(3) The ESDP objectives are not always directly or explicit mentioned (ESPON2.4.2 Annex, Sept 2005) Source: (1) Statement of Government Policy, Czech Republic, http://www.vlada.cz/1250/eng/vlada/vlada_progrprohl.htm (3)Ministry of Regional Development, http://www.mmr.cz (2) Ludek Sykora, 1999, “Regional Policy and Planning In transition states of east central europe “, http://www.natur.cuni.cz/~sykora/text/rpap.htm (4) Jiri Blazek, „Local and regional development and policy in the Czech Republic in the 1990s“, http://www.natur.cuni.cz/~mak/clanky/blazlokal.htm (5) Czech republic, 2004, EU strucutarl Fonds, http://www.strukturalni-fondy.cz/index.php?lang=3&show=000009006

ESPON 1.1.3 – Annex report D 4
Republic of Estonia Estonia is a parliamentary republic composed of about 200 rural municipalities (vald), 39 cities (linn) and 15 counties (maakonnad) The Planning Division of the Environmental Policy Department (Ministry of Environment) is responsible for national planning and co-ordinates and guides the elaboration of county and local planning. County planning, carried out by the County Governments Planning Department, should be a basis for general planning at municipal level.
Relevant documents are the Act of Planning and Building (1995), Planning Act (2002) including a comprehensive plan and detailed plan. Estonian Environmental Laws giving special attention Development Plan 2003-2006 (2002, Ministry of Finance) which priorities for social-economic development are human resources, economy, rural and local development and environment. The Estonian Parliament (Riigikogu) adopted a resolution approving the Estonian National Sustainable Development Strategy "Sustainable Estonia 21".up to 2030. The Estonia Action Plan for Growth and Jobs (2005) summarises the primary goals to support and increase competitiveness even though the average of economic growth during the last 10 years has been about 6% and it has allowed wage growth. Estonia has also launched the process of "Success Estonia to coast management and to forest (50% of the country). Additionally there is the National 2014" to improve the country's competitiveness.
The first principles of regional policy in Estonia were formulated in 1989, which promote deconcentration of industries, rural settlement (diversification), border and cross-border cooperation with Russia was also integrated and further extended later on with the enlargement process. In 1994 “the meaning of balanced development was defined as a condition in which a compromise among regions within social justice, economic efficiency and realistic development opportunities is achieved.” The principles were focused to build up capacity and local initiatives and coordination in sectoral policies (2). Special attention is paid to the dominant position of Tallinn and the influence in development that it could promote in its surroundings.
In 1998 Regional development strategy had the task to re-develop the Regional Policy (Ministry Internal Affairs) due to the increasing regional differences. The Estonian Regional Development Agency acts as a manager with representatives from 4 ministries Internal affair, economy, environment, agriculture and counties and local governments. There are 8 regional development programs with a focus on target areas (peripherally, rural, mono-functional settlements, north-east, border regions, south-east, Setumaa region, islands). General trends of regional policy follow two principles: innovativeness (promoting business and SMEs) and self-sufficient (decentralization) (6).
Most of the goals area long-term focus on macroeconomic environment and stability, fiscal policy and “guarantee the sustainable development, Estonia considers it imperative to attach equal importance to the three main pillars – economic, social and environmental spheres, while developing in a balanced and coherent way.”(1)
Challenges are also at the administrative level that needs to integrate and coordinate different plans regarding infrastructure, land consolidation and land use at spatial level while find a path towards convergence in the monetary system as the introduction of the Euro. This last one being important considering that Estonia’s external trade about 80% conducted within the EU.
Sources: (1)Ministry of Foreign Affairs, “Estonia in the EU”, http://www.vm.ee/eng/euro/kat_486/2760.html (2)Jussi S.Jauhiainen, Priidu Ristkok, “Development of regional policy in Estonia” (3) Garri Raagma, “ Spatial vision of Estonia for the year 2050” , http://www.agenda21.ee/english/ (4) Jan Maarten de Vet , 1998, “EU Enlargement and Preaccession: Reflections concerning Central and Eastern Europe” (5)” Estonia National Changeover Plan”, November 2004 (6) Janikson, K., & Kliimask, J., “Regional Policy in Estonia”, http://www.cap.uni-muenchen.de/download/2000/RPEstonia.PDF

ESPON 1.1.3 – Annex report D 5
Republic of Hungary Hungary (93 thousand km2. 10 million pop.) is a parliamentary democracy composed of more than 3100 municipalities (települések), 19 counties (megyék) and 7 statistical regions (régiók). The planning in Hungary is based in the Act XXI on Regional Development and Regional Planning (1996) with the aim to promote well-balanced and sustainable spatial development. The National Regional Development Concept was adopted in 1998. the new is currently before the Parliament. In spite of efforts to promote a balanced national settlement pattern since the 1960s, Hungary spatial structure is still monocentric and regionally unbalanced (1). There are still large disparities both within and among the regions. Disparities have further increased since 1990, as economic development has favoured the western over the eastern regions, and especially the capital region over the rest of the country. There are also insufficient transport connections between regions and cities. Experience has shown that cities with access to the main transport corridors have been able to demonstrate economic upheaval(3) The National Development Plan (2003) is a physical plan with long-term perspective. Its specific objectives are economic competitiveness through the improvement of accessibility, the management of the natural environment and the enhancement of the cultural heritage as well as preventing the negative impacts of the developmental activities on the natural resources and human health .(3) Priorities to achieve these objectives are focus in increasing competitiveness in the productive sectors both at national and international level. There are some cities with innovation potential and some others are characterised by entrepreneurial developments, several parts of the country, however, are underdeveloped or under the impact of economic restructuring. Even though tourism in many regions as a trigger for the economic activity there is still room for the enhancement of still underestimated potentials. The dense spatial structure creates favourable conditions for markets at local/regional levels and should be further exploited. In Hungary the activity rate is low. Thus, the second priority is to increase employment in areas of need and to improve the management of human resources. The promotion of investments and of the SMEs is aimed at job creation in the lagging regions. In Hungary the rural settlements are poorly served with waste and sewage treatment facilities and transport connections. For the purpose of overall development, the infrastructure problem needs to be addressed and coordinated with other sector policies. The new National Development Program specifies 5 Operational Programmes (OP), which are necessary to implement in a coordinated manner. These programmes are the following: Economic Competitiveness OP, Human Resource Development OP, Environmental and Infrastructure OP, Agricultural and Rural Development OP and Regional Development OP. Spatial planning is a crucial instrument for the implementation of spatial development policy, because the efficient use of financial resources can be guaranteed by properly elaborated regional plans. Further horizontal coordination and the encouragement of bottom up processes will be decisive elements of regional planning. (4) Source: (1) Horväth. G, 1998 , “Regional and cohesion policy in Hungary”, Pécs, Centre for Regional Studies; Hungary (2) Minisdtry of Foreing Affairs, Republic of Hungary, nationa policy, http://www.kulugyminiszterium.hu/kum/en/bal/foreign_policy/nation_policy_affairs/ (3) Office for National Development Plan, 2003, ”Hungarian National Development Plan 2004-2006” (4) http://www.terport.hu/doctar/terfejl/kiadvany/eng4.pdf

ESPON 1.1.3 – Annex report D 6
Republic of Latvia Latvia is a parliamentary democracy composed of 530 local governments (pašvaldĭba) and 26 districts (rajons). The Ministry Regional Development and Local Governments is responsible for regional plans (regional politics, spatial planning and habitation politics) and the Ministry of Environmental Protection and Regional Development is responsible for the national plan as well as methodological guidance, control and coordination of the physical planning process. The spatial planning system mainly is regulated by Spatial Planning Law (2002) , Regional Development Law (2002) and specific regulations of Cabinet of Ministers which are set for each of planning level. Other documents are Long-term Economic Strategy of Latvia and the National Development Plan. Latvia has 26 districts since 1960s and territorial planning has occurred at the national district and local level. As regards territorial organisation, Latvia reached an agreement with Eurostat on the NUTS classification: the whole country corresponds to NUTS I and NUTS II levels and is divided into five planning regions at NUTS III level. Latvia has a relatively weak urban structure whereby the urban population is primarily concentrated into a relatively small number of centres. Excluding the centres of national and regional importance there are very few centres with sufficient critical mass to be classed as urban. The spatial distribution of these centres also means that it will not be an easy task to develop and urban structure that is capable of driving the desired spatial development of the regions of Latvia. In some rural areas there is no nearby centre of regional importance (with sufficient critical mass). Cities are faced with rapid social polarization, growth of poverty and environmental degradation, they have higher than average concentrations of economic dependant people (depending on pensions, imbursements, subsidies) and the inequalities between cities have become more prominent causing a more uneven economic and social landscape. There are serious regional disparities in unemployment and income levels (between Riga and the other cities and within Riga itself) and the urban/rural gap is widening due to lack of new employment opportunities in the agricultural sector. The long-term vision for development will be carries out by a polycentric urban system to prevent further polarisation. A polycentric urban system is a good answer to the needs for a more balanced development of Latvia and it could offer opportunities for collaboration between cities. The pattern of a polycentric Latvia is in the first place articulated through the Capital city of Riga and the centres of national and regional importance, most of all situated on infrastructural corridors. These cities form the urban network on the national level and they have enough critical mass (labour market, economic base, services,..) to concentrated further development. The urban strategy concept leads to the following core achievements for urban environments at the end of the period: 1.- Urban environments will be attractive business environments. Latvian cities will become entrepreneurial, productive and competitive urban economies. 2.- Urban environments will be the major providers of social (public) services to their inhabitants and the immediate surrounding (rural) populations. 3.-Urban environments will be ecologically sound and liveable environments. 4.-Latvian cities will have good governance. The above vision principles will be applied in all cities and towns in a differentiated way, taking into account size, scope and specialisations of each city and town. Source: (1) Ministry of Environment of the Republic of Latvia, 2002, “Strategy for Sustainable Development of Latvia”, Riga, Latvia, ISBN 9984-9575-4-3 (2) ”Urban Strategic Framework of Latvia” draft, Mr Vladislavs Bedinovs, contact ECP

ESPON 1.1.3 – Annex report D 7
Republic of Lithuania Lithuania is a parliamentary democracy composed of over 60 communes and 10 provinces (apskritis) Lithuania has three level of territorial organisation and administration: national, regional and local. The main document related to planning are the Law on Regional Development (2002) and Master Plan of Lithuania (2002), other related documents are Sustainable Development Strategy (2003), National Long-term Strategy Development, Long-term Economic Development Strategy (2002). On the national level responsible for territorial planning lies within the Ministry in Environment while county governments are responsible for planning and development of the county territory, supervision of planning activities of local governments as well as implementing national policies. Lithuania has a well-balanced network of human settlements. There is a large pool of skilled labour and many industrial enterprises starting in the earliest 1960s. The industrial development took place within a comprehensive national plan for the creation of polycentric system of human settlements based on traditional historical centres. Lithuania provides a good example of human settlements developed that resulted from distribution of different functions among urban centres. After 1991 the urban system changed as result of socio-economic situation, especially in rural areas. (1) Within the framework of agricultural programme measures for develop agro-tourism and promote small medium size enterprise rural area were proposed in 1995. Strategic goal of Lithuania’s regional policy until 2013 and national programs vision is to improve territorial social cohesion. The strategy suggests that 5 regional centres surrounded by the territories of low living standards, which, due to their economic potential may perform the functions of regional growth centres, namely Alytus, Marijampolė, Utena, Tauragė and Telšiai, with integrated surrounding territories would be developed by 2013. Next important step would be to prepare individual set of measures for every area of Lithuania - rural or urban areas, regional growth centres or socially-developing territories. Individualised measures that are being implemented by sectorial ministries should appear in the main document of national regional policy - National Programme for the reduction of socio-economic development imbalances among the regions (2). Another concern of Lithuania has been the implementation of strategies in a cross sectoral arena. The coherence (integration) principle has a significant importance. Therefore, are made in the strategies to close link and coordinate objectives, tasks and implementation measures of different sectors.(3) According to the Law of Territorial Planning and the Sustainable Development Strategy, Lithuania aims to have a balanced development in the territory and an economic development taking into account the environment, especially natural resources and energy issues related to production, business and housing.(3) The strategic geographical location of the country -bridge between western Europe, the Russian federation and the Baltic States- lifts up the importance of transport corridors and transit functions. The main strategic goal is integration into the European transport network and transport service market and also promotion of spatial cohesion around the Baltic Sea. High awareness of transport pollution is promoting new environmentally-friendly technologies to guarantee a successful economic development and integration.(3) Spatial planning policy within the umbrella of polycentric urban systems can accelerate the integration process and it can help to optimise some functions related with decentralising and deconcentrating functions and responsibilities. Additionally new local master plans should be develop for all cities and cope with land use (industries and housing) efficient services as well as to keep the cultural identity and provide job opportunities. Sources: (1) UN Economic Commission for Europe, ”Ch 4 Spatial Planning: Lithuania”, http://www.unece.org/env/epr/studies/lithuania/chapter04.pdf (2) Ministry of Interior Republic of Lithuania, Regional Policy Formation, http://www.vrm.lt/index.php?id=561&lang=2 (3) Government of Republic of Lithuania, 2003, ”The Lithuanian strategy for sustainable development”

ESPON 1.1.3 – Annex report D 8
Republic of Malta Malta is a Republic composed of communes and regions- 68 local authorities. Malta is one of the most densely populated countries in the world and demographic trends are assume to continue, that life expectancy will increase and a higher proportion over 60. On the other hand Malta can be describes as one of the smallest economies in the world but GDP per capita among the highest of developing countries. The island has a small domestic market and depends on foreign trade and tourism. The Development Planning Act (1992, 2001) Malta Environment and Planning Authority (MEPA) is legally obligated to review the structural plan and address new issues relevant within the period 2000-2020. The Structure Plan was drawn up in 1990 to provide strategic guidance on land issues. It contains 320 policies on settlements, the build environment, housing, social community facilities, commerce and industry, agriculture, minerals, tourism and recreations, transport, urban and rural conservation and public utilities. The first goal of the SP is to “encourage the further social and economic development of the Maltese Islands and to ensure as far as possible the sufficient land and support infrastructure are available to accommodate it”. The second goal is to “use land and buildings efficiently and consequently to channel development activity into existing and committed urban areas, particularly through a rehabilitation and upgrading existing fabric and infrastructure..”. The third goal is the environment. The implementation of the Structure Plan has continued within the context of economic and demographic growth. This growth has, in turn, led to general increase in awareness of the need to safeguard the environment. Nevertheless, the current Plan does not cover the needs of the island. The Review of the Plan (SPR) includes the revision of business and policy-making environments, trend and implication of land use. The main indicators of growth are population, dwellings and labour supply. The MEPA, Plan Making and Policy Department Unit and the Policy Coordination Team have on-going cooperation for consultation and revision of the Plan. Maltese economic continues growing accompanied with development pressure in many locations and in many sectors of the economy. To sustain the rate of economy growth the SP envisages an influx of foreign labour particularly to deal with skill shortages in certain sectors of the economy. Maltese Islands exhibits a relative high net migration balance resulting in a high demand of dwellings. The labour composition and structure has changed in the last decade, mostly concentrate in services follows by industry. According to the evaluation of different scenarios, the scenario of accelerating employment was closely meeting the desirable goals in the issues of economy, social, transport and environmental issues. It is expected that SPR set guidelines to distribute, multi-centred patter of employment growth and service provision. Most of the growth in employment provision will be directed towards designated regional centres and industrial zones. The rapid urban development has been inefficient regarding land use and the Maltese Islands have an agglomeration of urban fabric which concentrate round the harbour area. Rural areas are characterized by low population densities, agriculture activities and natural resources. Land fragmentation and uncontrolled construction has impacted negatively agricultural activities. Despite small distances the public transport is inefficient and deteriorated, parallel the dependence of cars increasing. A stronger coordination is considered between transport and land use has been the result of several studies. The Design and Policy Guidance has been under revision in 2005 as a tool for planners and architects. The MEPA and the Policy Coordination Team have on-going cooperation. Sources: Malta Environment and Planning Authority (MEPA), “Structure Plan Review - Monitoring Report”, 1990-95 – 1996-97, “Demography Topic Paper”, “Employment Topic Paper”, , “Housing Topic Paper”, “Social facilities and community Topic Paper”, “Transport Topic Paper”, “ Building and conservation Topic Paper” “Development Planning Act”

ESPON 1.1.3 – Annex report D 9
Republic of Poland Poland is an Republic composed of 2489 municipalities (gminly), 315 districts (poviats) and 16 regions The main document ”The Conceptual of National Spatial Development Policy” provides conceptual linkage for regional spatial development and state policies. At regional level the main documents are the Regional Plans and the Regional Development Strategy. At national level the National Development Plan (2003); the National Development Plan draws directly from a Strategy of Economic Development of Poland “Entrepreneurship - Development – Work” (adopted by the Council of Ministers on January 2002). The situation of planning has been under many changes in Poland. Since the re-organisation of administrative regions in 1999, from central-municipality pattern to national-regional-local planning has required multidisciplinary teams, coordinating actions and restructure responsibilities and duties. “The basic settlement structure in Poland is characterized by a moderate, polycentric concentration”. The country has a relatively low urbanisation degree dominated by no more than twenty cities, lack of metropolitan centres and rural population disperse in over 60000 localities. (1) The main goal for the whole country is “Exploiting the development opportunities of various regions and strengthening their competitiveness, retaining their cultural and natural diversity” (2)
Under the transformation process the industry, FDI and the development of SMEs has helped the regional performance but still counting with high unemployment. Poorly developed, obsolete, and lacking of capital infrastructure more and more is perceived as a barrier for the economy’s development and for regional development especially for the sparsely rural settlements where as much as 38% of the Poland’s population lives. Poor infrastructure also has influenced the competitive position when attracting new investments.
The National Development Plan in its objectives enhance the need for more infrastructure as a mean for strengthing competitiveness and job creation while the Regional Policy for spatial planning objective enhance to create conditions for socio-economic development of the country through shaping appropriate spatial infrastructure. The regional policy in the medium-term perspective will contribute to rapid economic growth, increase of economy competitiveness, new jobs creation and in the long-term perspective regional policy will contribute to creating competitive, polycentric spatial structure of Poland, support territorial integrity and cultural identity of the whole country and individual regions and create basis for ecologically determined sustainable development (2).
Although the goal of competitiveness and efficiency in production-industry and human capacities play an important role, “the modernization and extension of communication infrastructure network in several nearest years while concentrating measures on limited number of projects to guarantee the best multiplier effects for the development of the entire economy” moreover the “…development of polycentric city system of Poland. “ (1)
The future challenges in planning will be the mechanism for financing regional development measures and pursuing special agreements between actors, (public, private, academia and research). More efficient application of spatial planning tools for integration and to introduce new challenges from globalisation trends, market forces, development zones and transport corridors combined with natural and cultural heritage.
Source: (1) National Development Plan 2004-2006 (2) Ministry of Economic Affairs and labour Regional Policy Department, “National Strategy for Regional Development 2001-2006” http://www.nsrr.gov.pl/nsrd Poland 2025 – the Long-term Strategy for Sustainable Development (adopted by the Council of Ministers on 26 July 2000) Hansen, M. & Böhme, K., 2001, “Spatial Planning in The Baltic Sea Region”, Nordregio, Stockholm, Sweden

ESPON 1.1.3 – Annex report D 10
Republic of Slovenia Slovenia is an parliamentary democratic republic composed of more than 190 municipalities (obcine) The main nation spatial planning policy documents are Spatial Development Strategy of Slovenia, adopted by the Parliament in 2004, and Spatial Management Policy of the Republic of Slovenia, adopted by the Government in 2001. Together with the Economic Development of Slovenia they represent the umbrella document for guiding development and forms the basis for the harmonisation of sectoral policies. The Regional Conception of Spatial Development specifies the conceptual framework of spatial arrangements agreed between state and municipalities. At municipal level spatial planning documents shall be the Municipal Spatial development Strategy with the Conception of Urban Development and the Conception of Landscape Development and Protection, the Municipal Spatial Order and Detail Plans. In Slovenia, the notion of a "balanced and polycentric development" has a longer tradition than in European spatial documents, since it was already widely used in the 1970s, while in the European context, this term appeared for the first time only in the Leipzig document (1994). The objectives in polycentric development of network in cities, towns and other settlements are: to promote the development of urban centres with national and regional significance as the centres of regional territories: to encourage the functional and infrastructural integration cities, towns and settlements; to ensure the interconnections of urban settlements with their hinterlands through more efficient mobility supported by public transport. In addition to historic factors, spatial development was also defined by natural spatial characteristics favouring transport corridors. A characteristic of Slovenia is also the diversity of settlement structures with a large number of small settlements and numerous areas of dispersed settlements as well as comparatively high quality of living in a relative unpolluted environment.(2) Regional policies have achieved positive results and the level of economic development is steadily increasing specially for macroeconomic stability while business competitiveness has performed slowly regarding structural changes. (1) Priorities for the future are based on the continuous process of integration and they are focus mainly in planned policies for polycentric development of the network of cities and other settlements, prevent uncontrolled and dispersed buildings while taking care of rural areas, protecting the environment and preserving natural and cultural heritage. The trends in economic development, housing and infrastructure improvements will impact in the public private interest, which will need to develop appropriate procedures for coordination, a modern planning system as well as better administrative links between national and local level. This also is applied to develop further an appropriate framework for its transeuropean co-operation in the field of spatial planning. Some Regional Spatial Development Strategies are in preparation at the regional level (NUTS3) in Slovenia. New forms of municipal cooperation have been required to establish links between national and regional strategies as well as coordination with local spatial plans. This process in on going. Sources: (1) Institute of Macroeconomic Analysis and development, “Development Report 2005”. (2) Ministry of Environment, Spatial Planning and Energy, 2001, “Spatial Management Policy of the Republic of Slovenia” (3) Ministry of Environment, Spatial Planning and Energy, 2003, “Spatial Planning Act- Slovenia” (4) Ministry of Environment, Spatial Planning and Energy, 2004, “Spatial Development Strategy of Slovenia” (5) E-mail contact, Mr. Marko Peterlin, Ministry of the Environment and Spatial Planning, Directorate of Spatial Planning

ESPON 1.1.3 – Annex report D 11
Republic of Slovakia Slovakia is an parliamentary democracy Republic composed of 2891 municipalities (obec) and 8 regions (samospravne kraje) The Ministry of Construction and Regional Development is the central state administration body for regional development and regional policy (under which National Co-ordinating and Monitoring Committee and National Regional Development Agency). The authority for physical planning in the Slovak Republic is the Ministry of Environment. The strategy for territorial planning is processed by the Slovak Environmental Agency (SAŽP) and the Department of Spatial Planning (located at SAŽP headquarters in Banská Bystrica). Settlements do not form an uniform nor functional regions. The administrative levels are the regions, districts and municipalities. The process of state territorial and administrative division started in the 1990s but has been under continuous changes. The National Development Plan (NDP) identifies balanced regional development as one of its specific objectives. This objective is a reaction to the needs of the Slovak Republic to remove or reduce disparities in the levels of development for individual regions and support their long-term sustainable agricultural and social growth. The vision of the NDP is encouraging growth of poles within the regions of the country. Under this umbrella acts the Operation Programs Basic Infrastructure (OPBI) 2003. The intention of the OPBI is to implement development of the regions such that the balance and long-term regional development would be based on the existence of a polycentric network of centres and settlements. (3) In Slovakia’s conditions (size of territory, number of inhabitants, economic strength etc.) it is necessary to apply a decentralisation model in order to move towards the creation of effectively functioning and functional complex agglomerations – settlement hubs. Settlement hubs can fulfil the function of an accelerator for general development. The quality of business environment is still lagging behind and financial policies are constraining the further development of the SMEs. There still to do as to improve the efficiency at the primary and secondary sector, regional infrastructure as well as in the administrative level and coordination. The strategy set out in this Operational Programme is in keeping focus in particular, on the elimination of key structural disadvantages in centres of economic importance in the areas of transport (the territorial development regarding the transport is determinate by the Slovakia Spatial Development Perspective (KURS 2001) and deals among other with modernisation, multi-corridors, etc) and environment (nature and cultural heritage, biodiversity, etc.), and promotes a renewal and modernisation process at local level.(3) International links and near agglomeration of the surrounding territories have been a positive influence especially for cross-border labour market since the unemployment has remain high. It fell from 18.6% in 2002 to 17.7% in the first half of 2003. The 2003 report called for further efforts on employment policy to effectively implement the priorities identified in the Joint Assessment of Employment Priorities (JAP) more coherently and effectively. There is a deficiency in the housing market and a common agreement of skills' mismatch. It stressed that it was important to improve employment rates, in particular for women and older workers, and to address regional imbalances. The reform of the education and training systems, including the lifelong learning system, needed to be accelerated. In 2002 it was adopted the National Employment Action Plan for 2002 2003. The measures under the Plan are divided into four areas: improving employability; business development; supporting adaptability of companies and their employees; strengthening equal opportunity policies. Source: (1) Ministry Of Construction and Regional Development, ”Spatial Arrangement And Functional Use Of Territory”, http://www.build.gov.sk/index_en.php?sekcia=Docs/Nrp/nrp (2) “Institute of Slovak and World Economy of the Slovak Academy of Sciences, Bratislava”, Institute of Slovak and World Economy of the Slovak Academy of Sciences, Bratislava (3) Ministry Of Construction and Regional Development, 2003, “Operational Programme Basic Infrastructure” (4) Ministry Of Construction and Regional Development, 2003, “Slovakia Cohesion Fund Strategy 2004-2006”

ESPON 1.1.3 – Annex report D 12
Romania Romania is a Republic composed of 41 counties (judete), there are 263 towns, of which 80 are municipalities. The reform process in Romania has met two different moments. One was determined by the reforms of the previous system and featured the first years after 1989. The second was dealing with the implementation and strengthening of the macro-economic stability. The elaboration of studies and plans for the spatial planning of the national territory is part of the overall strategy for the development of the national economy. (2) The legal basis for physical planning of the national territory is contained in Law no.350/2001. The main strategy goals of the spatial development policy in Romania, elaborated by the Ministry of Public Works and Regional Planning together with the Urbanproject National Research-Development Institute. According to the Law 350/2001 regarding the Territorial and Urban Planning, the spatial administration of the country territory is compulsory, continuous and for a long term; the sections approved are the national plan, zonal territorial and country territorial planning plan (1). Additionally, according to the Spatial Plan for Territorial Management (PATN) the principles are a balanced socio-economic development, improve quality of life, responsibility for natural and built heritage and rational use of the territory. Under these documents infrastructure and towns network play an important role and therefore the local urban plans (General Urban Plan, Zonal Urban Plan). Villages and towns (administrative units) compose the counties; urban communes are spread relatively balanced influenced by geographical, economic and social factors. Rural and medium-size settlements appear as a continuous network, small-scale economy and the strength in the agricultural and industry sector define the development patterns (3). The network of human settlements have been restructuring and re-shaping by social and economic changes and today the challenges address the following priorities provided by Romania's National Programme for Spatial Development (NPSD) (4): • To increase the polycentric character of the network of cities by reducing the disparities between the capital-city Bucharest, on the one hand, and the other towns and municipalities, on the other hand; • To enhance the role of small- and medium-size towns in their surrounding area, with a view to disseminating higher quality social and communal services in the territory; • To arrest further decline of living conditions in rural areas and to set a positive course for economic and social development, through better infrastructure and public services. Regulatory instruments are strongly integrated into Romanian spatial planning systems but in practice they constitute separate pieces of legislation. Related national plans and programs have also highlighting the need for a more coordinate policy to address spatial and planning issues such as integration with National Strategies, National Action Plan, Environmental Action Plan, etc. For example, the coordination with Medium-term Economic Strategy contains a paragraph on territorial planning and regional development and gives more importance to (PATN); the document summarizes the strategic objectives promoting macro-economic framework will help Romania strengthen legal certainty, international credibility, and improve the overall economic situation of the country (promoting market economy mechanisms providing opportunities, etc.), thereby increasing the confidence of financial markets and investors both at home and abroad. Thus, the main challenge is to draw a legislative framework that reconciliates fragmented regulations. At he same time there is a need to address financial market and control mechanisms to deal with regional policy and coordination with structural instruments. Sources: (1) Bodnaras, D., 2003,”Towards sustainable urban planning and transport in Romania”, Ministry of Transport, Construction and Tourism, General Division for Urban and Territorial Planning (2) Dorottya Pantea, 2000, “Spatial Planning In Romania And The Bucharest 2000 International Competition”, The Urbanproject National Research-Development Institute (3), EU Commission , Regional Policy, 2000, ”The Danube Space Study (July 2000)” http://europa.eu.int/comm/regional_policy/sources/docgener/studies/danube_en.htm (4) Statement By Mrs. Ileana Tureanu, State Secretary Ministry Of Public Works, Transport And Housing Of Romania, 2001