113-31: summary tables task in sas® enterprise guide®: proc … · 2006-03-01 · paper 113-31 1...
TRANSCRIPT
Paper 113-31
1
Summary Tables Task in SAS® Enterprise Guide® PROC TABULATE Made Easy
Susan J. Slaughter, Avocet Solutions, Davis, CA Lora D. Delwiche, University of California, Davis, CA
ABSTRACT This paper shows, step-by-step, how to use the Summary Tables task in SAS Enterprise Guide to produce polished reports. Summary Tables is based on the TABLULATE procedure, but you don’t need to know PROC TABULATE or even how to write SAS programs to use this feature. Whether you are a seasoned SAS programmer or new to SAS, Summary Tables can make creating summary reports easier. This paper is similar to paper 144-31, but uses different examples. You may want to compare the two papers.
INTRODUCTION The Summary Tables task in SAS Enterprise Guide is a point-and-click interface to the powerful TABULATE procedure. PROC TABULATE creates complex and attractive reports, but writing PROC TABULATE code can take extensive trial and error. However, with SAS Enterprise Guide you can easily arrange and rearrange your report to see how it will look before you even run it. You can also change titles, headers, fonts, colors, and data formats. In fact, practically any feature you can set in PROC TABULATE code in SAS you can change interactively in Summary Tables. Summary Tables is faster, easier, and saves you from having to figure out where to put all those asterisks and parentheses. Once you've perfected your table in SAS Enterprise Guide, you can, if you wish, save the code and run it from the SAS System. This paper was written using SAS Enterprise Guide 3. If you are using SAS Enterprise Guide 2 or 4 you will see big differences in the Project and Process Flow windows, but only slight differences in the Summary Tables task.
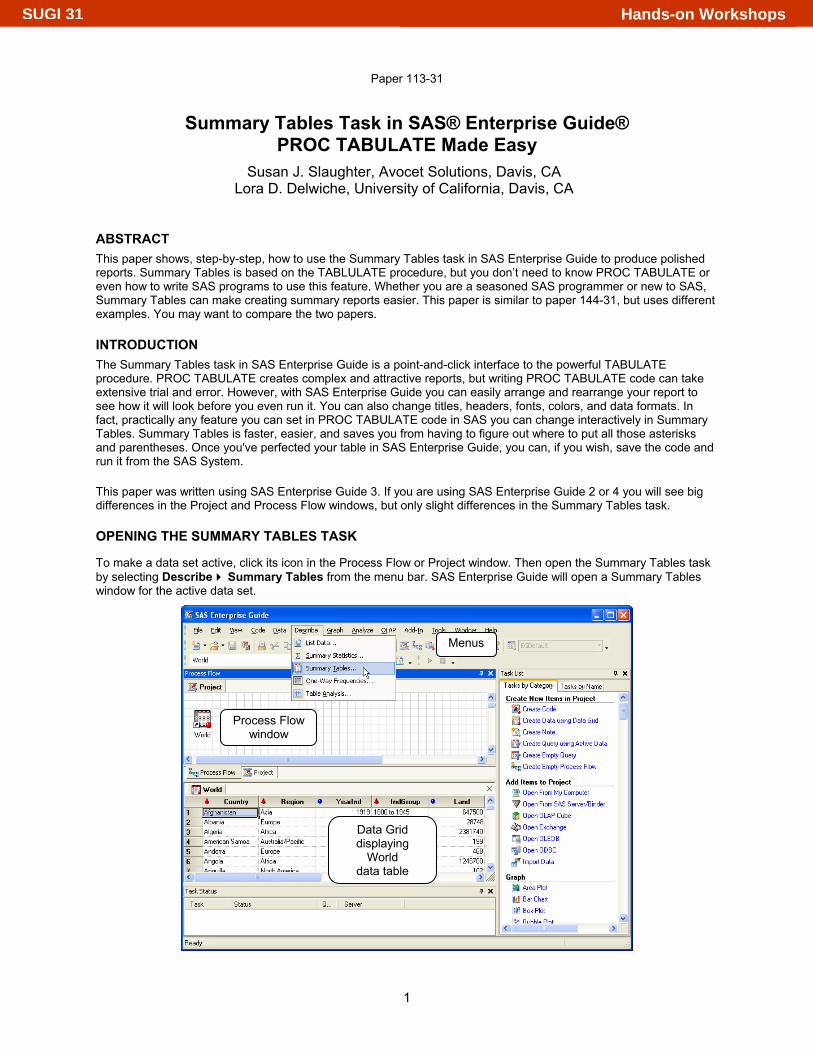
OPENING THE SUMMARY TABLES TASK
To make a data set active, click its icon in the Process Flow or Project window. Then open the Summary Tables task by selecting Describe Summary Tables from the menu bar. SAS Enterprise Guide will open a Summary Tables window for the active data set.
Menus
Process Flow window
Data Grid displaying
World data table
Hands-on WorkshopsSUGI 31
2
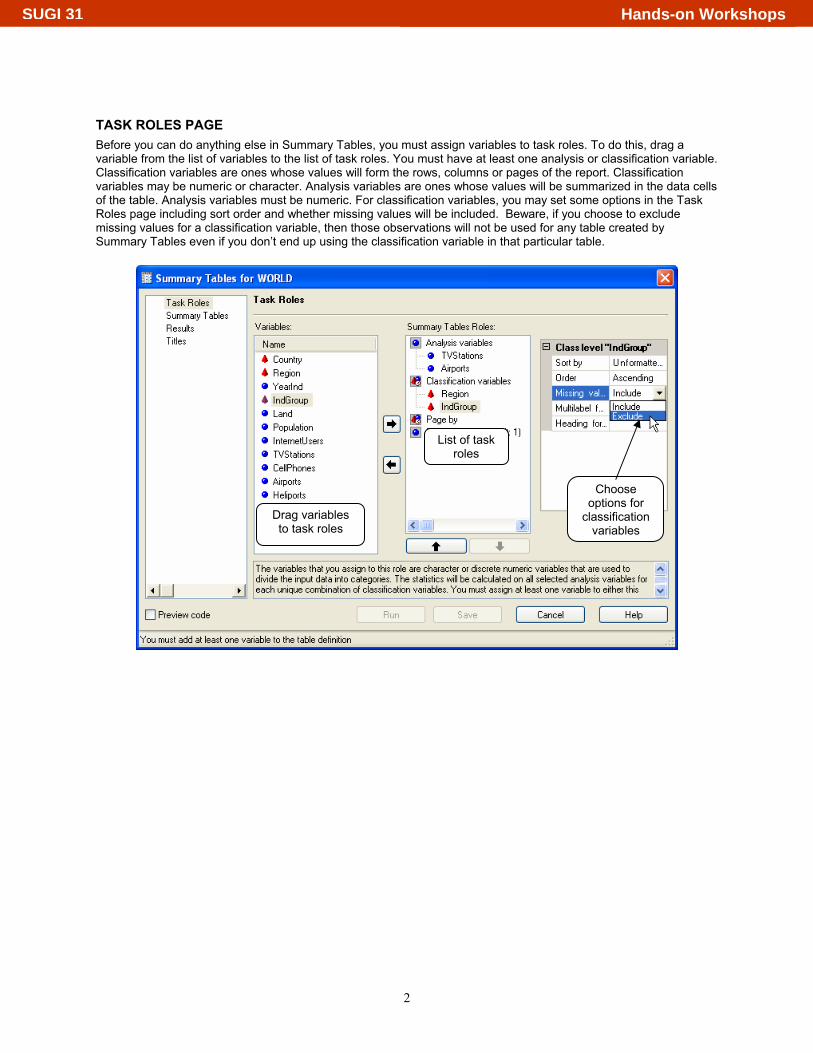
TASK ROLES PAGE Before you can do anything else in Summary Tables, you must assign variables to task roles. To do this, drag a variable from the list of variables to the list of task roles. You must have at least one analysis or classification variable. Classification variables are ones whose values will form the rows, columns or pages of the report. Classification variables may be numeric or character. Analysis variables are ones whose values will be summarized in the data cells of the table. Analysis variables must be numeric. For classification variables, you may set some options in the Task Roles page including sort order and whether missing values will be included. Beware, if you choose to exclude missing values for a classification variable, then those observations will not be used for any table created by Summary Tables even if you don’t end up using the classification variable in that particular table.
Drag variables to task roles
List of task roles
Choose options for
classification variables
Hands-on WorkshopsSUGI 31
3
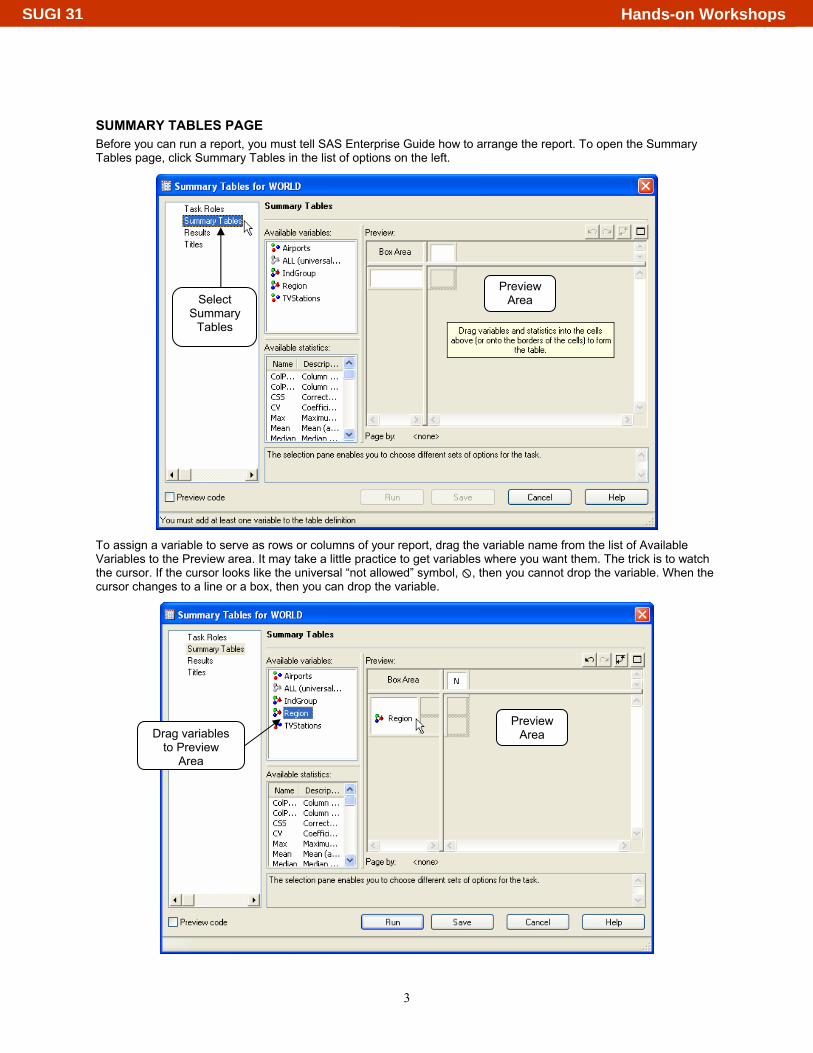
SUMMARY TABLES PAGE Before you can run a report, you must tell SAS Enterprise Guide how to arrange the report. To open the Summary Tables page, click Summary Tables in the list of options on the left.
To assign a variable to serve as rows or columns of your report, drag the variable name from the list of Available Variables to the Preview area. It may take a little practice to get variables where you want them. The trick is to watch the cursor. If the cursor looks like the universal “not allowed” symbol, , then you cannot drop the variable. When the cursor changes to a line or a box, then you can drop the variable.
Select Summary
Tables
Preview Area
Preview Area Drag variables
to Preview Area
Hands-on WorkshopsSUGI 31
4
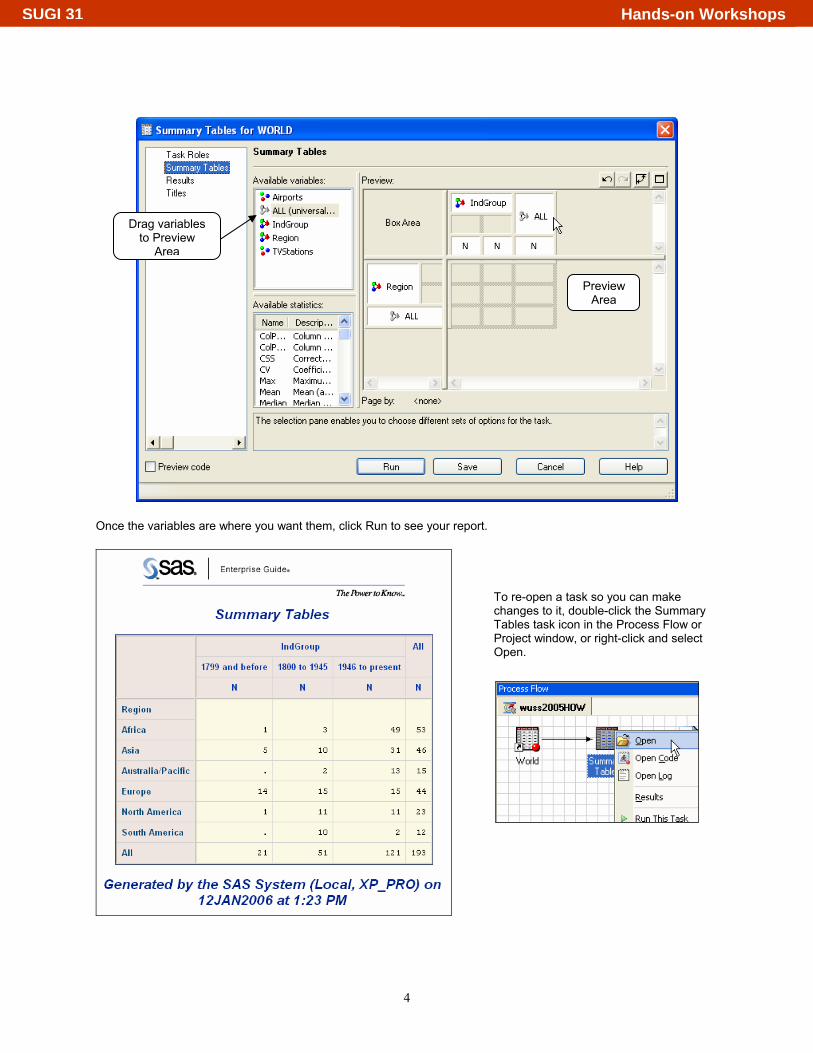
Once the variables are where you want them, click Run to see your report.
To re-open a task so you can make changes to it, double-click the Summary Tables task icon in the Process Flow or Project window, or right-click and select Open.
Drag variables to Preview
Area
Preview Area
Hands-on WorkshopsSUGI 31
5
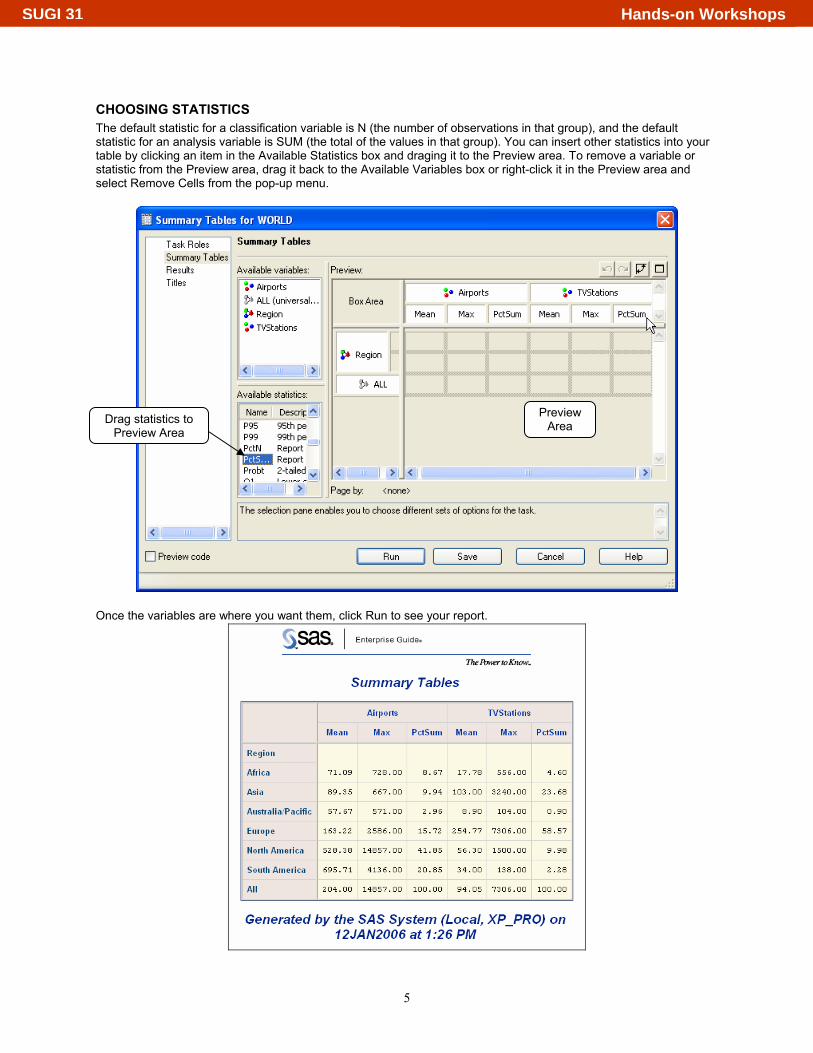
CHOOSING STATISTICS The default statistic for a classification variable is N (the number of observations in that group), and the default statistic for an analysis variable is SUM (the total of the values in that group). You can insert other statistics into your table by clicking an item in the Available Statistics box and draging it to the Preview area. To remove a variable or statistic from the Preview area, drag it back to the Available Variables box or right-click it in the Preview area and select Remove Cells from the pop-up menu.
Once the variables are where you want them, click Run to see your report.
Drag statistics to Preview Area
Preview Area
Hands-on WorkshopsSUGI 31
6
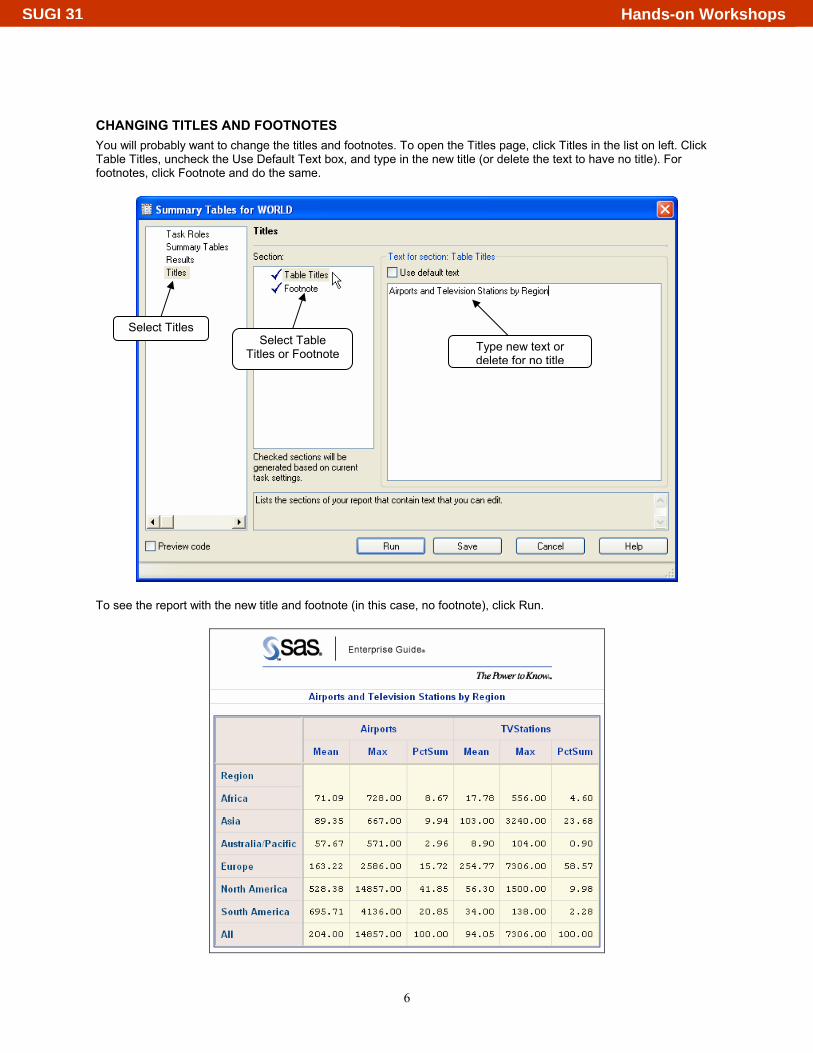
CHANGING TITLES AND FOOTNOTES You will probably want to change the titles and footnotes. To open the Titles page, click Titles in the list on left. Click Table Titles, uncheck the Use Default Text box, and type in the new title (or delete the text to have no title). For footnotes, click Footnote and do the same.
To see the report with the new title and footnote (in this case, no footnote), click Run.
Select Titles Select Table
Titles or Footnote Type new text or delete for no title
Hands-on WorkshopsSUGI 31
7
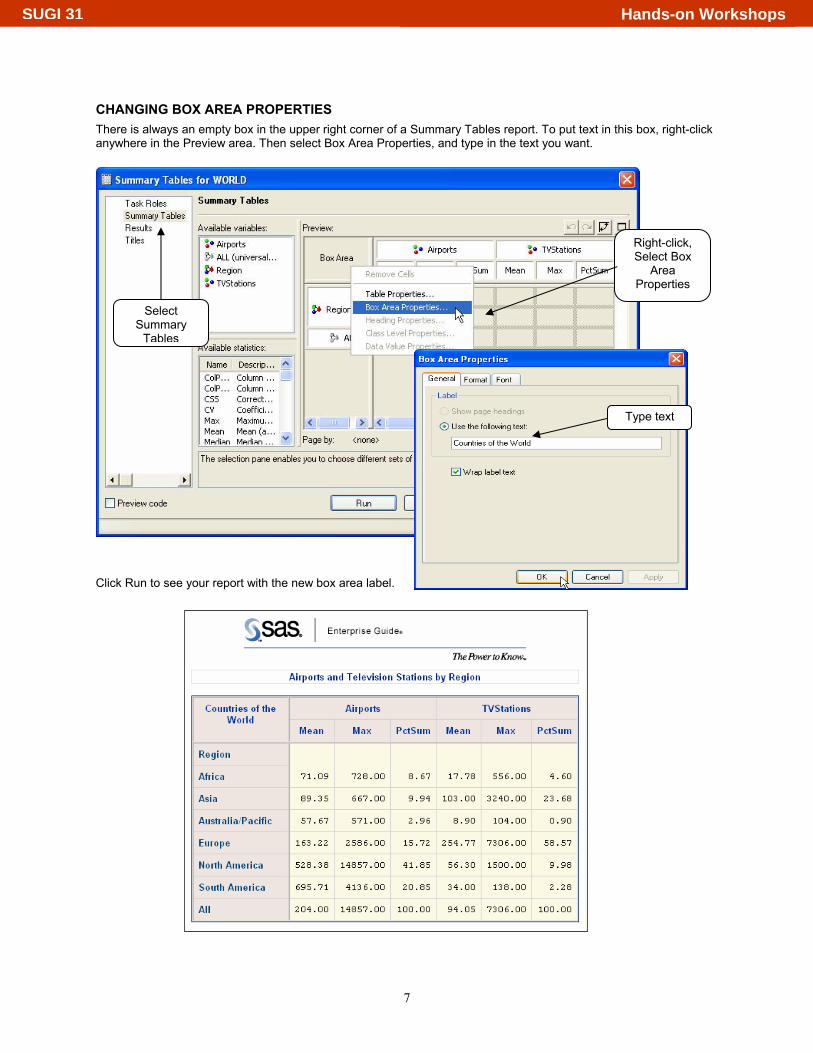
CHANGING BOX AREA PROPERTIES There is always an empty box in the upper right corner of a Summary Tables report. To put text in this box, right-click anywhere in the Preview area. Then select Box Area Properties, and type in the text you want. Click Run to see your report with the new box area label.
Select Summary
Tables
Type text
Right-click, Select Box
Area Properties
Hands-on WorkshopsSUGI 31
8
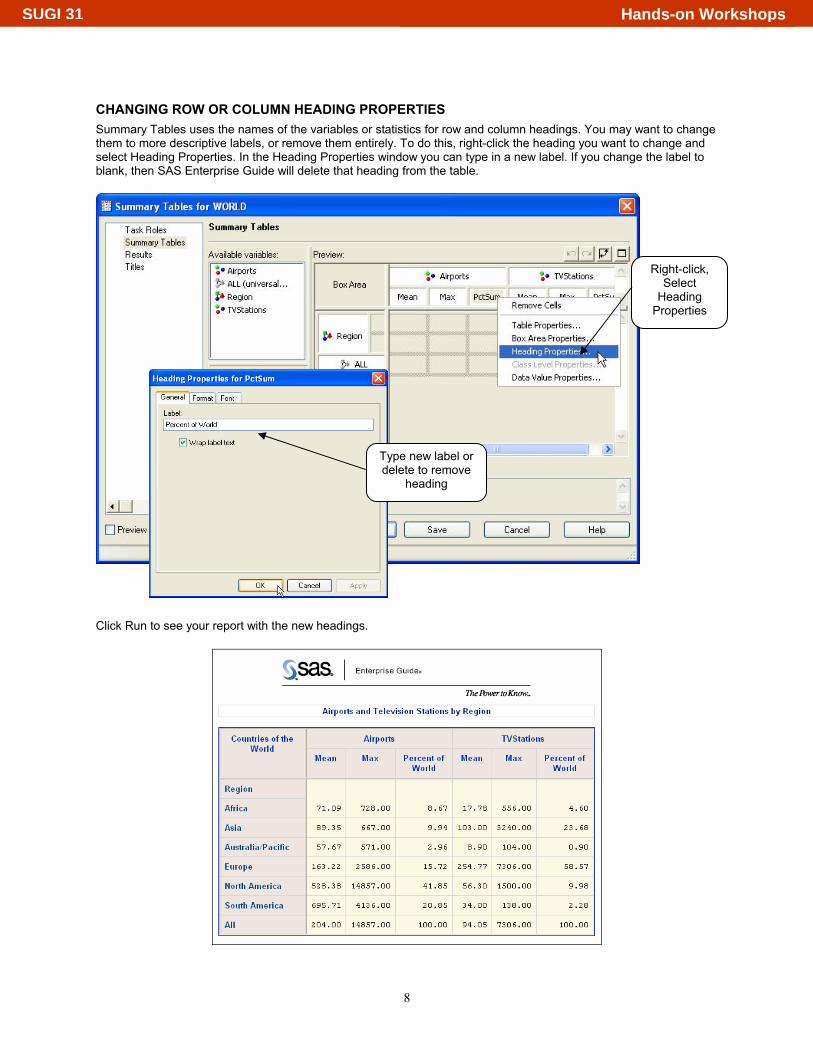
CHANGING ROW OR COLUMN HEADING PROPERTIES Summary Tables uses the names of the variables or statistics for row and column headings. You may want to change them to more descriptive labels, or remove them entirely. To do this, right-click the heading you want to change and select Heading Properties. In the Heading Properties window you can type in a new label. If you change the label to blank, then SAS Enterprise Guide will delete that heading from the table. Click Run to see your report with the new headings.
Right-click, Select
Heading Properties
Type new label or delete to remove
heading
Hands-on WorkshopsSUGI 31
9
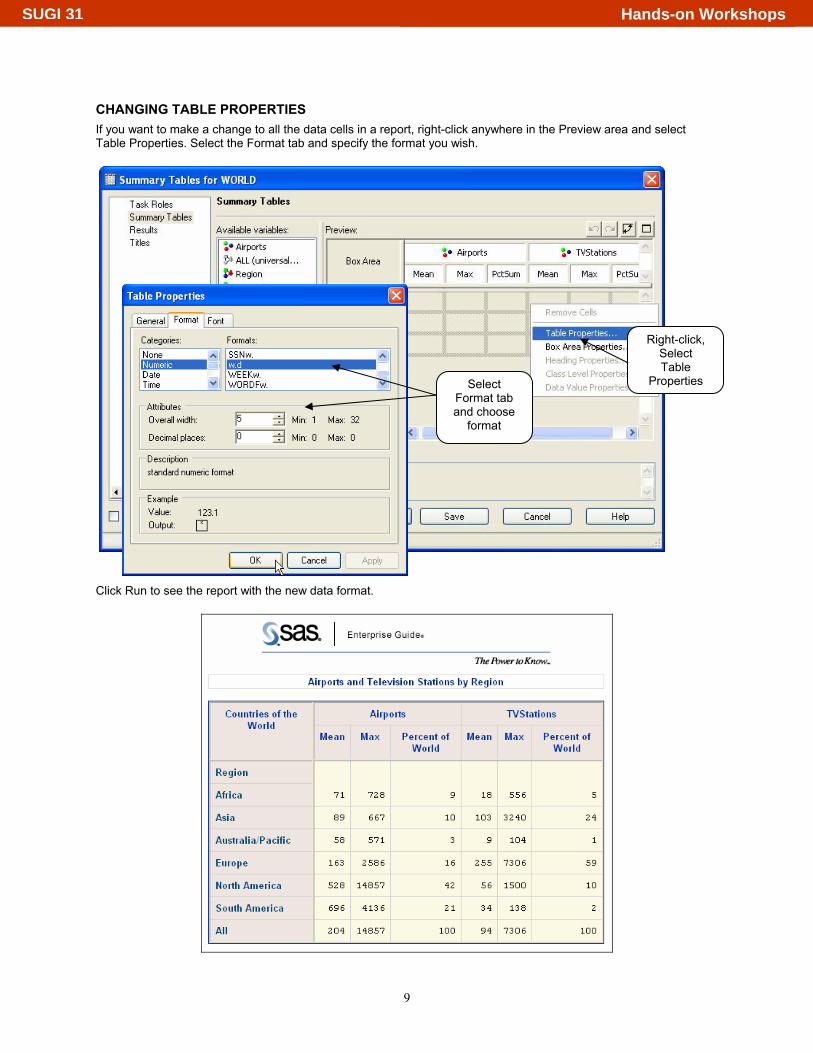
CHANGING TABLE PROPERTIES If you want to make a change to all the data cells in a report, right-click anywhere in the Preview area and select Table Properties. Select the Format tab and specify the format you wish.
Click Run to see the report with the new data format.
Right-click, Select Table
Properties Select Format tab and choose
format
Hands-on WorkshopsSUGI 31
10
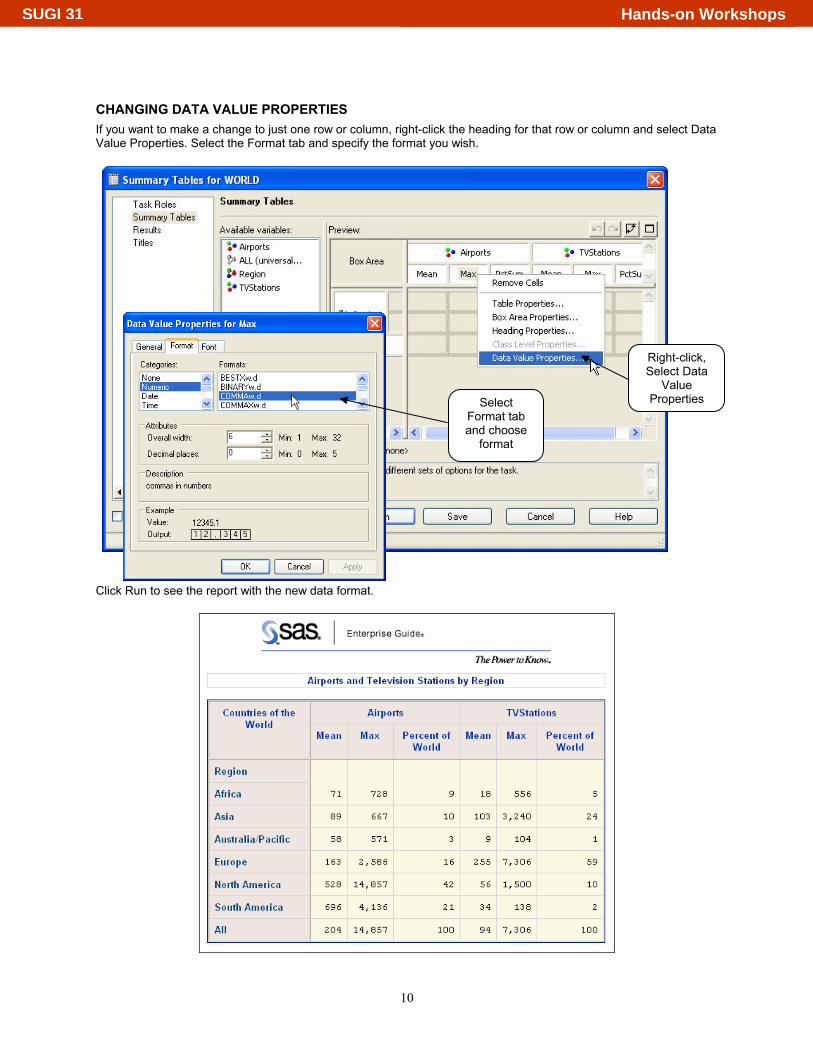
CHANGING DATA VALUE PROPERTIES If you want to make a change to just one row or column, right-click the heading for that row or column and select Data Value Properties. Select the Format tab and specify the format you wish.
Click Run to see the report with the new data format.
Right-click, Select Data
Value Properties Select
Format tab and choose
format
Hands-on WorkshopsSUGI 31
11
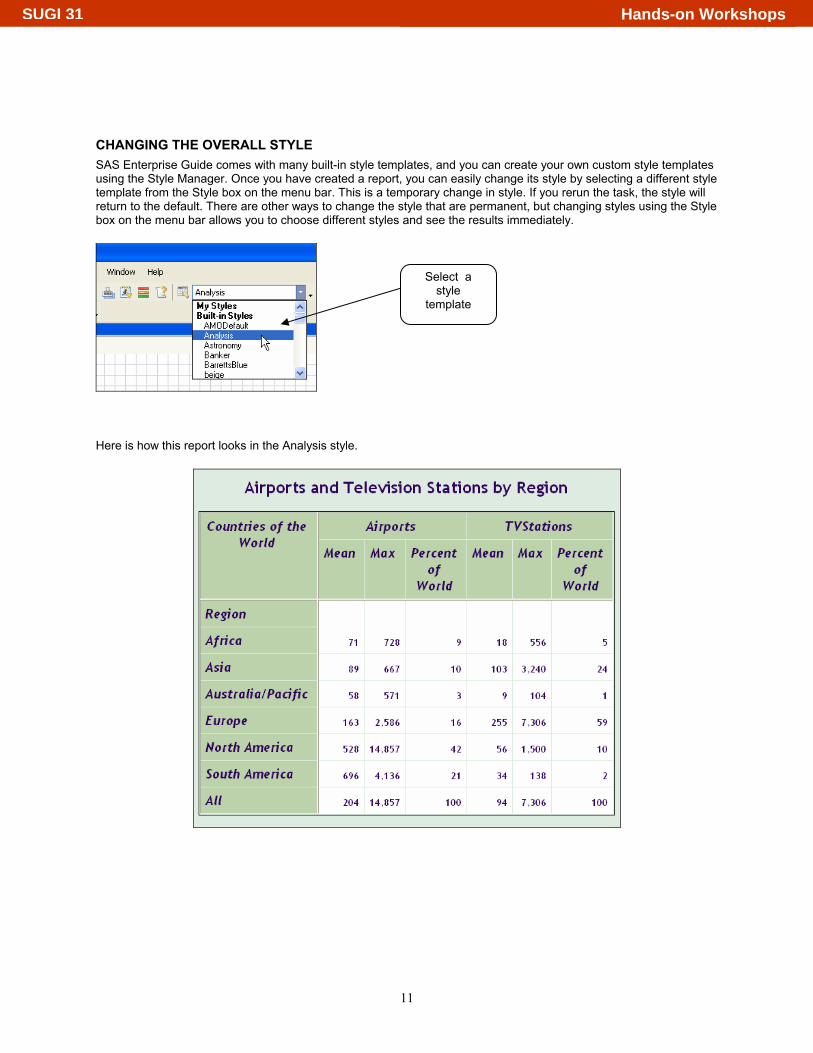
CHANGING THE OVERALL STYLE SAS Enterprise Guide comes with many built-in style templates, and you can create your own custom style templates using the Style Manager. Once you have created a report, you can easily change its style by selecting a different style template from the Style box on the menu bar. This is a temporary change in style. If you rerun the task, the style will return to the default. There are other ways to change the style that are permanent, but changing styles using the Style box on the menu bar allows you to choose different styles and see the results immediately.
Here is how this report looks in the Analysis style.
Select a style
template
Hands-on WorkshopsSUGI 31
12
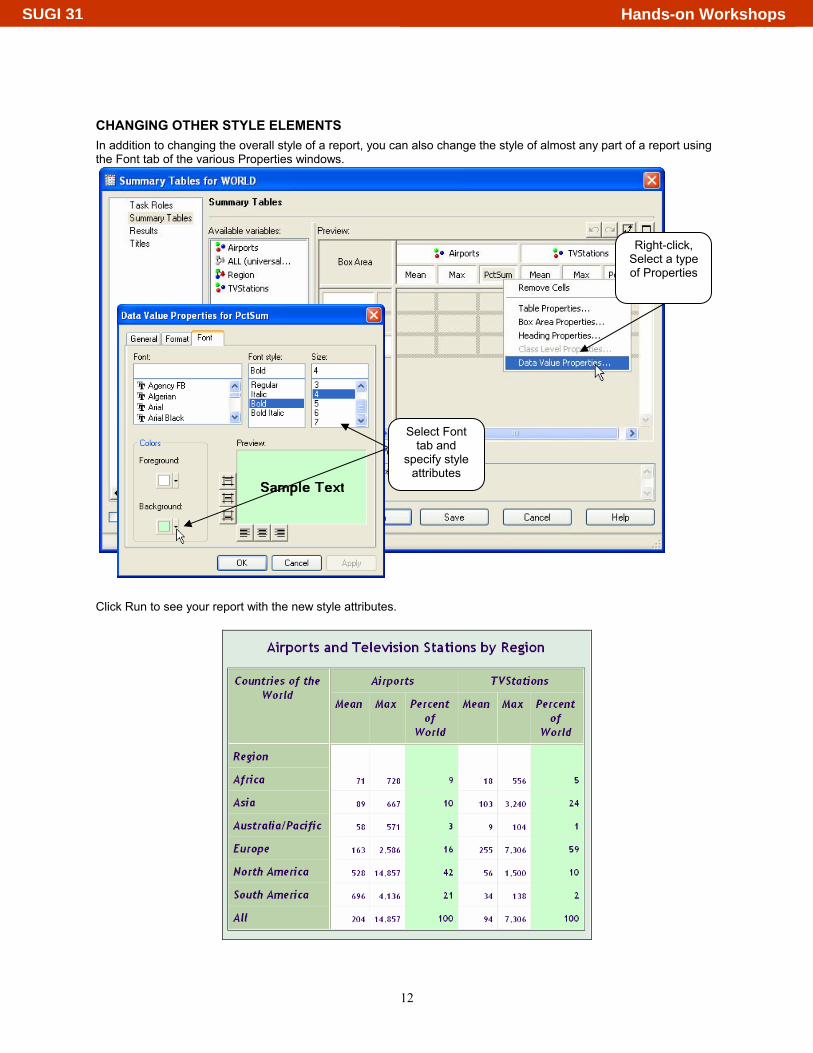
CHANGING OTHER STYLE ELEMENTS In addition to changing the overall style of a report, you can also change the style of almost any part of a report using the Font tab of the various Properties windows.
Click Run to see your report with the new style attributes.
Right-click, Select a type of Properties
Select Font tab and
specify style attributes
Hands-on WorkshopsSUGI 31
13
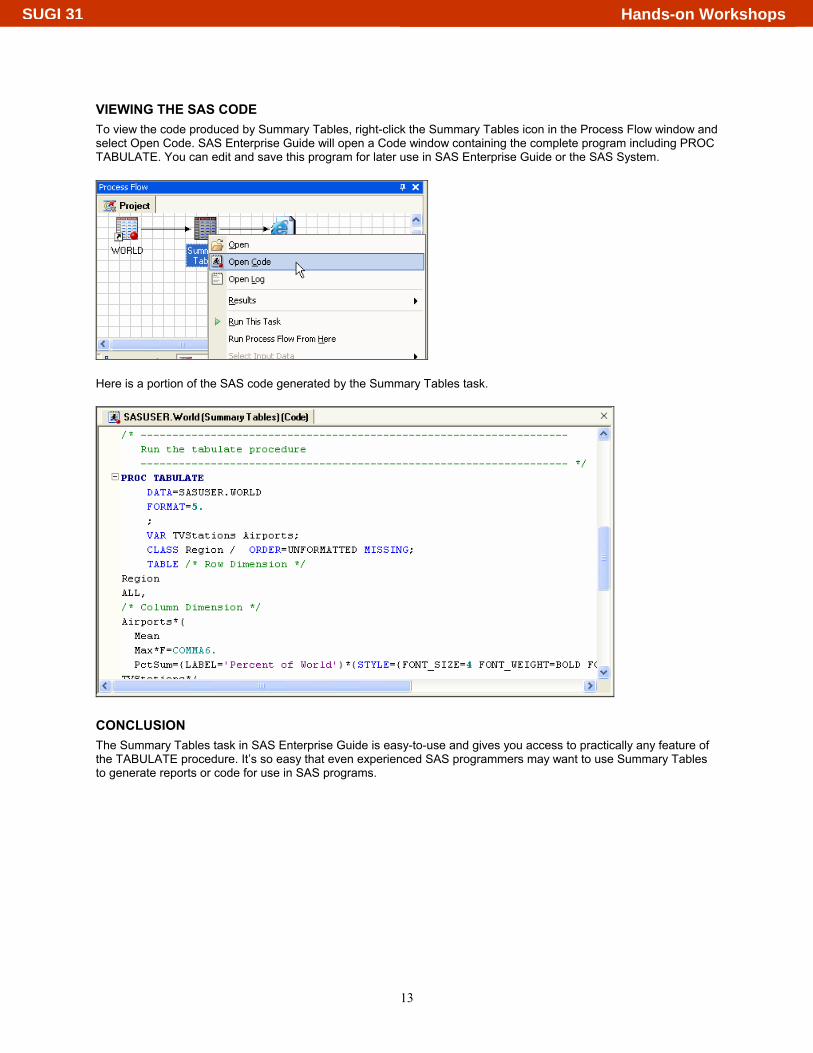
VIEWING THE SAS CODE To view the code produced by Summary Tables, right-click the Summary Tables icon in the Process Flow window and select Open Code. SAS Enterprise Guide will open a Code window containing the complete program including PROC TABULATE. You can edit and save this program for later use in SAS Enterprise Guide or the SAS System.
Here is a portion of the SAS code generated by the Summary Tables task.
CONCLUSION The Summary Tables task in SAS Enterprise Guide is easy-to-use and gives you access to practically any feature of the TABULATE procedure. It’s so easy that even experienced SAS programmers may want to use Summary Tables to generate reports or code for use in SAS programs.
Hands-on WorkshopsSUGI 31
14
REFERENCES Central Intelligence Agency (2005). “The World Factbook.” http://www.cia.gov/cia/publications/factbook/index.html.
Slaughter, Susan J. and Lora D. Delwiche (2005). The Little SAS Book for Enterprise Guide 3.0. SAS Institute, Cary, NC.
ABOUT THE AUTHORS Susan Slaughter and Lora Delwiche are the authors of The Little SAS Book: A Primer published by SAS Institute, and recently finished writing The Little SAS Book for Enterprise Guide 3.0. They expect their next book, The Little SAS Book for Enterprise Guide 4, to be available later in 2006. They may be contacted at:
Susan J. Slaughter (530)756-8434 [email protected] Lora D. Delwiche (530) 752-9321 [email protected]
SAS and all other SAS Institute Inc. product or service names are registered trademarks or trademarks of SAS Institute Inc. in the USA and other countries. ® indicates USA registration. Other brand and product names are trademarks of their respective companies.
Hands-on WorkshopsSUGI 31