11.1 introduction 11.2 consumer market profile - urban landmark · 2013-03-05 · 11.1 introduction...
TRANSCRIPT

Impact of Township Shopping Centres – July, 2010
253
CHAPTER ELEVEN: IN-DEPTH CASE STUDY ANALYSIS – NKOWANKOWA
11.1 INTRODUCTION As part of the market research a case study was also carried out in an area where no formal retail centres exist. The area selected for this purpose was NkowaNkowa in Limpopo. Household surveys were conducted in the area to determine the impact that the absence of formal retail centres in the area has on the local community and economy. 11.2 CONSUMER MARKET PROFILE In order to study the consumer market profile of the area, a 10km trade area was delineated – Refer to Map 11.1. Subsequent paragraphs highlight the dominant characteristics of the primary trade area population, in terms of: Population size; Racial profile; Age profile; Level of education; Employment status; Occupation profile and manner of employment; Average annual household income; Mode of transport; Dwelling type. Table 11.1: Consumer Market Profile, 2010 Estimates
Variable Primary Source Market Characteristics
Number of people 124 819
Number of households 40 219
Household size 4.2
Household density 381.9 households/km2
Racial distribution African blacks: 97.4% White: 2.2% Coloureds: 0.4% Indian Asians: 0.1%
Age profile 0-14: 30.7% 15-19: 10.5% 21-35: 28.5% 36-65: 26.8% 65+: 3.5%
Educational attendance (aged 5 to 24 years) School: 66.0% None: 30.3% Pre-school: 2.2% Other: 1.5%
Highest level of education (aged 20 and older)
Higher: 8.0% Grade 12: 15.1% Some secondary: 25.7% Some primary and primary: 22.4% None: 28.8%
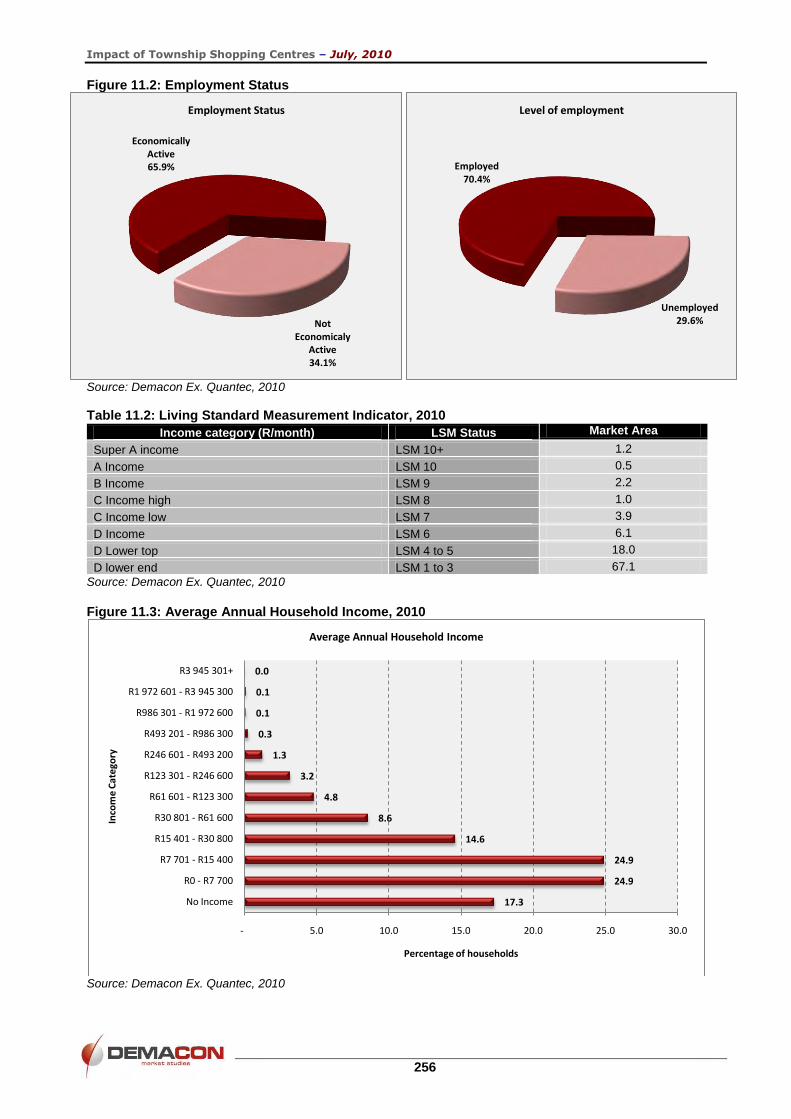
Level of employment EAP: 65.9% Employed: 70.4% Unemployed: 29.6%
Manner of employment Paid employees: 91.5%
Self-employed: 3.6%
Family worker: 1.0%
Employer: 3.8%

Impact of Township Shopping Centres – July, 2010
254
Variable Primary Source Market Characteristics
Occupation profile Elementary occupations: 47.0%
Skilled agriculture workers: 9.5%
Craft and related trade: 9.5%
Plant and machine operators and assemblers: 8.0%
Technicians and associate professionals: 7.1%
Service workers: 7.0%
Clerks: 6.7%
Professionals: 3.5%
Legislators, senior officials and managers:1.8%
Weighted average household income93
Total market earning an income: R40 723.8/annum R3 393.7/month
LSM 4 to 10+:
R90 723.5/annum R7 560.3/month
LSM profile LSM 1-3: 67.1% LSM 4-10+: 32.9%
Mode of transport On foot: 75.3% Private vehicle: 10.3% Mini-bus: 8.0% Bus: 4.1%
Dwelling type House on separate stand: 50.1% Living quarters and other: 25.6% Traditional dwellings: 14.9% Informal dwelling on separate stands: 4.9% Informal dwellings in backyard: 1.4%
Source: Demacon Ex. Quantec, 2010
Subsequent figures highlight some of the salient features of the consumer market. Figure 11.1: Age Profile of Consumer Market
Source: Demacon, 2010
93
Note: Weighted average is an average of multiple values produced by assigning a weight to each value, multiplying each value by its weight, and then adding the results.
9.6
10.2
10.8
10.5
10.0
9.9
8.7
7.9
6.1
4.8
3.6
2.5
1.9
1.2
1.0
0.6
0.4
0.3
- 2.0 4.0 6.0 8.0 10.0 12.0
Ages: 00-04
Ages: 05-09
Ages: 10-14
Ages: 15-19
Ages: 20-24
Ages: 25-29
Ages: 30-34
Ages: 35-39
Ages: 40-44
Ages: 45-49
Ages: 50-54
Ages: 55-59
Ages: 60-64
Ages: 65-69
Ages: 70-74
Ages: 75-79
Ages: 80-84
Ages: 85+
Percentage of population (%)
Age
cat
ego
rie
s
Age Profile

Impact of Township Shopping Centres – July, 2010
255
Map 11.1: Primary Trade Area - 10km Radius
Impact of Township Shopping Centres – July, 2010
256
Figure 11.2: Employment Status
Source: Demacon Ex. Quantec, 2010
Table 11.2: Living Standard Measurement Indicator, 2010
Income category (R/month) LSM Status Market Area
Super A income LSM 10+ 1.2
A Income LSM 10 0.5
B Income LSM 9 2.2
C Income high LSM 8 1.0
C Income low LSM 7 3.9
D Income LSM 6 6.1
D Lower top LSM 4 to 5 18.0
D lower end LSM 1 to 3 67.1
Source: Demacon Ex. Quantec, 2010
Figure 11.3: Average Annual Household Income, 2010
Source: Demacon Ex. Quantec, 2010
17.3
24.9
24.9
14.6
8.6
4.8
3.2
1.3
0.3
0.1
0.1
0.0
- 5.0 10.0 15.0 20.0 25.0 30.0
No Income
R0 - R7 700
R7 701 - R15 400
R15 401 - R30 800
R30 801 - R61 600
R61 601 - R123 300
R123 301 - R246 600
R246 601 - R493 200
R493 201 - R986 300
R986 301 - R1 972 600
R1 972 601 - R3 945 300
R3 945 301+
Percentage of households
Inco
me
Cat
ego
ry
Average Annual Household Income
Economically Active65.9%
Not Economicaly
Active34.1%
Employment Status
Employed70.4%
Unemployed29.6%
Level of employment

Impact of Township Shopping Centres – July, 2010
257
Overall the primary consumer market profile reveals the following pertinent characteristics:
At least 40 219 households (2010);
Largely an African black consumer market;
Relatively large segment of young and upcoming market segment, supported by a more
mature adult segment and a relatively large youth component;
Consumer market characterised by low levels of education;
Relatively large economically active market segment, characterised by high levels of
employment – reflecting moderate dependency ratios;
Occupation profile reflects a dominance of blue collar occupations – reflecting a middle
income consumer market characterised by pockets of wealth and poverty;
Weighted average monthly household income of target market (LSM 4 to 10+)
approximately R7 560.3 (2010);
Low to moderate living standard levels – LSM 1 to 3 (67.1%); LSM 4 to 10+ (32.9%);
A number of factors contribute to the general property development climate in a specific
geographical area. The socio-economic factors that provide an initial indication of market
potential are levels of education, level of employment, income and standards of living.
These factors combined reflect a consumer market with a demand predominantly focused
towards the lower to middle spectrum of commercial products and services.
11.3 RETAIL SUPPLY WITHIN THE LARGER REGION Map 11.2 indicates the location of retail centres within the larger region. It is evident that six retail centres are located within 20km from NkowaNkowa – largely concentrated in Tzaneen. Table 11.3: Retail Supply Within 20km from NkowaNkowa
Centre Location Size
(m2GLA)
Classification Developed Shops Anchors
Tzaneng Mall Tzaneen 39 000 Minor regional 1990 92 Pick „n Pay Super, Woolworths, Game
Maake Plaza Tzaneen 15 855 Community 2008 40 Shoprite
Tzaneen Crossing
Tzaneen 10 390 Neighbourhood 1989 32
Shoprite, Identity, FNB, Ackermans
Boxer Centre Tzaneen 5 094 Neighbourhood 1988 10 Boxer Cash „n Carry
Checkers Centre
Tzaneen 5 055 Neighbourhood Checkers
Oasis Mall Tzaneen
3 471 Local convenience
1990 13 Spar
Total 78 865
Source: Demacon Ex. SACSC, 2010
Closest retail supply is within 20km of NkowaNkowa – constituting approximately 78 865m2
retail GLA.
Sizes of the centres vary between 3 471m2 retail GLA and 39 000m2 retail GLA.
These consist of one minor regional centre, a community centre, three neighbourhood
centres and a local convenience centre.
Only one centre was developed post 2000.
Anchors include Pick „n Pay, Woolworths, Game, Shoprite, Identity, FNB, Ackermans,
Boxer, Spar.

Impact of Township Shopping Centres – July, 2010
258
Map 11.2: Retail Supply in Proximity to NkowaNkowa
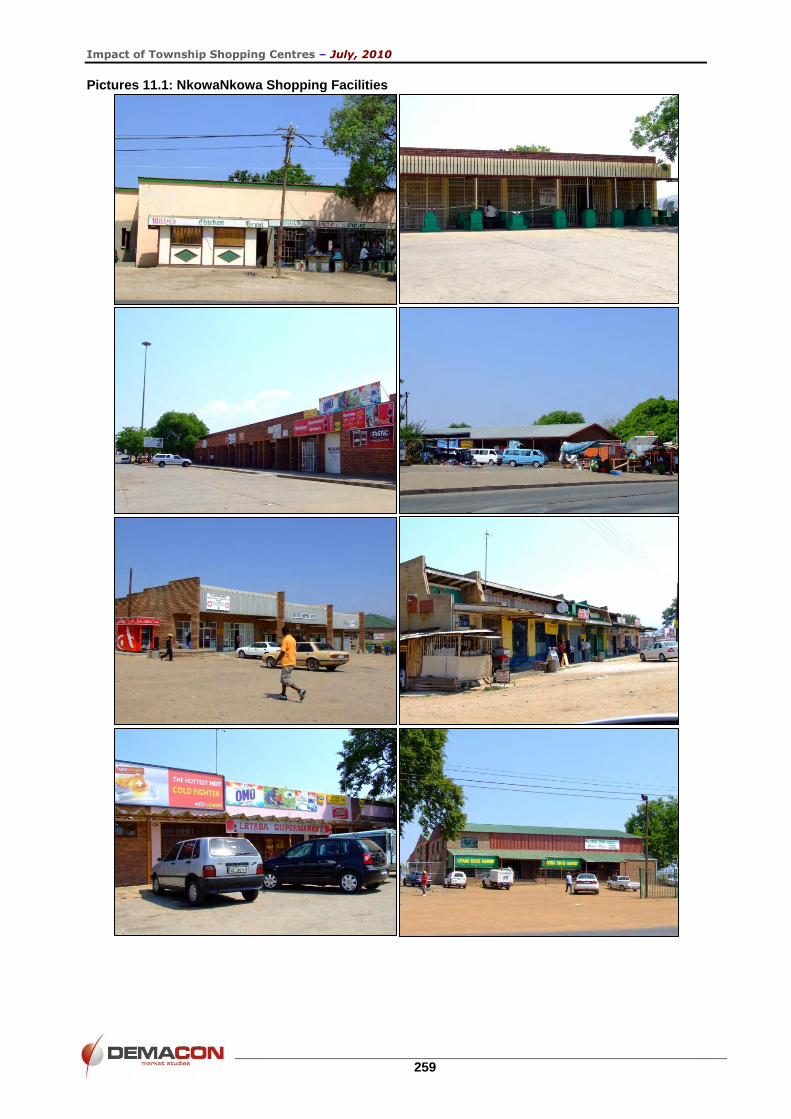
Subsequent pictures provide a visual illustration of shopping facilities within NkowaNkowa. In order to study the current consumer behaviour of the local community and to identify the potential impact that a formal retail centre could have on NkowaNkowa, proportionally stratified household surveys were conducted within the 10km radius. Subsequent paragraphs highlight the findings of these surveys.
Impact of Township Shopping Centres – July, 2010
259
Pictures 11.1: NkowaNkowa Shopping Facilities

Impact of Township Shopping Centres – July, 2010
260
11.4 CURRENT CONSUMER BEHAVIOUR AND DEMAND FOR FORMAL RETAIL FACILITIES AND ANTICIPATED IMPACT
11.4.1 HOUSEHOLD INFORMATION Subsequent paragraphs discuss household information disclosed by the respondents pertaining to the number of households on premises, average household size, current life stage, age profile of household members, the family member responsible for retail purchases, mode of transport, number of breadwinners and employment location. Figure 11.4: Number of Households on Premises
Source: Demacon Household Surveys, 2009
Figure 11.5: Average Household Size
Source: Demacon Household Surveys, 2009
Findings: (Figures 11.4 to 11.8) In general there is one household on the premises – 88.4%, followed by smaller segments
reflecting two to more households on the premises – 11.6%.
Households mostly consist of four or more members – 69.8%.
Dominant life stages include mature parents, couples, mature singles and golden
nests.
Age profile reflects a large young adult segment (32.0%), supported by a large mature adult
segment (27.1%), and moderate youth (20.5%) and child segment (20.5%).
88.4
2.9 - 1.4 1.4 5.8
-
10.0
20.0
30.0
40.0
50.0
60.0
70.0
80.0
90.0
100.0
One Two Three Four Five Five+
Pe
rce
nta
ge o
f H
ou
seh
old
s (%
)
Households
Households on Premises
7.5
11.3 11.3
24.5
15.1
30.2
-
5.0
10.0
15.0
20.0
25.0
30.0
35.0
One Two Three Four Five Five+
Pe
rce
nta
ge o
f H
ou
seh
old
s (%
)
Household Members
Household Size

Impact of Township Shopping Centres – July, 2010
261
The family member mainly responsible for conducting retail purchases is the mother
(54.1%), followed by the father (32.1%) and to a lesser extent the daughter or son.
Figure 11.6: Current Life Stage
Source: Demacon Household Surveys, 2009
Figure 11.7: Age Profile of Household Members
Source: Demacon Household Surveys, 2009
Figure 11.8: Family Member Predominantly Responsible for Retail Purchases
Source: Demacon Household Surveys, 2009
1.5 1.5
13.2 11.8
-2.9
63.2
5.9
--
10.0
20.0
30.0
40.0
50.0
60.0
70.0
Stay-at home singles
Starting out singles
Couples Mature singles
New Parents Single parents
Mature Parents
Golden Nests Left alones
Pe
rce
nta
ge o
f H
ou
seh
old
s (%
)
Life Stage
20.5 20.5
32.0
27.1
-
5.0
10.0
15.0
20.0
25.0
30.0
35.0
Children – (0-12) Teenagers and youth – (13 to 18)
Young Adults – (19 to 35) Mature Adults (36 years+)
Pe
rce
nta
ge o
f h
ou
seh
old
me
mb
ers
(%)
Age Profile
Mother54.1%
Father32.1%
Daughter6.4%
Son4.6%
Grandma2.8%
Family Member Responsible for Retail Purchases

Impact of Township Shopping Centres – July, 2010
262
Figure 11.9: Mode of Transport to Retail Centres
Source: Demacon Household Surveys, 2009
Figure 11.10: Number of Breadwinners
Source: Demacon Household Surveys, 2009
Findings: (Figures 11.9 to 11.10) The dominant mode of transport utilised by the family member conducting retail purchases
to reach retail destinations includes public transport (50.7%) or private vehicle (49.3%).
The fact that they do not walk reflects the distance of these centres from their homes.
On average most households have two breadwinners (54.7%), followed by a large
segment of households being characterised by single breadwinners (35.9%).
In general breadwinners are employed in Tzaneen, with small percentages being employed
in Polokwane, Giyane, NkowaNkowa, Pretoria and Johannesburg.
11.4.2 CONSUMER BEHAVIOUR Subsequent paragraphs look at current consumer behaviour in terms of percentage of shopping conducted locally, preferred retail centres, retail expenditure distribution between shopping centres and local traders, average distance to preferred centres, preferred time to conduct shopping, average dwell time, method of payment and transport cost to retail centres.
By car as driver45.1%
By car as passenger4.2%
Public Transport50.7%
Walk0.0%
Dominant Mode of Transport to Retail Centre
One35.9%
Two54.7%
Three3.1%
Three+6.3%
Number of Breadwinners

Impact of Township Shopping Centres – July, 2010
263
Figure 11.11: Percentage of Monthly Shopping Conducted Within NkowaNkowa and Outside NkowaNkowa
Source: Demacon Household Surveys, 2009
Figure 11.12: Percentage of Shopping Conducted at Local Traders
Source: Demacon Household Surveys, 2009
Findings: (Figures 11.11 to 11.14) In general respondents indicated that they conduct approximately 60.2% of their monthly
shopping locally and 40.9% outside of NkowaNkowa.
Respondents also indicated that they conduct between 6% and 10% of their monthly
shopping at local traders (46.7%), followed by a medium sized segment indicating that
they conduct between 16% and 20% at local traders (25.0%). A small segment of
households conduct more than 30% of their monthly shopping at local traders.
In terms of retail expenditure it is evident that the majority of respondents spend between
R751 and R2 000 per month at formal retail centres (66.6%) – average weighted monthly
expenditure amounts to R1 650.994
Most respondents indicated that they spend between R50 and R150 at informal traders per
month (66.7%) – average weighted monthly expenditure amounts to R111.995.
94
Note: Weighted average is an average of multiple values produced by assigning a weight to each value, multiplying each value by its weight, and then adding the results.
NkowaNkowa, 60.2
Outside of NkowaNkowa, 40.9
Percentage of Monthly Shopping - NkowaNkowa versus Areas Outside NkowaNkowa
3.3
46.7
8.3
25.0
8.3
3.3
3.3
1.7
- 5.0 10.0 15.0 20.0 25.0 30.0 35.0 40.0 45.0 50.0
0-5%
6-10%
11-15%
16-20%
21-30%
31-40%
41-50%
More than 50%
Percentage of respondents (%)
Pe
rce
nta
ge o
f Sh
op
pin
g (%
)
Percentage of Shoppping Conducted at Local Traders

Impact of Township Shopping Centres – July, 2010
264
In terms of the favourite retail centres supported – the strong reliance on Tzaneen‟s retail
supply is evident. Favourite retail centres include Tzaneen Crossing, Tzaneng Mall, Maake
Plaza, followed by Checkers Centre, Oasis Mall and Mabopane Retail Centre.
Figure 11.13: Monthly Retail Expenditure at Shopping Centres and Traders
Source: Demacon Household Surveys, 2009
Figure 11.14: Preferred Retail Centre
Source: Demacon Household Surveys, 2009
95
Note: Weighted average is an average of multiple values produced by assigning a weight to each value, multiplying each value by its weight, and then adding the results.
1.7
1.7
-
-
1.7
3.3
3.3
5.0
10.0
13.3
18.3
15.0
10.0
5.0
6.7
5.0
-
20.8
41.7
25.0
4.2
4.2
-
-
4.2
-
-
-
-
-
-
-
-
-
- 5.0 10.0 15.0 20.0 25.0 30.0 35.0 40.0 45.0
R0-R50
R51-R100
R101-R150
R151-R200
R201-R300
R301-R400
R401-R500
R501-R750
R751-R1000
R1001-R1200
R1201-R1500
R1501-R1800
R1801-R2000
R2001-R3000
R3001-R4000
R4001-R5000
R5001+
Percentage of respondents (%)
Mo
nth
ly R
eta
il Ex
pe
nd
itu
re
Monthly Expenditure - formal centres and local traders
Local Traders Shopping Centres
Checkers Centre9.1% Mabopane
2.6%
Tzaneng Mall31.2%
Maake Plaza20.8%
Tzaneen Crossing32.5%
Oasis Mall3.9%
Preferred Retail Centre

Impact of Township Shopping Centres – July, 2010
265
Figure 11.15: Average Distance to Favourite Retail Centres
Source: Demacon Household Surveys, 2009
Figure 11.16: Transport Cost to Formal Shopping Centre and Local Traders
Source: Demacon Household Surveys, 2009
Findings: (Figures 11.15 to 11.17) In terms of the average distance to these centres the majority indicated that this is between
16 and 20km (50.9%), a relatively large segment also indicated distances of up to 40km
(30.2%) and a small segment indicated distances of 11 to 16km.
The cost of transport to reach retail centres is mostly between R11 and R15 (84.4%) -
average weighted transport cost amounts to R12.2; and less than R10 to local traders
(92.1%) - average weighted transport cost amounts to R5.796.
The average travel time to formal retail centres is mainly between 16 and 20 minutes
(31.1%), followed by a large segment indicating longer travel times of up to 50 minutes
(37.7%), and another segment reflecting travel times of 11 to 15 minutes (24.4%) -
(average weighted travel time amounts to 20.8 minutes).
96
Note: Weighted average is an average of multiple values produced by assigning a weight to each value, multiplying each value by its weight, and then adding the results.
1.9
17.0
50.9
13.2
5.7
11.3
-
- 10.0 20.0 30.0 40.0 50.0 60.0
0-10km
11-15km
16-20km
21-25km
26-30km
31-40km
41+km
Percentage of respondents (%)
Pe
rce
nta
ge o
f Sh
op
pin
g (%
)Average Distance to Retail Centres
13.0
84.4
1.3 1.3 -
92.1
6.6 1.3 - -
-
10.0
20.0
30.0
40.0
50.0
60.0
70.0
80.0
90.0
100.0
R0 to R10 R11 to R15 R16 to R20 R21 to R30 R30+
Taxi
/bu
s fa
re
Transport Cost to Retail Centres and Local Traders
Formal Shopping Centre Local Traders

Impact of Township Shopping Centres – July, 2010
266
The average travel time to local traders is mainly less than five minutes – 87.2% (average
weighted travel time amounts to 3.6 minutes).
Figure 11.17: Average Travel Time to Formal Shopping Centre and Local Traders
Source: Demacon Household Surveys, 2009
Figure 11.18: Preferred Time of the Day Conducting Shopping and Entertainment
Source: Demacon Household Surveys, 2009
Figure 11.19: Average Dwell Time on Average Visit to these Centres
Source: Demacon Household Surveys, 2009
2.2 4.4
24.4 31.1
22.2
11.1 4.4
-
87.2
7.7 2.6 2.6 - - - -
-
10.0
20.0
30.0
40.0
50.0
60.0
70.0
80.0
90.0
100.0
0 to 5min 6 to 10min 11 to 15min 16 to 20min 21 to 30min 31 to 40min 41 to 50min 51 to 60min
Min
ute
s
Average Travel Time
Shopping Centre Local Traders
58.1
33.8
8.1
-
66.7
-
33.3
--
10.0
20.0
30.0
40.0
50.0
60.0
70.0
Morning (8:00 to 12:00) Lunch time (12:00 to 14:00) Afternoon (14:00 to 17:00) Evening (17:00+)
Pe
rce
nta
ge o
f R
esp
on
de
nts
(%)
Perferred Time of the Day
Shopping Entertainment
30 minutes0.0%
1 hour4.2%
1.5 hour4.2%
2 hours19.4%
2 to 3 hours29.2%
3 hours +43.1%
Average Dwell Time

Impact of Township Shopping Centres – July, 2010
267
Figure 11.20: Brand Consciousness
Source: Demacon Household Surveys, 2009 Figure 11.21: Method of Payment
Source: Demacon Household Surveys, 2009 Findings: (Figures 11.18 to 11.21) The preferred time of the day to shop is in the morning between 8 and 12 o’clock (58.1%),
followed by a segment indicating a preference for shopping during lunch time between 12
and 2 o‟clock (33.8%).
The preferred time of the day for entertainment at the centres is in the morning between 8
and 12 o’clock (66.7%), followed by a segment indicating a preference for the afternoon
between 2 and 5 o‟clock (33.3%).
The average dwell time per visit to these centres is more than three hours in the majority
of cases(43.1%), followed by relatively large segment indicating dwell times of between
two and three hours (48.6%).
Respondents also showed a strong preference for medium priced brands, followed by a
medium sized segment reflecting a strong preference for the cheapest brands.
The dominant method of payment includes cash, followed by credit, debit, account and lay-
bye.
Cheapest29.3%
Medium Priced68.0%
Most Expensive2.7%
Preference of Product Brands
Cash86.5%
Credit6.8%
Debit4.1%Account
1.4%
Lay-bye1.4%
Method of Payment

Impact of Township Shopping Centres – July, 2010
268
11.4.3 LOCAL SUPPORT Subsequent paragraphs deal with the overall level of satisfaction with shopping facilities within the NkowaNkowa area. They look at on commodities available and not available locally and the types of products purchased from informal traders and spaza stores. Figure 11.22: Overall Level of Satisfaction with Shopping Facilities within NkowaNkowa Area
Source: Demacon Household Surveys, 2009 Figure 11.23: Commodities Predominantly Purchased Within NkowaNkowa
Source: Demacon Household Surveys, 2009 Findings: (Figures 11.22 to 11.24) The largest segment of respondents indicated that they are not satisfied with the retail
facilities within NkowaNkowa – 58.0%, a medium sized segment indicated that it is
acceptable – 22.6% and a mere 19.3% indicated that they are satisfied with the retail
facilities.
Respondents indicated that the following commodities are mostly purchased within
NkowaNkowa – Groceries and top-up groceries, and to a lesser extent hardware goods,
personal care, furniture, speciality goods and entertainment.
1.6
17.7
22.6
43.5
14.5
-
5.0
10.0
15.0
20.0
25.0
30.0
35.0
40.0
45.0
50.0
Very Positive Positive Acceptable Negative Very Negative
Pe
rce
nta
ge o
f R
esp
on
de
nts
(%)
Overall level of satisfaction regarding local shopping facilities within NkowaNkowa
35.2
12.9
-
1.4
2.9
-
1.4
1.4
-
1.5
-
- 5.0 10.0 15.0 20.0 25.0 30.0 35.0 40.0
Groceries
Top up groceries
Clothing /shoes /accessories
Furniture and home ware
Hardware goods
Gifts books and confectionary
Specialty / value goods
Entertainment
Restaurants
Personal care
Services & other
Percentage of Respondents (%)
Commodities Predominantly Puchased within NkowaNkowa

Impact of Township Shopping Centres – July, 2010
269
In terms of commodities not available locally, the following stood out: services, top-up
groceries, restaurants, clothing and shoes, entertainment, gifts, books and confectionary,
speciality and value goods.
Figure 11.24: Types of Commodities Not Available in NkowaNkowa
Source: Demacon Household Surveys, 2009 Figure 11.25: Products and Services in Greatest Demand That Cannot be Obtained Locally
Source: Demacon Household Surveys, 2009
69.0
78.9
74.7
69.6
65.7
74.2
72.2
74.3
76.0
65.2
98.6
- 20.0 40.0 60.0 80.0 100.0 120.0
Groceries
Top up groceries
Clothing /shoes /accessories
Furniture and home ware
Hardware goods
Gifts books and confectionary
Specialty / value goods
Entertainment
Restaurants
Personal care
Services & other
Percentage of Respondents (%)
Type of commodities not available in NkowaNkowa
29.1
23.4
13.8
8.2
4.1
3.8
3.6
2.0
1.5
1.4
1.2
1.1
1.1
1.0
0.9
0.8
0.7
0.7
0.6
0.5
0.5
- 5.0 10.0 15.0 20.0 25.0 30.0 35.0
Supermarket
Clothing
Restaurants
Entertainment
Banks
Furniture
Butchery
Post Office
Shoe Stores
Pharmacy
Personal Care
Health Products
Health Care
Filling Station
Medical Facilities
Hardware
Electricity
Doctors
Cosmetics
Beauty Salon
Bakery
Axis Title
Products and Services in Greatest Demand that cannot be Obtained Locally

Impact of Township Shopping Centres – July, 2010
270
Findings: (Figures 11.25 to 11.26) In terms of the products and services in greatest demand that cannot be obtained locally
supermarkets, clothing stores, restaurants, entertainment, banks, furniture stores and
butcheries ranked the highest.
In terms of the types of products purchased from local traders and spaza shops it was
found that bread, milk, cool drinks and cigarettes represent the top trade articles. These
are followed by airtime, top-up groceries, cooking oil, eggs, maize meal, salt, snacks,
candles, meat, newspaper and vegetables.
Figure 11.26: Main Type of Products Purchased from Local Traders and Spaza Shops
Source: Demacon Household Surveys, 2009
11.4.4 PERCEIVED DEMAND Subsequent paragraphs show the findings regarding the perceived demand for a formal retail facility in the area, potential support, preferred shops and services, the nature thereof, representation of local businesses, anticipated impact on current consumer behaviour and the incorporation of informal trade facilities. Findings: (Figures 11.27 to 11.30) There is a definite perceived demand for a formal retail centre in NkowaNkowa – 93.5%
Strong potential support is evident for a new retail centre – 92.2%
In terms of preferred shops the following ranked top: supermarket, clothing store, butchery,
shoe store, accessory store, furniture, pharmacy, home decor, hardware and restaurants.
In terms of preferred services the following ranked top: doctors, banks, optometrist and
hairdresser.
The largest segment of respondents would prefer an enclosed mall – 42.9%, nearly even
segments, however, would, prefer a combination of open and enclosed malls (30.25) or just
an open mall (27.0%).
33.5
23.3
18.6
7.2
4.2
2.4
1.8
1.8
1.5
1.4
1.2
1.0
1.0
0.7
0.6
- 5.0 10.0 15.0 20.0 25.0 30.0 35.0 40.0
Bread
Milk
Cooldrinks
Cigarettes
Airtime
Top up Groceries
Cooking Oil
Eggs
Maize Meal
Salt
Snacks
Candles
Meat
News Paper
Vegetables
Percentage of Respondents (%)
Products Purchased from Local Traders and Spaza Shops

Impact of Township Shopping Centres – July, 2010
271
Figure 11.27: Perceived Need for Formal Retail Centre in NkowaNkowa
Source: Demacon Household Surveys, 2009 Figure 11.28: Potential Support for New Retail Centre
Source: Demacon Household Surveys, 2009 Figure 11.29: Preferred Nature of Shopping Centre
Source: Demacon Household Surveys, 2009
Yes93.5%
No6.5%
Perceived demand for retail centre in NkowaNkowa
Yes92.2%
No7.8%
Potential support towards a new centre
Open Mall27.0%
Enclosed Mall42.9%
Combination of the Two30.2%
Preferred Nature of Centre

Impact of Township Shopping Centres – July, 2010
272
Figure 11.30: Preferred Shops and Services
Source: Demacon Household Surveys, 2009 Major Tenants That Will Determine Success
• Shoprite
• Pick n Pay
• Mr Price
• Jet
• Spar
• Edgars
• Ackermans
• Checkers
• KFC
• Woolworths
• Dischem
• Truworths
• Clothing
• Discom
• Fruit & Veg
• Boxer Cash & Carry
• Butchery
• Identity
• Pep
• Cinemas
• Debonairs
• Fashion World
• Fresh Food
• Furniture
• Game
• Mac Donalds
• Miladys
• Nandos
• Ok
• Restaurant
• Russels
• Sports Scene
• Wimpy
92.2
92.2
87.0
87.0
83.1
83.1
81.8
81.8
80.5
80.5
80.5
68.8
68.8
53.2
51.9
40.3
39.0
33.8
74.0
74.0
67.5
67.5
66.2
64.9
59.7
53.2
50.6
- 10.0 20.0 30.0 40.0 50.0 60.0 70.0 80.0 90.0 100.0
Supermarket
Clothing store
Butchery
Shoe store
Accessory store
Furniture Store
Pharmacy
Book/gift store
Home Décor
Hardware
Restaurant /TA
Specialty stores
Hobby Store
Liquor store
Florist
Pet store
Automotive and / or Fitment Centres
Restaurants/ take aways
Doctors
Banks
Optometrist
Hairdressers
Dentist
Video Store
Laundromats
Estate Agent
Photo-lab
Percentage of Respondents (%)
Preferred Shops and Services

Impact of Township Shopping Centres – July, 2010
273
Figure 11.31: Preferred Representation of Local Businesses
Source: Demacon Household Surveys, 2009 Figure 11.32: Anticipated Impact on Current Consumer Behaviour
Source: Demacon Household Surveys, 2009 Figure 11.33: Brand Consciousness
Source: Demacon Household Surveys, 2009
Low – less than 5% of floor space
51.9%
Moderate (5% to 25% of floor space)
42.3%
High (more than 25% of centre floor space)
5.8%
Representation of Local Businesses
I will never have to shop elsewhere
6.0%
I will shop less frequently outside my area
52.2%
I will shop less frequently at my previously preferred shop
1.5%
I will visit the area more for shopping purposes
37.3%
My shopping patterns will remain unaffected
3.0%
Anticipated impact on current consumer behaviour
Low14.1%
Medium73.2%
High12.7%
Anticipated impact on current consumer behaviour

Impact of Township Shopping Centres – July, 2010
274
Figure 11.34: Perceived Need for Informal Trade Area as Part of Centre
Source: Demacon Household Surveys, 2009
Figure 11.35: Size of Informal Trade Area as Part of Centre
Source: Demacon Household Surveys, 2009
Figure 11.36: Manner of Inclusion as Part of Centre
Source: Demacon Household Surveys, 2009
Yes67.1%
No32.9%
Perceived Need for informal trade area as part of new centre
Small (< 10 hawkers)42.2%
Medium (10 to 20 hawkers)
51.1%
Large (20 to 50 hawkers)6.7%
Size of informal trade area
As part of the retail centre33.3%
Within the parking area of the centre
35.6%
Accommodated on the perimeter of the centre
31.1%
How should it be accommodated

Impact of Township Shopping Centres – July, 2010
275
Findings: (Figures 8.30 to 8.36) Tenants identified as critical for the success of the centre include Shoprite, Pick „n Pay, Mr
Price, Jet, Spar, Edgars and to a lesser extent, the remainder listed above.
There is a strong preference for a low representation of local businesses in the centre –
51.9% of respondents, followed by 42.3% indicating a preference towards moderate
inclusion of local businesses as part of the centre (5% to 25% of floor space).
Overall, it is anticipated that the centre would have a positive impact on current
consumer behaviour – 52.2% indicated that local residents would shop less frequently
outside their area, 37.3% indicated that they would visit the area more for shopping
purposes, 6.0% indicated that they would never have to shop elsewhere. Only 3.0%
indicated that their shopping patterns would remain unaffected. This reflects a high degree
of anticipated consumer behaviour elasticity.
The majority of respondents indicated that they are moderately brand conscious –
73.2%.
The majority of respondents indicated a perceived need for an informal trade area as part
of the retail centre – 67.1%.
The majority of respondents also indicated that they would prefer a small to medium sized
facility (less than 20 hawkers) – 93.3%.
There is also no dominant preference as to how informal trade should be included – 35.6%
indicated that it should be located in parking area, 33.3% indicated that it should be
developed as part of the centre and 31.1% indicated that it should be accommodated on
the perimeter of the centre.
11.4.5 OVERALL ANTICIPATED IMPACT OF A NEW FORMAL RETAIL CENTRE Respondents also indicated the anticipated impact that a new formal retail centre would have on their local community and economy. Figure 11.37: Anticipated Impact of New Centre
Source: Demacon Household Surveys, 2009
77.9
90.9
90.9
94.8
94.8
97.4
98.7
98.7
22.1
9.1
9.1
5.2
5.2
2.6
1.3
1.3
0% 10% 20% 30% 40% 50% 60% 70% 80% 90% 100%
The centre will offer higher levels of credit to the local community
The centre will provide more affordable goods and services locally
The centre will offer a safe and secure retail destination
The centre will provide quality goods and services locally
The centre will reduce the average travel time
The centre will provide a variety of goods and services to choose from locally
The centre will reduce local travel costs
Overall the centre will improve the convenience of conducting shopping locally
Anticpated Impact of Centre
Yes No

Impact of Township Shopping Centres – July, 2010
276
Findings: (Figure 11.37) Overall, it is evident that a new retail centre would have a positive impact on the local community, with emphasis on the fact that it will improve the convenience of conducting shopping locally, it will reduce travel costs, will provide a variety of goods and services to choose from locally, will reduce average travel time, and it will provide quality goods and services locally.
11.4.6 LIVING STANDARD AND AVERAGE MONTHLY INCOME Respondents indicated changes to their living standard over the past five to 10 years and indicated their average monthly household income. They also indicated the proportion of their incomes originating from remittances and social grants. These factors provide important base information regarding household income, sources of income and changes affecting the overall level of disposable income. Changes in these aspects also have an impact on household retail expenditure. Figure 11.38: Changes in Living Standards Over Past 5 to 10 yrs
Source: Demacon Household Surveys, 2009
Figure 11.39: Monthly Household Income Before Deductions
Source: Demacon Household Surveys, 2009
Declined6.3%
Remained the Same71.4%
Increased22.2%
Changes in Living Standard
-
2.9
5.9
5.9
11.8
2.9
17.6
32.4
5.9
8.8
-
5.9
- 5.0 10.0 15.0 20.0 25.0 30.0 35.0
0-250
251-1000
1001-1500
1501-2000
2001-2500
2501-4000
4001-6000
6001-10000
10001-15000
15 001-20 000
20 001-25 000
25 001-30 000+
Percentage of Respondents (%)
Ran
d/M
on
th
Monthly Household Income

Impact of Township Shopping Centres – July, 2010
277
Findings: (Figures 11.38 to 11.39) The majority of residents indicated that their living standards have remained the same
over the past five to 10 years – 71.4%. A smaller segment of 22.2% indicated that their
living standards improved, mostly as a result of new houses, employment opportunities,
upgrading of the residential area and improved services. A smaller segment of 6.3%
indicated a decline in living standards, predominantly due to increased living costs.
Monthly household income varies, with a large segment earning incomes between R4 000
and R10 000 a month – 50.0%. 29.4% reflected monthly incomes below R4 000 and 20.6%
reflected monthly incomes above R10 000.
The weighted average monthly income amounts to R7 482.1. Note that this is much higher
than the incomes reflected in the socio-economic profile – R3 400 for all LSMs and R7 600
for LSMs 4 to 10+.
33.8% indicated that they obtain a certain percentage of their income from remittances –
1.3% obtain 90% of their income and 32.5% obtain 100% of their income from remittances.
A mere 5.3% of responding households also indicated that they obtain a certain percentage
of their income from the social grant system – 3.9% obtain between 10% and 20% of their
income from the social grant system and a mere 1.3% indicated that they obtain 100% of
their income from the social grant system. However, no physical amounts were indicated in
the survey.
11.5 SYNTHESIS This chapter investigated a rural area characterised by no formal retail centres within a 10km radius. Table 11.3 provides a summary of the key findings of this chapter. Table 11.3: Summary of Findings
Elements Variables
Population 124 819
Households 40 219
Household size 4.2
Population density 381.9hh/km2
Average household income All LSMs: R40 723.8/annum LSM 4 to 10+: R90 723.5/annum
LSM Status 1 to 3: 67.1% 4 to 10+: 32.9%
Household Survey Findings
Household size 4 members+ - 69.8%
Number of breadwinners 2 per hh – 54.7%, 1 per hh – 35.9%
Family member responsible for retail purchases Mother – 54.1%, father – 32.1%
Dominant mode of transport to centres Public Transport – 50.7%, private vehicles – 49.3%
Distribution of retail purchases NkowaNkowa – 60.2%, outside – 40.9%
Local trader support- % of monthly shopping 6% to 10% - 46.7%, 16% to 20% - 25.0% Average weighted support – 15.5%
Monthly retail expenditure at retail centres R751 to R2000 – 66.6% Average weighted amount – R1 650.9
Monthly retail expenditure at traders R50 to R150 – 66.7% Average weighted amount – R111.9
Favourite retail centres Tzaneen Crossing – 32.5% Tzaneng Mall – 31.2% Maake Plaza – 20.8% Checkers Centre – 9.1%
Average distance to retail centres 16 to 20km – 50.9%, 21 to 40km – 37.7%
Transport cost to retail centres R11 to R15 – 84.4% Average weighted amount – R12.2

Impact of Township Shopping Centres – July, 2010
278
Elements Variables
Transport cost to traders Less R10 – 92.1% Average weighted amount – R5.7
Average travel time to retail centres 16 to 20 minutes – 31.1%, more than 20 minutes – 37.7%
Average weighted time – 20.8 minutes
Average travel time to traders Less than 5 minutes – 87.2% Average weighted time – 3.6 minutes
Preferred time of the day: hopping Entertainment
Morning – 58.1%, lunch time – 33.8% Morning – 66.7%, afternoon – 33.3%
Average dwell time 3 hours+ -43.1%, 2 to 3 hours – 48.6%
Dominant method of payment Cash – 86.5%
Level of satisfaction with retail in NkowaNkowa Not satisfied – 58.0%, acceptable – 22.6%
Commodities not available locally Services, top-up groceries, restaurants, clothing and shoes, entertainment, gifts, books and confectionary, speciality goods, furniture stores
Type of products purchased from traders & spaza shops
Bread, milk, cool drinks, cigarettes, airtime, top-up groceries, cooking oil, eggs, maize, snacks, candles, meat, newspaper and vegetables
Definite perceived demand for new centre 96.5%
Strong potential support 92.2%
Top preferred shops and services Supermarket, clothing stores, butchery, shoe stores, accessory stores, furniture stores, pharmacies, home decor, hardware, restaurants, banks, doctors, optometrists and hairdressers
Preferred nature of centre Enclosed mall – 42.9%, combination of closed and open spaces – 30.2%
Top tenants perceived as important for success Shoprite, Pick ‟n Pay, Mr Price, jet, Spar and Edgars
Preferred representation of local businesses Low representation – 51.9%, moderate representation – 42.3%
Anticipated impact of new centre on current consumer behaviour
Positive – 97.0% - reflecting high level of consumers elasticity
Brand consciousness Moderate – 73.2% - predominantly prefer medium priced products and services
Perceived need for informal trade area as part of centre
67.1%
Preferred size of informal trade area Small to medium sized – less than 20 hawkers – 93.3%
Location of informal trade area In parking area – 35.6%, part of the centre – 33.3%, on perimeter – 31.1%
Anticipated impact Very positive Improve the convenience of conducting
shopping locally Reduce travel cost Provide a variety of goods and services to
choose from locally Reduce average travel time Will provide quality goods and services locally
Changes in living standard Remained the same – 71.4% Improved – 22.2%
Average monthly household income R4 000 to R10 000 – 50.0% Less R4 000 – 29.4% Weighted average monthly Income – R7 482.1
Contribution from remittances 33.8%
Contribution from social grants 5.3%

Impact of Township Shopping Centres – July, 2010
279
Overall, the area is characterised by approximately 40 219 households distributed at low population densities within a rural area. The levels of education, levels of employment and occupation profiles reflect a lower to middle income consumer market. The current consumer behaviour reflects a strong reliance on retail centres in the closest town. Although, respondents indicated that they conduct the majority of shopping locally – local trader support is reflected as low. Transport costs and times result in less frequent visits to formal retail centres. There is a definite perceived demand for a formal retail centre with emphasis on convenience goods and services. Overall, it is anticipated that a formal retail centre would have a positive impact locally. In order to examine the impact that formal retail centres have on the local business environment, Chapter 12 is employed.