1.1 operational applications of lightning data at wfo
TRANSCRIPT

1.1Operational Applications of Lightning Data
at WFO Melbourne, FL: A 15-Year Retrospective
David W. Sharp*
NOAA/National Weather ServiceMelbourne, FL
The following is a compilation of excerpts from various articles, pre-prints, technical memoranda, and scientific exchanges involvingthe operational meteorologists at the National Weather Service Office in Melbourne, FL, with several collaborating scientists fromthe National Aeronautics and Space Administration (NASA/Kennedy Space Center and NASA/Marshall Space Flight Center), theMassachusetts Institute of Technology/Lincoln Laboratories, and Vaisala Inc. Major interactions involve, but are not limited to, S.Goodman, E. Williams, R. Raghavan, R. Ramachandran, D. Buechler, B. Boldi, A. Matlin, M. Weber, S. Starr, F. Merceret, M.Murphy, N. Demetriades, R. Holle, S. Hodanish, S. Spratt, A. Cristaldi, P. Blottman, M. Volkmer, B. Hagemeyer, and D. Sharp.
1. IntroductionIn the fall of 1989, the National Weather
Service (NWS) opened their first modernized WeatherForecast Office (WFO) with a commitment tooperationally employ state-of-the-science weatherobservation information. The office was strategicallylocated at Melbourne in central Florida, a region wherethe occurrence of lightning is greater than anywhereelse in the United States. Both climatologically(Hodanish et al., 1997) and statistically (Hagemeyerand Carney, 1996), lightning has been repeatedlyproven to be a prime hazard in Florida, often resulting inmore casualties and property damage on an averageannual basis than other weather-related hazards. Fromthe earliest days, WFO Melbourne engaged in localapplied research and scientific community collaborationsto find ways to mitigate the effects of lightning and totend toward the eventual issuance of public watchesand warnings. Importantly, the NWS is now acquiringthe necessary momentum to realistically consider thiscritical milestone operationally. As we prepare for thisexciting phase, it is appropriate to review at least one ofthe avenues which brought us to this point. This paperendeavors to provide a retrospective of experiences withrespect to the operational applications of lightning dataat WFO Melbourne. Initial experiences using real-timecloud-to-ground (CG) data were established throughautomated dial-up connections and WFO-modifieddisplay software. Courtesy access to the LightningPosition and Tracking System (LPATS) was acquired,which utilized the time of arrival technique for locatingstrikes. Eventually, LPATS would be combined with theLightning Location and Protection (LLP) system tocreate an impressive national network. Hence, lightninginformation was experimentally introduced into WFOMelbourne products and services. Early applicationswere modest, helping forecasters to simply distinguishshowers from thunderstorms, while augmenting radardata prior to the WSR-88D era.
Next, with landmark achievement, totallightning information was introduced into the WFOenvironment. By 1993, WFO Melbourne had access___________________________________________
* Corresponding Author Address: David W. SharpNOAA/NWS Forecast Office, 421 Croton RoadMelbounre, FL 32935; e-mail: [email protected]
to the Lightning Detection and Ranging (LDAR) systemvia the National Aeronautic and Space Administration(NASA) at the Kennedy Space Center (KSC).Developed throughout the 1980s, the system wasdelivered for operational use in the early 1990s tosupport the nation’s space program for launch, landing,and ground operations. Here, three-dimensional totallightning signals are identified through the depiction ofindividual point-sources and graphically displayed(Lennon and Maier, 1991). This represented aconsiderable advancement given that the balance ofcharacter of an electrified storm was revealed. In thespirit of collaboration, WFO Melbourne began exploringthe potential benefits with regards to serving the generalpublic relative to the protection of life, property, andeconomic interests (i.e. the agency’s mission). Learningfrom lightning safety experts at KSC and from theUnited States Air Force’s 45th Weather Squadron (45WS), WFO Melbourne became more proficient in usingtotal lightning information, especially for aviationpurposes. Lightning alert areas were configured for theTerminal Aerodrome Forecast (TAF) airports located atOrlando, Daytona Beach, Vero Beach, and Melbourne.The intent was to optimize the use of “TS” (thunder) and“VCTS” (vicinity thunder), and to expedite Local AirportAdvisories (LAA). More so, since LDAR was used toissue lightning watches and warnings at KSC, strategiesfor experimental public watches and warnings wereoutlined. In fact, WFO Melbourne used LDAR tosupport the 1996 Summer Olympic soccer venue inOrlando as well as other outdoor festivities. With LDAR,the potential for CG discharge is often evident duringthose critical periods of first and last strikes or whenlightning might travel greater distances from the parentstorm channeled through charged cloud or cloud debris.
Together with teams from Marshall SpaceFlight Center (MSFC) and Lincoln Laboratories at theMassachusetts Institute of Technology (MIT/LL),innovative research was performed to processpoint-source information into flashes which wereassociated with specific convective cells and trended.Parallel concepts for trending total lightning flashesobtained from satellite-based sensors were alsopursued. A primary thrust was a search for potentialsevere thunderstorm and tornado indicators to improvelead-time and verification scores. This effort culminatedduring the 22-23 February 1998 killer tornado outbreakacross East Central Florida (ECFL). Integrated with

radar trend information, total lightning trend informationwas operationally used during the warning-decisionprocess with promising results. Rapid increases in flashactivity were correlated with accelerations withinupdrafts, while dramatic decreases were followed bycollapsing weak echo regions and tornado onset. Whenproperly harnessed, LDAR data can aid the forecasterin discerning severe local storms; this is a powerfuldeclaration.
In 1997, the NWS Southern Region endorseda project which enabled WFO Melbourne to explore theissuance of lightning outlooks and pseudo-warningsthrough the Enhanced Lightning Information andServices Experiment (ELISE). Consistent terminologywas established by which lightning storms may bedescribed within public products. “Excessive LightningAlerts” (ELA) are now issued for the public whenever astorm’s primary hazard is considered to be lightning andwhen its CG rate is twelve flashes per minute averagedover several minutes. Descriptions of onset andcessation may also be included in short-term forecasts.Since that time, procedures and techniques haveimproved with easy-to-use templates onAWIPS/WarnGen, with CG data delivered directly toforecaster workstations. Uniquely, results of importantresearch in climatology through Florida State University(Lericos et al, 2002) and Texas A&M University(Hodanish et al, 1997) are now used to produceLightning Threat products in both graphical and griddedform for east central Florida on the Graphical ForecastEditor (GFE). This is done within the HazardousWeather Outlook (HWO) product, issued officially intextual form and experimentally in graphical/griddedform. The advent of the experimental Lightning Threatproduct, along with the ELA product, has helped bringthe agency to the threshold of a 15-year vision.
2. Discerning Severe Local StormsTogether with teams from Marshall Space
Flight Center (MSFC) and Lincoln Laboratories at theMassachusetts Institute of Technology (MIT/LL),innovative research was accomplished by processingLDAR point-source information into flashes which werethen associated with specific convective cells andtrended. This information was combined with radarparameter information from the local WSR-88D anddisplayed on the Lightning Imaging Sensor DataApplication Demonstration (LISDAD) workstation intentlydeveloped for this project (Boldi et al., 1998).
At WFO Melbourne, the research wascategorized according to three primary storm types.First, use of total lightning flash information wasexplored in an attempt to improve warning lead-times forpulse severe storms during central Florida’s warm/wetseason (May through September). In these instances,severe weather is often manifested through damagingwet microbursts and marginally large hail. Lead-timesare inherently shorter when using traditional dataassessment schemes. Second, the mere presence oftotal lightning was deemed significant for improving thedetection of tornadoes associated with the outerrainbands of tropical cyclones. Such tornadoes arespawned within rainband mesocyclones having compact
physical dimensions, making them more difficult todiscern with radar. Within a favorable thermodynamicenvironment, the apparent cyclic response of the totallightning signal can be used to trace updraftacceleration pulses which might lead to tornado(re)occurrence through vortex stretching arguments.Third, the 1998 tornado outbreak brought the rareopportunity to evaluate total lightning data within astrongly sheared baroclinic environment. Dramaticincreases in flash rates for several of the tornado-producing severe thunderstorms (supercells) wereobserved. In certain instances, equally dramaticdecreases in flash rates were roughly correlated totimes of tornado occurrence and the collapse of thebounded weak echo region.
Traditionally, NWS MLB warningmeteorologists rely on two sources of information toissue timely and accurate severe thunderstorm/tornadowarnings. One source of information is receivedthrough detailed reports from storm spotters. This typeof information leads to the highest confidence whenissuing tornado warnings for ECFL. Unfortunately,storm spotters cannot be deployed in all places(especially in the more rural areas) and at all times(especially at night). As a result, the current primarysource of information for the warning meteorologist isthe Doppler radar (WSR-88D). Although reflectivity andvelocity information has greatly improved the detectionof severe storms, limitations still remain such as radarhorizon, aspect ratio, and data refresh rates.
Therefore, with respect to lightning information,the question arises whether this data can providepertinent and timely information to the real-time decisionprocess for the issuance of severe weather warnings.The intent would be to either improve the probability ofdetection, minimize false alarms, or lengthen legitimatewarning lead times. In other words, can lightning dataserve as a complement to radar data in order to discernsevere storms from non-severe storms and, moredirectly, to identify those storms which have the potentialto become tornadic? This might include the manualintegration of lightning data, or perhaps through dataintegration algorithms in a decision-support system.Past studies have suggested the use of CG informationassociated to specific violent tornado-producing stormsmay have some merit. For example, a peak in CGfrequency has often been found 15-20 minutes prior totornado realization with a relative decrease during thetime of tornado. However, the total number of CGflashes prior to tornado, or the achievement of apre-determined peak rate threshold, generally offerslittle value for prediction (Perez et al., 1997). Thisindeed appears to be valid for ECFL storms during thecool season (October through May). On occasion,storms have been observed to reverse predominatepolarity and lower positive charge to ground signalingthe advent of tornado. Unfortunately, this polarityreversal does not always happen and storms canproduce a significant tornado without this polarityreversal. Yet, with suspect storms when this doesoccur, confidence is added to the warning decisionprocess. It has been surmised that the use of CGlightning data, along with radar data, can be useful in
determining changes in a storm's intensity and thus itsability to become tornadic. If this is true, then a greatercase can be made for the use of total lightninginformation.
Use of total lightning information for severestorm determination has been experimentally employedduring multiple severe episodes at WFO Melbourne(Williams et al., 1998). The scope of preliminary resultshas been wide within the associated researchcommunity, but within the operational arena the scopeis much more narrow and tempered with subjectiveevaluation. The most realistic approach has been touse the data to assess the character of a storm's updraftintensity as an additional proxy-quantity amongsttraditional parameters. This becomes more importantfor storms ill-sampled by radar, either spatially ortemporally, or storms that are marginally severe ortornadic. This is true for flash existence, rate, trend, anddensity with each proving to be more valuable than thecorresponding CG signal in most cases. Importantly,application is made according to the appropriatepeninsular Florida severe weather regime and differentsignals become more significant (of more weight) forassessing updraft character and subsequent severeweather potential. Therefore, when blending data froma variety of sensors according to a given environment,total lightning data is uniquely applied. Realistically,total lightning signals are additions to a series of"weighting factors" that can tip the scales of confidencefor the warning meteorologist.
2.1. Storms with Strong/Violent Tornado PotentialThe potential for strong/violent tornadoes
exists mainly during the ECFL cool season which alsoincludes both late season spring (high shear) eventsand early season fall events. This regime iscomplicated by the nature in variation of both buoyancyand shear within the environment and the mode ofconvection that ensues. Simplifying the discussion tothe point where a favorable environment for tornadicsupercells is known to exist, the following observationscan be made. Again, the sample set of known strong toviolent tornado-producing supercells in which totallightning information is available is relatively small andthus confined to observational experiences of WFOMelbourne warning meteorologists for this discussion.Yet, three separate signals were tentatively identified forfurther consideration and study: a minimum thresholdflash rate, a lightning "jump" up in flash rate, and adistinct decrease in flash rate. Ironically, these arecomparable to the early suppositions of CG dataresearchers and thus it is not surprising that ourresearch took us in this initial direction. Radarinspections of suspect storms concentrate on therotational character of the parent mesocyclone(rotational velocity of the mid-level mesocyclone andthe increase of rotational velocity and shear into the lowlevels) and should therefore be matched with theircorresponding electrical character. Of the observedtornadic storms (during events which produced at leastone known F2+ tornado to include the 1998 outbreak),most were noted to achieve a minimum flash rate (of atleast 120 fpm for our study) prior to tornado. Note: Asa significant caveat for the remainder of this
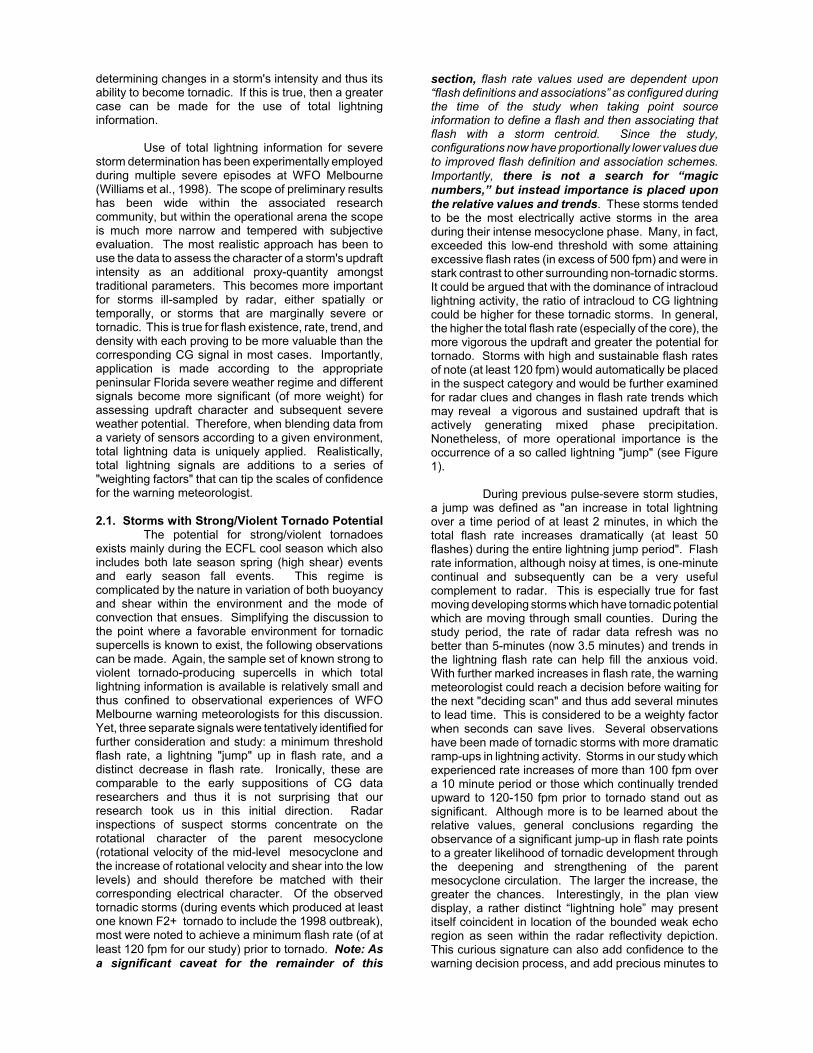
section, flash rate values used are dependent upon“flash definitions and associations” as configured duringthe time of the study when taking point sourceinformation to define a flash and then associating thatflash with a storm centroid. Since the study,configurations now have proportionally lower values dueto improved flash definition and association schemes.Importantly, there is not a search for “magicnumbers,” but instead importance is placed uponthe relative values and trends. These storms tendedto be the most electrically active storms in the areaduring their intense mesocyclone phase. Many, in fact,exceeded this low-end threshold with some attainingexcessive flash rates (in excess of 500 fpm) and were instark contrast to other surrounding non-tornadic storms.It could be argued that with the dominance of intracloudlightning activity, the ratio of intracloud to CG lightningcould be higher for these tornadic storms. In general,the higher the total flash rate (especially of the core), themore vigorous the updraft and greater the potential fortornado. Storms with high and sustainable flash ratesof note (at least 120 fpm) would automatically be placedin the suspect category and would be further examinedfor radar clues and changes in flash rate trends whichmay reveal a vigorous and sustained updraft that isactively generating mixed phase precipitation.Nonetheless, of more operational importance is theoccurrence of a so called lightning "jump" (see Figure1).
During previous pulse-severe storm studies,a jump was defined as "an increase in total lightningover a time period of at least 2 minutes, in which thetotal flash rate increases dramatically (at least 50flashes) during the entire lightning jump period". Flashrate information, although noisy at times, is one-minutecontinual and subsequently can be a very usefulcomplement to radar. This is especially true for fastmoving developing storms which have tornadic potentialwhich are moving through small counties. During thestudy period, the rate of radar data refresh was nobetter than 5-minutes (now 3.5 minutes) and trends inthe lightning flash rate can help fill the anxious void.With further marked increases in flash rate, the warningmeteorologist could reach a decision before waiting forthe next "deciding scan" and thus add several minutesto lead time. This is considered to be a weighty factorwhen seconds can save lives. Several observationshave been made of tornadic storms with more dramaticramp-ups in lightning activity. Storms in our study whichexperienced rate increases of more than 100 fpm overa 10 minute period or those which continually trendedupward to 120-150 fpm prior to tornado stand out assignificant. Although more is to be learned about therelative values, general conclusions regarding theobservance of a significant jump-up in flash rate pointsto a greater likelihood of tornadic development throughthe deepening and strengthening of the parentmesocyclone circulation. The larger the increase, thegreater the chances. Interestingly, in the plan viewdisplay, a rather distinct “lightning hole” may presentitself coincident in location of the bounded weak echoregion as seen within the radar reflectivity depiction.This curious signature can also add confidence to thewarning decision process, and add precious minutes to

lead times. More so, it is interesting that during theoutbreak, some storms continued to experience a flashrate increase even during tornado. It is surmised thatperhaps this was associated with cyclic mesocyclones.That is, the current tornado-producing mesocyclonesuffers from the occlusion process while a new updraftforms south of the original. The lightning associated withthe updraft vigor of the developing mesocyclone is"added" with the lightning with the original storm untilsuch time that they can be separately distinguished.This is one theory.
Figure 1. Trend of total lightning flashes associatedwith the first tornadic supercell during the East CentralFlorida Tornado Outbreak (22-23 February, 1998). Notethe dramatic increase in flashes as the storm intensifiedand then the rapid decrease just prior to the onset of anF2 tornado.
The last signal relates to a noteworthydecrease in flash rate just prior to or during tornado. Insome cases, this may be related to the collapse of thebounded weak echo region which already has acorrelation to tornado occurrence. For stormsassociated with moderate to strong mesocyclones whichhave already realized a minimum flash rate thresholdand also experienced a discernible lightning jump, if adistinct decrease becomes evident (during the studyperiod, especially if in vicinity of 100 fpm or more), thenthe confidence of the warning meteorologist wouldimprove as angular momentum aloft is conceptualizedto be lowering toward the surface. This was noted withseveral of the tornadic storms, but not all of them.Some storms produced a tornado without experiencingthis decrease or perhaps the signal was masked byother contributing factors. However, these storms werestill marked by the relative high flash rates and lightningjump. In fact, there may be some merit in realizing thelength of time a storm is able to maintain an excessiveflash rate and its tornadic potential.
2.2. Tornadoes with Tropical CyclonesPrevious tropical cyclone (TC) CG lightning
studies have shown that the amount of discharges tothe surface vary considerably from TC to TC, butcontain very little CG lightning overall relative to midlatitude mesoscale convective systems (Samsury andOrville, 1994). The literature also agrees that mostobserved CG lightning occurred within outer convectivebands, rather than within inner bands and stratiformprecipitation regions. This is not surprising since agreater coverage of deep convective cells typically
occurs within the outer TC bands where updraftspenetrate far enough aloft to generate mixed phaseprecipitation (supercooled water and wet graupel) toinitiate electrification. The threshold for the production ofenough mixed phase particles is generally denotedwhen a 30 dBZ reflectivity echo reaches or exceeds aheight of 8 km AGL or the level of the -15 to -20 deg Cisotherms (Forbes et al., 1996).
Issuing tornado warnings during TC situationsis an arduous task in which the addition of totallightning information can have a bearing (Spratt et al.,1998). If present, the total signal, of course, dominatesover the CG signal. In fact, situations can occur whenindividual convective cells may possess an electricalcharacter but never produce a CG discharge. In anenvironment where electrical signals are at many timesdevoid, the mere presence of a total lightning signal canbe a weighty parameter. The majority of TC-associatedtornadoes occur within the outer rainbands, usually in apreferred dominant rainband. They often occur infamilies and are associated with mesocyclones ofsmaller vertical and horizontal dimension on average.This can make it very difficult to capture a consistentradar signature for warning purposes. In this situation,warning meteorologists are looking for contracting coremesocyclones and increased low-level shear across thecyclonic couplet. These contracting cores oftencorrelate to brief but multiple F0 and F1 occurrences. Attimes, however small, the existence of total lightning"bursts" can help distinguish these potentialtornado-producing storms from other less-threateningcells (Figure 2). It should be noted that in thesesituations some tornadoes have occurred without anyelectrical signal at all. Therefore, the use of lightningdata cannot be used for warning decisions by itself.Yet, as a radar complement, the character of a givencell can be better inferred, especially in between volumescans and at greater ranges from the radar. For TCtornadoes which acquire F2+ intensity, the electricalcharacter is more difficult to classify. The data set ofstorms is still somewhat small. Of the two F2+tornadoes that have occurred in ECFL (with Gordon,1994; with Josephine, 1996) and also have availabletotal lightning information, both produced lightningbursts at least 10 to 15 minutes prior to (that is, wellbefore) tornado descent and were devoid of activityleading up to tornado and during tornado. Each F2tornado event possessed a persistent parentmesocyclone with shears in excess of 0.015 s-1 (low-level) and their respective bursts serving to furthercharacterize them as suspect cells.
Interestingly, the use of total lightninginformation can be used to improve tornado warningstatistics for TC-hybrid situations. For hybrid cases,tornadoes may, in fact, be the main TC hazard threat.Outbreaks of short-lived tornadoes are usually thebi-product of mini-supercells which, as previously stated,have inherent radar sampling problems. However, thepotential for some sort of lightning signal becomesgreater due to baroclinic modifications of the tornadoenvironment (i.e. lower melting level and more shallowmixed phase layer). The weight of importance of thepresence of lightning, along with flash rate and flash

rate trends, varies according to the situation and theefficiency of lightning production. These signals aremutual with those of the cool season regime situationsbut are not as pronounced. Nonetheless, a generalizedstatement can be made that the more intense stormscapable of producing significant tornado often have themost associated lightning (relative), and therefore suchdata can be used to help distinguish those storms.Again, this has worked best in hybrid situations over theFlorida peninsula later in the TC season. Oddly, it mayoffer an additional means for identifying thedevelopment of a dominate band or perhaps serve asan actual measure of “hybridness.” However, morestudy is needed.
Figure 2. Example of a subtle but importantintracloud lightning “burst” associated with a tornadicstorm during Tropical Storm Josephine (over centralFlorida, 1996). LDAR flashes depicted in light blue.
2.3. Pulse Severe StormsSevere storms during the ECFL warm/wet
season are usually of the pulse-type variety. Theoccurrence of tornado is not as threatening since mostare weak, localized, and short-lived in the presence ofa weakly sheared environment (often of the non-descending variety). In fact, there have been very fewcases with tornado casualties within this environment.In all actuality, damaging wet microbursts (and theoccasional occurrence of large hail) pose the greaterthreat. Difficulty arises with the inherent short lead timefor warnings. Statistically, the false alarm rate alsosuffers in such circumstances. To improve on thismatter was, in fact, the original incentive for WFOMelbourne to engage in the TLI/LISDAD project.Fortunately, there are many more sample cases relatedto this type of severe storm discernment (Hodanish etal., 1998).
Similar to the strong/violent tornado cases,when attempting to identify pulse severe storms, thedramatic rate increase (“jump”) of total lightning andsubsequent rapid decrease were highly correlatedsignals. In particular, a rapid increase in intracloud flashrates usually preceded severe weather manifestation atthe ground by 1-15 minutes. These “jumps” tended tobe about 20 to 100 fpm/min (Figure 3). The higher thejump, the greater the likelihood of severe weather since
such relationships result from the development of mixedphase precipitation and increased hydrometeorcollisions that lead to greater efficiency in chargeseparation (Goodman et al., 1998). Increasedconfidence in severe weather occurrence was attainedwhen this “jump” occurred once a storm had alreadyachieved a notable level of intracloud activity (60-120fpm) that would mark an upward acceleration of theupdraft. Importantly, however, severe weather generallyoccurs during the collapse phase (downdraft dominatedphase) of the pulse storm. During this phase, intracloudactivity tends to sharply decrease. Generally, warninglead times were lengthened by several minutes,especially when teamed with radar parameters. Asadditional experience and trust is gained, it is believedthat a greater increase in lead time will be realized alongwith a gradual reduction in false alarms.
Figure 3. Pulse severe storm over central Floridashowing a rapid increase in flash rate (factor 10) withtime well before severe weather manifestation (at -65minutes). Intracloud activity in light blue, cloud toground in dark blue. Traditional radar parameters ofmaximum dBZ, height of maximum dBZ, and echo topsare also shown.
3. Improving Aviation ForecastsAnother area of application of total lightning
information deals with improving aviation forecasts atfour ECFL airports. This includes the timely inclusion,removal, and use of "thunder" and “vicinity thunder”(TS/CB and VCTS) in the Terminal AeordromeForecasts (TAFs). Intentions have been to optimize theuse of total lightning information for theissuance/amendment of these TAFs to more accuratelyreflect the 0 to 2-hour time frame during convectivesituations. Positive results have been yielded to helpfulfill the demanding need for accurate and precise flightplanning and routing information. A parallel function hasbeen to support several local airports with lightninginformation for ground operations in the form of LocalAirport Advisories (LAA). In all, the early detection ofelectrical discharge within both the 5 nmi and 10 nmicylinders of space over each runway complex has beendeemed beneficial in this regard. Since April of 1996,WFO Melbourne has routinely issued TerminalAerodrome Forecasts (TAFs) four times daily for thefollowing four sites: Daytona Beach International Airport(DAB), Orlando International Airport (MCO), MelbourneInternational Airport (MLB), and Vero Beach MunicipalAirport (VRB). During the warm/wet season, the aviationforecaster routinely issues TAFs which include forecastsof afternoon thunderstorms (TS) for a period of between

three and six hours, with four hours being the mostcommon forecast time span. WFO Melbourne is wellaware of the importance of balancing airlines' needs forboth cost-effectiveness and safety when it comes tocomposing TAFs. The inclusion of TS andaccompanying IFR (instrument flight rules)ceilings/visibilities in either the prevailing or TEMPOgroup of a TAF has significant consequences withrespect to airport operations, particularly if it is a majorhub (Ott and Ladd, 1994). For instance, not only are thenumber of arrivals/departures reduced during TS/IFRconditions, but any aircraft whose destination airportcontains a forecast of prevailing or TEMPO TS mustcarry additional fuel so that it may reach a designatedalternate destination airport should the weather notpermit a landing at the planned destination airport.
Figure 4. Example of circle alerting icon centeredaround the Orlando International Airport (MCO) forintracloud lightning detection. Red denotes thatintracloud lightning is occurring (or has occurred withinthe past 15 minutes) within 5 nmi of the center of therunway complex.
Carrying this extra fuel costs the commercial carriersmore money, and if TS conditions are inaccurately (orexcessively) forecast, the cost incurred by a commercialairline can become quite large.
During an evaluation period, forecastersconcentrated on the exploitation of available totallightning information (TLI), with emphasis placed on theinitial two-hour time period. Software from both theLDAR and LISDAD workstations was configured toincorporate lightning alerts for each of the TAF sites.On LISDAD, these visual alerts display wheneverlightning is detected at specified distances. A circle iconis placed around the TAF site (Figure 4) in which itscolor coding denotes the current level of lightning threat.If the circle icon is black, there is no TLI within 20 nmi;if cyan, there is TLI within 20 nmi but not within 10 nmi;if yellow, there is TLI within 10 but not within 5 nmi; andif red, there is TLI within 5 nmi. A 15-minute safety timelag has been introduced as the threat decreases. Onemajor goal within this 0 to 2-hour time period was tooptimize the forecast for thunderstorms (TS), convectivewind gusts (GxxKT), and IFR (instrument flight rules)ceilings/visibilities conditions in both the prevailing andTEMPO groups, and to narrow the time frame in which"extreme" thunderstorm-related aviation weather (e.g.low IFR ceilings/visibilities, wind gusts in excess of
30KT) to one hour or less, when warranted. Anotherintent was to establish whether "TS VCSH" as aprevailing weather group was preferable over the use of"VCTS.” In all, the forecasters have found favor with thealerting feature and it is regarded as a very usefulfeature.
Additionally, in order to determine the need forenhanced aviation service via Local Airport Advisories(LAA), the airports for which LAAs are currently issued(DAB and MCO) were visited. During these visits, it wasdetermined that MCO did not require this level ofservice, since they had access to NLDN data andalready had a system in place for alerting operationalpersonnel to the presence of lightning. However,authorities at DAB were interested. As a result, LAAsare issued for storms that possess (or forecast topossess) excessive amounts of CG lightning in closeproximity to DAB (in support of ground operations).Insights from the ongoing effort suggest that placementof an economical automated system (similar to the TAFalerting) would ultimately work best since groundoperations can also be negatively impacted by lesseramounts of CG lightning. 4. Lightning as a Direct Hazard to the Public
Finally, yet another total lightning application(perhaps the most challenging) is being examined toconsider the direct hazards of lightning to the public.Florida is a leader in both CG strikes (annual flashdensities) and lightning casualties. During the summerof 1997, WFO Melbourne began including lightninginformation into public products. Climatological,statistical, and safety information are now included inthe morning edition of the Hazardous Weather Outlook(HWO) product according to the current synoptic andmesoscale weather pattern. The HWO is a productintended for public and interagency planning purposesand was used to describe the geographical distributionand timing of the onset/ending of deadly CG lightningstrikes. Particular attention is given to lightning-sensitive situations where larger numbers of people areexpected to be outdoors away from ready cover. Then,as each convective event unfolds, lightning informationis included in the Short-term Forecast (NOW) product.LDAR information is used to detect early signs ofelectrical activity aloft over/near generalized areasbefore actual CG strikes occur or to help determinewhen the potential for CG discharge has diminished.Situational casualty statistics indicate that the onset andend of CG strike activity are dangerous times. By theend of the 1997 season, a modest but promisingsuccess was achieved which has since been built upon.
In a study conducted by Curran et al. (1997) itwas found that during the period from 1959 through1994 Florida experienced more lightning-relatedcasualties (1523 deaths and injuries) than any otherstate in the country. In fact, Florida experienced overtwice the amount of casualties than even the secondleading state (Michigan). During this same time period,CG lightning was responsible for 53 percent of the totalweather-related (phenomena) deaths in Florida; morethan hurricanes, floods, and tornadoes. On average,ten people are killed each year in Florida with anaverage of thirty four injuries (Paxton and Morales,
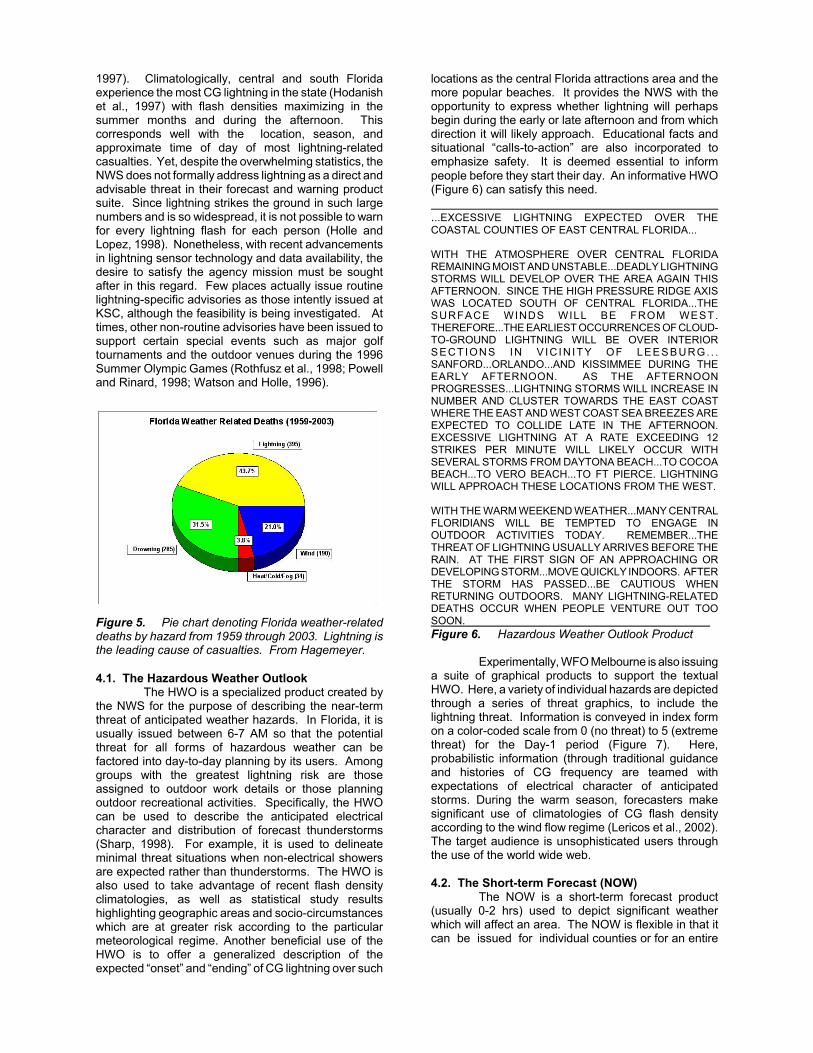
1997). Climatologically, central and south Floridaexperience the most CG lightning in the state (Hodanishet al., 1997) with flash densities maximizing in thesummer months and during the afternoon. Thiscorresponds well with the location, season, andapproximate time of day of most lightning-relatedcasualties. Yet, despite the overwhelming statistics, theNWS does not formally address lightning as a direct andadvisable threat in their forecast and warning productsuite. Since lightning strikes the ground in such largenumbers and is so widespread, it is not possible to warnfor every lightning flash for each person (Holle andLopez, 1998). Nonetheless, with recent advancementsin lightning sensor technology and data availability, thedesire to satisfy the agency mission must be soughtafter in this regard. Few places actually issue routinelightning-specific advisories as those intently issued atKSC, although the feasibility is being investigated. Attimes, other non-routine advisories have been issued tosupport certain special events such as major golftournaments and the outdoor venues during the 1996Summer Olympic Games (Rothfusz et al., 1998; Powelland Rinard, 1998; Watson and Holle, 1996).
Figure 5. Pie chart denoting Florida weather-relateddeaths by hazard from 1959 through 2003. Lightning isthe leading cause of casualties. From Hagemeyer.
4.1. The Hazardous Weather OutlookThe HWO is a specialized product created by
the NWS for the purpose of describing the near-termthreat of anticipated weather hazards. In Florida, it isusually issued between 6-7 AM so that the potentialthreat for all forms of hazardous weather can befactored into day-to-day planning by its users. Amonggroups with the greatest lightning risk are thoseassigned to outdoor work details or those planningoutdoor recreational activities. Specifically, the HWOcan be used to describe the anticipated electricalcharacter and distribution of forecast thunderstorms(Sharp, 1998). For example, it is used to delineateminimal threat situations when non-electrical showersare expected rather than thunderstorms. The HWO isalso used to take advantage of recent flash densityclimatologies, as well as statistical study resultshighlighting geographic areas and socio-circumstanceswhich are at greater risk according to the particularmeteorological regime. Another beneficial use of theHWO is to offer a generalized description of theexpected “onset” and “ending” of CG lightning over such
locations as the central Florida attractions area and themore popular beaches. It provides the NWS with theopportunity to express whether lightning will perhapsbegin during the early or late afternoon and from whichdirection it will likely approach. Educational facts andsituational “calls-to-action” are also incorporated toemphasize safety. It is deemed essential to informpeople before they start their day. An informative HWO(Figure 6) can satisfy this need. ...EXCESSIVE LIGHTNING EXPECTED OVER THECOASTAL COUNTIES OF EAST CENTRAL FLORIDA...
WITH THE ATMOSPHERE OVER CENTRAL FLORIDAREMAINING MOIST AND UNSTABLE...DEADLY LIGHTNINGSTORMS WILL DEVELOP OVER THE AREA AGAIN THISAFTERNOON. SINCE THE HIGH PRESSURE RIDGE AXISWAS LOCATED SOUTH OF CENTRAL FLORIDA...THESURFACE WINDS WILL BE FROM WEST.THEREFORE...THE EARLIEST OCCURRENCES OF CLOUD-TO-GROUND LIGHTNING WILL BE OVER INTERIORSECTIONS IN V IC IN ITY OF LEE S B URG. . .SANFORD...ORLANDO...AND KISSIMMEE DURING THEEARLY AFTERNOON. AS THE AFTERNOONPROGRESSES...LIGHTNING STORMS WILL INCREASE INNUMBER AND CLUSTER TOWARDS THE EAST COASTWHERE THE EAST AND WEST COAST SEA BREEZES AREEXPECTED TO COLLIDE LATE IN THE AFTERNOON.EXCESSIVE LIGHTNING AT A RATE EXCEEDING 12STRIKES PER MINUTE WILL LIKELY OCCUR WITHSEVERAL STORMS FROM DAYTONA BEACH...TO COCOABEACH...TO VERO BEACH...TO FT PIERCE. LIGHTNINGWILL APPROACH THESE LOCATIONS FROM THE WEST.
WITH THE WARM WEEKEND WEATHER...MANY CENTRALFLORIDIANS WILL BE TEMPTED TO ENGAGE INOUTDOOR ACTIVITIES TODAY. REMEMBER...THETHREAT OF LIGHTNING USUALLY ARRIVES BEFORE THERAIN. AT THE FIRST SIGN OF AN APPROACHING ORDEVELOPING STORM...MOVE QUICKLY INDOORS. AFTERTHE STORM HAS PASSED...BE CAUTIOUS WHENRETURNING OUTDOORS. MANY LIGHTNING-RELATEDDEATHS OCCUR WHEN PEOPLE VENTURE OUT TOOSOON. Figure 6. Hazardous Weather Outlook Product
Experimentally, WFO Melbourne is also issuinga suite of graphical products to support the textualHWO. Here, a variety of individual hazards are depictedthrough a series of threat graphics, to include thelightning threat. Information is conveyed in index formon a color-coded scale from 0 (no threat) to 5 (extremethreat) for the Day-1 period (Figure 7). Here,probabilistic information (through traditional guidanceand histories of CG frequency are teamed withexpectations of electrical character of anticipatedstorms. During the warm season, forecasters makesignificant use of climatologies of CG flash densityaccording to the wind flow regime (Lericos et al., 2002).The target audience is unsophisticated users throughthe use of the world wide web.
4.2. The Short-term Forecast (NOW)The NOW is a short-term forecast product
(usually 0-2 hrs) used to depict significant weatherwhich will affect an area. The NOW is flexible in that itcan be issued for individual counties or for an entire

Figure 7. Example of the experimental LightningThreat graphic issued daily at WFO Melbourne. It islargely based on the likelihood that CG lightning willoccur combined with anticipated flash rate.
county warning area. During the summer of 1997, itwas found that relevant lightning information couldindeed be included within the NOW (Figure 8). Initialefforts were meager, focusing on the onset period overgeneralized areas. In tandem with radar, LDAR wasused for the early detection of developing electricalconvection before imminent ground strikes while CGdata was used when handling the movement of maturethunderstorms from location to location. In order toheighten awareness, the term “lightning storm” isemployed whenever CG lightning is considered to bethe primary hazard. This has been well received andaccepted by the media and adopted into theirnomenclature. Operationally, the handling of the onsetof lightning was found to be plausible for the first strikesof the day over a given area, but quickly becomesunmanageable when attempting to accommodate thereoccurrence of lightning. THROUGH 1 PM...THE FIRST LIGHTNING STORMS OF THEDAY WILL FORM OVER INLAND SECTIONS FROM OCALATO LEESBURG...AND NEAR THE ORLANDO / KISSIMMEEATTRACTIONS AREA. FREQUENT LIGHTNING ANDLOCALLY HEAVY RAIN WILL BE ASSOCIATED WITHINCREASING STORMS INTO THE MID-AFTERNOON. ATTHE FIRST AUDIBLE OCCURRENCE OF THUNDER...MOVEQUICKLY TO SHELTER AWAY FROM WATER. DO NOTSEEK SHELTER UNDER TALL TREES. IF YOU ARE IN ASITUATION WHERE YOU CAN NOT HEAR THE APPROACH
OF A LIGHTNING STORM...WATCH FOR DARKTHICKENING STORM CLOUDS. REMEMBER...MOREPEOPLE ARE KILLED IN FLORIDA BY LIGHTNING THAN BYANY OTHER WEATHER HAZARD. Figure 8. Short-term Forecast Product
Similar to the onset, the (absolute) ending ofCG activity over a generalized area was found to bepractical information to include in the NOWs. Thisloosely mimics the “all clear” concept. Both LDAR andCG data were used with a temporal safety marginadded. According to Holle et al. (1992), most centralFlorida lightning casualties occur late in the storm. Thissuggests that a more definitive effort should be made inthis area. Collectively, WFO Melbourne has beenunable to handle both the onset and ending of CGlightning during all times and in all locations. Manually,this task is too daunting and requires unreasonablehuman resources.
During periods when lightning is already inprogress, forecasters also attempt to describe thefrequency of CG discharge in the NOWs. In the past,the need for this type of information always seemednecessary but the actual usefulness was unknown.Although somewhat arbitrary, seemingly reasonablequantitative values have been attached to descriptiveterms. The term “occasional” is defined as lightningassociated with a storm with an average rate of 2 CGstrikes per minute. It is important to note that this termis rarely used in products since it is felt that it tends tominimize the actual threat and could inadvertently lurepeople outdoors into harms way. The term “frequent” isdefined for lightning storms possessing an average rateof 3 - 11 CG strikes per minute, while “excessive”referred to lightning storms with average rates greaterthan 11 strikes per minute (more than 1 CG strike every5 seconds). Both terms are used within NOW productswith the term “frequent” used most often. Thesedescriptive terms tend to have greater impact whenactual numerical rates are also included in the product.
4.3. The Excessive Lightning AlertAs a current practice, once a storm reaches
the “excessive” category, a Special Weather Statement(SPS - Figures 9 and 10) is issued for the impactedcounty or counties. This pseudo-advisory is called an Excessive Lightning Alert (ELA) and has evidence ofvalue both in the protection of life and in the protectionof property. The scenario which most often prompts theissuance of an ELA is the collision of the east and westcoast sea breezes during the summer peak season, orwith certain storms which exploit the sea breeze. Theparallel collision and merger of sea breezes oftenaccentuates thunderstorm production which results in“excessive” lightning. At times, isolated storms alsoreach and maintain excessive rates on their own andELAs are issued as they move from one county to thenext. Many times, excessive rates are associated withdamaging thunderstorms. In these cases, the storm isno longer referenced as a “lightning storm”, but ratheras a “severe thunderstorm” capable of producing thetraditional damaging wind/hail hazards and thusprompted the usual appropriate weather warning. Evenso, it was considered valuable to describe the frequency

Figure 9. The Excessive Lightning Alert product canbe easily generated by forecasters on AWIPS/Warnen.
of the CG lightning, referring to it as the first stormhazard to arrive in a given area and the last hazard todepart. It was surmised that this could actually result inquicker public reaction to move indoors to safety(regardless of the thunderstorm hazard).
The ELA represents a storm-relative approachto lightning advisories. In order to accomplish this, itwas necessary to associate individual CG strikes withrespective storms. This was not always easy andcertainly lends itself for automation (i.e. AWIPS/SCAN).Other approaches yet to be explored might entail a geo-relative approach or a person-relative approach. In ageo-relative situation, advisories would be issued forspecific locations (similar to KSC advisories) and couldinclude “onset” and “ending” criteria, providing thelocation was not overwhelmingly large. The person-relative approach is too specialized and intensive for theNWS to pursue. ...EXCESSIVE LIGHTNING STORM OVER BREVARDCOUNTY...
THROUGH 6 PM EDT...A STORM PRODUCING EXCESSIVE
LIGHTNING WILL AFFECT PARTS OF BREVARD COUNTYFROM NEAR TITUSVILLE...TO THE KENNEDY SPACECENTER...TO PORT CANAVERAL AND COCOA BEACH.THIS STORM WAS PRODUCING GROUND STRIKES ATTHE RATE OF 12 TO 15 PER MINUTE AND IS ESPECIALLYDANGEROUS. THOSE WITH THE GREATEST DANGERARE PEOPLE IN NORTH BREVARD COUNTY ENGAGED INOUTDOOR ACTIVITIES SUCH AS BOATING, SWIMMING,OR PLAYING GOLF. DUE TO THE GREATER NUMBER OFSTRIKES...THERE IS AN INCREASED THREAT TO LIFE IFLIGHTNING SAFETY RULES ARE NOT FOLLOWED. THEEXCESSIVE FREQUENCY OF STRIKES WILL ALSO BRINGA GREATER CHANCE FOR DISRUPTION IN ELECTRICALPOWER SERVICE AND RELATED PROPERTY DAMAGE. Figure 10. The Excessive Lightning Alert Product
4.4. ImplicationsSo far, a greater emphasis has been placed on
the protection of life rather than property. Both the“onset” and “ending” of CG lightning are accommodatedthrough routine short-term forecasts. Pseudo-advisories(ELAs) focus on excessive strike rates which addressboth life and property. Adaptive automation schemesfor prescribed alert thresholds for the presence ofLDAR activity aloft over defined areas, as well as CGrate activity associated with individual storms should bepursued. A true test of the value-added aspect of real-time lightning data will be whether meaningfulinformation can be extracted from the data stream whichcan be used to protect the public from deadly CGlightning strikes.
a. Peak Season Experiences - Accommodatinglightning as a direct and advisable weather hazard ismost effective during the peak season. During thesummer, casualty statistics are more readily used as amotivating force for the protection of life. Also, lightningstorm occurrence is more diurnally-driven and oftenassociated with either the east coast sea breeze or westcoast sea breeze. Determining the general time andlocation of the onset of lightning is normally a function ofthe low-level wind flow regime or related with thepresence of mesoscale boundaries. Electricalconvection usually develops in situ over central Floridaas opposed to advecting into the area (i.e. with frontalsystems). Excessive lightning usually results fromstorm mergers or from the collision of the east and westcoast sea breezes. Lightning ground strikes aremaximized during the afternoon when most people arecoincidently engaged in outdoor activities. Since alarger percentage of out-of-state tourists is typicallypresent in the summer and may not be fully aware of theFlorida lightning threat, product composition should becontinually sensitive to “calls-to-action” and safety rules.Lightning information is rarely incorporated into productsduring the overnight period (after 10 pm).
b. Lull Season Experiences - From October throughMay, electrical convection is usually associated withlarger mid-latitude systems with infrequent day-to-dayoccurrence. Lightning information is far less likely to beincluded within public products and more likely to beused to determine thunderstorm severity. Whenincluded, it is often used with major calendar events(such as College Spring Break) or weekends in mind.No specific references to life saving actions are made
available in public products issued after dark. Duringthe lull season, ELAs are rarely issued. In almost allELA situations, excessive rates are either associatedwith severe storms or with storms which occurovernight, but on occasion have been issued in advanceof severe thunderstorm warnings and providingheightened awareness.
5. References (complete listing available uponrequest)
Boldi, R., E. Williams, A. Matlin, M. Weber, S. Hodanish, D. Sharp, S. Goodman, R. Raghavan, 1998: The Design and Evaluation of the Lightning Imaging Sensor Data Applications Display (LISDAD), Preprints, 19th Conf. on Severe Local Storms, Amer. Meteor. Soc.
Goodman, S., R. Raghavan, R. Ramachandran, D. Buechler, S. Hodanish, D. Sharp, E. Williams, R. Boldi, A. Matlin, and M. Weber, 1998: Total Lightning and Radar Storm Characteristics associated with Severe Storms in Central Florida, Preprints, 19th Conf. on Severe Local Storms, Amer. Meteor. Soc.
Hagemeyer, B. C., and J. S. Carney, 1996: Florida Weather History Interactive Resource Library (WHIRL) . Preprints, 12th International Conference on Interactive Information and Processing Systems for Meteorology, Oceanography and Hydrology. Atlanta, GA, Amer. Meteor. Soc.
Hodanish, S.J., D. Sharp, E. Williams, R. Boldi, S. Goodman, R. Raghavan, A. Matlin, and M. Weber, 1998: Observations of Total Lightning Associated with Severe Convection During the Wet Season in Central Florida, Preprints, 19th Conf. on Severe Local Storms, Amer. Meteor. Soc.
Hodanish, S. J., D. W. Sharp, W. Collins, C. Paxton, and R.E. Orville, 1997: A Ten-Year Monthly Lightning Climatology of Florida: 1986 through 1995. Wea. Forecasting, 12, 439-448.
Lennon, C. and L. Maier, 1991: Lightning Mapping System, NASA CP-3106, Vol. II, 1991 International Aerospace and Ground Conf. on Lightning and Static Electricity.
Lericos, T.P., H.E. Fuelberg, A.I. Watson, and R.L. Holle, 2002: Warm season lightning distributions over the Florida peninsula as related to synoptic patterns. Wea. Forecasting, 17, 83-98
Sharp, D. W., 1998: Implications Involving the Issuance of Public Lightning Advisories for Florida, Preprints, 19th
Conf. on Severe Local Storms, Amer. Meteor. Soc.
Spratt, S., D. Sharp, S. Hodanish, 1998: Observed Relationships between Total Lightning Information and Doppler Radar Data during Two Recent Tropical Cyclone Tornado Events in Florida, Preprints, 19th Conf. on Severe Local Storms, Amer. Meteor. Soc.
Williams, E., R. Boldi, A. Matlin, M. Weber, S. Hodanish, D. Sharp, S. Goodman, R. Raghavan, and D. Buechler, 1998: Total Lightning as a Severe Weather Diagnostic in Strongly Baroclinic Systems in Central Florida. Preprints, 19th Conf. on Severe Local Storms, Amer. Meteor. Soc.