11 may 2005 the economy and the housing market fionnuala earley group economist nationwide building...
TRANSCRIPT

11 May 2005
The Economy and The Economy and the Housing the Housing MarketMarket
Fionnuala EarleyFionnuala EarleyGroup EconomistGroup EconomistNationwide Building SocietyNationwide Building Society

Overview
Recent Trends and Outlook
Economic Background
Housing Market
Risk factors
Outlook

Economic growth above trend But questions about level of spare capacity
Economic Growth
0
0.5
1
1.5
2
2.5
3
3.5
4
4.5
5
2000q1
2000q2
2000q3
2000q4
2001q1
2001q2
2001q3
2001q4
2002q1
2002q2
2002q3
2002q4
2003q1
2003q2
2003q3
2003q4
2004q1
2004q2
2004q3
2004q4
2005q1
2005q2
2005q3
2005q4
2006q1
2006q2
0
0.2
0.4
0.6
0.8
1
1.2
YoY QoQ
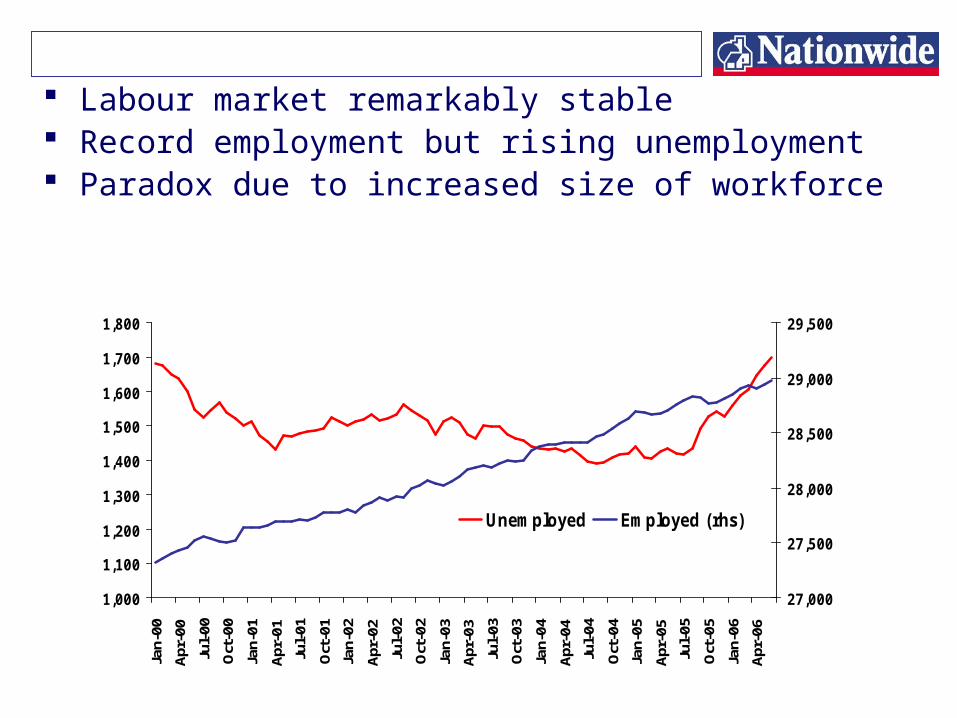
Labour market remarkably stable Record employment but rising unemployment Paradox due to increased size of workforce
1,000
1,100
1,200
1,300
1,400
1,500
1,600
1,700
1,800
Jan-
00
Apr
-00
Jul-
00
Oct
-00
Jan-
01
Apr
-01
Jul-
01
Oct
-01
Jan-
02
Apr
-02
Jul-
02
Oct
-02
Jan-
03
Apr
-03
Jul-
03
Oct
-03
Jan-
04
Apr
-04
Jul-
04
Oct
-04
Jan-
05
Apr
-05
Jul-
05
Oct
-05
Jan-
06
Apr
-06
27,000
27,500
28,000
28,500
29,000
29,500
Unemployed Employed (rhs)

Economic Background
Inflation Expectations
1.53
1.73
1.93
2.13
2.33
2.53
2.73
2.93
Feb-
05
Apr
-05
Jun-
05
Aug
-05
Oct
-05
Dec
-05
Feb-
06
Apr
-06
Jun-
06
Aug
-06
Energy costs have fuelled inflation Oil prices now falling but utility bills still increasing Inflation expectations are higher
-10
-5
0
5
10
15
20
25
Jan-
00Ju
l-00
Jan-
01Ju
l-01
Jan-
02Ju
l-02
Jan-
03Ju
l-03
Jan-
04Ju
l-04
Jan-
05Ju
l-05
Jan-
06Ju
l-06
CPI CPI Energy CPI Core

Wage growth steady But risk that inflationary expectations will feed into wages For now, wages are kept under control by immigration,
threat of outsourcing and remaining slack in labour market.
Earnings growth, YoY, %
2.5
3
3.5
4
4.5
5
Jan-0
2
Apr-
02
Jul-
02
Oct
-02
Jan-0
3
Apr-
03
Jul-
03
Oct
-03
Jan-0
4
Apr-
04
Jul-
04
Oct
-04
Jan-0
5
Apr-
05
Jul-
05
Oct
-05
Jan-0
6
Apr-
06
Jul-
06
Inc Bonuses Excl Bonuses
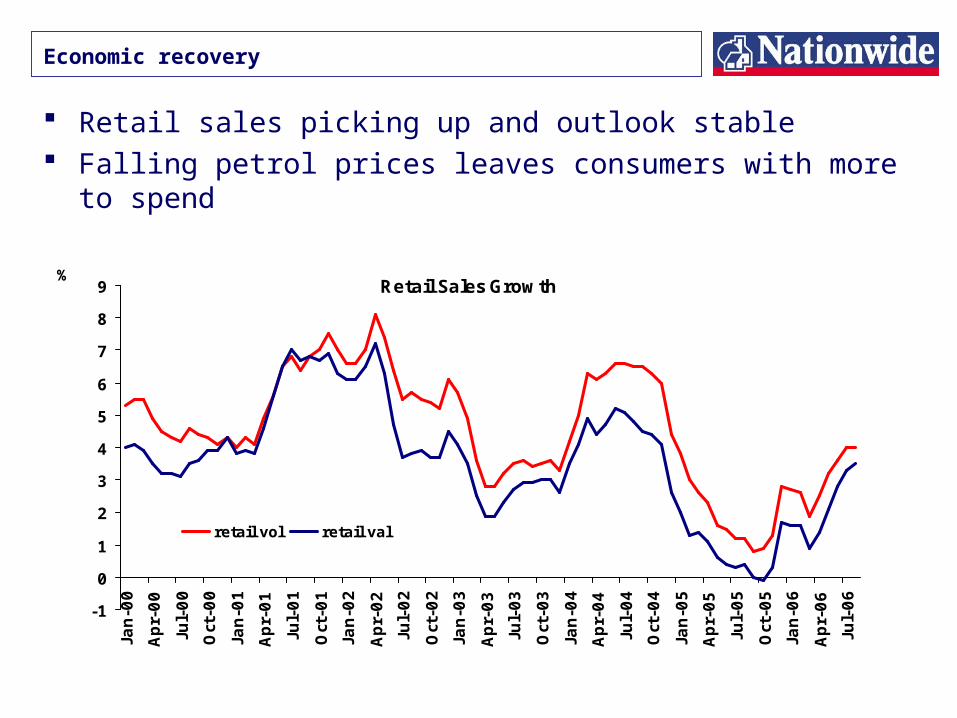
Economic recovery
Retail sales picking up and outlook stable Falling petrol prices leaves consumers with more to
spend
Retail Sales Growth
-1
0
1
2
3
4
5
6
7
8
9
Jan-0
0
Apr-
00
Jul-
00
Oct
-00
Jan-0
1
Apr-
01
Jul-
01
Oct
-01
Jan-0
2
Apr-
02
Jul-
02
Oct
-02
Jan-0
3
Apr-
03
Jul-
03
Oct
-03
Jan-0
4
Apr-
04
Jul-
04
Oct
-04
Jan-0
5
Apr-
05
Jul-
05
Oct
-05
Jan-0
6
Apr-
06
Jul-
06
%
retail vol retail val
Economic Summary
Economic growth above trend – despite recent revisions
Inflation well above target Labour market resilient Wage growth steady Retail sales picking up BUT Household income growth (and expectations of its
future growth) slowing No sign of second round impact on wage growth Second interest rate rise on the horizon

Housing Market
Surprisingly strong and enduring revival in housing market
Activity levels picked up in spite of worsening affordability
0%
5%
10%
15%
20%
25%
30%
Jan-0
3
Mar-0
3
May-0
3
Jul-0
3
Sep-0
3
Nov-0
3
Jan-0
4
Mar-0
4
May-0
4
Jul-0
4
Sep-0
4
Nov-0
4
Jan-0
5
Mar-0
5
May-0
5
Jul-0
5
Sep-0
5
Nov-0
5
Jan-0
6
Mar-0
6
May-0
6
Jul-0
6
Sep-0
6
50
60
70
80
90
100
110
120
130
140
House prices YoY% (lhs)
House purchase approvals,000s

Buy-to-Let a factor
Residential property investment a clear boost to the market B2L balances increased from 1% to 8% of total mortgage
balances in 5 years House price growth has allowed existing landlords to gear up Gross buy-to-let lending 11% of total gross lending in H2 2006
Gross B2L lending as % total gross lending
0%
2%
4%
6%
8%
10%
12%
H1 9
9
H2 9
9
H1 0
0
H2 0
0
H1 0
1
H2 0
1
H1 0
2
H2 0
2
H1 0
3
H2 0
3
H1 0
4
H2 0
4
H1 0
5
H1 0
6
H2 0
6
Source: CML

Affordability – new buyers facing 3¼ times income, but this excludes those pushed out of the market
For average earner ftb would take up more than 40% take home pay
House price growth outstripping household income growth
0%
5%
10%
15%
20%
25%
30%
2000
q1
2001
q1
2002
q1
2003
q1
2004
q1
2005
q1
2006
q1
House prices Disposable income
0%
10%
20%
30%
40%
50%
60%
1983
Q1
1985
Q2
1987
Q3
1989
Q4
1992
Q1
1994
Q2
1996
Q3
1998
Q4
2001
Q1
2003
Q2
2005
Q3
FTB Affordability

Default Risks
Small upturn in arrears but remain at low levels Financial distress concentrated in non-owner occupied sector Lending secured on dwellings over £1 trillion But remaining equity in owner occupied housing stock is more
than twice this
£0
£500
£1,000
£1,500
£2,000
£2,500
£3,000
1981 1984 1987 1990 1993 1996 1999 2002 2005
Value of Stock £bn
Loans secured onDwellings (ex HA) £bn

Housing market more resilient than anticipated House price growth now at 8.2% Momentum in the market grown throughout the
summer Strong investor demand – but this is not the whole
story
BUT House prices growing faster than incomes Affordability deteriorating Expectations of house price growth moderating Widespread expectation of further increase in rates