11 linda s. gottfredson, professor university of delaware august 7, 2009 presentation to accept 2008...
TRANSCRIPT

11
Linda S. Gottfredson, ProfessorUniversity of Delaware
August 7, 2009
Presentation to accept 2008 George A. Miller Award for outstanding article across specialty areas, Division 1, APA
Social Class Disparities in Health: A Vexing Puzzle with a Surprising Answer?Social Class Disparities in Health: A Vexing Puzzle with a Surprising Answer?
American Psychological Association

22
1. What are “disparities”? 2. What’s the vexing puzzle?3. Is human cognitive diversity key to solving it?4. If yes, so what?
Agenda
Answers: All surprising
33
1. What are “disparities”? 2. Why such a vexing puzzle?3. Is human cognitive diversity the key to solving it?
4. If yes, so what?
Agenda
Examples

44
“Disparity” = group differences on health outcome X“Explaining” between-group variation
Means, rates, etc.
16 yrs12 yrs8 yrs
Typical indicators of socioeconomic status (SES)• Years education
• Occupational status• Income
But not clear what they really represent or have in common
?
5
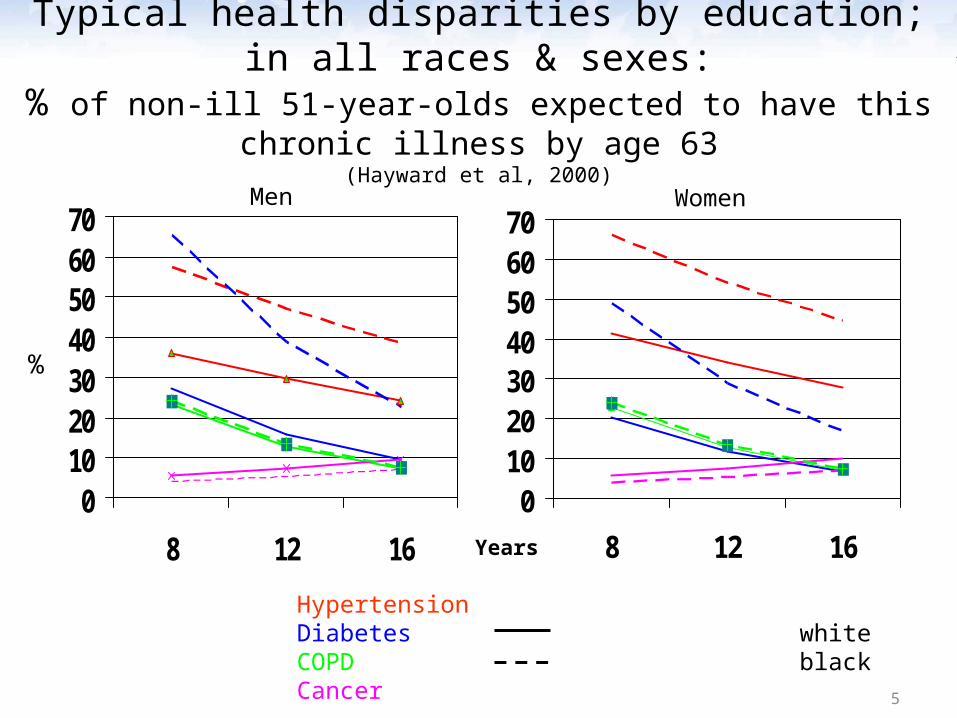
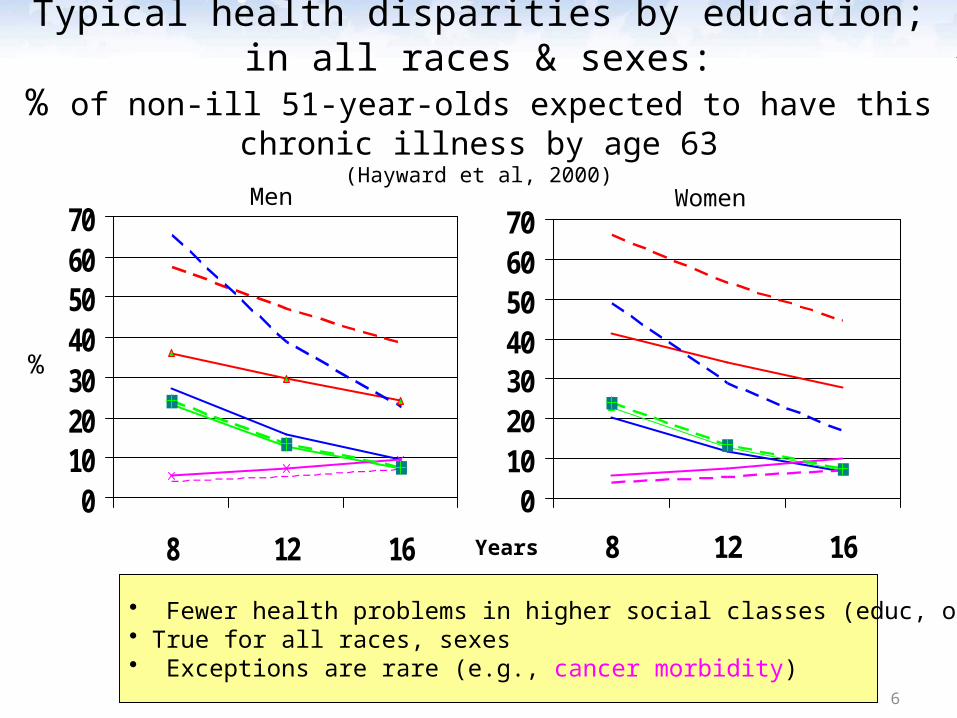
Typical health disparities by education; in all races & sexes:% of non-ill 51-year-olds expected to have this chronic illness by age 63
(Hayward et al, 2000)
010203040506070
8 12 160
10203040506070
8 12 16
HypertensionDiabetes whiteCOPD blackCancer
Men Women
%
Years
6
Typical health disparities by education; in all races & sexes:% of non-ill 51-year-olds expected to have this chronic illness by age 63
(Hayward et al, 2000)
010203040506070
8 12 160
10203040506070
8 12 16
HypertensionDiabetes whiteCOPD blackCancer
Men Women
%
• Fewer health problems in higher social classes (educ, occup, or $)• True for all races, sexes • Exceptions are rare (e.g., cancer morbidity)
Years

7
Disparities in health behavior by education; all races & sexes: % who smoke, 2006 (age adjusted)(CDC, Health in the United States, 2008, Table 64)
0
5
10
15
20
25
30
35
40
<Diploma HS diploma Some college BA+
%
White female
Black female
White males
Black males
%
8
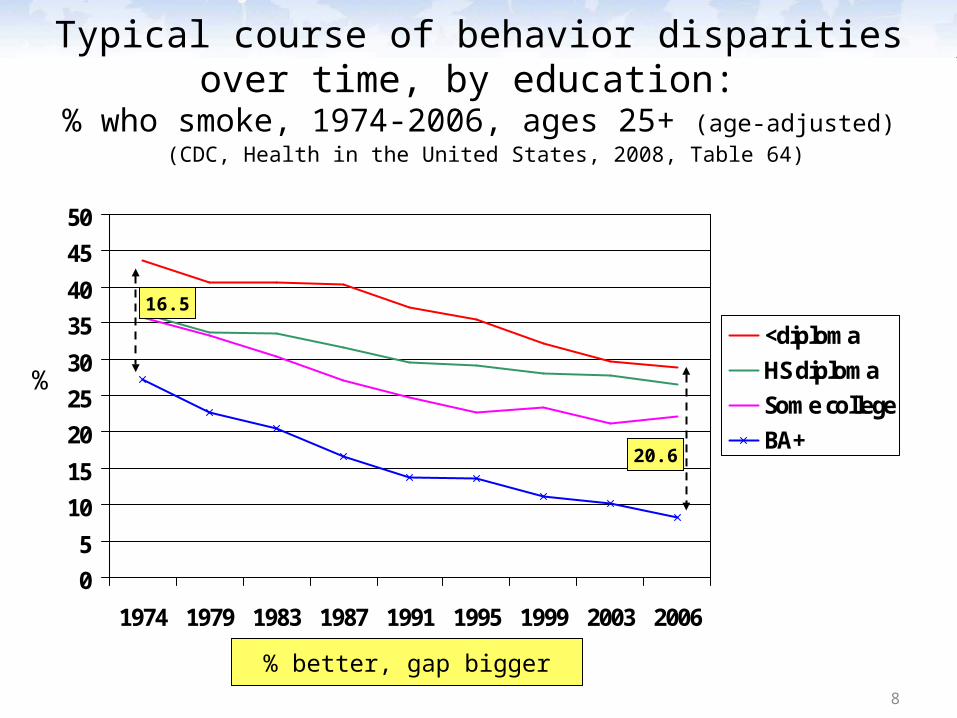
Typical course of behavior disparities over time, by education:
% who smoke, 1974-2006, ages 25+ (age-adjusted) (CDC, Health in the United States, 2008, Table 64)
05
1015
202530
3540
4550
1974 1979 1983 1987 1991 1995 1999 2003 2006
<diplomaHS diplomaSome collegeBA+
16.5
20.6
% better, gap bigger
%
99
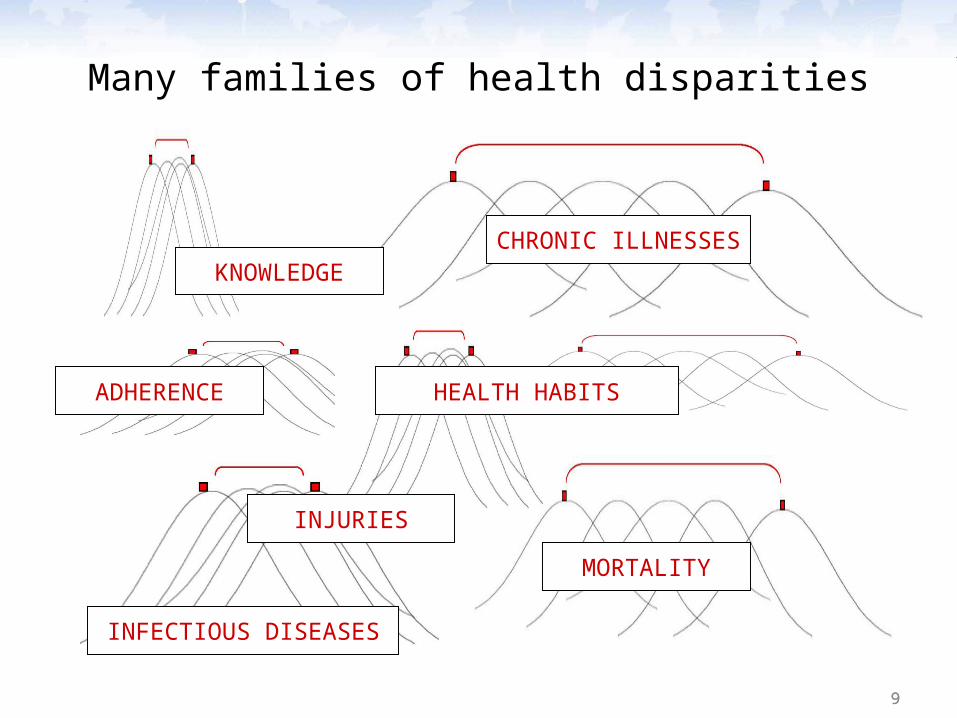
Many families of health disparities
HEALTH HABITS
MORTALITY
KNOWLEDGECHRONIC ILLNESSES
INJURIES
INFECTIOUS DISEASES
ADHERENCE

1010
Many families of health disparities
HEALTH HABITS
MORTALITY
KNOWLEDGECHRONIC ILLNESSES
INJURIES
INFECTIOUS DISEASES
ADHERENCE Outcomes for populations

1111
a
b
c
d
d
fg
This is not about individual differences in health outcomes
Not “explaining” within-group variation
Within-group and between-group variance may arise from different mix of causesOften misunderstood!

12
Study of populations aided by epidemiological approach
• Outcomeso Means, rates, relative risk, odds ratios for groups
• Predictors—classic trioo Exposure to hazards, help (probability)o Host (susceptibility)o Vector (virulence, burden)

13
Study of populations aided by epidemiological approach
• Outcomeso Means, rates, relative risk, odds ratios for groups
• Predictors—classic trioo Exposure (probability)o Host (susceptibility)o Vector (virulence, burden) Missing 2/3
Current focus of SES disparities research
1414
1. What are “disparities”? 2. Why such a vexing puzzle?
But first, what exactly are we trying to explain?Statistically• Substantively
3. Is human cognitive diversity the key to solving it?
4. If yes, so what?
Agenda
Illustration
1515
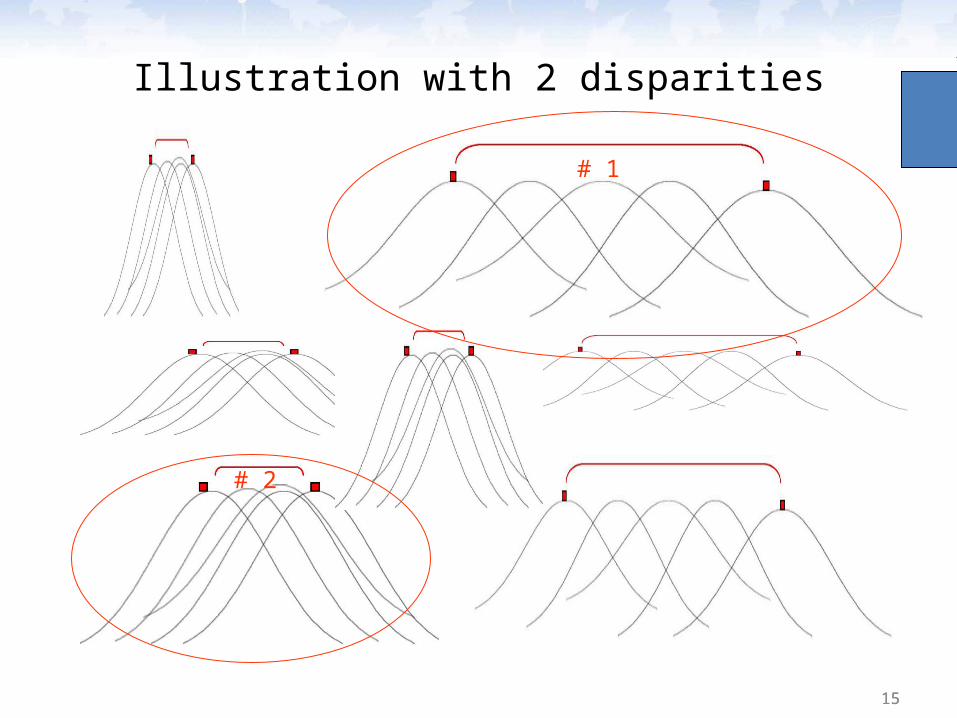
Illustration with 2 disparities
# 1
# 2

1616
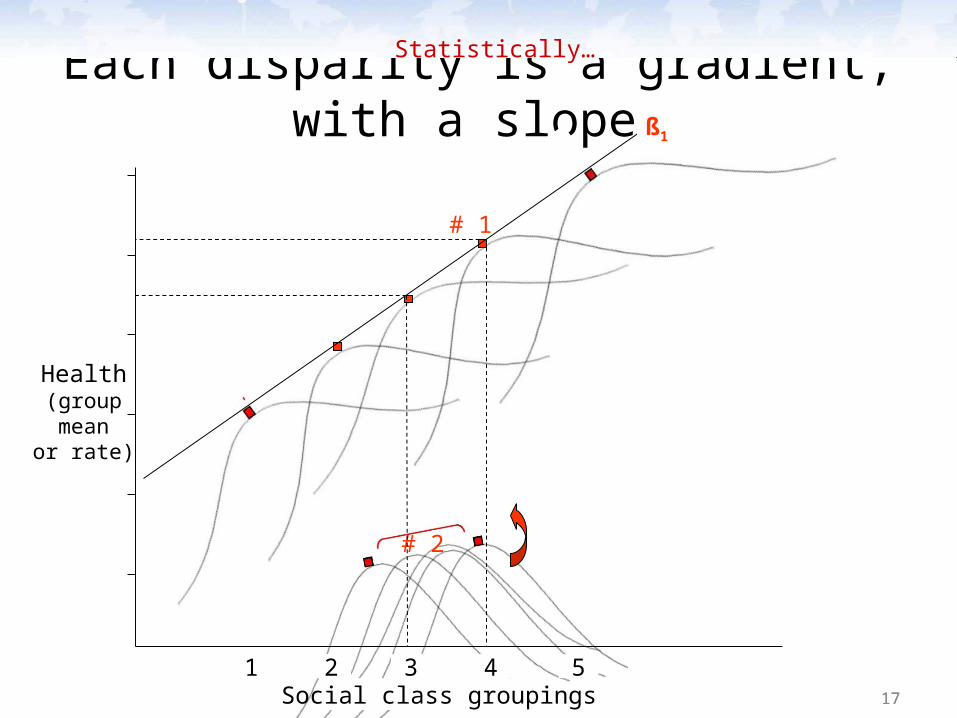
1 2 3 4 5Social class groupings
Health(groupmean
or rate)
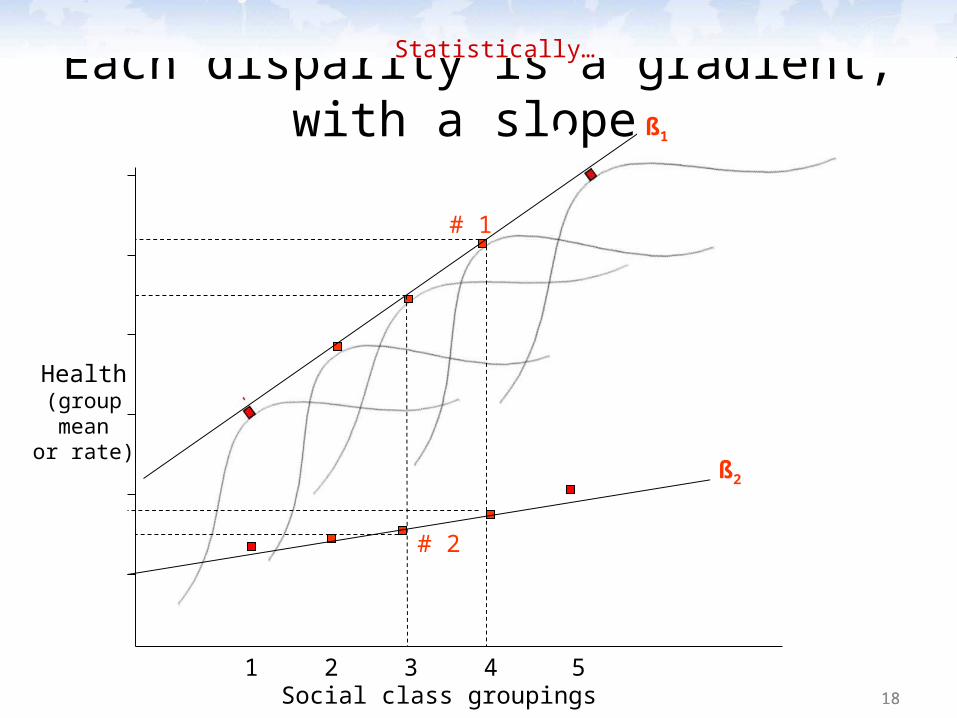
Each disparity is a gradient, with a slope (ß) Statistically…
# 1
ß1
1717
1 2 3 4 5Social class groupings
Health(groupmean
or rate)
Each disparity is a gradient, with a slope Statistically…
# 2
# 1
ß1
1818
1 2 3 4 5Social class groupings
Health(groupmean
or rate)
Each disparity is a gradient, with a slope Statistically…
# 2
# 1
ß1
ß2
1919
1 2 3 4 5Social class groupings
Health(groupmean
or rate)
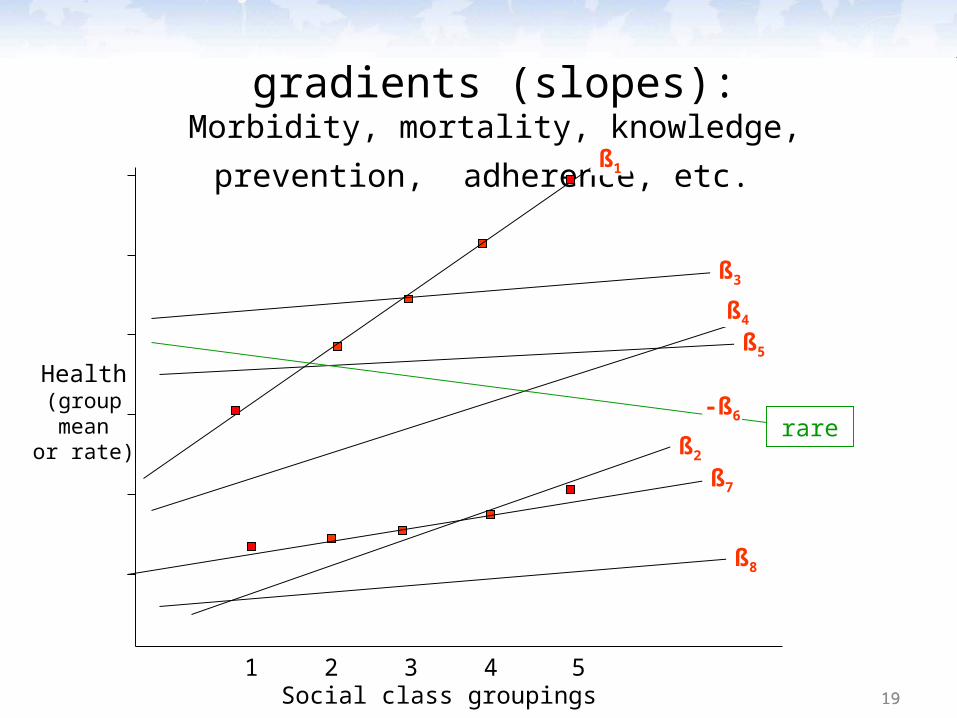
Many families of health gradients (slopes):Morbidity, mortality, knowledge, prevention, adherence, etc.
rare
ß1
ß8
ß7
-ß6
ß5
ß4
ß3
ß2
2020
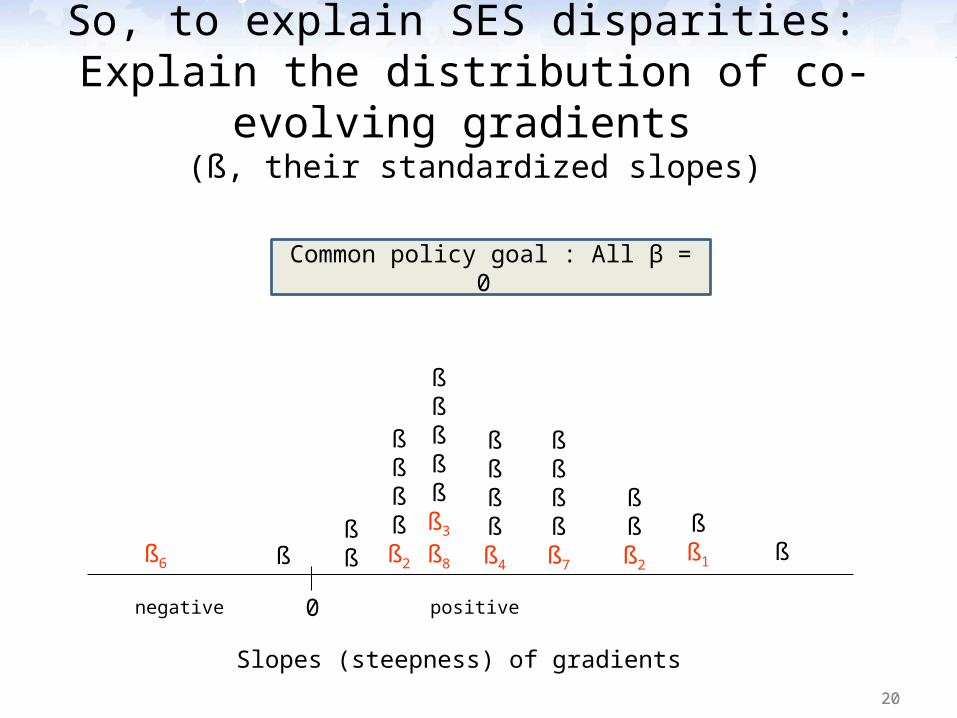
So, to explain SES disparities: Explain the distribution of co-evolving gradients
(ß, their standardized slopes)
ß ß ßßßß3
ß8
ßßßßß4
ßßß2ß6 ß
ßß
ßßßßß7
ßßßßß2
ßß1 ß
0
Slopes (steepness) of gradients
negative positive
Common policy goal : All β = 0

2121
1. What are “disparities”? 2. Why such a vexing puzzle?
But first, what exactly are we trying to explain?• StatisticallySubstantively
3. Is human cognitive diversity the key to solving it?
4. If yes, so what?
Agenda
Examples
2222
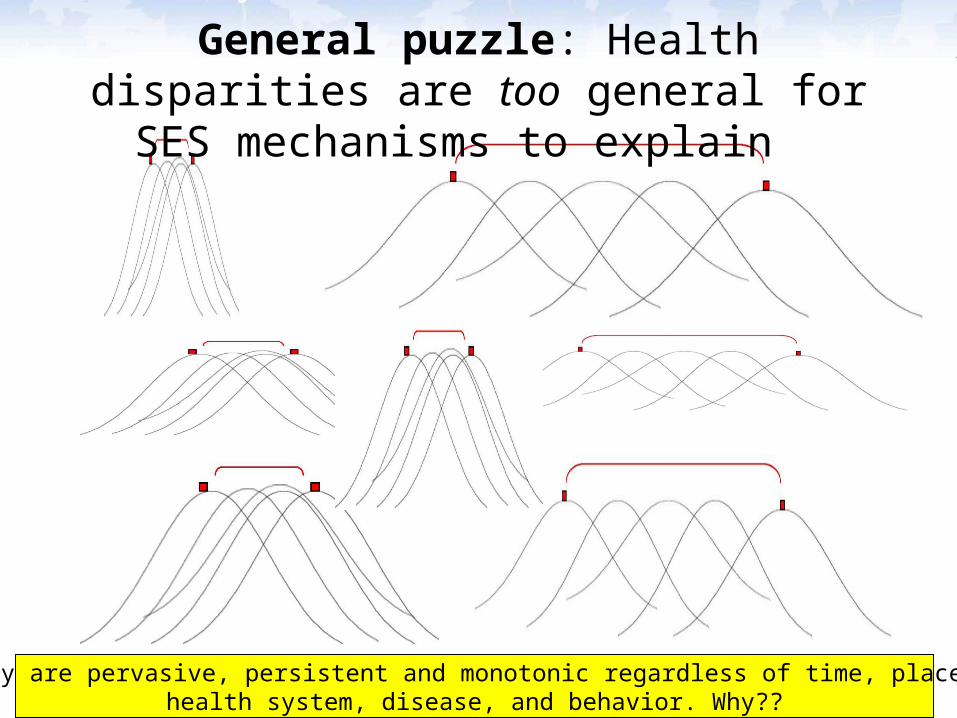
General puzzle: Health disparities are too general for SES mechanisms to explain
They are pervasive, persistent and monotonic regardless of time, place, health system, disease, and behavior. Why??

2323
Exposure hypothesis 1: “Wealth = health” (can afford good care)
health
wealth
No leveling off when resources are more
than sufficient
REJECTED—
Puzzle greater!

2424
Experimental test of exposure hypothesis 1: Equalize access to care equalize health
• Time 1: Unequal access
• Time 2: After equal access (free care)
Health disparities grow, not shrink
FAILED—Puzzle
greater!
E.g., UK in 1950s

2525
Experimental test of exposure hypothesis 2:Unequal education unequal health
• Time 1: Unequal knowledge of signs and symptoms
• Time 2: After public health campaign
Knowledge disparities grow, not shrink
FAILED—Puzzle
greater!

2626
Or disparities even reverse direction with new screening tests (e.g., death rates from breast cancer)
• Negative disparities for Outcome X at Time 1
• Positive disparities for Outcome X at Time 2
ß
-ßMore educated women have higher
death rates

27
Access matters, but so does utilization
Even if equal access
Unequal use & misuse
• Mammograms • Adherence to treatment• Seat belt use• Etc.
“Health literacy”
2828
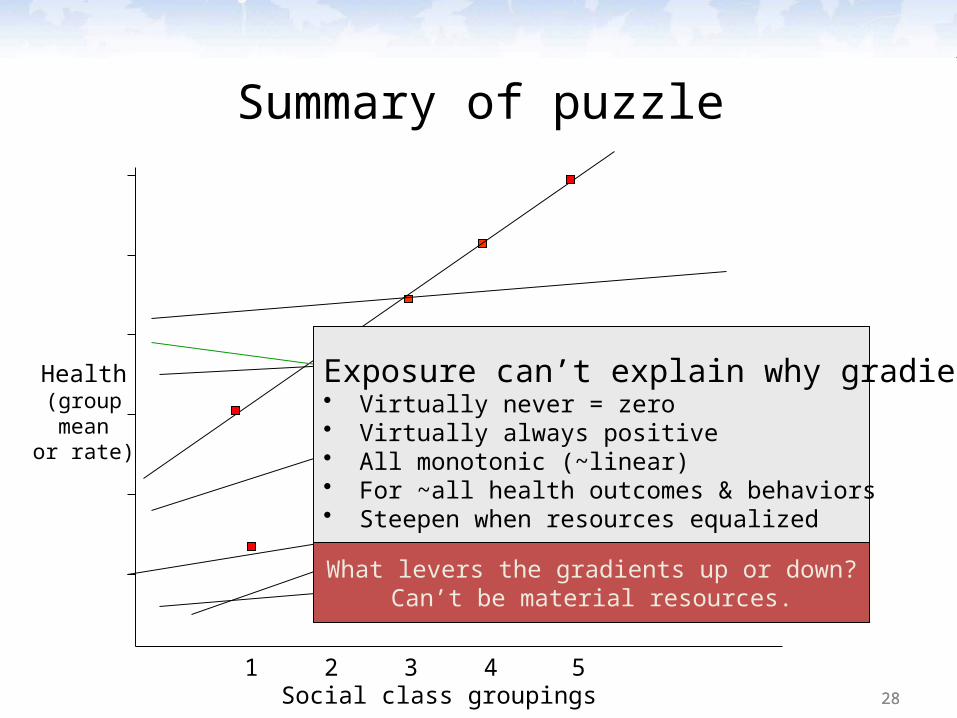
1 2 3 4 5Social class groupings
Health(groupmean
or rate)
Summary of puzzle
rare
Exposure can’t explain why gradients: • Virtually never = zero• Virtually always positive• All monotonic (~linear)• For ~all health outcomes & behaviors• Steepen when resources equalized
What levers the gradients up or down?Can’t be material resources.

2929
So, the field seeking more “fundamental cause” of SES disparities
• This cause must: o be pervasive & domain-general o have linear (monotonic) effectso not be material
• Most popular suspect = inequality itselfo relative deprivation chronic psychological stress damaging physiological process: “allostatic load”
• Stress important, but can’t explain:o why adding resources increases disparitieso disparities in non-biological outcomes

30
0%
20%
40%
60%
80%
100%
1-4 5-9 10-17
18-24
25-44
45-54
55-64
65+
IllnessSuicideHomicide"Accidents"
20062003-2005
Biological mechanismsInvolved here
But not here
First, physical illness is only one cause of injury & death: Causes of death, males by age
(CDC, Health data interactive)
Common theme—all are preventable
31
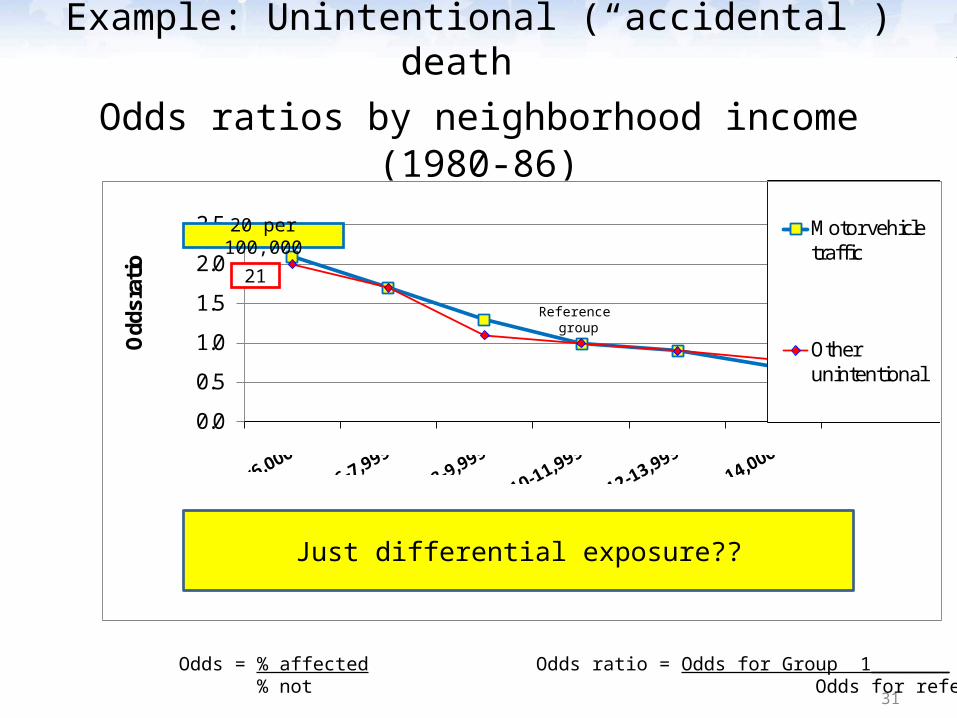
Example: Unintentional (“accidental”) death Odds ratios by neighborhood income (1980-86)
0.0
0.5
1.0
1.5
2.0
2.5
Odd
s rati
o
Neighborhood income/capita
Motor vehicle traffic
Other unintentional
20 per 100,000
21
Reference group
Odds = % affected Odds ratio = Odds for Group 1_______ % not Odds for reference group
Just differential exposure??

32
Selected causes of “motor vehicle traffic” death, by neighborhood income/capita (1980-86)
(Baker, O’Neill, Ginsburg, & Li, 1992)
0
0.5
1
1.5
2
2.5
3
3.5
Neighborhood income/capita
Odd
s ra
tio
Pedestrian, trafficPedestrian, trainPed, off-roadMV occupantMV trainAll MV
20
3.2
15
.20
.18
.26
elderly
adult men
young men
toddlers
young men
young men
Primarily:Rate per 100,000

33
Selected “other” causes of unintentional death, by neighborhood income/capita (1980-86)
(Baker, O’Neill, Ginsburg, & Li, 1992)
0
1
2
3
4
5
6
7
8 Exposure/neglectNatural disasters
Fires/burnsLightning
Motor vehicleDrownChoke on food
Suffocation20.0
2.60
.04
2.30
.06
.38.78
Od
ds
rat
io
Deaths per 100,000
.12
infants, elderly
rises with age
young men
toddlers, elderly
young men
young men
infants, elderly
Infants
Primarily:
Self-exposureDifferential biological susceptivity
34
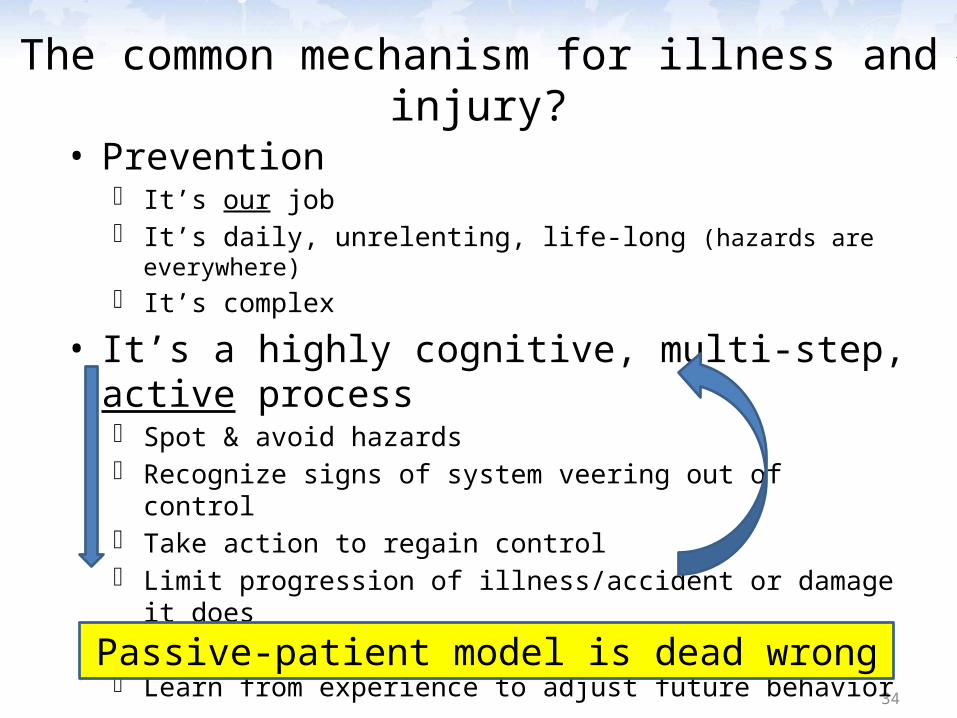
• Preventiono It’s our job o It’s daily, unrelenting, life-long (hazards are everywhere)o It’s complex
• It’s a highly cognitive, multi-step, active processo Spot & avoid hazardso Recognize signs of system veering out of control o Take action to regain controlo Limit progression of illness/accident or damage it doeso Adhere to treatmento Learn from experience to adjust future behavior
The common mechanism for illness and injury?
Passive-patient model is dead wrong

3535
1. What are “disparities”? 2. Why such a vexing puzzle?3. Is human cognitive diversity the key?
4. If yes, so what?
Agenda
IQ/g

3636
Alternative hypothesis for disparities in health: “Intelligence (g) differences are the
“fundamental cause”
Two g–based levers ratchet up gradients*• Bigger IQ differences (people) • Heavier cognitive load (tasks)
susceptibility burden
*Based on extensive research in education & employment

3737Gaps in IQ/g (cognitive susceptibility-efficiency)
Heaviercognitive
load (g loadingof tasks)
Heaviercognitive
load (g loadingof tasks)
ßß
ß
ß ß
ß ß
ß
ß
ß
ßß
ß
Translated: A hypothesis about gradients
3838
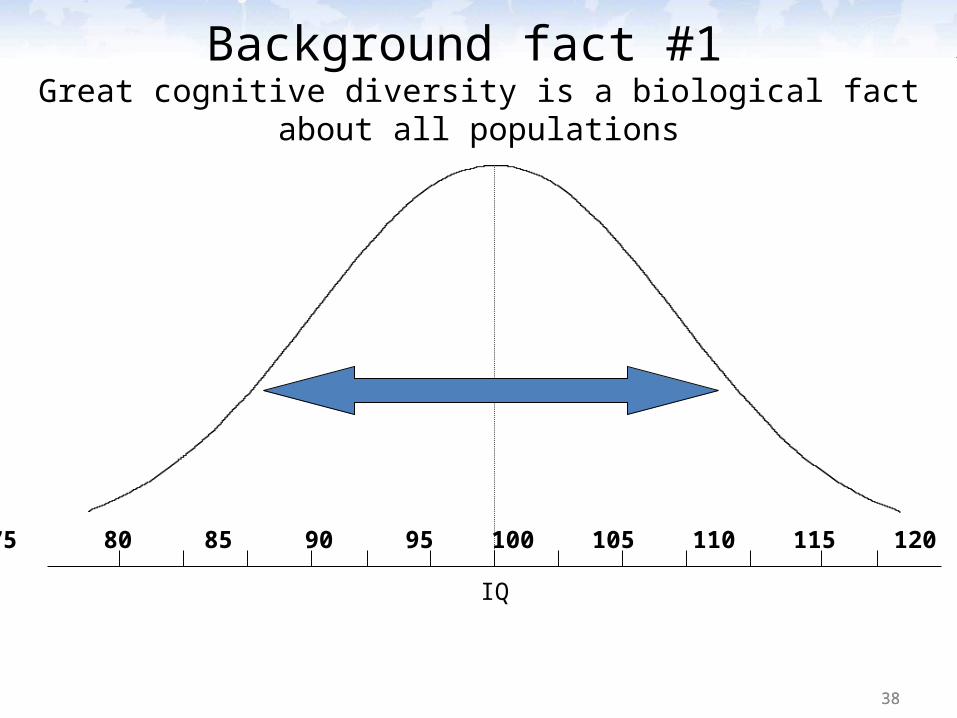
Background fact #1 Great cognitive diversity is a biological fact about all populations
70 75 80 85 90 95 100 105 110 115 120 125 130
IQ

3939
Background fact #2IQ ≈ g (general mental ability factor)
• g is no longer a black box• g is a domain-general facility for learning, reasoning,
spotting & solving novel problemso Higher g reduces susceptibility to erroro Gives bigger edge as task complexity (cognitive load)
increaseso Allows one to exploit resources more fully & effectively
(e.g., classroom instruction, medical treatments)

4040
Background fact #2IQ ≈ g (general mental ability factor)
• g is no longer a black box• g is a domain-general facility for learning, reasoning,
spotting & solving novel problemso Higher g reduces susceptibility to erroro Gives bigger edge as task complexity (cognitive load)
increaseso Allows one to exploit resources more fully & effectively
(e.g., classroom instruction, medical treatments)

4141
Gives an edge in planning; anticipating problems

4242
Background fact #3 Mean IQs differ by occupation level and years education
70 75 80 85 90 95 100 105 110 115 120 125 130
0-78
9-1112
13-1516+
UnskilledSemiskilled
SkilledManager, Cler, Sales
Professional & TechOccupation:
Years education:
WAIS-R IQ (mean + 1 SD), US adults ages 16-74
IQ
4343
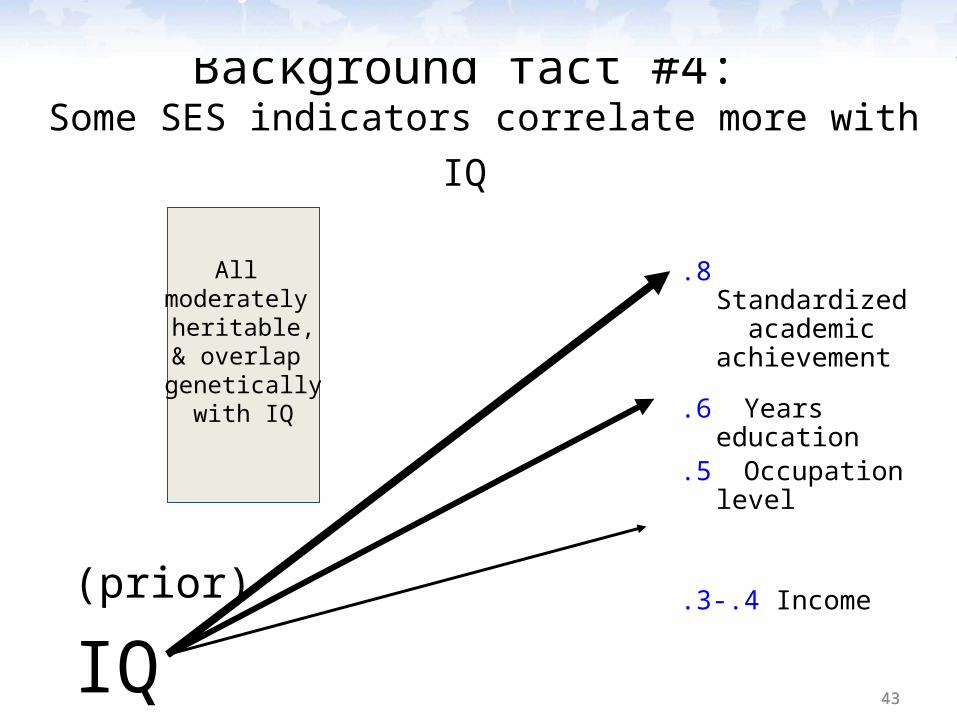
Background fact #4: Some SES indicators correlate more with IQ
.8 Standardized academic achievement
.6 Years education
.5 Occupation level
.3-.4 Income
(prior)
IQ
All moderately
heritable,& overlap genetically
with IQ
4444
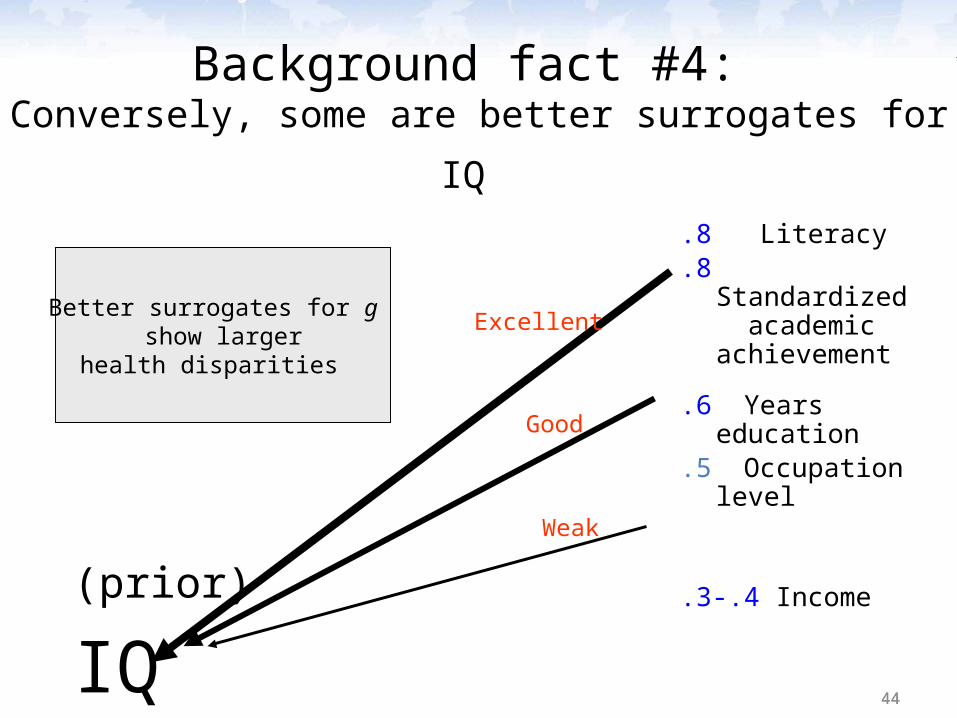
.8 Literacy
.8 Standardized academic achievement
.6 Years education
.5 Occupation level
.3-.4 Income
(prior)
IQ
Excellent
Good
Weak
Background fact #4: Conversely, some are better surrogates for IQ
Better surrogates for g show larger
health disparities

Better surrogates for g show
largerhealth
disparities(steeper
gradients)
45
income
occupation
education
“literacy”
4646
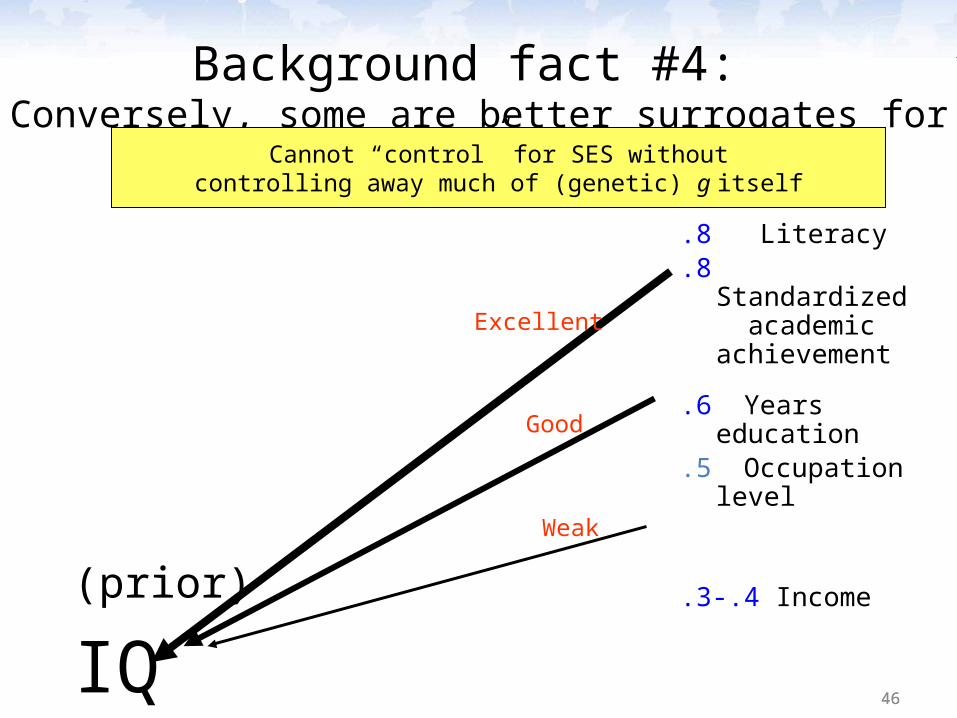
.8 Literacy
.8 Standardized academic achievement
.6 Years education
.5 Occupation level
.3-.4 Income
Excellent
Good
Weak
Background fact #4: Conversely, some are better surrogates for IQ
(prior)
IQ
Cannot “control” for SES withoutcontrolling away much of (genetic) g itself

4747
• Gaps small when learning & reasoning demands are light
• Gaps large when learning & reasoning demands are heavy
Common in schools & jobs
Background fact #5:Task complexity increases gaps in performance

4848
• Gaps small when learning & reasoning demands are light
• Gaps large when learning & reasoning demands are heavy
Common in schools & jobs
Background fact #5:Task complexity increases gaps in performance
Cognitive load brings out differences in cognitive susceptibility
4949
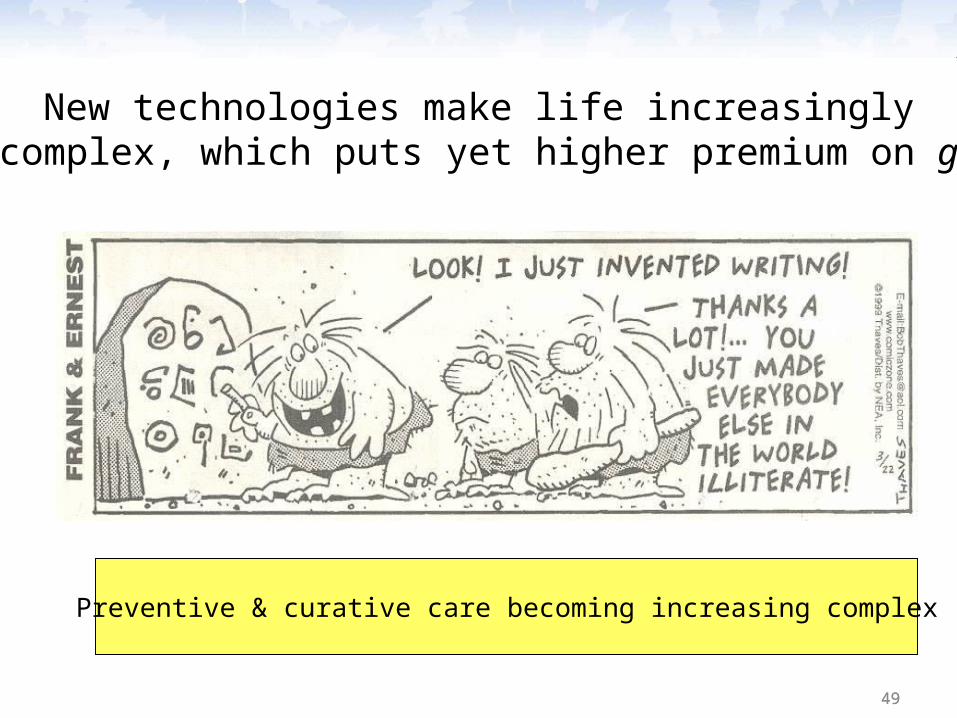
New technologies make life increasinglycomplex, which puts yet higher premium on g
Preventive & curative care becoming increasing complex

5050
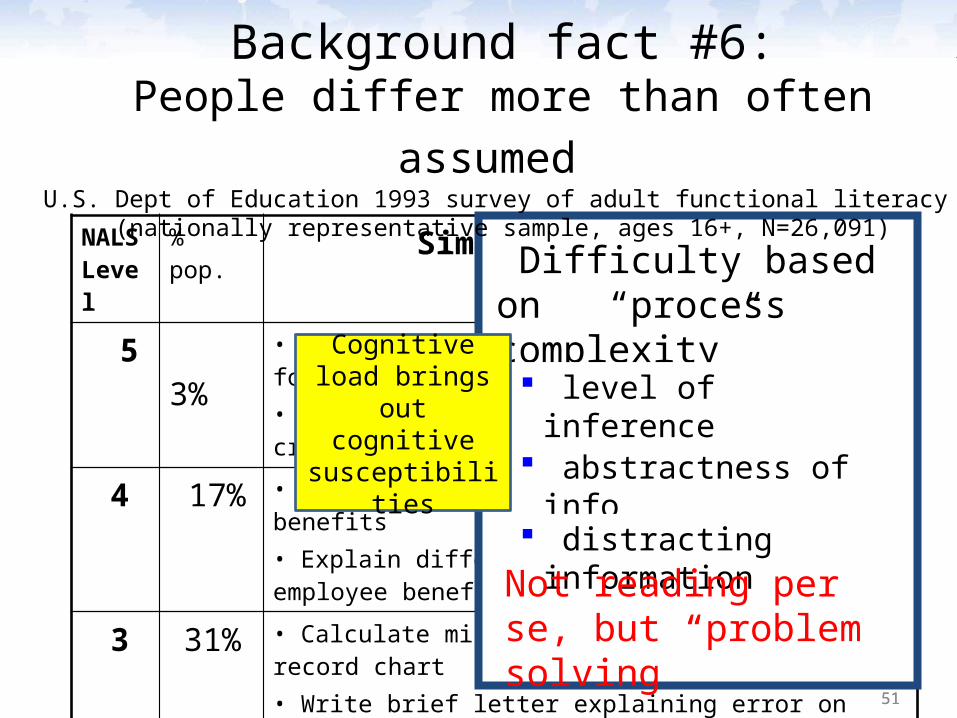
Background fact #6:People differ more than often assumed
U.S. Dept of Education 1993 survey of adult functional literacy (nationally representative sample, ages 16+, N=26,091)
NALS Level
% pop. Simulated Everyday Tasks
5 3%
• Use calculator to determine cost of carpet for a room• Use table of information to compare 2 credit cards
4 17% • Use eligibility pamphlet to calculate SSI benefits• Explain difference between 2 types of employee benefits
3 31% • Calculate miles per gallon from mileage record chart• Write brief letter explaining error on credit card bill
2 27% • Determine difference in price between 2 show tickets• Locate intersection on street map
1 22% •Total bank deposit entry• Locate expiration date on driver’s license
Routinely able to perform tasks only up to this level of difficulty
5151
NALS Level
% pop. Simulated Everyday Tasks
5 3%
• Use calculator to determine cost of carpet for a room• Use table of information to compare 2 credit cards
4 17% • Use eligibility pamphlet to calculate SSI benefits• Explain difference between 2 types of employee benefits
3 31% • Calculate miles per gallon from mileage record chart• Write brief letter explaining error on credit card bill
2 27% • Determine difference in price between 2 show tickets• Locate intersection on street map
1 22% •Total bank deposit entry• Locate expiration date on driver’s license
Difficulty based on “process complexity”
level of inference
abstractness of info
distracting information
Not reading per se, but “problem solving”
Background fact #6:People differ more than often assumed
U.S. Dept of Education 1993 survey of adult functional literacy (nationally representative sample, ages 16+, N=26,091)
Cognitive load brings out cognitive
susceptibilities

5252
Item at NALS Level 1
• Literal match• One item• Little distracting
info
22% of US adults78% of adults do better
80% probability of correctly answering items of this difficulty level
*
*

5353
Item at NALS Level 2
X
• Simple inference• Little distracting information
27% of US adults 51%22%

5454
Another item at NALS Level 227% of US adults
• Match two pieces of info
51%22%

5555
Item at NALS Level 331% of US adults
• Cycle through complex table
• Irrelevant info
20%49%
5656
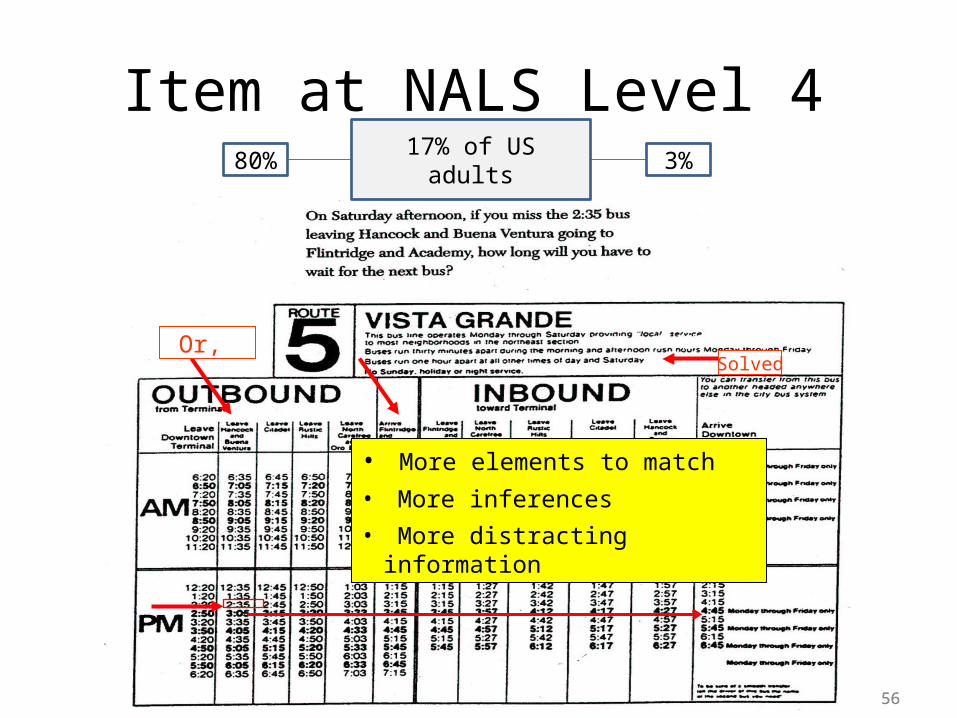
Item at NALS Level 4
• More elements to match• More inferences • More distracting information
3%80% 17% of US adults
SolvedOr,
5757
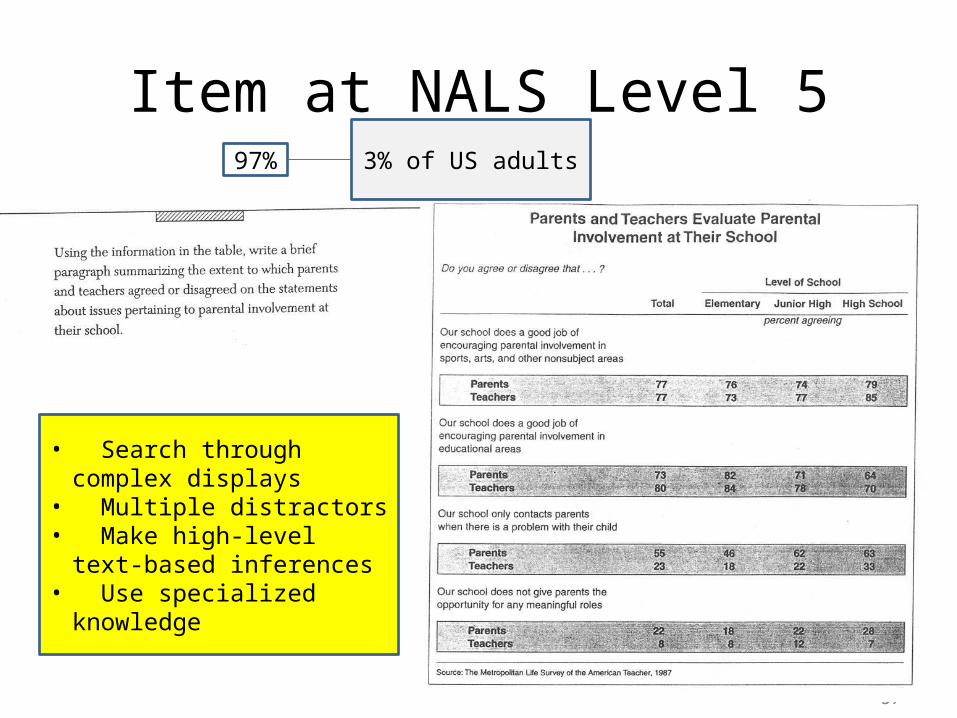
Item at NALS Level 597%
• Search through complex displays
• Multiple distractors• Make high-level text-based
inferences• Use specialized knowledge
3% of US adults
5858
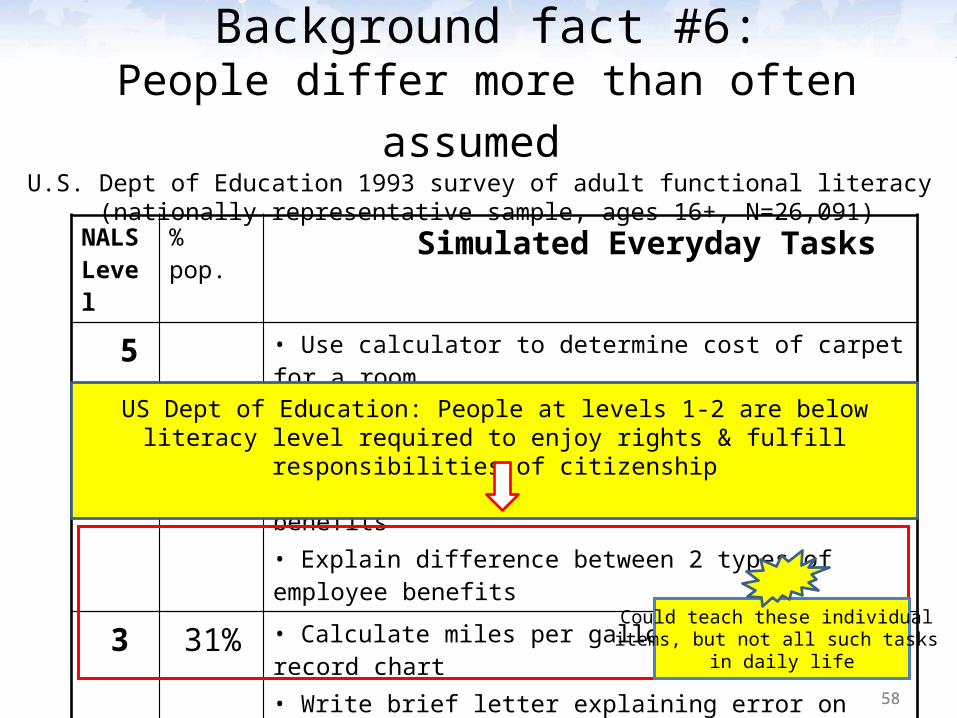
NALS Level
% pop. Simulated Everyday Tasks
5 3%
• Use calculator to determine cost of carpet for a room• Use table of information to compare 2 credit cards
4 17% • Use eligibility pamphlet to calculate SSI benefits• Explain difference between 2 types of employee benefits
3 31% • Calculate miles per gallon from mileage record chart• Write brief letter explaining error on credit card bill
2 27% • Determine difference in price between 2 show tickets• Locate intersection on street map
1 22% •Total bank deposit entry• Locate expiration date on driver’s license
US Dept of Education: People at levels 1-2 are below literacy level required to enjoy rights & fulfill responsibilities of citizenship
Could teach these individual items, but not all such tasks
in daily life
Background fact #6:People differ more than often assumed
U.S. Dept of Education 1993 survey of adult functional literacy (nationally representative sample, ages 16+, N=26,091)
5959
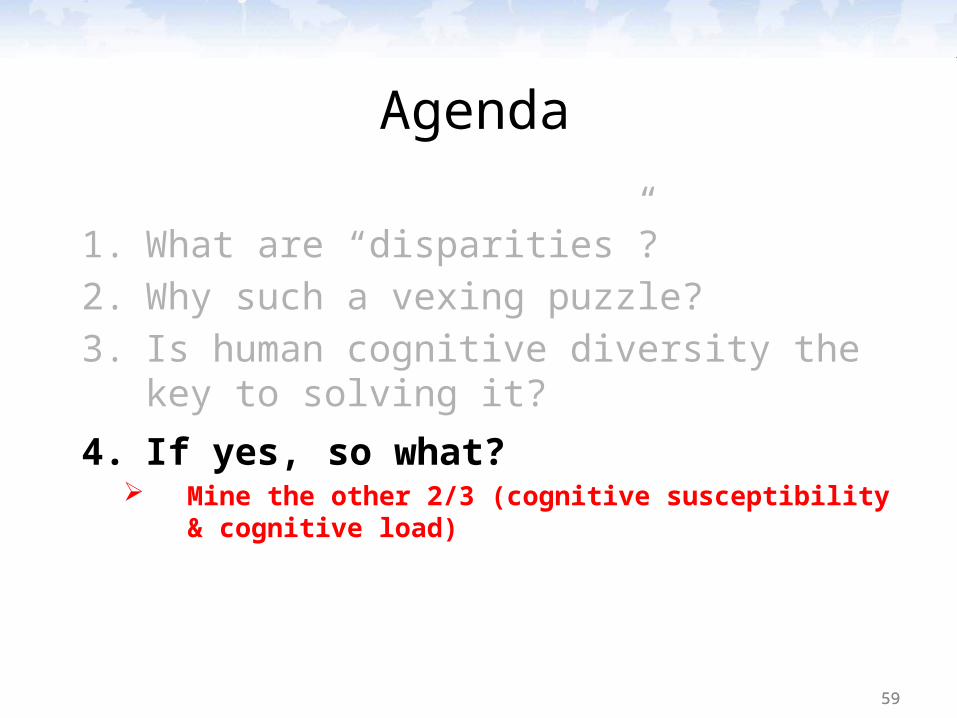
1. What are “disparities”? 2. Why such a vexing puzzle?3. Is human cognitive diversity the key to solving it?
4. If yes, so what? Mine the other 2/3 (cognitive susceptibility & cognitive load)
Agenda
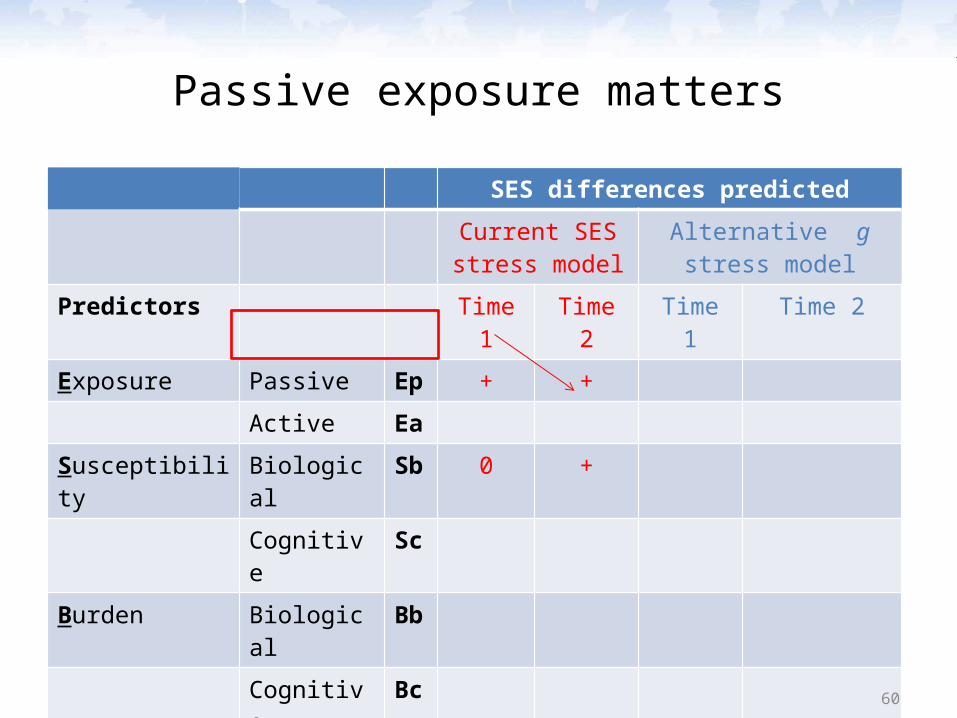
Passive exposure matters
SES differences predicted
Current SES stress model
Alternative g stress model
Predictors Time 1 Time 2 Time 1 Time 2
Exposure Passive Ep + +
Active Ea
Susceptibility Biological Sb 0 +
Cognitive Sc
Burden Biological Bb
Cognitive Bc
Health outcomes Physiological Yp 0 +
Behavioral Yb
mechanism Y = ∑Ep60

But so does g-based self-exposure, susceptibility, & cognitive load
SES differences predicted
Current SES stress model
Alternative g stress model
Predictors Time 1 Time 2 Time 1 Time 2
Exposure Passive Ep + + + +
Active Ea + +
Susceptibility Biological Sb 0 + ? +
Cognitive Sc + +
Burden Biological Bb ? ?
Cognitive Bc ? +
Health outcomes Physiological Yp 0 + ? ++
Behavioral Yb ++
mechanism Y = ∑Ep Y = ∑E(S)(B)61
SES differences predicted
Current SES stress model
Alternative g stress model
Predictors Time 1 Time 2 Time 1 Time 2
Exposure Passive Ep
Active Ea
Susceptibility Biological Sb
Cognitive Sc
Burden Biological Bb
Cognitive Bc
Health outcomes Physiological Yp
Behavioral Yb
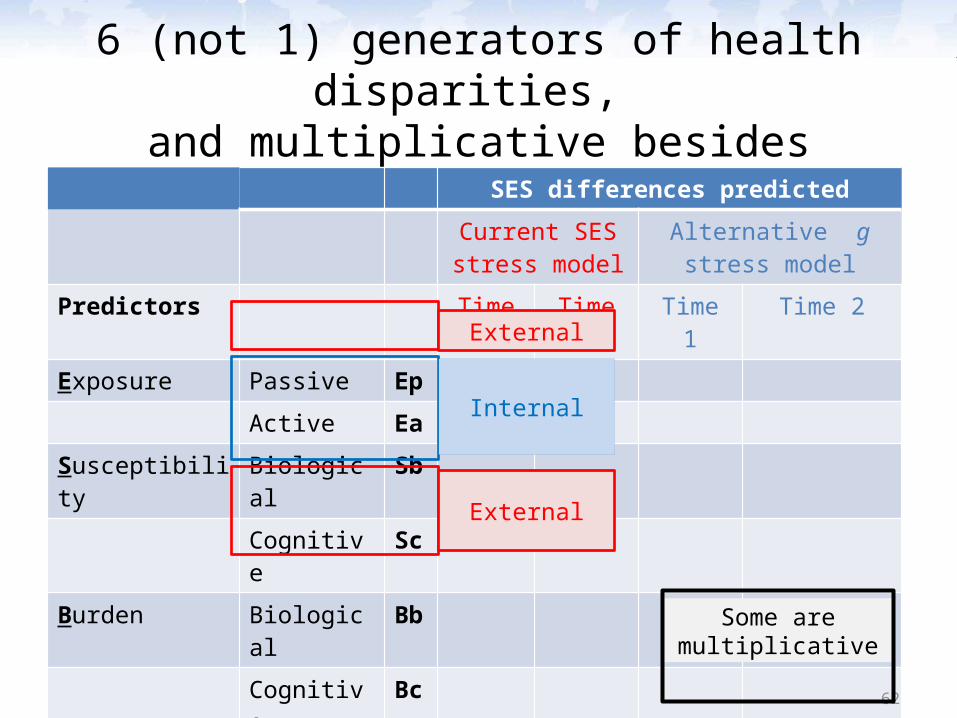
mechanism Y = ∑Ep Y = ∑E(S)(B)62
Internal
External
External
Some are multiplicative
6 (not 1) generators of health disparities, and multiplicative besides

2 new points of leverage
SES differences predicted
Current SES stress model
Alternative g stress model
Predictors Time 1 Time 2 Time 1 Time 2
Exposure Passive Ep
Active Ea
Susceptibility Biological Sb
Cognitive Sc
Burden Biological Bb
Cognitive Bc
Health outcomes Physiological Yp
Behavioral Yb
mechanism Y = ∑Ep Y = ∑E(S)(B)63
Internal
External
External
#1
#2
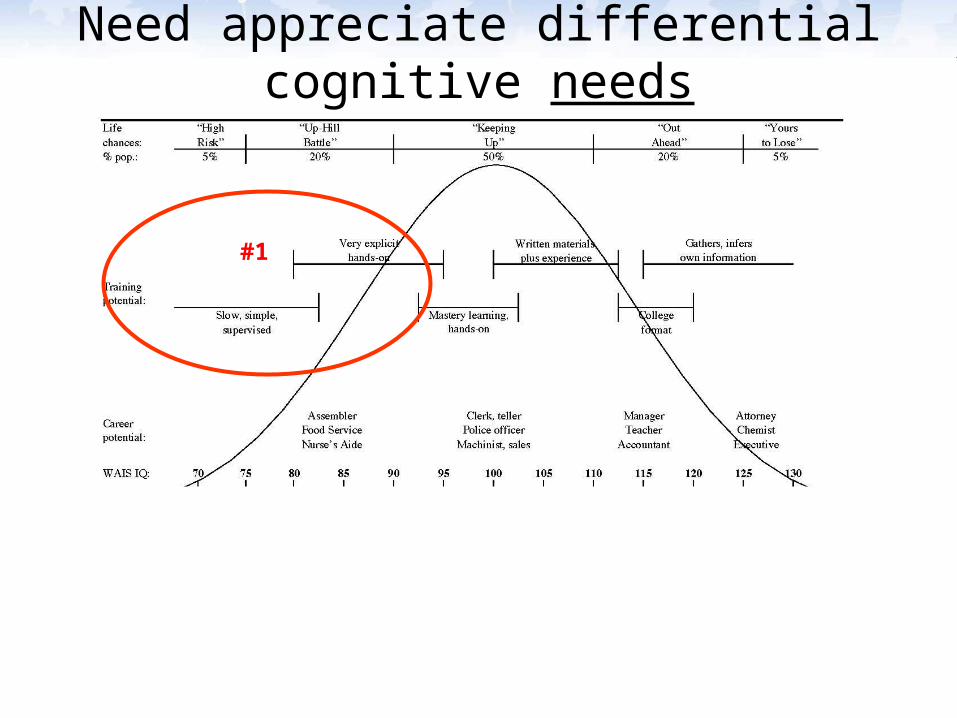
Respect diversity of needs
Lighten the load
6464
Need appreciate differential cognitive needs
#1

6565
Need appreciate size of cognitive burdens
Example: Do job analysis of chronic diseases
Diabetes?
#2

6666
Guidance for providers?E.g., Matrices of cognitive risk
IQ IQ
Lo
Hi
Lo
Hi
Lo Hi
• Some errors more dangerous• But all cumulate
Triage
Task complexity
Error rates to expect by patient susceptibility task cognitive load
#1
#2
#1#2
6767
Conclusions• Key mechanisms unrecognized• Mechanisms highly exploitable• Huge opportunity costs
o For national policyo For clinic practiceo For vulnerable populations
American Psychological Association
6868
Thank You
Linda S. Gottfredson, ProfessorUniversity of Delaware
http://www.udel.edu/educ/gottfredson
[email protected](302) 831-1650
American Psychological Association