1.1 functions - cloud object storage | store & retrieve … vertical line test is a handy way to...
TRANSCRIPT

1.1 Functions
Function
Function: A rule for a relationship between an input, or independent, quantity and an output, or dependent,
quantity in which each input value uniquely determines one output value. We say “the output is a function of
the input.”
Input (Independent or x) and output (Dependent or y) of a function
Ex:
Ex. Is {(1,3), (2,3), (3,3)} a function? Ex. Is {(3,-1), (3,-3), (3,4)} a function?
Ex. If y = x2, is y a function of x? Ex. If y2 = x, is y a function of x?
One-to-One Function
Sometimes in a relationship each input corresponds to exactly one output, and every output corresponds to
exactly one input. We call this kind of relationship a one-to-one function.
Ex. Is {(-1,2), (2,3), (3,4)} a one-to-one function? Ex. Is {(1,-3), (2,3), (3,-3)} a one-to-one function?
Domain:
The set of all inputs
Range:
The set of all outputs Function
Rule
Input Function Rule
Double the input
Output Ordered pair
-2
0
2

Graph as Functions Ex. Graph the set of points {(1,3), (2,3), (3,3)}: Ex. Graph the set of points {(3,-1), (3,-3), (3,4)}:
Vertical Line Test
The vertical line test is a handy way to think about whether a graph defines the vertical output as a function of
the horizontal input. Imagine drawing vertical lines through the graph. If any vertical line would cross the
graph more than once, then the graph does not define only one vertical output for each horizontal input.
One-to-one function: Ex. Graph the set of points {(-1,2), (2,3), (3,4)}: Ex. Graph the set of points {(1,3), (2,3), (3,3)}:
Horizontal Line Test
Once you have determined that a graph defines a function, an easy way to determine if it is a one-to-one
function is to use the horizontal line test. Draw horizontal lines through the graph. If any horizontal line
crosses the graph more than once, then the graph does not define a one-to-one function.
Ex 5. Select all of the following graphs which represent y as a function of x.
a b c
d e f

Function Notation
The notation output = f(input) defines a function named f. This would be read “output is f of input”
Ex1. The amount of garbage, G, produced by a city with population p is given by ( )G f p . G is measured in tons per
week, and p is measured in thousands of people.
a. The town of Tola has a population of 40,000 and produces 13 tons of garbage each week. Express this
information in terms of the function f.
b. Explain the meaning of the statement 5 2f .
Ex4. Let ( )h t be the height above ground, in feet, of a rocket t seconds after launching.
What is the input? _________ What is the unit of the input? ______ What is the output? ____________
Explain the meaning of each statement:
a. 1 200h b. 500 h
Ex20. Based on the table below,
a. Evaluate (8)f b. Solve 7 ) ( xf
x 0 1 2 3 4 5 6 7 8 9
( )f x 62 8 7 38 86 73 70 39 75 34
Ex 15. Given each function ( )f x graphed, evaluate )0(f , (1)f and (3)f
Ex 17. Given the function ( )g x graphed here,
a. Evaluate (2)g
b. Solve 2g x
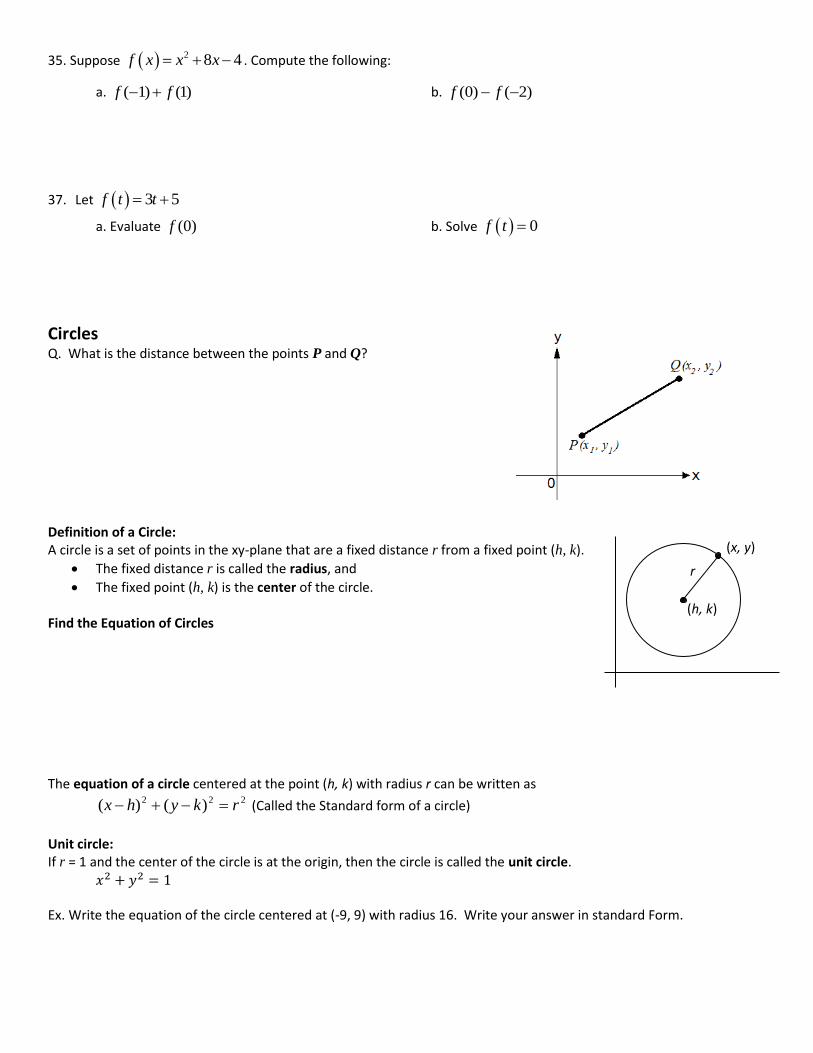
35. Suppose 2 8 4f x x x . Compute the following:
a. ( 1) (1)f f b. )2()0( ff
37. Let 3 5f t t
a. Evaluate (0)f b. Solve 0f t
Circles Q. What is the distance between the points P and Q? Definition of a Circle: A circle is a set of points in the xy-plane that are a fixed distance r from a fixed point (h, k).
The fixed distance r is called the radius, and
The fixed point (h, k) is the center of the circle. Find the Equation of Circles The equation of a circle centered at the point (h, k) with radius r can be written as
222 )()( rkyhx (Called the Standard form of a circle)
Unit circle: If r = 1 and the center of the circle is at the origin, then the circle is called the unit circle. 𝑥2 + 𝑦2 = 1 Ex. Write the equation of the circle centered at (-9, 9) with radius 16. Write your answer in standard Form.
r
(h, k)
(x, y)

1.2 Domain and Range
Domain and Range
Domain: The set of possible input values to a function
Range: The set of possible output values of a function
Ex. Is {(4,-3), (5,4), (6,-3)} a function? Ex. Is {(1,-1), (3,-3), (1,4)} a function?
Ex. Find the domain and range of the following Table?
x 2 8 8
y 5 6 13
Domain and Range of a graph
Notation for Domain and Range
Inequality Set Builder Notation Interval notation
5 10h | 5 10h h (5, 10]
5 10h | 5 10h h [5, 10)
5 10h | 5 10h h (5, 10)
10h | 10h h ( ,10)
10h | 10h h [10, )
all real numbers hh | ( , )
Combining two intervals together:
As an inequality it is: 1 3 or 5x x
In set builder notation: |1 3 or 5x x x
In interval notation: [1,3] (5, )
a b
d
c
Domain: __________________
Range: ____________________
Domain:_________________
Range:__________________
Domain:_________________
Range:__________________
Domain:_________________
Range:__________________

Is the graph a function? ___________________
Domain: _________________________________
Range: ___________________________________
Is the graph a function? ___________________
Domain: _________________________________
Range: ___________________________________
Is the graph a function? ___________________
Domain: _________________________________
Range: ___________________________________
Is the graph a function? ___________________
Domain: _________________________________
Range: ___________________________________

Finding the Domain of a Function The Domain of most frequently used Mathematical functions, like linear, quadratic, and exponential functions, is the set of all real numbers. However, the following situations are not:
A zero in the denominator, such as , and
A negative value under an even root symbol, such as √𝑥4
.
a. 𝑓(𝑥) = 𝑥2 + 2
b.
c.
d. 𝑖(𝑥) = √𝑥 − 4
e.
f.
Is the graph a function? ___________________
Domain: _________________________________
Range: ___________________________________
Is the graph a function? ___________________
Domain: _________________________________
Range: ___________________________________
1
𝑥 + 1
𝑔(𝑥) =𝑥2
𝑥2 + 1
ℎ(𝑥) =𝑥2
𝑥2 − 1
𝑘(𝑥) =√4 − 𝑥
𝑥2 − 25 𝑗(𝑥) =
√3𝑥 + 9
𝑥 − 5

𝑓(𝑥) = {
𝑥 + 4, 𝑖𝑓 𝑥 < −22, 𝑖𝑓 −2 ≤ 𝑥 ≤ 2
−𝑥
2, 𝑖𝑓 2 < 𝑥 ≤ 4
Piecewise Defined Functions A piecewise defined function is a function that is defined by different formulas on different parts of its domain.
Ex. Given each function, evaluate: ( 1)f , (0)f , (2)f , (4)f
22. 34 1
1 1
x if xf x
x if x
24.
3 1 0
4 0 3
3 1 3
x if x
f x if x
x if x
Graph a piecewise defined function: (Find the Domain and Range of the functions)
Ex.
,1
,
x
xxf
if
if
1
1
x
x
,
,
,42
x
xxf
if
if
if
2
22
.2
x
x
x

1.3 Rates of Change and Behavior of Graphs
Rate of Change
A rate of change describes how the output quantity changes in relation to the input quantity. The units on a rate
of change are “output units per input units” Some other examples of rates of change would be quantities like:
A population of rats increases by 40 rats per week
A barista earns $9 per hour (dollars per hour)
Average Rate of Change
The average rate of change between two input values is the total change of the function values (output values)
divided by the change in the input values.
Average rate of change = Input of Change
Output of Change=
12
12
xx
yy
x
y
Average Rate of Change using Function Notation
Given a function f(x), the average rate of change on the interval [a, b] is
Average rate of change = ab
afbf
)()(
Input of Change
Output of Change
Ex2. Find the average rate of change of the following functions:
a. xxxf 2)( on the interval [1, 9] b. 4)( xxxg on the interval [-1. 3]
Ex 1.
Ex 1a. Ex 1b.

c. 24)( xxi on the interval [1, 1+h] d. 123 2 xxxf on the interval ],[ haa
e. 432 2 xxxg on the interval [𝑥, 𝑥 + ℎ] f. 2)( 3 xxj on the interval ],[ haa
g. 523 xxxi on the interval [𝑥, 𝑥 + ℎ] h. x
xs5
3 on the interval [𝑥, 𝑥 + ℎ]

Local Extrem
A point where a function changes from increasing to decreasing is
called a local maximum.
A point where a function changes from decreasing to increasing is
called a local minimum.
Together, local maxima and minima are called the local extrema, or
local extreme values, of the function.
Note: f is increasing on (𝑎, 𝑏) and (𝑐, 𝑑).
f is decreasing on (𝑏, 𝑐)
Ex 3. Ex 4.
a. b.

Concavity
A function is concave up if the rate of change is increasing.
A function is concave down if the rate of change is decreasing.
A point where a function changes from concave up to concave down or vice versa is called an inflection point.
Graphically, concave down functions bend downwards like a frown, and concave up function bend upwards like a smile.
Ex 6. Examine the graph of the function and find the interval that is (a)concave up, (b)concave down and (c)the
approximate coordinates, ( x, y), of all points of inflection (if any).
Concave up_________________________ Concave down ______________________ Point of inflection ___________________ Show Behaviors of the Toolkit Functions on P.43 and show how to use calculator to graph and estimate the local extrema (like the problem 40). Use a graph to estimate the local extrema and inflection points of each function, and to estimate the intervals on which
the function is increasing, decreasing, concave up, and concave down.
Larger increase
Smaller increase
Smaller increase Larger
increase
Increasing Decreasing
Concave Down
Concave Up
40. tttk 3/23)(

1.4 Composition of Functions
Composition of Functions
When the output of one function is used as the input of another, we call the entire operation a composition of
functions. We write f(g(x)), and read this as “f of g of x” or “f composed with g at x”.
An alternate notation for composition uses the composition operator:
))(( xgf is read “f of g of x” or “f composed with g at x”, just like f(g(x)).
Ex5) If 22 xxf and 2 xxg , then find
a) 𝑓(𝑔(4))
b) 𝑔(𝑓(2))
c) 4ff
d) 1gf
e) xgf (Also find its domain)
f) xfg (Also find its domain)
Ex1.
The domain of gf is the set of all x in the domain of 𝑔 such
that 𝑔(𝑥) is in the domain of 𝑓. In other words, xgf is
defined whenever both 𝑔(𝑥) and 𝑓(𝑔(𝑥)) are defined.
Domain
𝑔(𝑥) A
𝑓(𝑔(𝑥)) B
xgf A∩B

For each pair of functions, find f g x and g f x and their domains. Simplify your answers.
22. 1
4f x
x
,
24g x
x
27. If 𝑓(𝑥) = 𝑥4 + 6, 𝑔(𝑥) = 𝑥 − 6 and ℎ(𝑥) = √𝑥, find ( ( ( )))f g h x . (Expand your answer)
Find functions ( )f x and ( )g x so the given function can be expressed as h x f g x .
36. 3
5h x x 38.
2
4
2h x
x

1.5 Transformations of Functions In this section, we will learn to transform what we already know about the formulas or models, the tool-kit functions (P.43), called “parent functions,” into what we need. The transformations that we study are shifting, stretching, and reflecting. Ex1: Fill the tables and sketch the graphs of the equations.
a) 2xy b) 22 xy
Domain:
Range:
𝑔(𝑥) = 𝑓(𝑥) + 2 ℎ(𝑥) = 𝑓(𝑥) − 3
𝑥 𝑦
−2
−1
0
1
2
𝑥 𝑦
−2
−1
0
1
2

Ex2: Graph the equations 2
1 xy , 2
2 3xy and 2
32
1xy using the
tables or calculator and draw a sketch of what you see in the coordinate
system below. Then compare the graphs of 2
2 3xy and 2
32
1xy
compare it with the graph of 2
1 xy . (Domain of 𝑦 is [−2,2])
Domain:
Range:
𝑔(𝑥) = 2𝑓(𝑥) ℎ(𝑥) =
𝑓(𝑥)
2+ 3

Ex3: Fill the tables and sketch the graphs of the equations. Then compare them with the graph of 𝑦 = 𝑥2.
a) 2)2( xy b)
2)3( xy
Domain:
Range:
𝑔(𝑥) = 𝑓(𝑥 + 3) ℎ(𝑥) = 𝑓(𝑥 − 4) − 3
𝑥 𝑦
1
2
3
4
5
𝑥 𝑦
−4
−3
−2
−1
0

Ex4: Graph the equations 2
1 xy , 2
2 2xy and
2
32
xy
using the tables or calculator and draw a sketch of what you see
in the coordinate system below. Then compare the graphs of
2
2 2xy and
2
32
xy compare it with the graph of 2
1 xy .
Domain:
Range:
𝑔(𝑥) = 𝑓(2𝑥)
𝑔(𝑥) = 2𝑓 (𝑥
2) − 2

SUMMARY OF TRANSFORMATIONS: A, B, h, k determine the transformation of a function f(x):
( ) ( )g x Af B x h k where any function 𝑓(𝑥) has been transformed A: Vertical Stretch if A > 1 or Vertical Compression if 0 < A < 1 (Outside changes in y)
-A: would constitute a Vertical Flip over the x axis
B: Horizontal Stretch if 0<B<1 or Horizontal Compression if B> 1 (Inside changes in x)
-B: would constitute a Horizontal Flip over the y axis h: Horizontal Shift (Inside changes in x) h>0 shifts left
h<0 shifts right k: Vertical Shift (Outside changes in y) k>0 shifts up k<0 shifts down
𝑔(𝑥) = −𝑓(𝑥) ℎ(𝑥) = 𝑓(−𝑥)

40. For each equation below, determine if the function is Odd, Even, or Neither.
a. 2
2f x x b. 2 2 4 xxg c. 32 h x x x
Ex5. Starting with the graph of 𝑓(𝑥) = √𝑥, write the equation of the graph that results from
a) shifting f(x) 7 units upward. 𝑦 =
b) shifting f(x) 6 units to the right. 𝑦 =
c) reflecting f(x) about the x-axis. 𝑦 =
Ex6. Given a function xf , represent the following in function notation.
For example: xf shifted up 3 units: 3xf
a) xf shifted 3 units to the left: ___________________
b) xf stretched horizontally by a factor of 4: _________________
c) xf stretched vertically by a factor of 3
1: ___________________

Ex8. Use transformations to Graph 𝑓(𝑥) = 2(𝑥 − 3)2 + 1
(Use 𝑦 = 𝑥2, with domain [−2, 2], to graph 𝑓.)
Ex9. Use transformations to Graph 𝑓(𝑥) = −(𝑥 + 2)2 + 3
(Use 𝑦 = 𝑥2, with domain [−2, 2], to graph 𝑓.)
The function ( )f x is graphed here. Write an equation for
each graph below as a transformation of ( )f x .
78.
80
f(x)
Ex7. If the domain of 𝑓 is [−3,9] and range is [1,5], and
𝑔(𝑥) = 2𝑓(3𝑥) − 5, find the domain and range of 𝑔.

1.6 Inverse Functions Note: The idea of an inverse function is that the input becomes the output and the output becomes the input.
One-to-one Functions
A function is one-to-one if any two different inputs in the domain correspond to two different outputs in the
range. That is, each X in the domain has one and only one Y in the range.
Horizontal Line Test
Once you have determined that a graph defines a function, an easy way to determine if it is a one-to-one function
is to use the horizontal line test. Draw horizontal lines through the graph. If any horizontal line crosses the graph
more than once, then the graph does not define a one-to-one function.
Ex1: Indicate if the function is a
one-to-one function:
Note: 𝑓−1 reads f inverse or inverse of f, and xf
xf11
If a function has an inverse, it is said to be invertible.
Input and output relation:
𝑓(5) =
𝑓−1(3) =
Domain Range
a). b). c).

Ex2.
Ex3.
a. b.
.
Ex4.
a. b.
.
c.

Graph the inverse function
Ex5: (a) Find xf 1 of 52
31
x
xxf ; b) Find xg 1 of
x
xxg
34
6
Ex a.
Ex b.