11 chapter 2shodhganga.inflibnet.ac.in/bitstream/10603/34138/11/11_chapter 2.1.pdf · of c....
TRANSCRIPT

45
CHAPTER-2.1
Proteomic analysis of Cronobacter sakazakii planktonic,
biofilm and agar-surface associated cells
46
2.1.1 INTRODUCTION
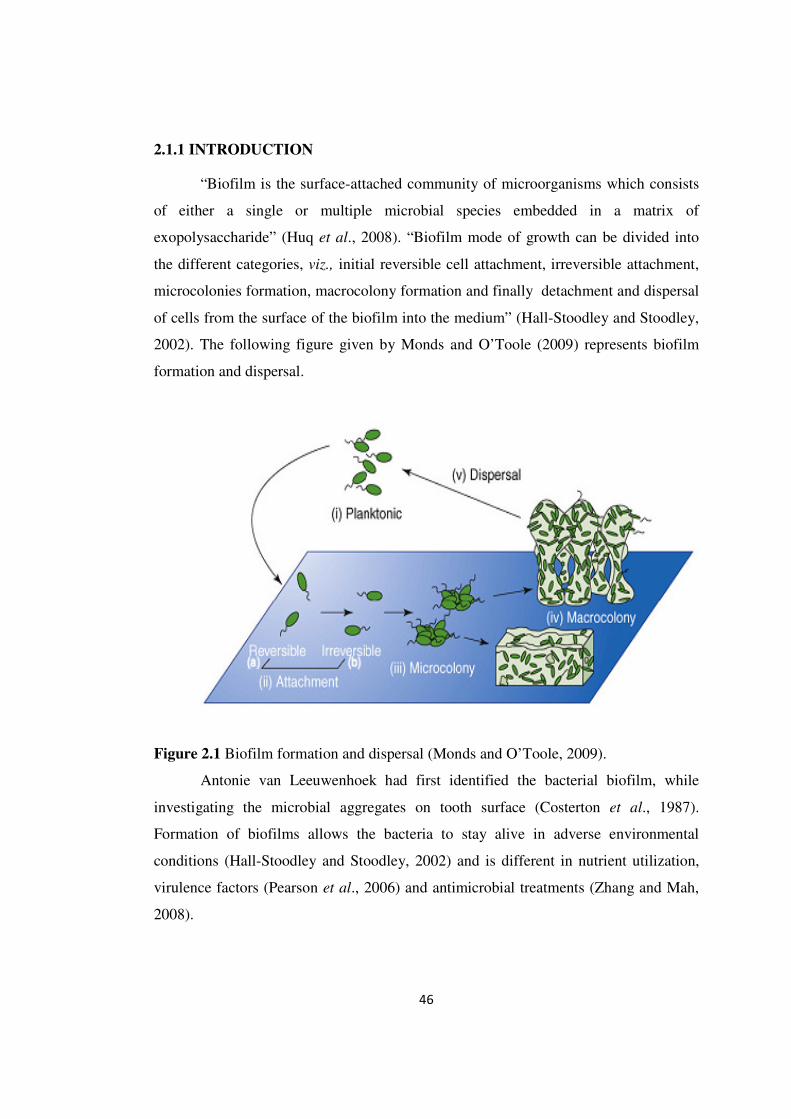
“Biofilm is the surface-attached community of microorganisms which consists
of either a single or multiple microbial species embedded in a matrix of
exopolysaccharide” (Huq et al., 2008). “Biofilm mode of growth can be divided into
the different categories, viz., initial reversible cell attachment, irreversible attachment,
microcolonies formation, macrocolony formation and finally detachment and dispersal
of cells from the surface of the biofilm into the medium” (Hall-Stoodley and Stoodley,
2002). The following figure given by Monds and O’Toole (2009) represents biofilm
formation and dispersal.
Figure 2.1 Biofilm formation and dispersal (Monds and O’Toole, 2009).
Antonie van Leeuwenhoek had first identified the bacterial biofilm, while
investigating the microbial aggregates on tooth surface (Costerton et al., 1987).
Formation of biofilms allows the bacteria to stay alive in adverse environmental
conditions (Hall-Stoodley and Stoodley, 2002) and is different in nutrient utilization,
virulence factors (Pearson et al., 2006) and antimicrobial treatments (Zhang and Mah,
2008).

47
Formation of biofilm is an ancient prokaryotic adaptation (Hall-Stoodley and
Stoodley, 2002). Biofilms are morphologically, physiologically and metabolically
different from their free living ‘planktonic’ counterpart (Landini, 2009).
The genotypic and phenotypic expression changes takes place in the biofilm
mode of growth. The phenotypic change includes the production of macromolecules
which are essential for the biofilm formation. “Biofilms have increased resistance to a
variety of environmental factors” (Hall-Stoodley et al., 2004) “in comparison to
planktonic counterpart, making their abolition more difficult” (Hall-Stoodley et al.,
2004). “Microbial biofilms are of special anxiety to the food processing environment,
as biofilms formed on food material or food contact surfaces represent possible causes
of food contamination with pathogenic microorganisms or spoilage”(Sharma and
Anand, 2002). Cells of the biofilm also coordinate themselves by secreting specific
chemicals (quorum sensing). Jensen et al., (2007) have studied that quorum sensing is
connected with formation of biofilms.
“Previous studies have revealed that there are changes in the proteome profile
of planktonic and biofilm cells of Escherichia coli O 157:H7” (Tremoulet et al., 2002).
Sauer and Camper (2001) have studied that a different gene and protein expression
regulated proteins in the biofilm cells, include those involved in motility, transport,
outer membrane proteins and polysaccharide biosynthesis proteins. “Later, they
analysed the mechanism of quorum sensing involved in these changes” (Sauer and
Camper, 2001). “The biofilm proteome of Bacillus cereus is distinct from its
planktonic cells and it has been shown that biofilm phenotype has up and down
regulation of differential proteins rather than expression of new proteins” (Vilian and
Brozel, 2006). Recently Mukherjee et al., (2011) have compared the proteome of
planktonic cells and biofilms of E. coli MG 1655 and have found that the differences
representing significant increased or decreased proteins which are involved in acid
resistance, DNA protection and binding, and function of ABC transporters. The outer
membrane protein A (Omp A) has been found to be over expressed in biofilms of E.
coli than planktonic cells (Orme et al., 2006). Similar study by Pham et al., (2010) has
revealed that there is an increase in the outer membrane proteins of the biofilm cells. It

48
has been hypothesized that changes in gene expression and proteome in biofilm may be
the cause for cell adherence, virulence and drug resistance.
Giaouris et al., (2013) have studied the proteome of S. enterica serovar
Enteritidis PT4 planktonic and biofilm cells and found the proteins expressed in
biofilm cells are related to stress response, murein synthesis, DNA metabolism,
nutrient transport, degradation and energy metabolism, and detoxification. Several
hypotheses are put forward to explain the reason for biofilm formation by microbes.
The first is that, they provide stability in the growth environmental conditions.
Microbes living as biofilm might give catalytic properties by way of confining the cells
living in close proximity. “The second is that the biofilm formation provides protection
against UV light”, (Espeland and Wetzel, 2001), “acids” (McNeill and Hamilton,
2003), “metal toxicity” (Teitzel and Parsek, 2003), “dehydration and salinity” (Le
Magrex-Debar et al., 2000) and “antimicrobial agents” (Gilbert, 2002).
“Proteome analysis includes a combination of 2-D gel electrophoresis and mass
spectrometry as shown in Figure” 2.2 (Graves and Haystead, 2002). “In the first step,
the protein samples are dissolved in dithiothreitol, which helps in linearization of
proteins and decreases the formation of sulfhydryl groups, and then the samples are
separated on an immobilized pH gradient polyacrylamide gel strip in an isoelectric
focusing (IEF) cell. Later, one-dimensional polyacrylamide gel electrophoresis (PAGE)
is carried out to separate the proteins according to their molecular weight, which is the
second dimension of electrophoresis. An electrophoregram is obtained with an array of
protein spots from which the proteins of interest or the uniquely expressed proteins can
be recognized. Following this, protein spots of interest are selected and excised from
the gel peptide fingerprints which can be matched with fingerprints and/or sequences of
known proteins in electronic protein sequence databases and the selected proteins are
accordingly identified. Protein mass spectra can be generated using Matrix assisted
laser desorption ionization-time of flight mass spectrometry (MALDI-TOF MS). The
first step in the identification process of a novel protein with unknown function
involves the characterization of its primary structure. When used in combination, 2-D
gel electrophoresis and mass spectrometry form a powerful and provide a fairly

49
sensitive and reproducible strategy for protein identification and detection” (Flemming,
2010).
Figure 2.2 Differential 2-D gel electrophoresis proteomic analysis (Graves and
Haystead, 2002).
“Studies on biofilm formation of C. sakazakii carried out so far show that C.
sakazakii has an ability to form biofilm on glass, stainless steel, silicon and
polyvinylchloride” (Lehner et al., 2005). “Such materials are frequently used for infant
feeding utensils and in the preparation areas. Exopolysaccharide production increases
the attachment and adherence” (Scheepe-Leberkuhne and Wagner, 1986) to the utensils
and subsequently increases the risk of infection to infants and neonates. “Colonization
of C. sakazakii on the surface of blenders, spoons and brushes have been associated
with neonatal infections” (Bar-Oz et al., 2001). Kim et al., (2006) “have studied the
biofilm formation of C. sakazakii on enteral feeding tubes and stainless steel”. Grimm

50
et al., (2008) “have described the presence of cellulose as a constituent of C. sakazakii
extracellular matrix”. Later, Dancer et al., (2009b) studied the biofilm formation ability
of C. sakazakii and their results indicate that milk components (whey protein and
casein) are the main determinant in the biofilm formation. “Biofilm formation of C.
sakazakii on foods and food contact surfaces will encourage the risk of food-borne
diseases” (Iversen and Forsythe, 2003). Beuchat et al., (2009) have reported that
biofilm formation in C. sakazakii imparts protection against disinfectants. “Biofilms
are of special concern to the food processing environment” (Iversen and Forsythe,
2003) as biofilm formation allows the pathogenic microbes to persist on food material
or food contact surfaces which can be the source of spoilage or contamination of food
products such as milk products.
In order to find a remedy to biofilm formation in the food processing
environment, it is required to understand the physiology of bacterial biofilm cells
which will help in formulating efficient biofilm control strategies. “C. sakazakii has
also been reported to form biofilms on glass and stainless steel, thus increasing the risk
to infants, neonates and immuno compromised individuals” (Iversen and Forsythe,
2004a). Hence the study of biofilm cells of C. sakazakii is required to limit the
occurrence of infection in infants, neonates and immuno compromised individuals. The
in-vitro study of the biofilm is essential since it allows the examination of biofilm
phenotype that is not readily interpreted in an in-vivo system. Though the in-vitro
studies rarely demonstrate the biofilm phenotype in natural in-vivo state, still they
remain important in the examination of biofilm infections in the perspective of human
infections. Scarce information is available regarding the molecular basis of the biofilm
proteome of C. sakazakii. Therefore, the aim of the present work was to study C.
sakazakii grown as planktonic, agar-surface associated and biofilm cells. Differential
expression of individual proteins was investigated in order to characterize the
planktonic, biofilm and agar-surface associated phenotype cells using the following
techniques.
1. “One-dimenstional sodium dodecyl sulphate polyacrylamide gel electrophoresis
(1D-SDS-PAGE)” (Sambrook et al., 1989).
2. “Two-dimensional gel electrophoresis” (Sambrook et al., 1989).

51
3. “Matrix assisted laser desorption ionization-time of flight mass spectrometry
(MALDI-TOF MS)” (Flemming, 2010).
The initial part (Section 2.1.2.7) of this chapter deals with the “differences in
protein expression between the planktonic, agar-surface associated (AS) and biofilm
forms of ten C. sakazakii isolates” (Sharma and Prakash, 2013a). The whole cell
protein of the above three forms were analysed using 1-D SDS-PAGE. The latter part
(Section 2.1.2.8) of the chapter includes the 2-D gel electrophoresis technique (2.1.2.8)
and protein identification with MALDI-TOF MS (2.1.2.9) of MTCC-2958.
2.1.2 MATERIALS AND METHODS
2.1.2.1 Chemicals and reagents, software and instruments
Chemicals and reagents used in the study were procured from Sigma Aldrich
(USA), Bangalore Genei (India), Hi-Media (India), Merck (India), Difco (USA), Bio-
Rad (India), Qualigens (India), Bio-Rad (India), Axygen (India), Galaxo (India), Gel
Doc System (Zenith, India), PD Quest Version Advanced software program (Bio-Rad,
Hercules, CA,USA), Chemidoc [Bio-Rad, Segrate (Milan) Italy] and MALDI-
TOF/TOF 50 instrument (Bruker Daltonics, GmbH, Leipzig Germany).
2.1.2.2 Bacteria used in the study
The bacteria used in this study include MTCC-2958 and 9 isolates from milk
and milk products of Agra city (as described in section 1.2.4).
2.1.2.3 Reviving of the cultures
Cultures used in this study were revived in EE broth (as described in section
1.2.4b).
2.1.2.4 Harvesting of planktonic cells
“A loop full of each confirmed C. sakazakii isolates (Jal 1, Jal 2, Jal 3, Jal 4, Jal
5, Jal 6, Jal 7, Jal 8, Jal 9 and MTCC-2958) from the overnight TSA culture plates were
inoculated in 3ml of EE broth” (Sharma and Prakash, 2013a). “The EE broths were
further incubated for 24 hours at 37°C. Cell enumeration was done by CFU plating
method. The concentration of cells was adjusted to ~ 106 CFU/ml with 0.85% sodium
chloride solution. This culture was centrifuged at room temperature for 10 minutes at

52
4000 g to harvest the bacterial cells. The media components with bacterial metabolites
were removed by re-suspending the pellet in 0.85 % sodium chloride solution and by
centrifuging again for 10 minutes at 4000 g to harvest the planktonic cells. This step
was repeated twice. The supernatant was discarded and the pellets were collected in
their respective tubes” (Sharma and Prakash, 2013a).
2.1.2.5 Harvesting of the agar-surface associated (AS) cells
“For the AS growth, the revived MTCC-2958 and C. sakazakii isolates (Jal 1,
Jal 2, Jal 3, Jal 4, Jal 5, Jal 6, Jal 7, Jal 8, Jal 9) were streaked on sterile tryptic soya
agar (TSA) plates and incubated for 24 hours at 37°C. From the TSA plates, cells were
harvested using a wire loop and were suspended in 1 ml of 0.85% sodium chloride
solution. Cell enumeration was done by CFU plating method. The concentration of the
cells was adjusted to ~ 106 CFU/ml with 0.85% sodium chloride solution. The culture
was centrifuged at room temperature for 10 minutes at 4000g to harvest the bacterial
cells. The media components with bacterial metabolites were removed by re-
suspending the pellet in 0.85 % sodium chloride solution and by centrifuging again for
10 minutes at 4000 g to harvest the AS cells. This step was repeated twice. The
supernatant was discarded and the pellets were collected in their respective tubes”
(Sharma and Prakash, 2013a).
2.1.2.6 Harvesting of the biofilm cells
“MTCC-2958 and C. sakazakii isolates (Jal 1-Jal 9) were inoculated in 3ml of
EE broth with a loop full of confirmed C. sakazakii cells from overnight culture plates
and incubated for 24 hours at 37°C. After incubation the contents of the glass test tubes
were decanted and the tubes were washed twice with 0.85 % sodium chloride solution
to remove the planktonic cells. 1 ml of 0.85 % sodium chloride solution was added to
the test tube and vortexed to dislodge the biofilm cells. Biofilm cells were centrifuged
at room temperature for 10 minutes at 4000g. Cell enumeration was done by serial
dilution followed by plating on TSA plates. The concentration of the cells was adjusted
to ~ 106 CFU/ml with 0.85% sodium chloride solution. Biofilm cells of ~ 10
6 CFU/ml
were centrifuged at room temperature for 10 minutes at 4000g. The supernatant was
discarded and the pellets were collected in their respective tubes (Sharma and Prakash,
2013a).

53
2.1.2.7 1-D Gel Electrophoresis
(a) Extraction of whole cell protein
“Whole cell proteins were extracted, following the procedure of” Du Toit et al.,
(2003). “Pellets of planktonic, AS cells and biofilm cells were resuspended in 300µl of
TEGL buffer (25mM Tris, 10mM EDTA pH 8, 0.9% glucose (w/v), 10mg/ml
lysozyme) and incubated at 37°C for 3 hours. Subsequently the pellets were obtained
by centrifugation at 4000g for 7 minutes and the supernatant was discarded. 200µl of
sample reducing buffer was added to each tube with the pellet obtained and mixed well
and further incubated at 100°C for 10 minutes over a boiling water bath” Du Toit et al.,
(2003). This was cooled immediately in ice and stored at -200
C for further use.
Test reagents
TEGL buffer
25 mM Tris 0.30 g
10 mM EDTA 0.37g
0.9% Glucose (w/v) 0.9 g
10 mg/ml Lysozyme 1.0 g
Distilled water 100 ml
“Sample buffer (SDS reducing buffer)” (Sambrook et al., 1989)
Distilled water 3.6 ml
“50mM Tris-HCl, pH 6.8” Sambrook et al., 1989) 1.2 ml
Glycerol 2.5 ml
“10% (w/v) SDS” (Sambrook et al., 1989) 2.0 ml
5% (w/v) Bromophenol blue 0.2 ml
“β-mercaptoethannol(added just before use)” 0.5 ml
(b) “SDS-PAGE of the whole cell protein” (Sambrook et al., 1989)
The protein profile was obtained, using a 12% gel, by SDS-PAGE. Molecular
weight marker ranging from 14.3-100 kDa was used.
Test reagents
Stock A (pH 8.8)
1.5M Tris base 18.17g

54
Distilled water 50 ml
“pH was adjusted by using 1N HCl and the volume was made up to 100 ml with
distilled water” (Sambrook et al.,1989).
Stock C
Acrylamide 29.2 g
N, N, N, N Bisacrylamide 8 g
Distilled water 100 ml
“10% (w/v) Sodium dodecyl sulphate (SDS)” (Sambrook et al., 1989)
SDS 10 g
Distilled water 100 ml
“10% ammonium persulphate (APS), freshly prepared” Sambrook et al., 1989)
APS 10 g
Distilled water 100 ml
“All the solutions were prepared using double distilled water and were stored at 4°C in
amber colored glass bottles” (Sambrook et al.,1989).
“10X Electrode (running) buffer, pH 8.3 (Stock solution)” (Sambrook et al., 1989)
Tris base 3.03 g
Glycine 14.4 g
SDS 1.0 g
Distilled water 100 ml
“1X Electrode (running) buffer, pH 8.3 (working solution)” (Sambrook et al., 1989)
10X Electrode running buffer 20 ml
Distilled water 180 ml
Protein molecular weight marker
Marker 3-5µl
5% bromophenol blue 2.5µl
Glycerol 2.5µl
55
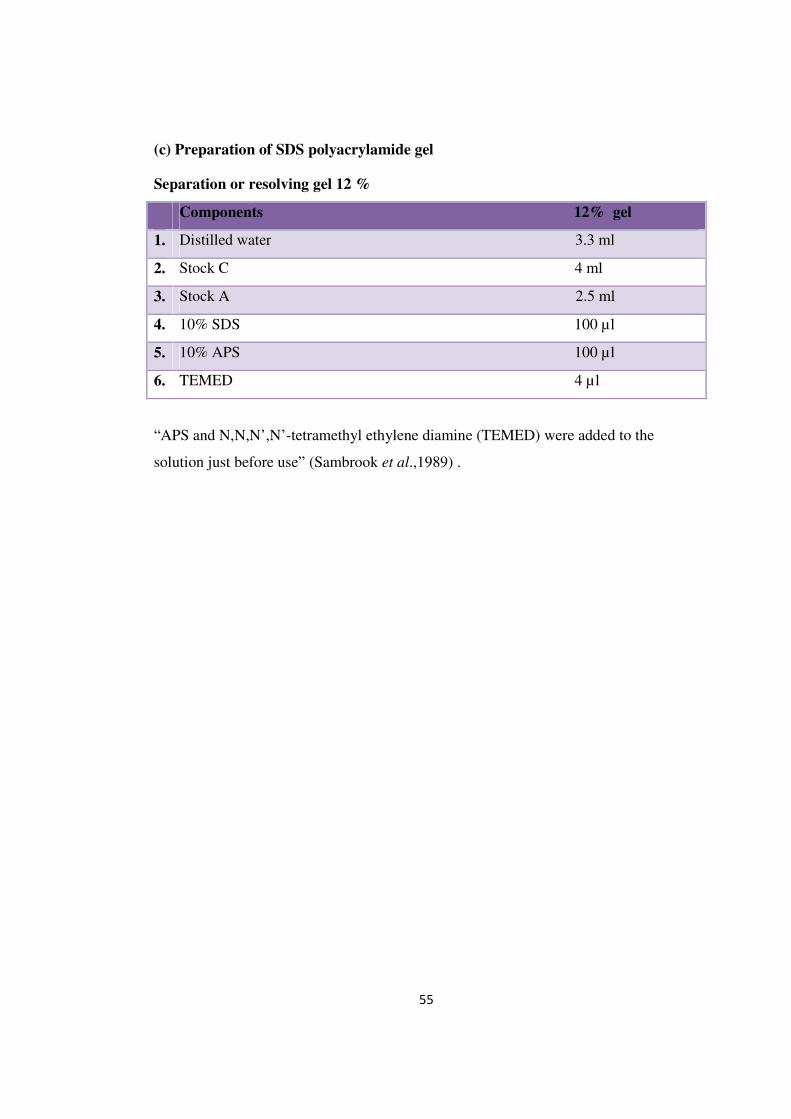
(c) Preparation of SDS polyacrylamide gel
Separation or resolving gel 12 %
Components 12% gel
1. Distilled water 3.3 ml
2. Stock C 4 ml
3. Stock A 2.5 ml
4. 10% SDS 100 µl
5. 10% APS 100 µl
6. TEMED 4 µl
“APS and N,N,N’,N’-tetramethyl ethylene diamine (TEMED) were added to the
solution just before use” (Sambrook et al.,1989) .

56
Preparation of a 5% stacking gel
Components 5% gel
1. Distilled water 3.05 ml
2. Stock C 1.25 ml
3. Stock A 0.65 ml
4. 10% SDS 50 µl
5. 10% APS 25 µl
6. TEMED 5 µl
Procedure
The gel was prepared in between the two glass slabs, whose sides were sealed
by 1% agar and the slabs were held together by clips. The gel components were mixed
and slowly poured in between the two glass slabs. A comb was inserted immediately
between the two slabs to prepare the wells. This was left to polymerize for about 30
minutes. The comb was carefully removed and the slab was fixed vertically in the
electrophoretic chamber. Both the upper and the lower reservoir were filled with 1X
Tris–glycine buffer (Electrode running buffer, pH 8.3). About 30µl of the denatured
protein samples was loaded in each well. The molecular weight protein marker was
loaded in adjoining lane. This apparatus was kept at room temperature and the two
electrodes were connected to the electrophoresis power supply. Initially the gel was run
at 45V for 15 min and then a constant supply of 7V/cm was applied to the apparatus.
“Once the tracking dye, bromophenol blue, reached the bottom of the gel the power
supply was cut and the gel was taken out carefully” (Sambrook et al., 1989). “It was
immediately kept in fixing solution (methanol 20 ml, acetic acid 10 ml, distilled water
70 ml) , until the blue line of bromophenol blue turned yellow” (Sambrook et al.,1989).
The gel was rinsed with water and immersed in the staining solution of Commassie
brilliant blue for 4-5 hrs with constant shaking at room temperature. Destaining was
done in 7% acetic acid till the bands became visible. “Quick destaining was done in a
solution containing methanol, water and acetic acid in the ratio 9:9:2 respectively”
(Sambrook et al., 1989). Gels were analysed by using Total Lab Quant v 11.4 gel

57
analysis software. WCP profiles were analysed for the differences in number and
molecular weights of protein bands.
2.1.2.8 2-D Gel Electrophoresis
Principle
“The 2-D gel electrophoretic technique is used to separate and visualize
proteins and relies on the separation of proteins according to their pI (neutral charge at
a certain pH), termed as isoelectric focusing (IEF), followed by one-dimensional gel
electrophoresis separating proteins according to their physical properties (size and
molecular weight)” (Sambrook et al.,1989).
2.1.2.8.1 Reviving of the culture
Culture was revived in EE broth as described in Section 1.2.4b.
2.1.2.7.2 Harvesting of planktonic, AS and biofilm cells of MTCC-2958
Growth was harvested as described in Section 2.1.2.4, 2.1.2.5 and 2.1.2.6.
2.1.2.8.3 Preparation of cell lysate
“Planktonic, AS and biofilm harvested cells were washed in 0.85% sodium
chloride solution at least three times and were suspended in sonication buffer at
concentration of 1g wet cells per 5 ml of buffer and then broken by intermittent
sonication. Pellets were sonicated eight times for 2 minutes at power level 5 and 50%
of the active cycle. After sonication the soluble protein fractions were separated from
cell debris by centrifugation at 12,000 g for 10 min at 4°C. The supernatant was
collected and stored at -20°C” (Flemming, 2010).
Test reagents
Sonication buffer (pH 7.4)
Tris HCl 50 mM
MgCl2 10 mM
PMSF (phenylmethylsulfonyl fluoride) 1 mM
EGTA (ethylene glycol tetracetic acid) 1 mM
Sodium azide 0.1%

58
PIC (protease inhibitor cocktail, 1ml of the cocktail solution is added in 20 ml
of cell lysate). PMSF was added just before use.
All the above contents were weighed (except PMSF) and kept in a bottle. “The pH was
adjusted to 7.4 using 4 N HCl and the volume was made up to100 ml” (Sambrook et
al., 1989).
2.1.2.8.4 Precipitation of protein with trichloroacetic acid (TCA)-acetone
“Cell lysates were treated with 1% SDS and then processed via the TCA-
acetone precipitation method” (Sharma et al., 2010).
Procedure
“About 0.5 ml of the cell lysate and 5µl of 1% SDS solution was mixed. The
mixture was boiled for 5-6 minutes. It was cooled down. Then 10% TCA (v/v) was
added to the cell extract and the mixture was incubated at -20°C overnight for
precipitation of proteins. The precipitated proteins were collected by centrifugation at
18,000 g for 15 minutes at 4°C. The supernatant was discarded and the pellet was
washed thrice with 100 % ice cold acetone and then allowed to air dry. The protein
pellet was suspended in appropriate volume of rehydration buffer. The mixture was
vortexed 2-3 times after every 10 minutes and left overnight to dissolve the pellet in the
rehydration buffer. Then the mixture was centrifuged at 18,000g for 15 minutes at 4°C”
(Sharma et al., 2010). “The supernatant was transferred to a new tube and its protein
concentration was estimated using the Bradford method” (Bradford, 1976).
Rehydration buffer
Urea 8 M
CHAPS (non-ionic or zwitterionic detergent) 2%
DTT (dithiothreitol) 50 mM
Bio-Lyte 3/10 ampholyte 0.2%
Bromo phenol blue 0.001%
2.1.2.8.5 Bradford method for protein estimation
Principle

59
“This method is based on the interaction of the dye, Coomassie brilliant blue,
with the protein. Free dye has absorption at 470 nm and 650 nm but when bound to
protein it has an absorption maximum at 595 nm. The amount of dye binding appears
to vary with the content of the basic amino acid arginine and lysine in the protein”
(Sambrook et al., 1989).
Standard protein solution: 1 mg/ ml BSA, Bradford reagent.
Procedure
The spectrophotometer was warmed up before use
1. In a series of clean and dry test tubes 5, 10, 15, 20, 25 µl of standard BSA
solutions were pipetted. Volume in each test tube was then made up to 50µl
with distilled water.
2. Spectrophotometer was adjusted to a wavelength of 595nm, and the blank to
zero using the tube which contains no protein.
3. To estimate the protein in the cell extract, 5µl of protein extract was taken and
volume made up to 50µl with distilled water.
4. “1.5 ml Bradford reagent was then added to each tube, incubated at room
temperature for a minimum of 15 minutes and then the absorbance was taken at
595nm” (Bradford, 1976).
5. Concentration versus absorbance curve was plotted.
2.1.2.8.6 Rehydration of the IPG strip
Procedure
“2D PAGE was carried out using the method of in gel rehydration” (Gorg et al.,
2000). Cell extract (150 µg protein) mixed with rehydration buffer (final volume 124
µl) was applied to immobilized strip (17 cm length, pH 4-7). 124µl of the rehydration
buffer (containing the protein) was spread in a rehydration tray along the wall of one
well on a tray. Plastic coating from the IPG- strip was removed carefully by using
forceps. The gel is present on the back side of the strip. The strip was spread on the
rehydration buffer to cover the whole buffer evenly. Thus the gel remains in contact
with the buffer. Care was taken to prevent the formation of bubbles. The side
containing the gel was kept downwards. Mineral oil was applied on the IPG-strip to

60
prevent it from drying up. The rehydration tray was placed in the IEF unit to maintain a
constant temperature of 20°C for passive rehydration. The program was fed and run for
passive rehydration in IEF cell.
First dimension separation: Isoelectofocussing (IEF) - IEF was performed for the
rehydrated strip. This was performed at 20°C in an IEF unit using the following
procedure:
0-250 V Linear mode for 1 hour
250 V Rapid mode- constant for 1hour
250-3000V Linear mode for 4 hour
3000V Rapid mode constant until 15 kVh, slow mode
The current limit was set at 50mA/strip.
Procedure
In the IEF tray the electrode wire was covered by electrode wicks (made by
filter paper), these wicks are moistened with distilled water. IPG strips were taken out
from rehydration tray. After rehydration the strip swelled up (The strip was cleared
from that side on which the gel is not present, to remove the mineral oil). The strip was
layered on the electrode wick in the IEF-tray. The positive sign shown on the strip was
always kept on the lower side, in contact with electrode wick. This tray was then fixed
in IEF unit and the program was run.
Equilibration of IPG strips prior to SDS-PAGE
Procedure
IEF tray containing the IPG strips is transferred to rehydration tray containing
about 2 ml of Equilibration buffer I and shaken for 15 minutes.
Later the IPG strips were again transferred in another well of the rehydration tray
containing about 2 ml of Equilibration buffer II and were shaken for 15 minutes.
Test Reagents
Equilibration buffer I
0.375 M Tris, (pH 8.8) 2.5 ml
6M Urea 3.6 g

61
20% Glycerol 2 ml
2% SDS 0.2 g
20% Glycerol 2 ml
130mM DTT 0.2 g
The volume was made up to 10ml with distilled water and it was stored at room
temperature after filtration.
Equilibration buffer II (reagents for 10 ml)
0.375 M Tris, pH 8.8 2.5 ml
6M Urea 3.6 g
20% Glycerol 2 ml
2% SDS 0.2 g
20% Glycerol 2 ml
Iodoacetamide (135mM) 0.25 g
2.1.2.8.7 Separation in the second dimension: SDS-Page
“The strip was loaded on top of a vertical SDS-polyacrylamide gel (12%) and
sealed in 1% low melting agarose dissolved in electrode buffer. The molecular markers
are loaded in a separate well by the side of the strip. Electrophoresis was performed as
described in Section 2.1.2.7(b) with a constant current of 25 mA until the indicator dye
reached the bottom edge of the gel. Proteins were stained by Coomassie brilliant blue R
250” (Sambrook et al., 1989). The molecular masses of the protein were determined
with the help of the molecular weight marker, in the range of 6.5 kDa-194.2 kDa,
loaded in the second dimension.
Sample buffer
Distilled water 4 ml
0.5ml Tris HCl pH 6.8 1.0 ml
Glycerol 1.8 ml
10% SDS 1.6 ml
0.05% Bromo phenol blue 0.2 ml
DTT 0.4 ml

62
Marker was diluted in the ratio of 1:19 in the sample buffer
Marker 5 µl
Sample buffer 95 µl
DTT 1-2 pinch
Marker, sample buffer and DTT was heated and cooled for 1-2 minutes before using.
Analysis of the image
The 2-D gels were scanned with a gel scanning densitometer. Analysis includes
quantification of spots and matching the gels with the help of PD Quest Advanced
software.
Statistical analysis
Student t-test statistical tool was applied for the statistical study by PDQuest
software. This ensures that only significant changes in the value of protein spots were
taken for analysis. The program picks up the spots with a differential intensity of
significant levels built in the system. Same amount of protein (150µg) was loaded onto
all the gels.
2.1.2.9 Protein identification with MALDI-TOF MS
Differenentially-expressed WCP spots in each of the forms, that is, planktonic,
AS and biofilm forms of MTCC-2958 were chosen for MALDI-TOF.
2.1.2.9.1 “In gel digestion of selected protein spots (Coomassie stained) with
trypsin” (Shevchenko et al., 1996)
Chemicals
NH4HCO3 M= 79 g/mol; 50 mM = 4 mg/ml
Dithiothreitol (DTT) M=154 g/mol; 10 mM = 10.2 mg/ml
Iodacetamide (IAA) M=185 g/mol; 55 mM =10.2 mg/ml
Trypsin C= 20-25 ng/µl
Excision of protein bands from polyacrylamide gels:
1. “Gels were washed with water (2 times, 10 minutes each)” Shevchenko et al.,
1996).
2. “Protein spots of interest were excised manually from the 2-D gels. Excised
pieces were cut into 1 mm-cube”.

63
3. Gel pieces were transferred to a 0.5 µl micro centrifuge tube.
“Washing the gel pieces” (Shevchenko et al., 1996)
1. “For destaining the gel pieces it was cut into bits and washed with water and 50
mM NH4HCO3 -50% acetonitrile [1:1 (v/v)] for 15 minutes”.
2. “The remaining liquid was removed and enough acetonitrile was added to cover
the gel pieces. The gel bits shrink and stick together”.
3. “Acetonitrile was removed”.
4. “The gel pieces were rehydrated in 50 mM NH4HCO3” (Shevchenko et al.,
1996).
5. “After 5 minutes, an equal volume of acetonitrile was added” (Shevchenko et
al., 1996)
6. “All the liquid was removed after 15 minutes of incubation” .
7. Again enough acetonitrile was added to cover the gel pieces.
8. When the gel pieces had shrunk, the acetonitrile was removed.
9. The gel pieces were dried in air or in a vacuum centrifuge.
“Reduction and alkylation” (Shevchenko et al., 1996)
1. “The gel pieces were rehydrated in 10 mM DTT in 50 mM NH4HCO3 (freshly
prepared)”.
2. “They were then incubated for 45 minutes at 56°C”.
3. “The tubes were brought to room temperature”.
4. The excess liquid was removed and replaced quickly by roughly the same
volume as above of freshly prepared 55 mM iodoacetamide in 50 mM
NH4HCO3.
5. This was incubated for 30 min at room temperature in the dark.
6. The iodoacetamide solution was removed.
7. The gel pieces were washed with 50 mM and NH4HCO3 in acetonitrile (1+1;
v/v), one or two changes each, 15 min per change.
8. Again enough acetonitrile was added to cover the gel pieces.
9. After the gel pieces had shrunk, it was removed.
10. The gel particles were dried in air or in vacuum centrifuge.
64
“In-gel digestion” (Shevchenko et al., 1996)
Preparation and addition of trypsin solution: Sequencing grade/ Mass
spectrometry grade trypsin (Promega) is recommended. Trypsin cuts C-terminal side of
K (lysine) and R (arginine) unless next residue is P (proline). The solid powder was
dissolved in 1 mM hydrochloric acid giving a concentration of 100 ng/ µl. It was stored
in 10 µl aliquots at -20°C. Freshly prepared enzyme solution was added (in 25 mM
NH4HCO3) to cover the gel.
1. This was incubated at 37°C for 30 min.
2. The excess enzyme solution was removed.
3. About 25 mM NH4HCO3 was added (approx. 2-3 µl) to keep the gel wet
overnight, but excess liquid was avoided.
4. This was incubated overnight at 37°C.
“Extraction of peptides” (Sharma et al., 2010)
“Peptides were extracted twice, from the gel pieces using the extraction buffer
[1:1] mixture of 70% ACN and 0.1% trifluoroacetic acid (TFA)]. Extraction was
supported by ultrasonication for a few minutes; to improve the extraction yields.
Recommended time frame for extraction was 30 minutes at room temperature”
(Sharma et al., 2010).
2.1.2.9.2 Mass spectrometry
Digested samples were desalted and concentrated on C-18 ZipTips (Millipore,
Billerica, MA, USA) employing manufacturer’s protocol”. “ZipTips were extracted on
MTP 384 target plate using 2 µl saturated solution of α-cyano-4-hydroxycinnamic acid
dissolved in 50 % ACN (v/v), 0.2 per cent trifuoroacetic acid. Autofex II TOF/TOF 50
(Bruker Daltonik GmbH, Leipzig, Germany) in positive refectron mode, in the
detection range of 500-3000 m/z was used to acquire mass spectra of digested protein”
(Sharma et al., 2010). “Mascot tool was used to evaluate the proteolytic masses.
Mascot wizard (Matrix Science, UK) was used for peak detection in MALDI spectra
and submission of the peak lists to the database. The parameters used for peptide mass
tolerance was fixed to 50 ppm with carbamidomethyl-cystein, oxidation of methionine
as variable modifcation and 1 missed cleavage site permitted” (Sharma et al., 2010).
65
2.1.3 RESULTS
2.1.3.1 Whole cell protein (WCP) analysis
“WCP profiles of planktonic, biofilm and agar-surface associated cells of the C.
sakazakii isolates displayed variability in their molecular weights” (Sharma and
Prakash, 2013a). (Figure 2.3 a, b, c). WCP profiles of the three forms (planktonic,
biofilm and agar-surface associated) of the C. sakazakii isolates with their molecular
weights are listed in Tables 2.1 a and b. “Though WCP profile of the three forms was
more or less similar for each respective isolate, but distinct variations in
presence/absence of protein bands were observed” (Sharma and Prakash, 2013a).
(Figure 2.3 a, b, c; Table 2.1 a, b).
“Prominent proteins (expressed in WCP profiles of more than 30% isolates)
expressed in planktonic phase, but not in agar-surface associated and biofilm included
WCP bands of 104.0 kDa, 93.1 kDa, 61.3 kDa, 39.2 kDa, 34.9 kDa, 22.1 kDa, 17.1
kDa, 15.2 kDa. Prominent proteins (expressed in WCP profiles of more than 30%
isolates) common in planktonic and agar-surface associated cells included WCP bands
of 24.2 kDa, 29.2 kDa, 70.7 kDa, and 82.2 kDa. Prominent proteins (expressed in WCP
profiles of more than 30% isolates) expressed in agar-surface associated form, but not
in planktonic and biofilm included WCP bands of 103.4 kDa, 90.4 kDa, 46.1 kDa, 35.5
kDa, 13.4 kDa” (Sharma and Prakash, 2013a) .
“Prominent proteins (expressed in WCP profiles of more than 30% isolates)
common to agar-surface associated cells and biofilm included WCP bands of 94.4 kDa,
87.2 kDa, and 27.3 kDa. Prominent proteins (expressed in WCP profiles of more than
30% isolates) expressed in, biofilm but not in planktonic and agar-surface associated
form included WCP bands of 118.0 kDa, 107.4 kDa, 98.5 kDa, 75.8 kDa, 65.1 kDa, 57
kDa, 48.2 kDa, 34.4 kDa, and 15.8 kDa. Prominent proteins common (expressed in
WCP profiles of more than 30% isolates) in planktonic form and biofilm included
WCP bands of 20.6 kDa and 55.1 kDa. Bands common to all the three forms
(expressed in WCP profiles of more than 30% isolates) are 91.6 kDa, 31.5 kDa, 28.1
kDa and 19.7 kDa” (Sharma and Prakash, 2013a).
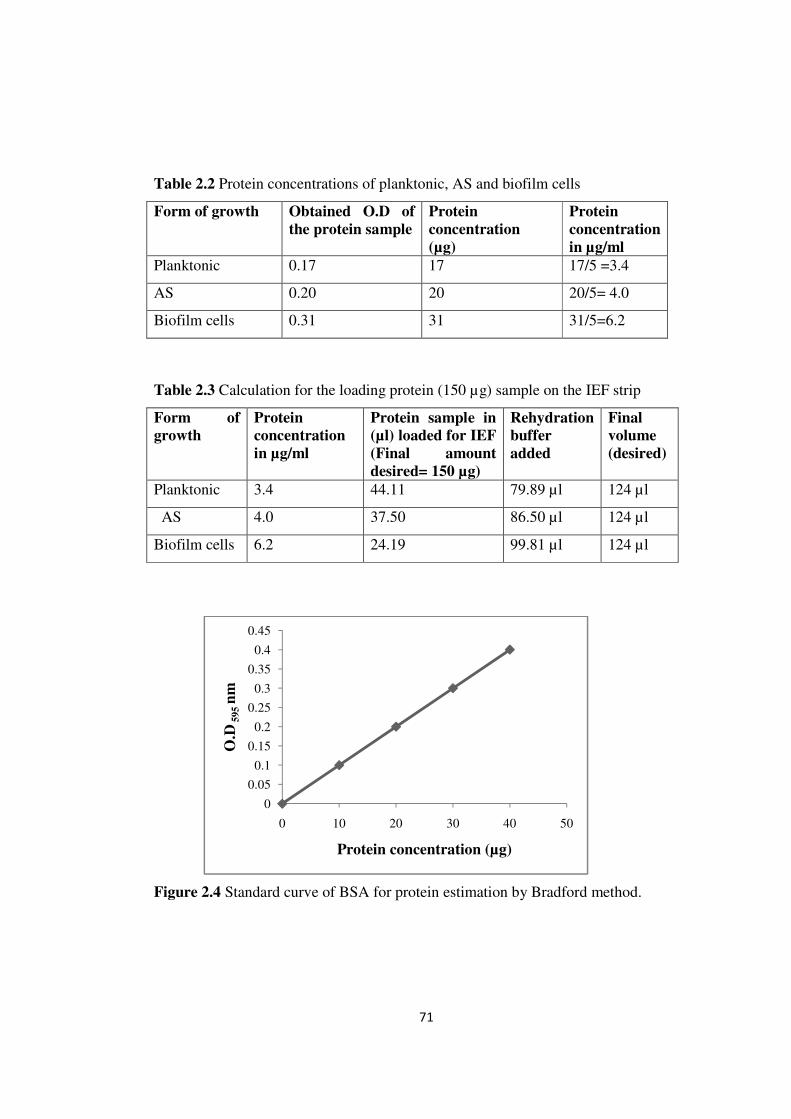
2.1.3.2 Protein estimation

66
Cell lysate of C. sakazakii isolate grown as planktonic, AS and biofilm cells
was prepared as described earlier. By employing Bradford’s method, a standard curve
(Figure 2.4) was obtained for protein estimation “using bovine serum albumin (BSA)
as standard” (Bradford, 1976). The protein concentrations of planktonic, AS and
biofilm cells were found to be 17µg, 20µg and 31 µg respectively (Table 2.2). Table
2.3 shows the calculation for the protein sample (µl) and rehydration buffer which is
loaded on the IEF strip.
2.1.3.3 Analysis of proteome
Proteome maps of C. sakazakii planktonic, biofilm and agar surface associated
cells after 24 hours of growth were analysed and compared.
1. Qualitative analysis includes absence of protein spots among the three
proteome maps.
2. Quantitative analysis includes proteins exhibiting an increase or decrease by a
factor of two or greater which were chosen arbitrarily for further analysis and
are summarized in (Table 2.4 a-g; Figure 2.5 a, b, c).
Proteins exhibiting an increase or decrease by a factor of two or greater were chosen
for analysis. The results from this analysis are summarized in Table 2.4 a-g.
The study focused on the proteomic analysis of planktonic, agar-surface associated
and biofilm grown cells of C. sakazakii (MTCC-2958). The proteome of the three
growth forms showed an overall similarity in WCP spot patterns (Figure 2.5 a, b, c).
However analysis of the 2-D electrophoregrams by PD-Quest software showed up-
regulated and/or down regulated and growth form specific unique proteins present in
each of the three growth forms (planktonic, agar-surface associated and biofilm cells
(Figure 2.5 and 2.6 a, b,c).
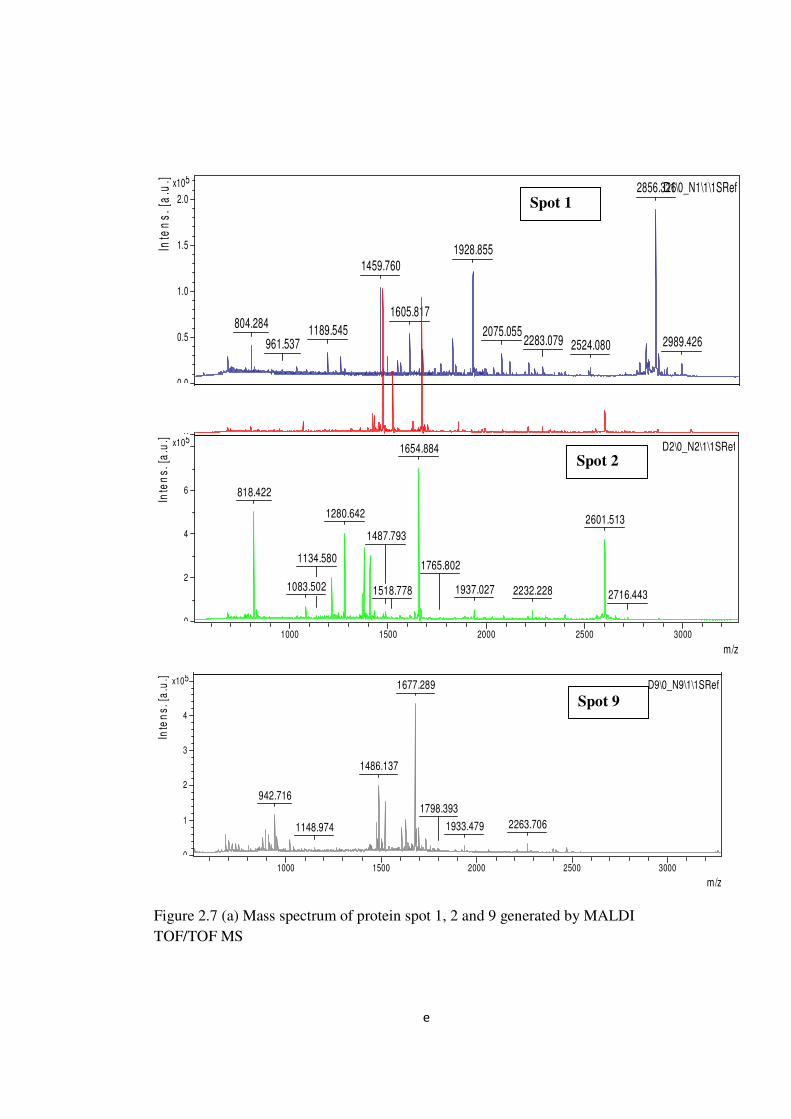
A total of 31 proteins were analysed by PD-Quest software, of which 9 (spot 1 to
spot 9) were successfully identified by MALDI-TOF mass spectrometry (Table 2.6;
Figure 2.5 a, b, c). Mass spectrums of these nine proteins (spot 1-spot 9) are shown in
Figure 2.7 a, b, c).

0
Figure 2.3 “Electrophoregrams displaying whole cell protein profiles of (a) planktonic, (b) agar surface-associated and (c) biofilms
forms of C. sakazakii isolates. Lanes (a)1, (b)1 and (c)1 : stained protein ladder (69.0, 43.0 29.0, 20.0, 14.3 kDa) (Sigma, USA);
Lanes (a) 2- (a) 12 : isolates Jal 1, Jal 2, Jal 3, Jal 4, Jal 5, Jal 6, Jal 7, Jal 8, Jal 9, Jal 9 and MTCC-2958, (b) 2-(b) 11,and (c) 2-
(c) 11,: isolates Jal 1, Jal 2, Jal 3, Jal 4, Jal 5, Jal 6, Jal 7, Jal 8, Jal 9 and MTCC-2958” (Sharma and Prakash, 2013a) respectively.
1 2 3 4 5 6 7 8 9 10 11 12
kDa
69
43
29
20
14.3
11 10 9 8 7 6 5 4 3 2 1 11 10 9 8 7 6 5 4 3 2 1
(a) (b) (c)

67
Table 2.1 (a) “Whole cell protein profiles of planktonic (P), biofilm (B), and agar-surface associated (AS) forms of C. sakazakii
isolates (Jal 1, Jal 2, Jal 3, Jal 4) and MTCC-2859” (Sharma and Prakash, 2013a).
Jal 1 Jal 2 Jal 3 Jal 4 MTCC-2858
Isolate
growth
form
P
AS
B
P
AS
B
P
AS
B
P
AS
B
P
AS
B
Molecular
weight
(kDa)
118 118 118
107 107.4
104
103.4 103.4 103.4 103.4
98.5 98.5 98.5 98.5
93.1 93.1 94.4 94.4 94.4 94.4 94.4 94.4 94.4 94.4
91.6 91.6 91.6 91.6 91.6 91.6 91.6 91.6 91.6
90.5 90.4 90.4
87.6
87.2 87.2 87.2 87.2
82.2 82.2 82.2 82.2 82.2
75.8 75.8 75.8
70.7 70.7 70.7 70.7 70.7 70.7 70.7
65.1 65.1 64.6
61.3 61.3 61.9 61.3
57.0 57.0 57.0
55.1 55.1 55.1 55.1
48.2 48.2 48.2
46.1 46.1 46.1

68
39.2 39.2 39.2
35.5 35.5 35.5
34.9 34.9
34.4 34.4
31.5 31.5 31.5 31.5 31.5 31.5 31.5 31.5 31.5
29.2 29.2 29.2 29.2 29.2 29 29
28.1 28.1 28.1 28.1 28.1 28.1
27.3 27.3 27.3 27.3 27.3 27.3
24.2 24.2 24.2 24.2 24.2 24.2
22.1 22.1 22.1
20.6 20.6 20.6 20.6
19.7 19.7 19.7 19.7 19.7 19.7 19.7 19.7
17.1 17.1 17.0 17.1
15.8 15.8 15.8 15.8
15.2 15.2 15.2
13.4 13.4 13.4
Total no.
of bands
12 9 10 11 14 13 10 10 10 10 4 8 7 10 11

69
Table 2.1 (b) “Whole cell protein profiles of planktonic (P), biofilm (B), and agar-surface associated (AS)
forms of C. sakazakii isolates (Jal 5, Jal 6, Jal 7, Jal 8, and Jal 9)” (Sharma and Prakash, 2013a).
Jal 5 Jal 7 Jal 7 Jal 8 Jal 9
Isolate
growth
form
P
AS
B
P
AS
B
P
AS
B
P
AS
B
P
AS
B
Molecular
weight
(kDa)
118 115
107.4 107.4
104.0 104.0 104.0 104.0
103.6 103.4
98.5
96.8
91.9 94.4 94.4 94.3 94.4
93.8
93.1 93.1
91.6 91.6 91.6 91.6 91.6 91.6
91.1 91.1 91.1
90.4 90.4 90.4
87.7 87.0 87.2 87.2
82.4 82.2 82.2 82.2 82.2 82.2 82.2
75.8 75.8
70.7 70.7 70.7 70.9 70.7 70.7
70.4
63.0
65.1 65.1 64.6
62.4
61.3 61.9 61.3
60.1 57.0 57.0
55.1 55.1
48.2 48.2 48.2

70
47.8 46.1 46.3 46.7 46.1
35.5 35.0 35.5 35.5
34.2 34.9
34.9 34.4 34.4
31.5 31.5 31.5
29.2 29.2 29.2 29.2 29.2 29 29
28.1 28.1 28.1 28.1 28.1 28.1
27.3 27.3
24.2 24.2
22.1 22.1 22.5
21.9
20.6 20.6 20.6
19.7 19.7 19.7 19.7 19.7
17.1 17.1 17.2 17.0 17.1
15.8 15.8
15.4 15.4 15.2 15.5 15.9
13.4 13.4
Total no. of
bands
12 8 5 11 13 11 12 10 8 8 4 7 5 7 6
71
Table 2.2 Protein concentrations of planktonic, AS and biofilm cells
Form of growth Obtained O.D of
the protein sample
Protein
concentration
(µg)
Protein
concentration
in µg/ml
Planktonic 0.17 17 17/5 =3.4
AS 0.20 20 20/5= 4.0
Biofilm cells 0.31 31 31/5=6.2
Table 2.3 Calculation for the loading protein (150 µg) sample on the IEF strip
Form of
growth
Protein
concentration
in µg/ml
Protein sample in
(µl) loaded for IEF
(Final amount
desired= 150 µg)
Rehydration
buffer
added
Final
volume
(desired)
Planktonic 3.4 44.11 79.89 µl 124 µl
AS 4.0 37.50 86.50 µl 124 µl
Biofilm cells 6.2 24.19 99.81 µl 124 µl
Figure 2.4 Standard curve of BSA for protein estimation by Bradford method.
0
0.05
0.1
0.15
0.2
0.25
0.3
0.35
0.4
0.45
0 10 20 30 40 50
O.D
595
nm
Protein concentration (µg)

a
194.2
104.2
59.2
41.9
27.8
20.8
15.2
M
(kDa) pH 4 pI pH 7
Figure 2.5 (a) Coomassie stained 2D-gel electrophoretic WCP spot profile of
C.sakazakii (MTCC-2958) grown in planktonic form. Boxes indicate significantly
increased/decreased spots (more than 2-fold) in specific growth form.

b
M
(kDa) pH 4 pI pH 7
194.2
104.2
59.2
41.9
27.8
20.8
15.2
Figure 2.5 (b) Coomassie stained 2D-gel electrophoretic WCP spot profile of
C.sakazakii (MTCC-2958) grown in agar-surface associated form. Boxes indicate
significantly increased/decreased spots (more than 2-fold) in specific growth form.

c
194.2
104.2
59.2
41.9
27.8
20.8
15.2
M
(kDa) pH 4 pI pH 7
Figure 2.5 (c) Coomassie stained 2D-gel electrophoretic WCP spot profile of
C.sakazakii (MTCC-2958) grown in biofilm form. Boxes indicate significantly
increased/decreased spots (more than 2-fold) in specific growth form.

d
(a) (b) (c)
Figure 2.6 Coomassie stained 2D-gel electrophoresis WCP spot profiles of C. sakazakii (MTCC-2958) grown in (a) planktonic, (b)
agar-surface associated and (c) biofilm forms. Numbers 1 to 10, indicate significantly increased/decreased spots (more than 2-fold )
in the specific growth form.
e
Figure 2.7 (a) Mass spectrum of protein spot 1, 2 and 9 generated by MALDI
TOF/TOF MS
2856.326
1928.8551459.760
1605.817804.284
1189.545 2075.0552989.4262283.079 2524.080961.537
D1\0_N1\1\1SRef
0.0
0.5
1.0
1.5
2.0
5x10
Inte
ns
. [a
.u.]
0
1654.884
818.422
1280.6422601.513
1083.502 1937.027
1487.793
2232.228
1134.580
1518.778
1765.802
2716.443
D2\0_N2\1\1SRef
0
2
4
6
5x10
Inte
ns
. [a
.u.]
1000 1500 2000 2500 3000
m/z
1677.289
1486.137
942.716
2263.7061933.4791148.974
1798.393
D9\0_N9\1\1SRef
0
1
2
3
4
5x10
Inte
ns
. [a
.u.]
1000 1500 2000 2500 3000
m/z
Spot 1
Spot 2
Spot 9

f
Figure 2.7(b) Mass spectrums of protein spots 3, 4 and 5 generated by MALDI
TOF/TOF MS.
1654.891
1409.711
818.4722601.390
1937.030 2232.197
1083.5601518.806
1144.633
1179.628
2716.333
D3\0_N3\1\1SRef
0
1
2
3
4
5
5x10
Inte
ns
. [a
.u.]
1500.877
1295.712
1087.605
2028.171
2211.205 2435.3921707.861842.502 3030.6332746.628
D4\0_M4\1\1SRef
0
1
2
3
4
5x10
Inte
ns
. [a
.u.]
1592.983
1757.176
1481.887
1903.202914.632 2211.3351277.848 2676.629
D5\0_N5\1\1SRef
0
1
2
3
4
5
5x10
Inte
ns
. [a
.u.]
1000 1500 2000 2500 3000
m/z
Spot 3
Spot 4
Spot 5

g
Figure 2.7 (c) Mass spectrum of protein spot 6, 7 and 8 generated by MALDI
TOF/TOF MS.
1189.758
1929.170
1460.001
2856.815
806.564 2211.389
1675.099
2515.766 2989.969
1717.0701032.681
980.626
D6\0_N6\1\1SRef
0.00
0.25
0.50
0.75
1.00
1.25
5x10
Inte
ns
. [a
.u.]
1365.895
1473.948
1480.001
1906.2521695.065
809.514 2211.4601165.726 2468.563
2807.753
D7\0_N7\1\1SRef
0
1
2
3
4
5x10
Inte
ns
. [a
.u.]
1473.966
2468.713
1798.247
1285.7631068.725804.473 2149.367 2723.757
D8\0_N8\1\1SRef
0
2
4
6
8
5x10
Inte
ns
. [a
.u.]
1000 1500 2000 2500 3000
m/z
Spot 6
Spot 7
Spot 8

72
Table 2.4 (a) Protein spots common to agar-surface associated and biofilm form but
absent in planktonic form
No. of Spot Planktonic AS Biofilm
23 - ++ ++
20 - ++ ++
19 - ++ ++
Table 2.4 (b) Protein spots upregulated in agar-surface associated and biofilm form
No. of Spot Planktonic Agar-surface
associated
Biofilm
1 + ++ ++
2 + ++ ++
3 + ++ ++
4 + ++ ++
6 + ++ ++
9 + ++ ++
12 + ++ ++
21 + ++ ++
22 + ++ ++
25 + ++ ++
Table 2.4 (c) Protein spots upregulated in agar-surface associated form
No. of Spot Planktonic Agar-surface
associated
Biofilm
11 + ++ +
18 + ++ +
26 + ++ +
27 + ++ +
24 + ++ +

73
Table 2.4 (d) Protein spots present in all three growth forms
No. of Spot Planktonic Agar-surface
associated
Biofilm
13 ++ ++ ++
14 ++ ++ ++
16 ++ ++ ++
28 ++ ++ ++
29 ++ ++ ++
30 ++ ++ ++
31 ++ ++ ++
Table 2.4 (e) Protein spot absent in agar-surface associated form
No. of Spot Planktonic Agar-surface
associated
Biofilm
17 ++ - ++
Table 2.4 (f) Protein spots upregulated in biofilm but not in AS and planktonic form
No. of Spot Planktonic Agar-surface
associated
Biofilm
5 + + ++
7 + + ++
8 + + ++
10 + + ++
Table 2.4 (g) Protein spot upregulated in planktonic and AS form
No. of Spot Planktonic Agar-surface
associated
Biofilm
15 ++ ++ -

74
Table 2.5 Protein expression in C. sakazakii (MTCC-2958) grown as planktonic, AS
and biofilm forms
S.No Presence/absence/upregulation
/downregulation of the protein
spots
Number of
spots
% of total spots
(n=31)
1 Proteins present in all the three
growth forms
7 0.22
2 Proteins present in AS and biofilm
cells absent in planktonic
3 0.09
3 Protein present in planktonic and
biofilm cells absent in AS form
1 0.03
4 Proteins upregulated (in AS and
biofilm) two-fold in a specific growth
form above the levels of the
corresponding spot in other forms
10 0.32
5 Proteins upregulated (in AS) two-fold
in a specific growth form above the
levels of the corresponding spot in
other forms
5 0.16
6 Proteins upregulated in biofilm form 4 0.12
7 Protein upregulated in planktonic and
AS, but absent in biofilm form
1 0.03

75
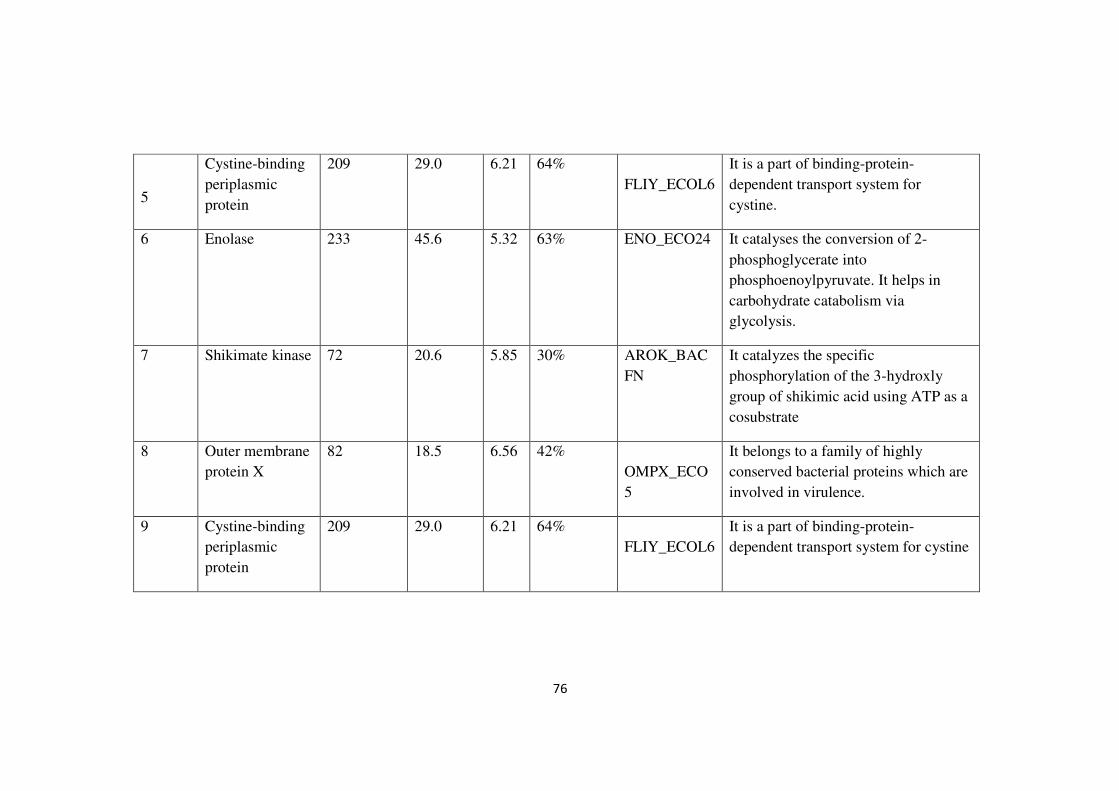
Table 2.6 Details of proteins identified by mass spectrometry
Protein
spot
no.
Protein
identified
MASCOT
Score
Nominal
mass
(kDa)
pI Sequence
coverage
Accession
number
Function
1 Enolase 233 45.6 5.32 63% ENO_ECO24 It catalyses the conversion of 2-
phosphoglycerate into
phosphoenoylpyruvate. It helps in
carbohydrate catabolism via
glycolysis.
2 Outer membrane
protein A
124 37.1 5.99 38% OMPA_ECO
57
It is required for the action of colicins
K and L and for stabilization of mating
aggregated in conjugation. It serves as
receptor for T-even like phages. Also
acts as a porins with low permeability
3 Outer membrane
protein A
122 37.1 5.99 40% OMPA_ECO
57
It is required for the action of colicins
K and L and for stabilization of mating
aggregated in conjugation. It serves as
receptor for T-even like phages. It also
acts as a porins with low permeability
4 Triosephosphate
isomerase
85 26.8 5.77 17%
TPIS_ENTCL
It catalyses the reversible reaction of
dihydroxyacetone phosphate and D-
glyceraldehyde 3-phosphate.
76
5
Cystine-binding
periplasmic
protein
209 29.0 6.21 64%
FLIY_ECOL6
It is a part of binding-protein-
dependent transport system for
cystine.
6 Enolase 233 45.6 5.32 63% ENO_ECO24 It catalyses the conversion of 2-
phosphoglycerate into
phosphoenoylpyruvate. It helps in
carbohydrate catabolism via
glycolysis.
7 Shikimate kinase 72 20.6 5.85 30% AROK_BAC
FN
It catalyzes the specific
phosphorylation of the 3-hydroxly
group of shikimic acid using ATP as a
cosubstrate
8 Outer membrane
protein X
82 18.5 6.56 42%
OMPX_ECO
5
It belongs to a family of highly
conserved bacterial proteins which are
involved in virulence.
9 Cystine-binding
periplasmic
protein
209 29.0 6.21 64%
FLIY_ECOL6
It is a part of binding-protein-
dependent transport system for cystine

77
2.1.4 DISCUSSION
Conventionally bacteria have been cultured and studied as free living
‘planktonic’ populations. However, bacteria in natural environmental conditions are
commonly found as community of cells organized in biofilms (Davey and O’Toole,
2000). Various strategies have been applied to study the genome and proteome of
planktonic and biofilm cells.
In the present study, the proteomic approach was used to compare the
planktonic, agar-surface associated and biofilm cells of C. sakazakii. To our
knowledge, this is the first study reporting on the differences in the proteins of
planktonic, agar-surface associated and biofilm cells of C. sakazakii. It was
investigated that the three growth forms exhibit differentially and/or uniquely-
expressed proteins.
One-dimensional SDS-PAGE profile of whole cell protein of C. sakazakii
isolates grown as planktonic, agar-surface associated and biofilm revealed specific
phenotypes. Variation in molecular masses of proteins was observed between the WCP
profiles of planktonic, AS and biofilm cells (Tables 2.1 a, b). Several proteins unique
to each of the planktonic, agar-surface associated and biofilm growth forms were
observed for C. sakazakii isolates and MTTCC-2958 (Table 2.1 a, b). In their work on
B. cereus, Vilian and Brozel (2006) have also found that majority of the protein spots
appeared to be uniquely expressed.
Differences between the proteome of free living and sessile bacteria using high
resolving power of two-dimensional electrophoresis have been reported earlier (Sauer
et al., 2002). In the present study this technique has been significantly contributed in
differentiating the WCP expressions between C. sakazakii grown as planktonic, AS and
biofilm cells. Two-dimensional electrophoregrams of WCP of C. sakazakii revealed a
reproducible separation of 31 distinct proteins spots in the pH range of 4 to 7 after
Coomassie brilliant blue staining (Figure 2.5 a, b and c). Ten proteins were selected for
identification, based on the criteria of varied reproducibility in their concentration as a
result of changes in the three growth conditions (planktonic, agar-surface associated
and biofilm cells). Out of a total of 31 spots, nine proteins were characterized by MS
analysis and according to their function (Table 2.6). They are classified as follows:

78
1. Outer membrane proteins (spot no. 2 and 3 and 8)
2. Proteins involved in glycolysis ( spot no. 1, 4 and 6)
3. Protein involved in shikimate pathway (spot no. 7)
4. Periplasmic proteins ( spot no. 5 and 9)
“These categories are related to what has been reported earlier for differentially
expressed proteins in biofilm proteome of other bacteria” (Orme et al., 2006; Hefford
et al., 2005).
WCP spots identified in the 2-D maps of MTCC-2958 were homologous to
several proteins from E. coli (Table 2.6). Spot No 3 (TPIS_ENTCL) was homologous
to protein of E. cloacae.
The whole proteomes of MTCC-2958 were not characterized in the 2-D WCP
electrophoregrams of each growth phase, since proteins falling outside the selected pI
(pH 4-7) and molecular weights (15.2 - 19.4 kDa) will not be detected. Nevertheless,
significant differential protein expression was observed in the selected range of pI and
molecular weights (Figure 2.6 a, b and c).
Spot 1 and spot 6 was recognized as enolase. It is a glycolytic enzyme, which
catalyses the conversion of 2-phosphoglycerate to phosphoenolypyruvate. It is also
known as phosphopyruvate hydratase. Depending on the environmental conditions of
the substrate, it can even catalyze a reverse reaction.
Spot 4 was recognized as “triosephosphate isomerase which catalyses the
reversible reaction of dihydroxyacetone phosphate and D-glyceraldehyde 3-phosphate”
(Li et al., 2001). The enzyme also plays a role in glycolysis and necessary in energy
production. In E. coli the need for ATP controls the glycolytic flux through the cell (Li
et al., 2001). The increased expressions of glycolytic enzymes (enolase and triose
phosphate isomerase) were observed in the agar-surface associated and biofilm cells
(Figure 2.6 b and 2.6 c). Similar results were observed by Hefford et al., (2005) in
which significant upregulation of enolase and triosephisphate isomerase in biofilm
cells was observed.
The increased expression in agar-surface associated cells and biofilm cells
might be due to the enhanced activity in ATP-consuming biosynthetic reactions. The
decline in the level of intracellular ATP could be expected to increase the production of

79
glycolytic enzymes (enolase and triose phosphate isomerase). It has been well known
that oxygen is deprived to the cells embedded deeper within the biofilms (Xu et al.,
1998). Thus an increased expression of glycolytic enzymes may be in response to
limited amount of oxygen in the cells within the biofilms. Apart from glycolysis,
enolase enzyme when present at the cell surface and binds plasmin, fibronectin and
plasminogen which helps the bacteria in creating an inflammatory response (Pancholi
and Fischetti 1998). The increased expression of this enzyme in agar-surface associated
cells and biofilm cells could be involved in aiding the adhesion process by C. sakazakii
grown as agar-surface associated and biofilm cells.
Spot 2 and spot 3 was identified as Omp A outer membrane protein. It is the
major protein of members belonging to the family of Enterobacteriaceae and this
protein is conserved throughout evolution (Beher et al., 1980). Omp A protein carries
out various functions - helps in structural integrity of the outer membranes (Sonntag et
al., 1978); acts as a target for immune response (Godefroy et al., 2003) and helps in
bacterial conjugation (Ried G and Henning, 1987). It also acts as a receptor for
bacteriophages (Morona et al., 1985). At physiological temperatures Omp A forms a
pore of the size of 1 nm in diameter (Arora et al., 2000). The upregulation of this
protein was observed in AS and biofilm cells (Figure 2.6 b and 2.6 c). “The over-
expression of this protein in biofilm cells is in accordance with the findings of” Orme
et al., (2006) where proteomic study together with immunoassays have shown that
Omp A of E. coli is up-regulated during biofilm formation. Ma and Wook (2009)
reported that E. coli biofilm formation was influenced by OmpA by inhibiting the
cellulose production through the CpxRA stress response system. This protein may
assist in the transfer of polymeric substances which is required for the construction of
EPS formed during biofilm formation. It has also been reported that horizontal gene
transfers occur in biofilms. Transfer of resistance genes is known to occur from
commensals to pathogenic strains (Molin et al., 2003). The up-regulated OmpA protein
in biofilm may assist in DNA exchange. This protein up-regulated in the agar-surface
associated and biofilm may be a related to virulence of C. sakazakii to the host. These
findings suggest that OmpA can be a likely target for biofilm inhibition and may aid in
the designing of biofilm inhibiting strategies.

80
Spot 7 was recognized as shikimate kinase. This enzyme catalyses the
conversion of shikimate to shikimate 3 phosphate which is the fifth step of shikimate
pathway. It helps in the biosynthesis of precursors of secondary metabolites and
aromatic amino acids. In E. coli it has been reported (Ely and Pittard, 1979) that the
starvation of aromatic amino acids (tyrosin and tryptophan) results in an enhanced rate
of synthesis of shikimate kinase. In our study, the protein (spot no.7) up regulated in
biofilm cells may be involved in the synthesis of tyrosine and tryptophan (Figure 2.6 a,
b and c). Due to the absence of shikimic pathway in mammalian species, the enzyme
shikimate kinase may be used as a target for generating antimicrobials against C.
sakazakii.
Spot 5 and 9 were recognized as cysteine binding periplasmic proteins (Fli
Y_ECOL6). Fli Y helps in the transport of amino acids and/ or in the regulation of
class III transcription.
In E. coli, the electron transport chain is thought to produce reactive oxygen
species (ROS) such as H2O2 (Imlay, 2003). Two catalases (Kat E and Kat G) and a
peroxidase (AhpCF) help in the elimination of H2O2. However, such enzymes are
present in the cytoplasm and not in the periplasm. FliY, a periplasmic binding protein
which is a component of l-cysteine/l-cystine shuttle system is present in the inner
membrane of E. coli which helps in H2O2 scavenging (Ohtsu et al., 2010). It has been
reported that the transcription of genes which code for FliY is induced by the presence
of hydrogen per oxide (Ohtsu et al., 2010). E. coli cells are exposed to H2O2, which is
produced during phagocytic attack. Therefore, if the cells might detoxify H2O2 in the
periplasmic space before its diffusion into cytoplasm, its toxicity would be diminished.
Upregulation of cysteine binding periplasmic protein (spot 9, Figure 2.6 a, b and c) was
observed in agar-surface associated and biofilm cells of C. sakazakii proves that both
the forms might be more tolerant to phagocytic attack as compared to their planktonic
counterpart. Hall-Stoodley and Paul Stoodley (2009) “reported that bacteria in biofilms
are more resistant to host defense mechanisms”.
Spot 8 was identified as Omp X. “It has been reported that it belongs to a
family of highly conserved bacterial proteins which are involved in virulence” Vogt
and Schulz (1999). “It also plays a role in the defense against attack by the human
81
complement system” Vogt and Schulz (1999). Vogt and Schulz (1999) “reported that
the membrane spanning part of this protein is highly conserved in comparison to the
extracellular loops”. “These extracellular loops form a protruding β-sheet, which helps
in binding to external proteins, this binding helps in adhesion and invasion” Vogt and
Schulz (1999). However, Maisnier-Patin et al., (2003) reported that “OmpX protein is
recognized by innate cells but does not activate them, suggesting that OmpX does not
provide a danger signal to APCs” (Antigen-Presenting cells). In our study, we observed
a down regulation of Omp X protein [spot 8, Figure 2.6 (a) and (b)] in planktonic and
AS forms. Upregulation of and/or expression of omp X in biofilm cells (Figure 2.6 c)
may be related to virulence and host invasion of C. sakazakii.
In the present work, a common “proteome with differences in expression levels,
in addition to expression of unique proteins was observed for planktonic, agar surface-
associated and biofilm cells of C. sakazakii" (Sharma and Prakash, 2013a). The
function of putative biofilm proteins was found to be more similar to those of the agar-
surface associated form of MTCC-2959. In the present study, it was shown that
MTCC-2958 biofilm cells proteome differ from proteome of planktonic cells.
Gaining knowledge about the biofilm proteome of C. sakazakii will help to
design strategies that cause its degradation, and will thus help to prevent the
contamination of food by biofilm formation on food contact surfaces by the above
bacteria.