11-15. factors influencing the compressive strength of ... · pdf filefactors influencing the...
TRANSCRIPT
122 Vth lnternational Brick Masonry Conference
11-15. Factors Influencing the Compressive Strength of Hollow Clay Unit Prisms
Dale MiUer URS Engineers, Seattle, WA.,formerly graduate student, Unwersity of COÚJrado - Bou/der
James Noland Atkinson-NoÚlnd & Associates, Boulder, co
Chuan C. Feng Professor, Dept. of Civil, Environmental, & Architectural Engineering, Unwersity of COÚJrado - Bou/der
ABSTRACI'
The paper reports on a research project which was conducted to investigate lhe influence of various factors upon lhe compresswe strengtk of holÚJw CÚly uni! masonry prisms. The research was done because, at the time, liule published data was availn.ble specifrcally regarding compressive behavior of holÚJw CÚly unit masonry. The increasing use of this c/n.ss of masonry, particuÚlrly in lhe western United States, was the 1TWtivating factor for initiating lhe research. The prism test is important since it is freqwmtly lhe basis of design values.
The research was designed to permit a preliminary overall assessment to be made of lhe relative influence of a fairly Úlrge numher of factors upon lhe compresswe strength of prisms. The factors of concern included masonry parameters as well as experimental parameters. lt was aLso expected that lhe project would illuminate areas in which further study and additional data would be required to 1TWre fully understand the struclural behavior of holÚJw CÚly unit masonry in compression.
Prisms tested in compression were made of different 1TWrlars, with different 1TWrtar joint configurations, of units of different widths, and of different slenderness ratios. Different boundary conditions at lhe prism-test machine interface were imposed and both net area and face shell caps were used.
Statistical methods were used to analyze lhe data in order to establish bivariate and multivariate modeLs expressing lhe relationships between ultimate compresswe strength and lhe variables measured. Step-wise multiple regression procedure5 used to establish multivariate relationships aLso aLWwed the relative influence of the measured variables to be assessed.
The research was supported by a grant from lhe COÚJrado Masonry lnstitute.
INTRODUCTION
The use of hollow day units, depicted in Figure I, as a basis for load bearing masonry has increased in recent years, particularly in the western areas of the United States. Several factors undoubtedly caused the increase in usage, some of which are:
I) Grouting and reinforcing are convenient because of the large celIs.
2) The unit is large, hence work progresses more rapidly than with standard brick.
3) It may be used as a through-the-wall unit.
4) The units, at least those produced in the western U.S., are relatively high strength.
The research project discussed here was the initial phase of a continuing effort to understand more fully the capabilities and limitations of holIow day unit masonry. As such, the work was planned to permit a preliminary overalI assessment of the factors influencing the ultimate compressive strength of holIow day unit prisms. The research was initiated because, at the time, little published data was available specificalIy regarding the compressive behavior of hollow day unit masonry built with the units depicted in Figure I. The prism was chosen as the primary test specimen since it is the generally accepted specimen by which f;" is determined.
FACTORS INFLUENCING PRISM STRENGTH1.3- 5.7- 15.17- 22
The factors which influence the ultimate compressive strength of holIow day unit prisms may be grouped into two dasses, i.e.:
I) Masonry factors: unit characteristics, mortar properties, joint thickness and configuration, and workmanship, alI of which should be the same as for fullscale masonry.
2) Experimental factors: the slenderness ratio, number of mortar joints, joint configuration, capping material and configuration, prism to platen interface condition, loading rate, environmental conditions, and care of specimens.
The factors which were considered in this research were limited in number due to time and budget constraints, but enabled certain behavioral phenomena to be observed. The masonry factors considered were:
I) Unit width 2) Mortar type (by proportion of ingredients) 3) Mortar joint configuration
The experimental factors considered were:
I) Prism-platen interface 2) Capping configuration 3) Sleriderness ratio

Session Il, Paper 15, Faclors Influencing the Compressive Strength 01 Hollow Clay Unit Prisrns 123
SCOPE
The quantities associated with the factors considered are :
I) Three widths of hollow day units: four, six, and eight inches nominal.
2) Four different mortar mixes with ratios of ingredients, in terms of parts by volume, of cement, lime and sand of 1:l!4:3, 1:1 /2:4-l/2, 1:1 :6, and 1:2:9.
3) Two types of mortar joints: net area bedded and face shell bedded.
4) Two types of capping configuration: net area and face shell. (The capping configuration used for a given prism was consistent with the mortar joint type.)
5) Two different prism-platen interface conditions: restrained and unrestrained.
6) Four slenderness ratios, which were achieved by building prisms two, three, four and five units high.
Variables other than those above were held constant, e.g., mortar flow, joint thickness, loading rate, curing procedure and cement type.
Two parallel sequences of tests were conducted. One sequence utilized prisms with the laterally restrained end condition , while the other utilized prisms with the laterally unrestrained end condition. Within each sequence the factors considered were varied in such a manner as to permit their influence to be assessed , i.e., each facto r was varied with the others held constant. Not ali possible combinations of conditions were assessed due to practical Iimitations. For example, the influence of slenderness ratio was examined only for prisms of 4-inch-wide units.
Tests of the component mortar and units, e.g., flow, cube strength, initial rate of absorption and flatwise compressive unit strength were made to provide data for subsequent analyses. Ali such tests were performed in accordance with applicable ASTM standards. 2
The tests on units and prisms which were performed are summarized in Table 1. Test Series 1 consists of unit flatwise compression tests; the remainder are prism tests.
MATERIALS
Hollow Clay Uni/s. Ali units lIsed were made of the same mixture of c1ay3. The units were manufactured by the stiff-mud extrusion method, were wire cut, and fired at a temperature of 2080°F. The geometrical properties of the units used are shown in Figure I.
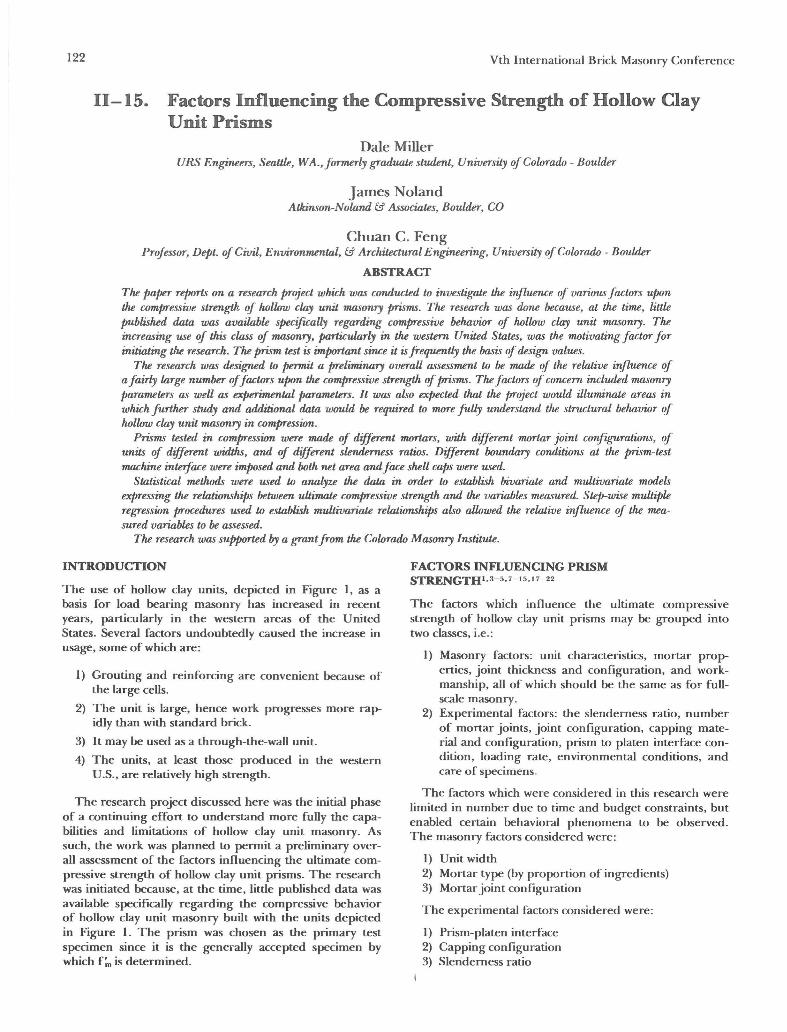
Interface Material. Approximately half of the prisms were tested using a combination of grease and plastic sheet, as sho\Vn in Figure 2, to reduce the lateral restraint caused by friction bet\Veen the prism cap and the test machine platen. The plastic sheet was approximately 0.0015 inches thick and the grease* had a petroleum jelly consistency.
Prisms tested with this interface condition were termed "unrestrained" prisms, although a complete elimination of interface friction was not expected.
* Keystone Specialized Lubricant, Keystone Lubricating Company.
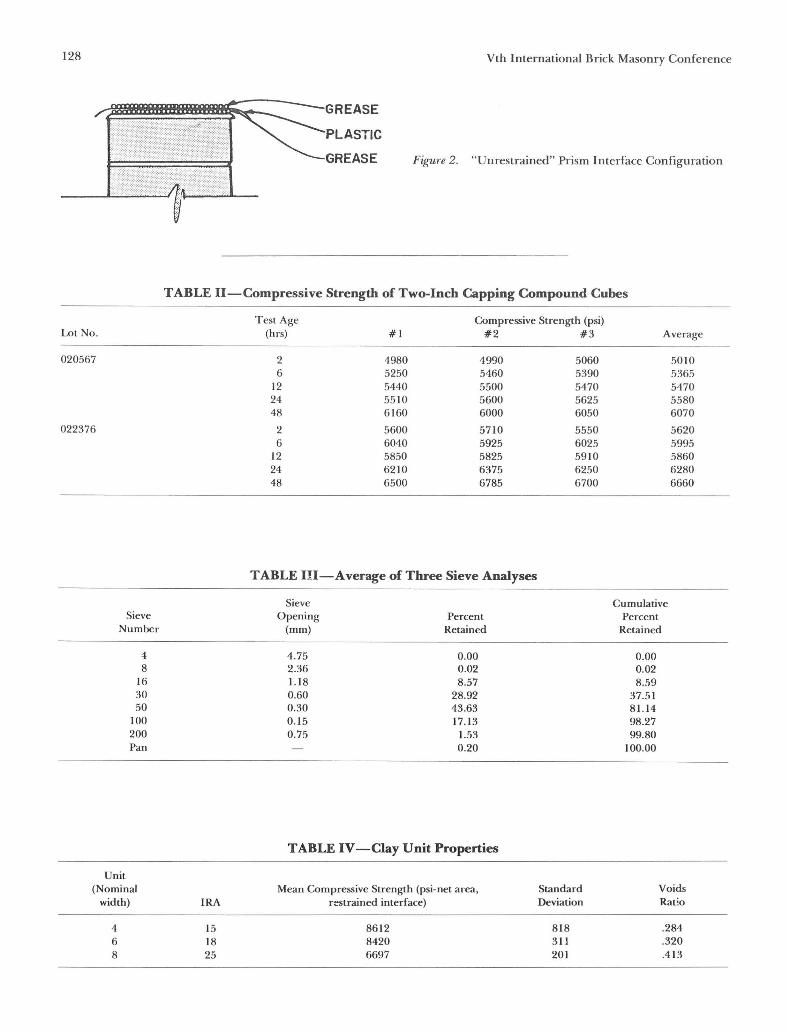
Capping Material. A sulphur-c1ay capping compound** supplied in powder form for subsequent melting and casting was used . The material meets the requirements of ASTM C617 Part 102 . Compressive strengths of t\Voinch cubes âre presented in Table 11.
Mortal'. Ali mortar was mixed using a laboratory mechanical mixer to a flow of 130± 5% . Quantities of ali ingredients, including water, \Vere measured by weight in orde r to accura tely control the mix proportions and for subsequent use in correlation studies.
Fresh Type I portland cement conforming to ASTM CI50-73a2
, and fresh hydrated lime conforming to ASTM C207-682 were used , each from a single manufacturer. A blended masonry sand was used from a single local buildir.g products supplier. The average of three sieve analyses is presented in Table IIl.
PRISMS
Ali prisms \Vere laid in stack bond with 3/8-inch mortar joints tooled to a slight concave finish. After four to six hours, the prisms \Vere placed in a fog room of 100% humidity and 70°F temperature for a period of seven days. Subsequently, the prisms finished curing in laboratory air at a temperature of 71 ± 3°F and a humidity of 20 to 50 percent.
TESTS
Mortar. Uniaxial compression tests of two-inch morta r cubes were periodically performed to establish the strength value for subsequent analyses and as a check on morta r variability . Procedures used in a previous program6
were strictly followed to minimize experimental error. Resu!ts were very consistent; average values are presented in Tables V and VI.
Units. Initial rate of absorption (I RA) and flatwise compressive strength were measured on samples of each width unit following procedures of ASTM C672
. The results are presented in Table IV.
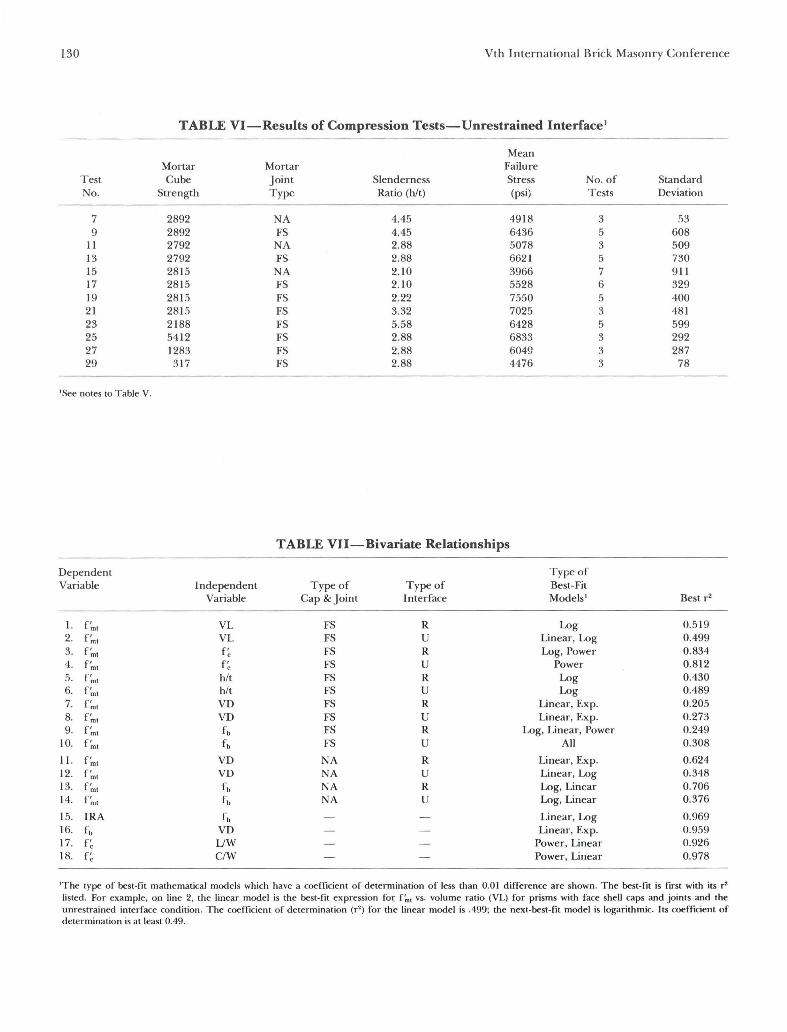
Plisms. PI'ior to placing prisms in the test machine, both upper and 10\Ver test machine platens were c1eaned . Prisms \Vere carefully centered in the 300,000 Ib. compression test machine, which has a spherically seated upper platen. Load was applied in accordance with ASTM E447-742 . Ultimate load was noted, as was the failure mode (where possible) . Results of compression tests on restrainedinterface prisms are presented in Table V, and results of tests on unrestrained-interface prisms âre presented in Table VI.
The basic sample size for each configuration was planned to consist of three prisms. However, if results from the set of three were inconsistent, additional prisms of the same configuration \Vere built and tested . Results of additional tests were merged with results of initial tests; in no insta nce \Vere results discarded.
Ali prisms basically failed by lateral tensile splitting across the narrow si de, which is similar to the failure mode of solid-unit prisms3 .4 ,19,20,""" The splitting generally occurred adjacent to the face shells in the case of net area
** "Cylcap," manufactured by DFC Ceramics.

124
capped and mortared prisms, and near the center of the webs in the case of face shell capped and mortared prisms, as shown in Figure 3. Prisms with restrained interface appeared to exhibit signs of shearing failure in the crosswebs, while those with the unrestrained interface exhibited some tendency towards lateral splitting within the face shell itself.
DATA ANALYSIS
Quantitative. Based on the results of Tests 6, 8, 10, 12, 14 and 16 (Table V), the average ratio, for restrained interface conditions, of Cn, obtained from face shell capped and mortared prisms to f;", obtained using net area capped and mortared prisms is:
Rcr = 1.19. (1)
Similarly, based on the results ofTests 7, 9,11,13,15 and 17 (Table VI), for the case of unrestrained interface conditions:
Rcu = 1.33. (2)
The average ratio of f;", obtained using restrained interface conditions and net area cap and joints to that obtained using unrestrained interface conditions with net area cap and joints is:
Rina = 1.14. (3)
Similarly, for the case of face-shell cap and joints:
Rüs = 1.02. (4)
The average standard deviation of ali prism tests performed under restrained interface conditions is (j = 463, while the average for those under unrestrained interface conditions is (j = 440.
Statistical. Bivariate and multivariate regression studies were performed using the data presented in Tables IV - VI and measured unit and morta r properties. Best-fit relationships were determined using four mathematical models, one linear and three curvilinear, i.e.,
Linear: y = Co + C(X( + C2XZ + .. . CiX i + . .. (5)
+ CoXo,
Exponential: Y = Exp (Co + C(X( + ... + CiX i + .. .
Logarithmic: Y = In (Co + C(X( + . .. + CiX i + ... + CoXo,
Power:
in which:
Y is the dependent variable, X i is the ith independent variabie, C i is the ith constant,
(6)
(7)
(8)
n is the number of independent variables in the equation . In bivariate models, n = I.
In each case, the predictive accuracy was measured by the coefficient of determination, r 2
• A generally available
Vth International Brick Masonry Conference
computer routine l6 was used to perform the statistical analyses.
The statistical analyses performed yielded a large number of empirical relationships which are presented elsewhere l4
• The primary interest was to observe the degree to which the variables measured influenced ultimate prism compressive strength, f;"" and to observe the strength of relationships between certain pairs of measured variables.
The bivariate relationship studied, the type of cap and joint, the prism-platen interface condition, and the type of the best-fit models and the corresponding coefficients of determination are presented in Table VII. In each case, ali factors othei- than the independent variable were constant-value.
Several observations may be made regarding the bivariate relationships studied in the case offace shell capped and mortared prisms:
1) For a given prism configuration and for both restrained and unrestrained interface conditions, over 80% of the variation in ultimate compressive stress may be attributed to variations in mortar ultimate stress as measured by the uniaxial compression test of two-inch cubes.
2) Approximately 50% of the variation in f'mt is explained by variations in the volume ratio or by variations in slenderness ratio. Volume ratio is a slightly better prediction in this case. Since ali units were of the same height and ali joints of the same thickness, volume ratio and slenderness ratio would be strongly correlated, and therefore both factors would be expected to be about the same as predictors of f;",. A strong relationship between volume ratio (expressed in terms of number of joints) and f;", has been observed for the case of solid day unit prisms l7
•
3) The differences in coefficients of determination between relationships relating f b to f;", for the case of net area capped and mortared restrained-interface prisms (Iine 13 of Table VII) and the relationships for ali other combinations of interface type and capped-mortared area (Iines, 9, 10, and 14) are quite large. Similar differences in r 2 between the relationships of line lI and lines 7, 8 and 12 also are present and are explained by the dose relationship between voids ratio (VD) and the ultimate compressive unit stress, f b'
Multiple regression and analyses were performed in an attempt to provide an understanding of how much of the variation in f;"t was accounted for by the joint linear* influence of the variables measured, e .g., f'b, f'c- The variables were induded in the empirical equations in a stepwise fashion, i.e., the variable that explained the greatest amount of variation of f;"t entered first, the variable that explained the greatest amount of variation in conjunction with the first entered second, and so on. A tolerance value was used which would permit a variable to be entered if the proportion of its own variance not explained by the other independent variables exceeded 0.1. Seven steps were taken in ali cases.

Session 11, PapeT 15, FactoTS Infiuencing the CompTessive StTenglh of Hollow Clay Unil Prisms 125
A summary of the sequence in which variables were induded in the multi pie regression for each of the models considered and the corresponding values of r 2 at each step are presented in Table VIII(a) and (b) for the restrained and unrestrained interface series respectively. It should be noted that the regression analyses did not indude cap and joint configuration as a variable.
One may observe that the coefficients of determination (r2) for ali models* for both the restrained and unrestrained interface series are essentially the same at lhe third step and beyond, and that r 2 for the first two steps for unrestrained interface prisms is somewhat better than for the restrained interface series. Further, one may note that in both cases volume ratio (VL) and one of the unit variables, thickness (TH) or voids radio (VD), followed by one of the mortar variables, cement-to-water ratio (CJW)
or lime-to-water ratio (UW) generally are the first three variables induded (in that order) and account for most of the variance in ultimate prism compressive stress (f:nJ.
'CONCLUSIONS
The condusions which may be made based upon the tests and analyses performed must be considered tentative at this time, due to the small data base. Some trends are quite interesting, and should be verified by additional experimentation and more detailed analyses since, if true, the methods by which f:n used as a basis for design is determined could be affected. The results offer some insight into the factors influencing prism strength . The authors submit the foUowing for consideration :
I) The strong relationship between IRA and fb observed here and in another program involving solid day units~ suggests a convenient means whereby producers can evaluate unit compressive strength with reasonable accuracy.
2) The differing values of r 2 in the bivariate relationships between f:nt and fb suggest the possibility that net area capping/mortaring in combination with a restrained interface may act to suppress or screen out the influence of other variables upon f:nt. In other words, interface friction on the full net area may attribute undue significance to unit strength.
3) Face-shell capping and mortaring was investigated beca use this configuration seems more representative of ungrouted hollow unit construction. Failure stress for prisms so constructed is of the order of 20%-30% higher, based upon interface conditions (see Eqs. (I) and (2)) than for prisms conventionally constructed. This could be of some significance in determining design values.
4) The effect of interface restraint was more pronounced in the case of net area capping and mortaring (Eq. (3) vs. Eq. (4)). The effect would be an impression of a higher strength than actually exists
*Curvitinear models were linearized in order to be amenable to linear multiple regression procedures, and subsequently transformed back to curvilinear forms. This step is a program option l 6
.
if it is granted that reduced interface friction is more representative of full-scale masonry.
5) The sum of preceding comments 2) , 3) and 4) suggests that the face-shell capped and mortared prism with reduced, if not eliminated, interface friction would be a preferable way ot determine ultimate compressive stress.
6) The variability of results, as measured by standard deviation, was about the same for the restrained interface series as for the unrestrained interface series, and was not excessive. This indicates to the authors that sim pie procedures, well followed, yield consistent data.
7) For a given type of unit, mortal' strength appears to be quite influential with respect to f:nt. The ratio of total mortar volume to total unit volume (VL) in a prism surfaced as a significant predictor variable in co~unction with certain unit geometrical properties and mortal' lime/water or cement/water ratios. As stated in Ref. (17), the VL ratio can be related to the total lateral force exerted by the fTlortar upon the units, although in the case of hollow unit masonry the exact mechanism by which failure is precipitated is not defined .
Additional work is needed to confirm or reject the foregoing; the indusion of a wider range of unit strengths is especially important. Additional study of means of reducing interface friction seems warranted, as does refined modeling of hollow day unit prism behavior.
ACKNOWLEDGEMENTS
The research program was supported by a grant by the Colorado Masonry Institute, Robert Sandoval, Executive Director. Robert Helfrich, Technical Director. It is the fifth in a continuing series to investigate basic strength properties of day-unit masonry .
NOTATION
fc (or FC)-
FSh/t (or HT)lRALWNA-
The cement to water ratio in mortar as mixed. Ultimate flatwise unit compressive stress based on net area.
Ultimate stress, in psi, of mortar as determined by uniaxial compression test of two-inch cubes. Ultimate prism compressive stress based upon the are a of mortar in contact with the units in psi.
Denotes cap and mortar on face shell only.
Prism height to thickness ratio. !nitial rate of absorption in grams/30 in2/min . The lime to water ratio in mortar as mixed. Denotes cap and mortar on the entire unit net area. Ratio for unTestrained interface conditions of f:nt obtained from aJace shell capped and mor-

126
TH
VD-
VL-
tared prism to f~t obtained from a net area capped cand mortared prism. Ratio for unrestrained interface conditions, of f~t obtained from aface shell capped and mortared prism to f~t obtained from a net area capped and mortared prism. Ratio of f~t obtained using net area capped and mortared prisms and restrained interface conditions .0 that obtained using unrestrained interface conditions with net area caps and joints. Ratio of f~t obtained using face shell capped and mortared prisms and restrained interface conditions to that obtained using unrestrained interface conditions with face shell caps and joints. Pounds per square incho Coefficient of determination: a measure of the proportion of variance in one variab le explained by the other(s). Unit or prism thickness, i.e. , width.
'd . Gross Unit Area - Net Unit Area VOl s ratIO = G A ross rea
Ratio of the total volume of mortar to the total volume of the day units in a prism.
REFERENCES
I. Anderson, G.W., "Stack-Bonded Small Specimens as Design and Construction Criteria," Proceedings of the Secand lnternational Brick Masonry Conference, British Ceramics Research Association, 1971 , pp. 38-43. 2. Annual Book of ASTM Standards, American Society for Testing and Materiais, Philadelphia, Pa. 3. Baur, ].C., Noland, ].L., Chinn, ]., "Compression Tests of Clay Unit Prisms," Proceedings of the North Americnn Masonry Conference, The Masonry Society, Denver, Colorado, 1978. 4. Brown, R.H ., "Prediction of Brick Masonry Prism Strength from Reduced Constraint Brick Tests," Masonry: Past and Present, ASTM, Philadelphia, 1975, pp. 171 - 194. 5. Francais, A.]., Horman, C.B. and jerrems, L.E., "The Effect of joint Thickness and Other Factors on the Compressive Strength of Brickwork," Proceedings of the Secand lnternational Brick Masonry Conference, British Ceramics Research Association, 1971, pp.31 -37.
Vth International Brick Masonry Conference
6. Frey, D., "Effects of Constituent Proportions on Uniaxial Compressive Strength of 2-lnch Cubes Specimens of Masonry Mortars," M.S. Thesis, University of Colorado, Boulder, 1975. 7. Grenley, D.G., "Study of the Effects of Certain Mortars on Compressive and Flexural Strength of Masonry," Designing, Engineering and Constructing with Masonry Products, Houston, 1969, pp.28-33. 8. Hilsdorf, H.K., "lnvestigation into the Failure Mechanism of Brick Masonry Loaded in Axial Compression," Designing, Engineering and Constructing with Masonry Products, Gulf Publishing Co., Houston, 1969, pp. 34-41. 9. lngberg, S.H., "Factors Affecting Brick Masonry Strength," Proceedings of American Society for Testing anti Materiais, Vol. 21, Part II, 1924, pp. 909-919. 10. Khoo, C.L. and Hendry, A., "A Failure Criterion for Brickwork in Axial Compression," Documentation, 3. lnternational Brick Masonry Conference, Bonn, Germany, 1975, pp. 139-145. 11. Krefield, W., "The Effects of Shape of Specimens on the Apparent Compressive Strength of Brick Masonry," Proceedings of American Society for Testing and Materiais, Vol. 38, Part I, 1938, pp.363-370. 12. Mayes, R., and Clough, R., A Literature Survey-Compressive, Tensile Bond and Shear Strength of Masonry, Report No. EERC 75-15, College of Engineering, University of California, Berkeley, 1975. 13. McBurney, ].W., "The Effects of Strength of Brick on Compressive Strength of Brick Masonry," Proceedings of American Society for Testing and Materiais, Vol. 28, Part II , 1928, pp. 605-634. 14. Miller, D.E., "Preliminary lnvestigation of Compressive Strength of Hollow Clay Unit Masonry," M.S. Thesis, University of Colorado, Boulder, 1979. 15. Monk, C.B., jr., "A Historical Survey and Analysis of the Compressive Strength of Brick Masonry," Research Report No. 12, Structural Clay Products Research Foundation, Geneva, m., 1967. 16. Nie, N., HulJ, C., jenkins,]. , Steinbrenner, K., and Bent, D., Statistical Package for the Social Sciences, McGraw-Hill Book Company, Second Edition, 1975. 17. Noland, ].L., Hanada, K.T., "The Effect of Slenderness and End Conditions on the Strength of Clay-Unit Prisms," Proceedings of the North Aw.erican Masonry Conference, The Masonry Society, Denver, Colorado, Aug. 1978. 18. Rao, R.N.S., "Experimental lnvestigation on Structural Performance of Brick Masonry Prisms," Designing, Engineering and Constructing with Masonry Products, Gulf Publishing Co., Houston, 1969, pp. 74-79. 19. Sahlin , S., Structural Masonry, Prentice Hal!, Englewood Cliffs, New jersey, 1971. 20. Structural Clay Products lnstitute, Recammended Practice for Engineered Brick Masonry, McLean , Virginia, 1969. 21. Uniform Building Code, ICBO, Whittier, California, 1976. 22. Watstein, D., "Relation of Unrestrained Compressive Strength of Brick to Strength of Masonry," ] ournal of Materiais, ]MLSA, Vol. 6, No. 2,june 1971, pp. 304-319.

Session 11, Paper 15, Fac/oTS lnfluencing the Compressiue Strenglh of Hollow Clay Unit Prisms
~ .. UNIr
IC)DDI~· !=IX) ~~~~~-i~
_ ri) IX) ri)
It)
Test Series
2
3
4
Test No.
I 2 3
6 7 8 9
10 11 12 13 14 15 16 17
18 19 20 21 22 23
24 25 26 27 28 29
NA -Net Area Cap andJoint FS - Face Shell Area Cap and Joint R - Reslrained Interface
ELEVATION
Figure 1. Geometry of Hollow Clay Units
TABLE I-Compression Test Summary
Unit Mortar Width
NA 6" NA 8" NA 4"
I:Yz:4Yz 4" I:Yz:4Yz 4" I:Yz:4Yz 4" I:Yz:4Yz 4" I:Yz:4Y2 6" I:Yz:4Y2 6" I:Yz:4 Y2 6" I:Yz :4Y2 6" I:Yz:4Y2 8" I: Yz:4Y2 8" I :Yz:4Yz 8" I:Yz:4Yz 8"
I:Yz:4 Y2 4" I: Yz:4Y2 4" I:Yz:4Yz 4" I:Yz :4Yz 4" I :Yz:4Y2 4" I:Y2 :4Yz 4"
I: Y-í:3 6" I :Y-í: 3 6" 1:1:6 6" I: 1:6 6" 1:2:9 6" 1:2:9 6"
U - Unreslrained Interface N/A-Nol AppIicable
Type Bed/ Cap
NA NA NA
NA NA FS FS NA NA FS FS NA NA FS FS
FS FS FS FS FS FS
FS FS FS FS FS FS
Units/ Prism
4 4 4 4 4 4 4
4 4 4 4 4
2 2 3 3 5 5
4 4 4 4
4 4
127
No.of Interface Specimens
R 6 R 6 R 9
R 3 U 3 R 5 U 5 R 3 U 3 R 3 U 5 R 6 U 7 R 6 U 6
R 3 U 5 R 3 U 3 R 5 U 5
R 3 U 3 R 3 U 3 R 5 U 3
128
Lot No.
020567
022376
Sieve Number
4 8
16 30 50
100 200 Pan
Unit (Nominal
width)
4 6 8
REASE
C
Vth International Brick Masonry Conference
Figure 2. "Unrestrained" Prism Interface Configuration
TABLE I1-Compressive Strength of Two-Inch Capping Compound Cubes
Test Age Compressive StTength (psi) (hrs) #1 #2 #3
2 4980 4990 5060 6 5250 5460 5390
12 5440 5500 5470 24 5510 5600 5625 48 6160 6000 6050
2 5600 5710 5550 6 6040 5925 6025
12 5850 5825 5910 24 6210 6375 6250 48 6500 6785 6700
T ABLE IH - A verage of Three Sieve Analyses
Sieve Opening PeTcent
(mm) Retained
4.75 0.00 2.36 0.02 l.l8 8.57 0.60 28.92 0.30 43.63 0.15 17.13 0.75 1.53
0.20
TABLE IV-Clay Unit Properties
Mean Compressive Strength (psi-net area, Standard IRA restrained interface) Deviation
15 8612 818 18 8420 311 25 6697 201
Average
5010 5365 5470 5580 6070
5620 5995 5860 6280 6660
Cumulative Percent
Retained
0.00 0.02 8.59
37.51 8l.l4 98.27 99.80
100.00
Voids Ratio
.284
.320
.413

Session lI, Paper 15, Factors 1nfluencing the Compressiue Strength of Hollow Clay Unit Prísms
Figure 3. Failure of Face Shell Loaded UnrestrainedInterface Prism
TABLE V -Results of Compression Tests-Restrained Interface Prisms
Mean3
Mortal" Mortar2 Failure Test Cube ]oint Slenderness Stress No.of No. Strength Type Ratio (h/t) (psi) Tests
6 2892 NA 4.45 5434 3 8 2892 FS 4.45 6220 5
10 2792 NA 2.88 5786 3 12 2792 FS 2.88 6640 3 14 2815 NA 2.10 4505 6 16 2815 FS 2.10 5740 6 18 2815 FS 2.22 8122 3 20 2815 FS 3.32 6660 3 22 2188 FS 5.58 6536 5 24 5412 FS 2.88 7350 3 26 1283 FS 2.88 6136 3 28 317 FS 2.88 4744 5
I Mean value of three teslS. 'NA = Nel area bedded & capped ; FS = Face shell bedded & chapped. 3Failure stress presenled is based on nel area or face shell area as applicable.
129
Standard Deviation
314 336 194 650 422 636 340 453 569 550 557 534
130 Vth International Brick Masonry Conference
TABLE VI-Results ofCompression Tests-Unrestrained Interface!
Mean Mortar Mortar Failure
Test Cube Joint Slenderness Stress No.of Standard No. Strength Type Ratio (h/t) (psi) Tests Deviation
7 2892 NA 4.45 4918 3 53 9 2892 FS 4.45 6436 5 608
11 2792 NA 2.88 5078 3 509 13 2792 FS 2.88 6621 5 730 15 2815 NA 2.10 3966 7 911 17 2815 FS 2.10 5528 6 329 19 2815 FS 2.22 7550 5 400 21 2815 FS 3.32 7025 3 481 23 2188 FS 5.58 6428 5 599 25 5412 FS 2.88 6833 3 292 27 1283 FS 2.88 6049 3 287 29 317 FS 2.88 4476 3 78
'See notes to Table V.
T ABLE VII-Bivariate Relationships
Dependent Type of Variable Independent Type of Type of Best-Fit
Variable Cap &Joint Interface Models' Best r '
I. f~t VL FS R Log 0.519 2. f;n' VL FS U Linear, Log 0.499 3. f~t f' c FS R Log, Power 0.834 4. f~t f' c FS U Power 0.812 5. f~t h/t FS R Log 0.430 6. f~t h/t FS U Log 0.489 7. f~t VD FS R Linear, Exp. 0.205 8. f~t VD FS U Linear, Exp. 0.273 9. f~t fb FS R Log, Linear, .Power 0.249
10. f~t fb FS U Ali 0.308
11. f~t VD NA R Linear, Exp. 0.624 12. f~t VD NA U Lin.:ar, Log 0.348 13. f:O, fb NA R Log, Linear 0.706 14. f~t fb NA U Log, Linear 0.376
15. IRA fb Linear, Log 0.969 16. fb VD Linear, Exp. 0.959 17. f' c UW Power, Linear 0.926 18. f~ C/W Power, Linear 0.978
'The type of best-fit mathematical models which have a coefficient of determination of less than 0.01 difference are shown. The best-fit is first with its r' listed . For example, on line 2, the linear model is the best-fit expression fOr f:", vs. volume ratio (VL) for prisms with face shell caps and joints and the unrestrained interface condition. The coefficient of determination (r') for the linear model is .499; the next-best-fit model is logarithmic. Its coefficient of determination is at least 0.49.

Session 11, Paper 15, Factors 1nfluencing the eompressive Strength oI Hollow elay Unit Prisms 131
T ABLE VIII(a)-Multiple Regression Steps-Restrained Interface Series
INCLUSION STEP
I 2 3 4 5 6 7 Type of Variables Not Equation Varo r Varo r Varo r Varo r Varo r Varo r Varo r Included
linear TH .28 VL .19 C/W .72 FB .74 UW .80 HT .81 FC .81 IRA, VD Exponential TH .29 VL .19 C/W .72 FB .74 UW .81 HT .81 FC .81 IR, VD Power VL .29 C/W .50 FB .76 LW .78 FC .79 IRA .80 HT .81 VD,TH Logarithmic VD .28 VL .52 C/W .77 FB .78 UW .79 FC .80 HT .81 IRA, TH
TABLE VIII(b)-Multiple Regression Steps-Unrestrained Interface Series
INCLUSION STEP
I 2 3 4 5 6 7 Type of Variables Not Equation Varo r Varo r Varo r Varo r Varo r Varo r Varo r Included
Linear VL .13 VD .64 UW .77 TH .78 C/W .81 FC .81 HT .81 IRA, FB Exponential VL AO VD .61 UW .72 TH .73 C/W .77 HT .77 FC .77 IRA, FB Power VL .37 VD .60 UW .69 FB .71 HT .73 FC .83 C/W .79 IRA, TH Logarithmic VL AI IRA .64 UW .75 FB .76 HT .77 FC .77 C/W .82 VD,TH