10th l december 2016,...
TRANSCRIPT
Lake 2016: Conference on Conservation and Sustainable Management of Ecologically
Sensitive Regions in Western Ghats [THE 10TH
BIENNIAL LAKE CONFERENCE] Date: 28-30
th December 2016, http://ces.iisc.ernet.in/energy
Venue: V.S. Acharya Auditorium, Alva's Education Foundation, Sundari Ananda Alva Campus, Vidyagiri, Moodbidri, D.K. Dist., Karnataka, India – 574227
Proceedings – Lake 2016: Ramachandra T V, Subash Chandran M D, Mohan Alva, et al., 2018. Conservation and Sustainable Management of Ecologically Sensitive
Regions in Western Ghats, , Sahyadri Conservation Series 65, , ENVIS Technical Report 120 Environmental Information System, CES, Indian Institute of Science,
Bangalore 560012
445
Tree, People and City:
A study on Green covers of rapidly urbanizing Mangalore city
Sangeeta S1 and Smitha Hegde
2
1Urban Design and Development, Faculty of Architecture, Manipal Institute of Technology, Manipal 2 Rondano Biodiversity Research Laboratory, Department of Post Graduate studies and Research in
Biotechnology, St.Aloysius College, Mangalore 575 003
Abstract Steady increase in population and automobiles on the streets and lack of vision and planning has made cities
denser and compact with ever diminishing the much needed green spaces. Green cities have become a utopian
concept. Increase in global warming and creation of Urban Heat Islands have become common. In India trees are
given Ethical, Social and Emotional dimension but conversely, trees and green spaces are neglected by the Urban
Developers and Law Makers. Since 1980’s, there was a wide approach towards sustainable cities, making cities
from gray to green but here also role of green spaces was limited to “city beautification”. Trees are an important
asset for ecological sustainability and biodiversity. Mangalore is perched strategically on the threshold of a
“smart city”. This study gives an account of the green cover present in the city of Mangalore, highlighting the
importance of green zones in major cities not only for its aesthetic appeal but also for benefits they provide to
environment and human population.
Key words: Global warming, Green cover, Urbanisation
INTRODUCTION In the beginning of 20th century, only one tenth of the global population was living in the cities which now has
exceeded 50 percent. This is expected to increase further in future. With the rapid urbanization there has been an
increase in the level of air pollution and global temperature and a steady decrease in green cover of the city.
According to a report by “Save the Children”, every fourth child living in urban India, fall sick every month on
average because of low immunity. Contamination of ground water and increase in the level of air pollution has
damaged immune system of children. Doctors associate high levels of suspended particulate matter and sulphur
dioxide with increased mortality, morbidity and impaired pulmonary function.
The average green space area per capita and green space ratios are mainly two statistical indexes for quantifying
green cover of the city. In 19th century, some experts had put forth a rule, the average volume of carbon dioxide
exhaled by city residents as a standard for determining the green space area per capita and accordingly a 50 m²
green space per person was proposed. In 20th century, experts in Germany, Japan and other countries proposed a
140 m² suburb forest area per capita or a 40 m² urban green space per inhabitant as standard for reaching a
balance between carbon dioxide and oxygen, to meet the ecological balance and compensating human
intervention. Some of the developed countries have adopted green space of 20 m² park area per capita as a
general standard. World Health Organization suggests ensuring at least a minimum availability of 9 m² green
open space per city dweller. Ecological and Environmental Organizations of United Nations had put forward a
standard of 60 m² park area per person as the best living standard for urban environment (Xiao-Jun 2009).
Current challenge in an urban city is to provide clean air and healthy living through conservation and restoration
of urban green spaces. Trees in an urban system helps in maintaining the ecosystems by conserving the
biodiversity by removing atmospheric pollutants, carbon sequestration, recharging oxygen back to the
environment, reducing urban noise, mitigating urban heat island effects and regulating microclimate (Bolund,
2009). Trees helps in improving environment and quality of life in the city.
An urban green space comprises of urban parks, forests and related vegetation. The term “urban trees” includes
trees growing both within the built environment as well as road-side avenues and public places in urban systems.
These add value to the inhabitants in an urban area. Forests Act says 30% of minimum forest cover should be
maintained by a state. In India, master plan of a city suggests approximately 20 to 30% coverage of the total
geographical area for green spaces. According to FSI Report of Delhi 2009, as per population data 2001, average
tree and forest cover is about 20% of geographical area and about 21 m² /inhabitant. From 2001, population in
Lake 2016: Conference on Conservation and Sustainable Management of Ecologically
Sensitive Regions in Western Ghats [THE 10TH
BIENNIAL LAKE CONFERENCE] Date: 28-30
th December 2016, http://ces.iisc.ernet.in/energy
Venue: V.S. Acharya Auditorium, Alva's Education Foundation, Sundari Ananda Alva Campus, Vidyagiri, Moodbidri, D.K. Dist., Karnataka, India – 574227
Proceedings – Lake 2016: Ramachandra T V, Subash Chandran M D, Mohan Alva, et al., 2018. Conservation and Sustainable Management of Ecologically Sensitive
Regions in Western Ghats, , Sahyadri Conservation Series 65, , ENVIS Technical Report 120 Environmental Information System, CES, Indian Institute of Science,
Bangalore 560012
446
Delhi has increased and is projected to increase rapidly in future. Services such as enormous housing
development, industrial and infrastructure development etc. has come at the cost of trees.is provided at the cost
of trees. But according to a report published (Apr 16 2015 : The Times of India, Delhi) over one lakh trees were
cut during 2006 - 2014 to make way for Delhi Metro and PWD projects, bringing down the city's green cover to
10%. Metros and Highways have led to massive deforestation. Bangalore and Delhi are best examples for this.
The green cities of 1980’s with green cover of 71% changed to 17% in just three decades. Gray cities with huge
concrete covered ground are creating urban heat islands and making cities unlivable. Practical solution for
reviving and revitalizing the city is by reducing the rate of deforestation for city services. Growing more trees in
the cities will hence control the carbon level of atmosphere. This can be achieved only by mutual support and co-
ordination at different levels from law makers, planners and designers to the common public at an individual
level.
Urban dwellers are dependent on motorized vehicles. Increase of private vehicles in cites, have increased the
level of carbon emission. New Delhi recently was in news for its increased air pollution where more than its 16
million inhabitants are exposed to severely high pollutant concentrations on an annual average basis. It is in this
regard that the Government of Delhi came up with a strategy of introducing Odd-Even scheme in which
privately owned cars were restricted to run on the roads on alternate days based on the last digit (odd/even) of the
registration number. The Delhi government’s scheme was an important move in opening a debate on long-term
solutions to India’s urban problems. Urban environments are an opportunity as it contributes the maximum in
nation’s growth and development. Here lies the importance of implementing effective policies and guidelines for
the protection of public health. Although studies show that odd-even scheme did not work in the sense of
marginal reduction in air pollution (Analysis by Council on Energy, Environment and Water), but it was a clear
success in a political sense and policy level that urban cities of India need more attention to improve the air
quality and that is what urbanizing cities need right now.
Urban planners and designers pay more attention in providing public transport system and discouraging private
vehicles, improving the traffic congestion of the city but rarely focus on improving the air quality by increasing
green cover of the city. Trees can lock up large amounts of carbon in their wood. This is called Carbon
Sequestration. Carbon sequestration is a mechanism for the removal of carbon from the atmosphere by storing it
in the biosphere. Trees play an important role in the global carbon cycle by sequestering a substantial amount of
carbon dioxide from the atmosphere.
STUDY AREA
Mangalore, one of the fastest growing metropolitan city in India, is the administrative headquarters of the
Dakshina Kannada district. The city is on the west coast of the Karnataka state and is the largest of all the eight-
urban centers of the district. Mangalore is also the fourth largest city in terms of population in the state.
Mangalore has been selected as one of the Smart Cities to be developed under the Ministry of Urban
Development (MoUD), Government of India's Smart City Mission. Smart city concept (SCC) talks about
improving livability, sustainability and economic development of the city but SCC gives more emphasis on
quantitative scaling of infrastructure and services in terms of transportation, water supply and waste disposal.
Action plans and strategies have neglected the qualitative improvement of the city by providing more green
spaces and conserving the existing green cover of the city.
The Urban Heat Island is a phenomenon where temperatures in urban areas are warmer than the surrounding
rural countryside. This is because more heat has been trapped by concrete structures of the city including roads
and buildings. Studies on microclimate formation through built-up morphology and urban shade trees have
clearly established the importance of urban trees in alleviating the heat island effect in a hot and humid climate
(Bar, 2009). The climate variability in Karnataka was analyzed in 2010 by the India Meteorological Department
(IMD) by analysing daily rainfall data for the period of 1971–2005. Climatic Research Unit (CRU) data for the
temperature for the period 1901–2002 shows that the Costal Karnataka districts have an average rainfall of >25
mm/day. Decrease in precipitation trend has been observed in Coastal Karnataka. Rainfall has decreased by
17.69 mm/day/100 year in Mangalore. There is increase in minimum temperature by 0.141 °C/100 year and
increase in maximum temperature by 0.148° C/100 year in Mangalore (Singh, 2010). As urban green spaces and
urban forests decrease, evapotranspiration rate decreases. Thus, a common measure to mitigate urban heat island
effect is to increase urban green spaces.
Lake 2016: Conference on Conservation and Sustainable Management of Ecologically
Sensitive Regions in Western Ghats [THE 10TH
BIENNIAL LAKE CONFERENCE] Date: 28-30
th December 2016, http://ces.iisc.ernet.in/energy
Venue: V.S. Acharya Auditorium, Alva's Education Foundation, Sundari Ananda Alva Campus, Vidyagiri, Moodbidri, D.K. Dist., Karnataka, India – 574227
Proceedings – Lake 2016: Ramachandra T V, Subash Chandran M D, Mohan Alva, et al., 2018. Conservation and Sustainable Management of Ecologically Sensitive
Regions in Western Ghats, , Sahyadri Conservation Series 65, , ENVIS Technical Report 120 Environmental Information System, CES, Indian Institute of Science,
Bangalore 560012
447
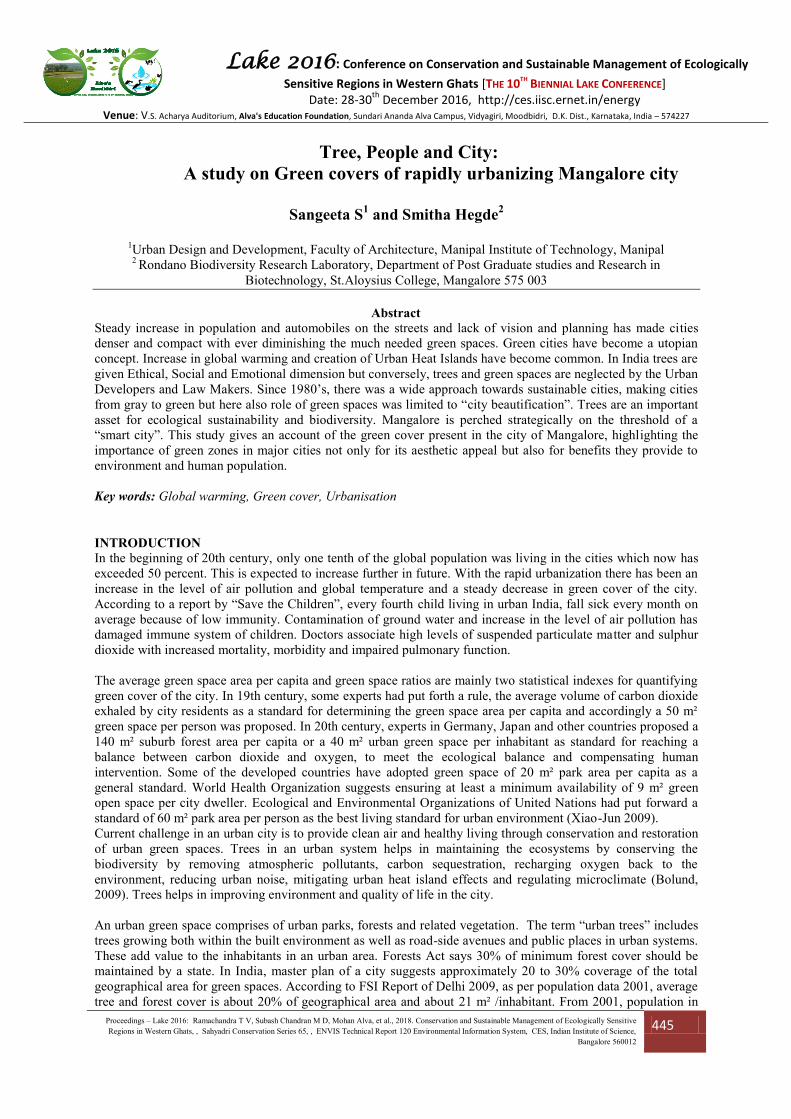
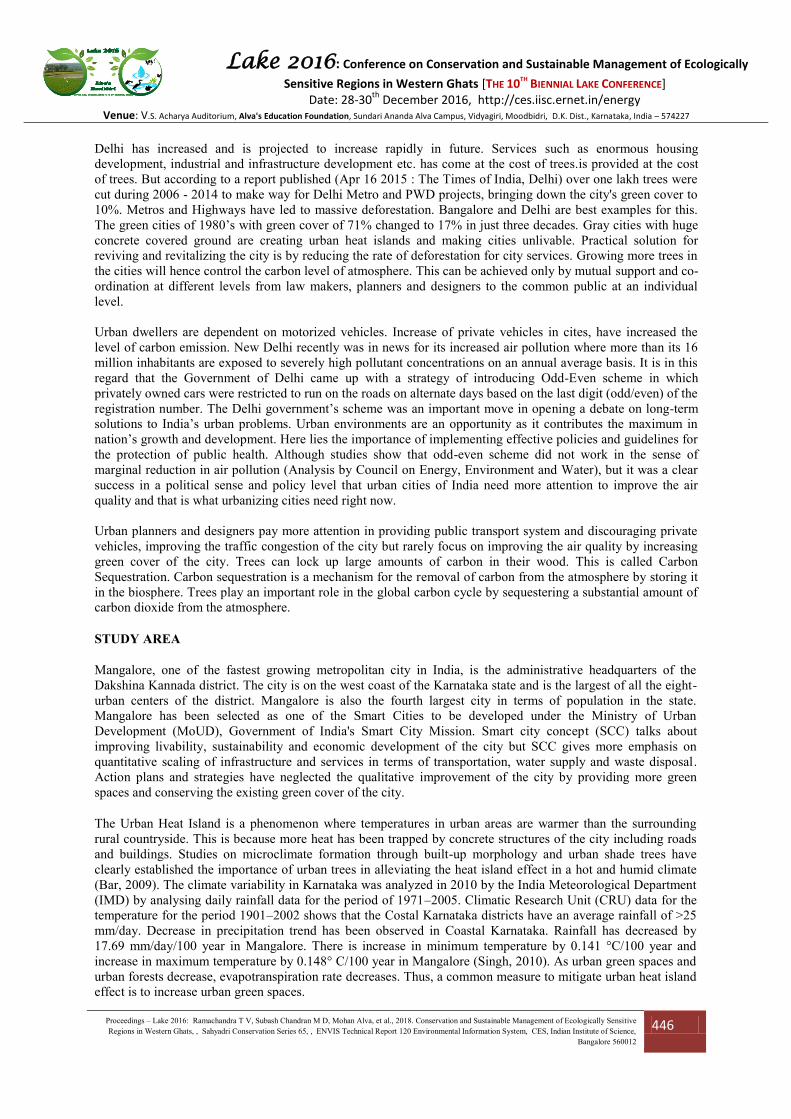
Landsat 8 image composites made from Level L1T orthorectified scenes, using the computed Top-of-
Atmosphere (TOA) reflectance are taken to analyse the change in green cover of the city. The two MODIS VIs,
the normalized difference vegetation index (NDVI) and enhanced vegetation index (EVI), are produced globally
over land at 1 km and 500 m resolutions and 16 day compositing periods. NDVI is chlorophyll sensitive and EVI
The Enhanced Vegetation Index (EVI) is generated from the Near-IR, Red and Blue bands of each scene, and
ranges in value from -1.0 to 1.0. These composites are created from all the scenes in each annual period
beginning from the first day of the year and continuing to the last day of the year. All the images from each
year are included in the composite, with the most recent pixel as the composite value.
Mangalore Landsat 8 Annual EVI Composite
image, 2013
Mangalore Landsat 8 Annual EVI Composite
image, 2016
Figure 1: Mangalore Land Sat Images
Images taken: October 13, 2016, Source: Google Earth Engine
Mangalore MODIS Terra Daily NDVI
image, 2008
Mangalore MODIS Terra Daily NDVI
image, 2012
Mangalore MODIS Terra Daily NDVI
image, 2016
The Normalized Difference Vegetation Index is generated from the Near-IR and Red bands of each scene as (NIR - Red)
/ (NIR + Red), and ranges in value from -1.0 to 1.0. This product is generated from the MOD09GA MODIS surface
reflectance composites.
Figure 2: Mangalore Land Sat Images, Data availability (time): 2008 - 2016
Image taken: October 13, 2016, Source: Google Earth Engine
Lake 2016: Conference on Conservation and Sustainable Management of Ecologically
Sensitive Regions in Western Ghats [THE 10TH
BIENNIAL LAKE CONFERENCE] Date: 28-30
th December 2016, http://ces.iisc.ernet.in/energy
Venue: V.S. Acharya Auditorium, Alva's Education Foundation, Sundari Ananda Alva Campus, Vidyagiri, Moodbidri, D.K. Dist., Karnataka, India – 574227
Proceedings – Lake 2016: Ramachandra T V, Subash Chandran M D, Mohan Alva, et al., 2018. Conservation and Sustainable Management of Ecologically Sensitive
Regions in Western Ghats, , Sahyadri Conservation Series 65, , ENVIS Technical Report 120 Environmental Information System, CES, Indian Institute of Science,
Bangalore 560012
448
is more responsive to canopy structural variations, including leaf area index (LAI), canopy type, plant
physiognomy, and canopy architecture.
METHODOLOGY
A study was carried out in July, 2016 to calculate Carbon Sequestration by trees in the 37 acres of St Aloysius
College campus. Arial view of the college campus projected around 11 acres canopy of green vegetation in the
campus. Total number of trees in the campus was counted to 1730. The carbon sequestration capacity of a tree
species depends upon its age, height, girth size, biomass accumulation capacity, canopy diameter and most
important wood specific density. So it would vary with species to species and tree to tree. An approximate range
of Carbon Sequestration was calculated by measuring Tree height, Girth size and Biomass Accumulation
Capacity. Total carbon storage was determined to be 332000 kg and total Carbon sequestration rate was found to
be 6640 kg/year.
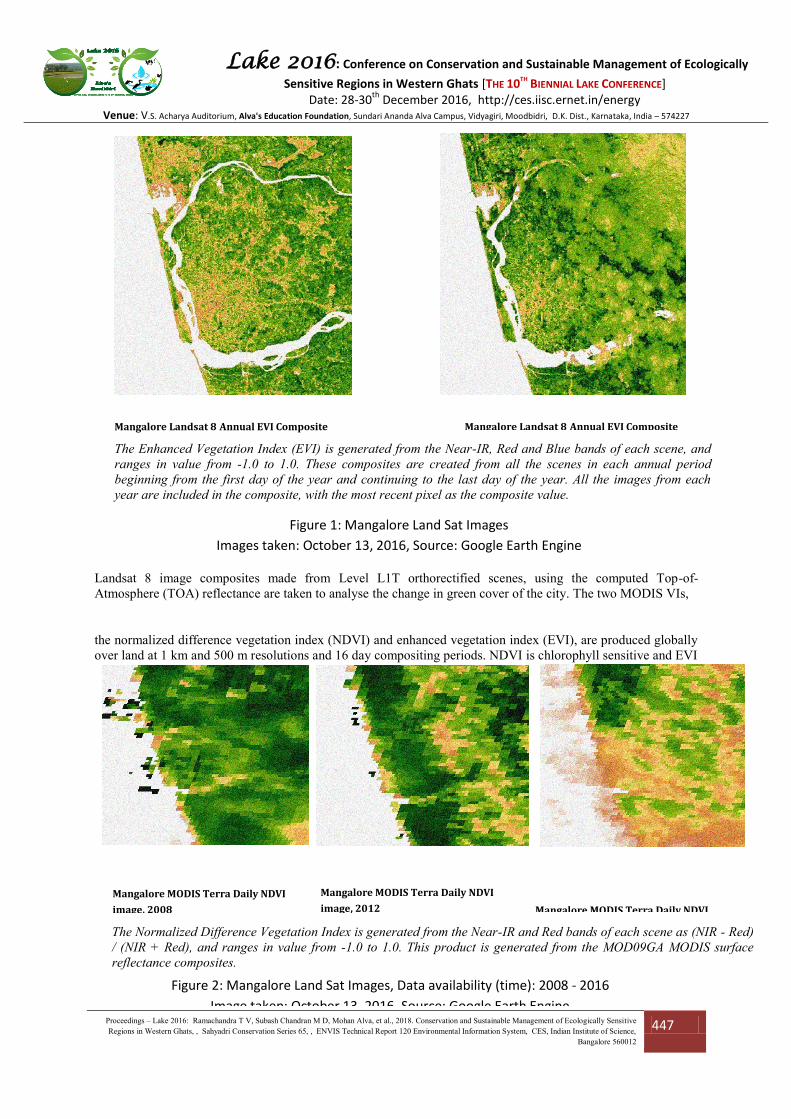
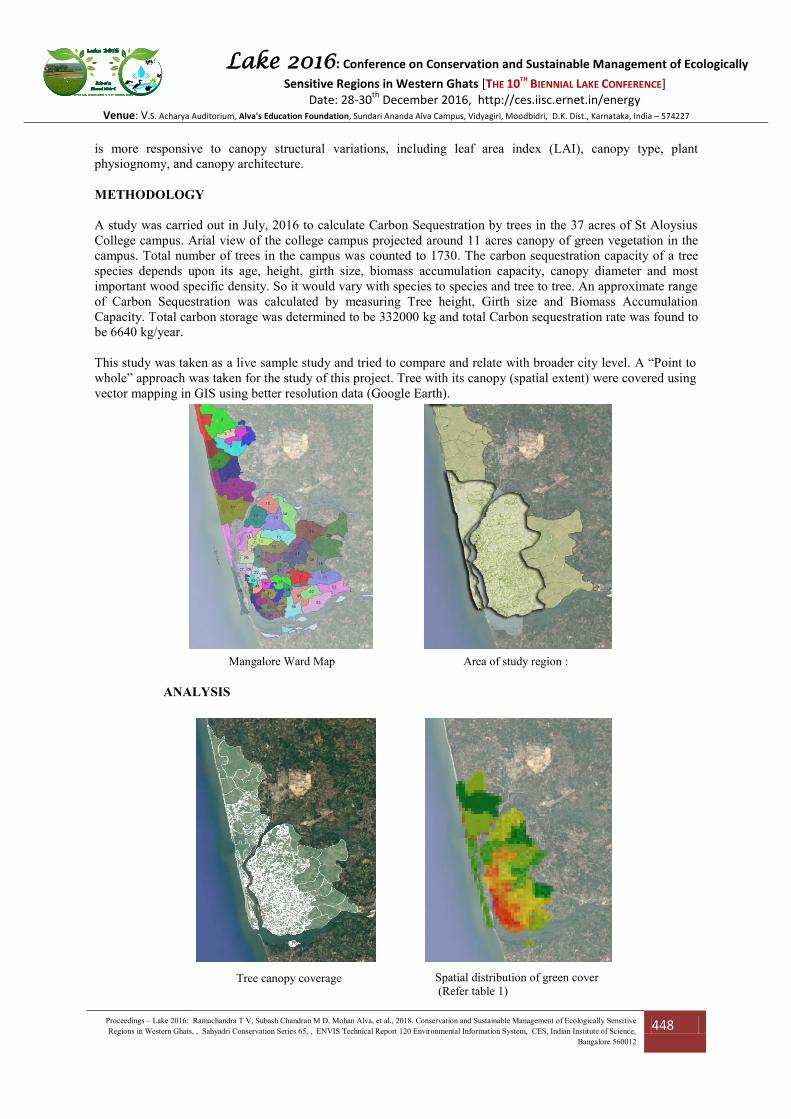
This study was taken as a live sample study and tried to compare and relate with broader city level. A “Point to
whole” approach was taken for the study of this project. Tree with its canopy (spatial extent) were covered using
vector mapping in GIS using better resolution data (Google Earth).
ANALYSIS
Spatial distribution of green cover
(Refer table 1)
Mangalore Ward Map Area of study region :
Mangalore city core
Tree canopy coverage
Lake 2016: Conference on Conservation and Sustainable Management of Ecologically
Sensitive Regions in Western Ghats [THE 10TH
BIENNIAL LAKE CONFERENCE] Date: 28-30
th December 2016, http://ces.iisc.ernet.in/energy
Venue: V.S. Acharya Auditorium, Alva's Education Foundation, Sundari Ananda Alva Campus, Vidyagiri, Moodbidri, D.K. Dist., Karnataka, India – 574227
Proceedings – Lake 2016: Ramachandra T V, Subash Chandran M D, Mohan Alva, et al., 2018. Conservation and Sustainable Management of Ecologically Sensitive
Regions in Western Ghats, , Sahyadri Conservation Series 65, , ENVIS Technical Report 120 Environmental Information System, CES, Indian Institute of Science,
Bangalore 560012
449
Ward
no.
Population
(2011)
Area
(sq.k
m)
Approx
green
cover (
%)
Per
capita
green
space
(m2/inha
bitant)
Approx .
Carbon
sequestrati
on
(kg/year)
9 10,649 4.13 21.79% 84.51 130271.47
10 7,503 7.07 25.77% 242.83 164833
11 9,930 4.48 12.95% 58.42 83986.82
12 8,555 2.42 17.61% 49.81 38715.28
13 8,615 1.3 27.01% 40.76 31884.02
15 7,137 2.75 33.44% 128.85 79644.92
16 11,781 3.14 34.17% 91.07 155440.02
17 10,393 0.9 15.67% 13.57 12620.46
18 11,781 3.42 23.02% 66.83 66213.98
22 10,955 2.43 46.23% 102.55 98532.18
23 10,096 2.45 25.35% 61.52 55503.96
24 9,367 1.86 21.24% 42.18 35965.41
25 8,253 0.46 22.43% 12.5 9378.5
26 9,023 0.43 22.86% 10.89 8828.53
27 7,077 0.52 24.51% 18.01 11741.94
28 6,741 0.57 17.48% 14.78 9016.68
29 6,650 0.51 17.91% 13.74 8235.14
30 6,380 0.5 13.62% 10.67 6122.08
31 8,370 0.5 34.08% 20.36 15297.96
32 7,158 1.35 43.60% 82.23 53998.76
33 6,497 1.05 40.23% 65.02 36674.58
34 6,396 0.62 43.48% 42.15 24256.75
37 7,797 1.82 59.11% 137.98 95463.91
38 7,322 0.78 32.29% 34.4 21752.92
39 7,740 0.63 19.91% 16.21 11752.08
40 6,917 0.59 20.85% 17.78 10753.44
41 5,829 0.71 8.86% 10.79 5615.52
42 7,149 0.48 15.68% 10.53 6556.27
43 6,250 0.29 13.34% 6.19 3878.76
44 6,749 0.21 3.44% 1.07 651.29
45 7,449 0.5 10.68% 7.17 5137.92
46 6,908 0.64 9.14% 8.47 8148.3
47 7,998 0.9 10.71% 12.05 13633.57
48 8,509 1.17 14.52% 19.97 24256.75
49 9,350 1.38 24.74% 36.51 49671.34
54 7,314 1.91 24.14% 63.04 66416.6
55 8,398 1.09 11.37% 14.76 17729.43
56 8,216 0.47 10.63% 6.08 7250.97
57 7,244 0.471 17.92% 11.65 12475.73
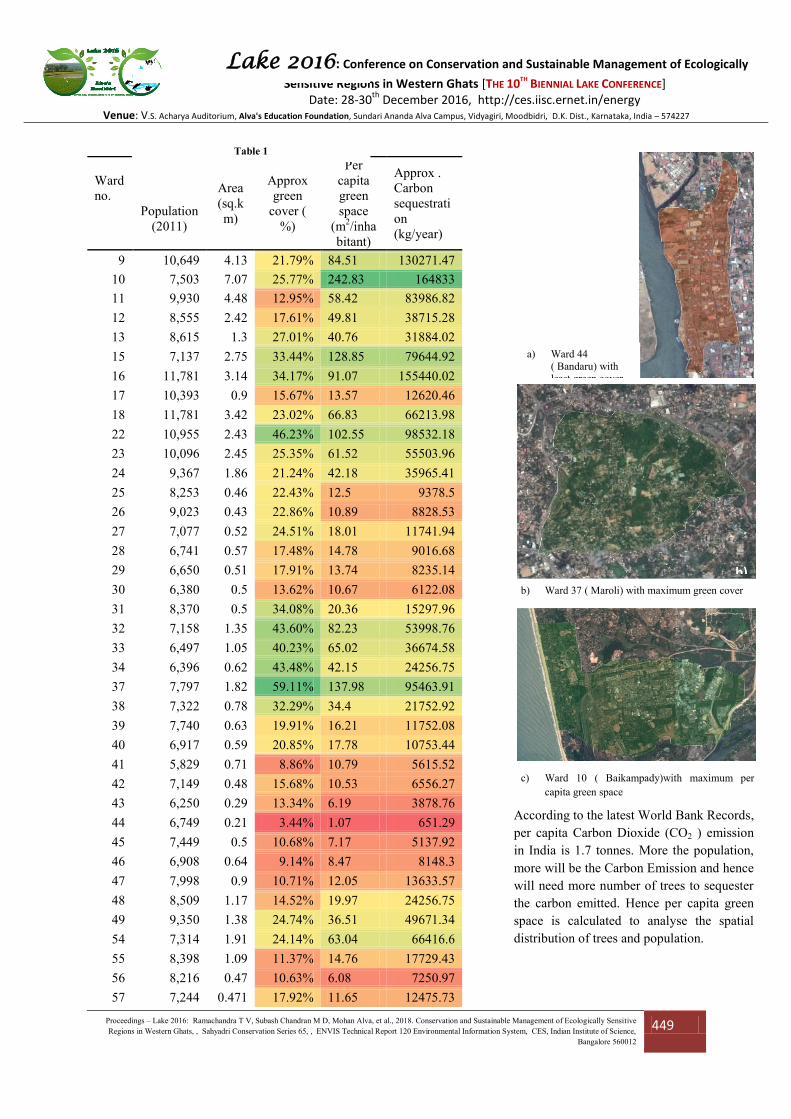
a)
b)
c)
d)
a) Ward 44
( Bandaru) with least green cover
b) Ward 37 ( Maroli) with maximum green cover
c) Ward 10 ( Baikampady)with maximum per
capita green space
According to the latest World Bank Records,
per capita Carbon Dioxide (CO2 ) emission
in India is 1.7 tonnes. More the population,
more will be the Carbon Emission and hence
will need more number of trees to sequester
the carbon emitted. Hence per capita green
space is calculated to analyse the spatial
distribution of trees and population.
Table 1
Lake 2016: Conference on Conservation and Sustainable Management of Ecologically
Sensitive Regions in Western Ghats [THE 10TH
BIENNIAL LAKE CONFERENCE] Date: 28-30
th December 2016, http://ces.iisc.ernet.in/energy
Venue: V.S. Acharya Auditorium, Alva's Education Foundation, Sundari Ananda Alva Campus, Vidyagiri, Moodbidri, D.K. Dist., Karnataka, India – 574227
Proceedings – Lake 2016: Ramachandra T V, Subash Chandran M D, Mohan Alva, et al., 2018. Conservation and Sustainable Management of Ecologically Sensitive
Regions in Western Ghats, , Sahyadri Conservation Series 65, , ENVIS Technical Report 120 Environmental Information System, CES, Indian Institute of Science,
Bangalore 560012
450
58 6,378 0.64 11.30% 11.34 10174.52
59 7,717 0.72 24.44% 22.8 24083.07
60 8,542 2.44 31.73% 90.64 109922.44
DISCUSSION AND CONCLUSION
Currently the main Central Business District (CBD) region of Mangalore has less per capita green space. Central
Market (41), Bandaru (44) have less that 10% green cover. Per capita green cover of these two wards are
approximately 10.8 m2/ inhabitant and 1.1 m
2/inhabitant which is. Port (45), Cantonment (46) and Mangaladevi
(56) and Bolar (58) have less than 12% green cover. These wards near port, are old part of the city where
population density is high and city has grown in unplanned haphazard manner. Derebail (17) region is new
developing part of the city with many emerging high rise apartments and housing colonies. This ward also has
green cover less than 15% and green space/ inhabitant less than 15m2. Baikampady (10) is a new industrial
region which has very less population density. Currently this ward has approximately 26% green cover and since
the region has very low density, green cover/ capita is 242.83m2
. When regions around industrial sector grow
and more population migrate towards that region there can be pressure on green cover. This is what happened in
new developed regions around Derebail. With the decrease in per capita green space, city also becomes less
livable.
In 2005, Gujarat Urban Development Mission (GUDM) of the Urban Department and Forest department took
initiative of Nagar Nandan Van Yojna. This programme helped to improve tree cover in the state. In 2009,
Gujarat Urban Development Department emphasized on Urban Green Plan to improve tree cover. The provision
for creation of Panchavati, Smriti Van, Sanskritic Van, Oxygen park, green guard etc. have been made to involve
people, NGOs and civic society to plant trees in the open space. Schools and educational institutions were also
involved in such programmes. With such initiatives there was a drastic increase in Urban Green. Such initiatives
can be taken up by Mangalore Urban Development Authority with community level participation. New
evaluative programmes can be initiated among different wards with the fundamental criteria like per capita green
space, green space to land ratio, green space canopy coverage ratio and funds can be allotted accordingly via
different schemes.
For this, initial step could be to count and assess the present tree cover and the status of environment. This is
necessary to estimate the diversity of trees in the city. This can be done with the help of Social Forestry Unit of
Karnataka Forest Department. Tree census will create a baseline to monitor tree cover in different wards and will
also help in assessing Carbon storage and also scope of Carbon sequestration in the Urban areas. Calculating the
population and number of trees in each ward will indicate whether the region has sufficient green space for
health and livability or if there is a need to increase the green cover of that region. Therefore, we can calculate
number of trees needed to be planted to meet a minimum standard of 15 m2 tree cover/inhabitant in city. It might
be difficult to increase tree cover beyond a limit in some of the municipal corporation areas due to non-
availability of the space. This gap can be compensated by increasing tree cover in sub-urban areas under Urban
Development Authorities but it needs to be taken care that new trees planted should be near the ward boundary
itself so that the purpose for which these trees are planted (supply of oxygen, carbon sequestration, etc.) is
sufficed.
Mangalore city is growing at a very fast rate and an effective, planned and systematic management of the trees in
the city is needed. If the growth of cities is not properly planned, this can lead to Urban Heat Islands with
climatic changes and unlivable conditions. An approach towards “Urban tree management” should be stressed
upon. City planners and designers need to be more sensitive towards ecological balance and sustainability. Trees
are often considered as second thought after the development has already taken place rather than being
incorporated as original design phase. Hence proper planning is needed for large scale development. Before the
city expands further, a proper vision should be taken by administrative authorities for making the city green. This
can be achieved by regulating land availability in the form of parks and gardens and forest patches and giving
more emphasis on road side plantation. Urban forestry manages and protects forests and helps in planting new
trees on barren lands with the purpose of helping in the environmental, social and urban development. Urban
forestry department can be linked with Urban planning department such that Social Forestry and Urban forestry
Lake 2016: Conference on Conservation and Sustainable Management of Ecologically
Sensitive Regions in Western Ghats [THE 10TH
BIENNIAL LAKE CONFERENCE] Date: 28-30
th December 2016, http://ces.iisc.ernet.in/energy
Venue: V.S. Acharya Auditorium, Alva's Education Foundation, Sundari Ananda Alva Campus, Vidyagiri, Moodbidri, D.K. Dist., Karnataka, India – 574227
Proceedings – Lake 2016: Ramachandra T V, Subash Chandran M D, Mohan Alva, et al., 2018. Conservation and Sustainable Management of Ecologically Sensitive
Regions in Western Ghats, , Sahyadri Conservation Series 65, , ENVIS Technical Report 120 Environmental Information System, CES, Indian Institute of Science,
Bangalore 560012
451
can be integrated into Urban Planning. In Smart City Concept, Green cover of the city needs to be considered as
an infrastructure of the city for sustaining human population and quality of life and funding for increasing green
cover of the city can be allotted as infrastructure development to enhance the quality of life in city.
APPENDIX
For Calculating Carbon sequestration rate
1. There are two methods of carbon estimation in tree species: destructive method and non - destructive
method. The latter one is approved by many researchers. For St Aloysius College campus study, non-
destructive method for carbon estimation is employed. In this method we need not harvest the entire bio
- volume and sacrifice the tree.
2. The girth of the tree is measured at the girth at breast height (GBH) 1.32 m above ground surface.
3. Tree diameter (D) is measured as (assuming the tree trunk to be cylindrical) Biomass
in the above listed tree species is calculated by simply applying bio-statistics based allometric
equations.
4. Above Ground Biomass (AGB) is estimated by multiplying the bio - volume to the green wood density
(WD) of tree species. Tree bio - volume (Tbv) value is calculated by the value multiplying the diameter
and height of tree species by a factor 0.4.
………… (1)
............... (2)
5. Where H = Height (meter). Wood density is used from Global wood density database, The standard
average density of 0.6 gm/ cc (600kg/cc) is applied wherever the density value is not available for tree
species.
6. The Below Ground Biomass (BGB) is calculated by multiplying the above ground biomass (AGB) by a
factor of 0.26 as the root to shoot ratio
………….. (3)
7. Total Biomass (TB) is the sum of the above and below ground biomasses.
……………(4)
8. Carbon Estimation: Generally, for any plant species 50% of its biomass is considered as carbon (C)
content in the tree
…………… (5)
9. Determination of the weight of carbon dioxide sequestered in the tree:
10. CO2 is composed of 1 molecule of Carbon and 2 molecules of Oxygen. The atomic weight of Carbon is
12.001115. The atomic weight of Oxygen is 15.9994. The weight of CO2 is C+2O = 43.999915. The
ratio of CO2 to C is 43.999915/12.001115 = 3.6663. Therefore, the weight of CO2 sequestered in the
tree is determined by multiplying the weight of carbon obtained in equation (5) by a factor of 3.6663
i.e.,
……………. (6)
11. The carbon sequestration rate was calculated as 1% of the standing biomass each year.
Lake 2016: Conference on Conservation and Sustainable Management of Ecologically
Sensitive Regions in Western Ghats [THE 10TH
BIENNIAL LAKE CONFERENCE] Date: 28-30
th December 2016, http://ces.iisc.ernet.in/energy
Venue: V.S. Acharya Auditorium, Alva's Education Foundation, Sundari Ananda Alva Campus, Vidyagiri, Moodbidri, D.K. Dist., Karnataka, India – 574227
Proceedings – Lake 2016: Ramachandra T V, Subash Chandran M D, Mohan Alva, et al., 2018. Conservation and Sustainable Management of Ecologically Sensitive
Regions in Western Ghats, , Sahyadri Conservation Series 65, , ENVIS Technical Report 120 Environmental Information System, CES, Indian Institute of Science,
Bangalore 560012
452
BIBLIOGRAPHY
1. Oladeley Abdul Rahaman. "Global Warming and Stomatal Complex types." 2008.
2. Barala Anil, Gauri S. Guha. "Trees for carbon sequestration or fossil fuel substitution:the issue of
cost vs. carbon benefit." 2004.
3. Bolund P, Hunhammar S. "Ecosystem services in urban areas." Ecological Economics, 2009.
4. Baes C. F. Jr., Goeller H. E., Olson J. S. and Rotty R. M. "Carbon Dioxide and Climate: The
Uncontrolled Experiment." 1977.
5. Chavan. "Comparative Status of Carbon Dioxide and Sequestration in Albizia Lebbek and
Delonix Regia." Universal Journal of Environmental Reasearch and TEchnology, 2010.
6. Christer Jansson, Stan D. Wullschleger, Udaya C. Kalluri, and Gerald A. Tuskan.
"Phytosequestration: Carbon Biosequestration by Plants and the Prospects of Genetic Engineering."
2010.
7. Koul, D.N. and Panwar. "Prioritizing land management option for carbon sequestration
potential." 2008.
8. Mehraj A Sheikh, Munesh Kumar. "Carbon Sequestration Potential of trees on two aspects in
Sub-Tropical Forest." 2010.
9. Nowak David J, Crane Daniel E. "Carbon Storage and Sequestration by Urban trees in the
USA." Elsevier, 2001: Environmental Pollution.
10. Patwardhan, A. Waran and A. "Carbon sequestration potential of trees in and around pune city." 2001.
11. Pradeep Chaudhry, Tewari. V. P. "Managing urban parks and gardens in developing countries: A
case study from an Indian city." International Journal of Leisure and Tourism Marketing, 2010 .
12. Singh R.B., Anju Singh, and Ashok Kumar. "Climate Change Variability in Coastal." 2010.
13. Bar Shashua L., Potchter O., Bitan A.,. Boltansky D, Yaakov Y.. "Microclimate modelling of street tree
species effects within the varied urban morphology in the Mediterranean city of Tel Aviv, Israel."
International Journal of Climatology, 2009.
14. Vijai Shanker Singh, Deep Narayan Pandey, Pradeep Chaudhry. Urban Forests and Green Spaces:
Lessons for Jaipur, Rajasthan, India. RSPCB Occasional Paper No. 1/2010, 2010.
15. Xiao-Jun, WANG. "Analysis of problems in urban green space system planning in China."Journal of
Forestry Research, 2009.
16. Report on Status of Tree Cover in Urban Areas of Gujarat- 2011, by Gujarat Forest Department
Lake 2016: Conference on Conservation and Sustainable Management of Ecologically
Sensitive Regions in Western Ghats [THE 10TH
BIENNIAL LAKE CONFERENCE] Date: 28-30
th December 2016, http://ces.iisc.ernet.in/energy
Venue: V.S. Acharya Auditorium, Alva's Education Foundation, Sundari Ananda Alva Campus, Vidyagiri, Moodbidri, D.K. Dist., Karnataka, India – 574227
Proceedings – Lake 2016: Ramachandra T V, Subash Chandran M D, Mohan Alva, et al., 2018. Conservation and Sustainable Management of Ecologically Sensitive
Regions in Western Ghats, , Sahyadri Conservation Series 65, , ENVIS Technical Report 120 Environmental Information System, CES, Indian Institute of Science,
Bangalore 560012
453
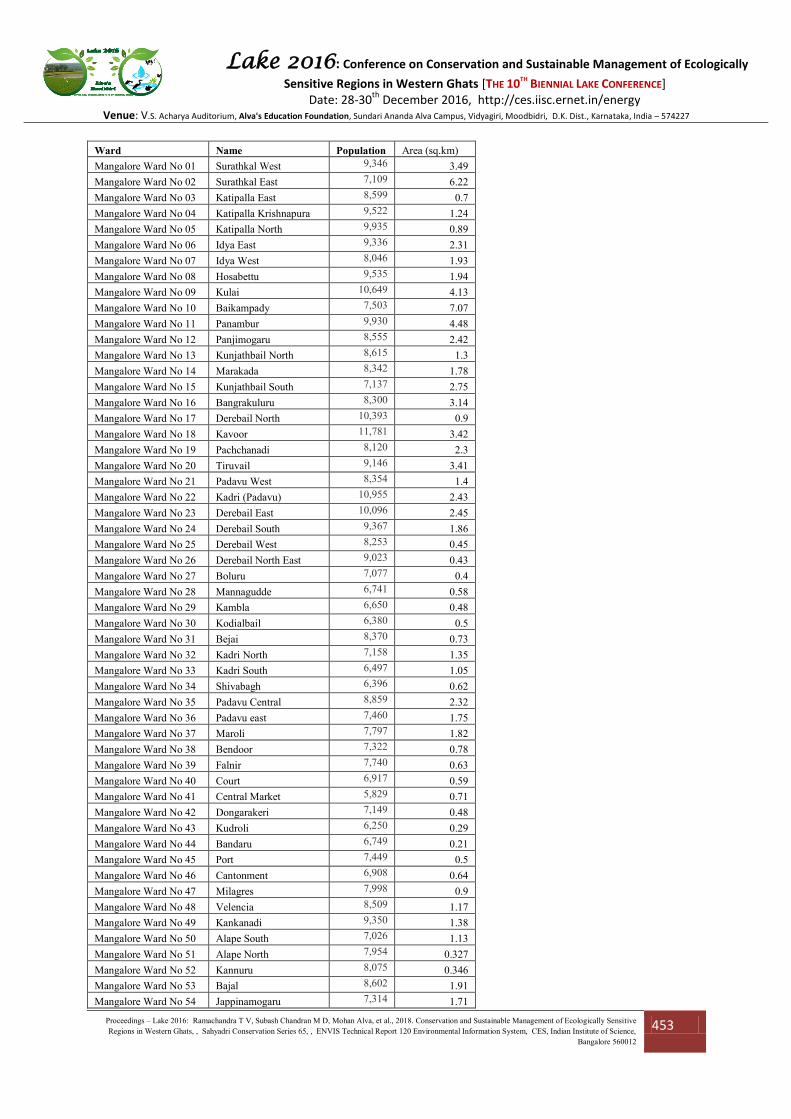
Ward Name Population Area (sq.km)
Mangalore Ward No 01 Surathkal West 9,346 3.49
Mangalore Ward No 02 Surathkal East 7,109 6.22
Mangalore Ward No 03 Katipalla East 8,599 0.7
Mangalore Ward No 04 Katipalla Krishnapura 9,522 1.24
Mangalore Ward No 05 Katipalla North 9,935 0.89
Mangalore Ward No 06 Idya East 9,336 2.31
Mangalore Ward No 07 Idya West 8,046 1.93
Mangalore Ward No 08 Hosabettu 9,535 1.94
Mangalore Ward No 09 Kulai 10,649 4.13
Mangalore Ward No 10 Baikampady 7,503 7.07
Mangalore Ward No 11 Panambur 9,930 4.48
Mangalore Ward No 12 Panjimogaru 8,555 2.42
Mangalore Ward No 13 Kunjathbail North 8,615 1.3
Mangalore Ward No 14 Marakada 8,342 1.78
Mangalore Ward No 15 Kunjathbail South 7,137 2.75
Mangalore Ward No 16 Bangrakuluru 8,300 3.14
Mangalore Ward No 17 Derebail North 10,393 0.9
Mangalore Ward No 18 Kavoor 11,781 3.42
Mangalore Ward No 19 Pachchanadi 8,120 2.3
Mangalore Ward No 20 Tiruvail 9,146 3.41
Mangalore Ward No 21 Padavu West 8,354 1.4
Mangalore Ward No 22 Kadri (Padavu) 10,955 2.43
Mangalore Ward No 23 Derebail East 10,096 2.45
Mangalore Ward No 24 Derebail South 9,367 1.86
Mangalore Ward No 25 Derebail West 8,253 0.45
Mangalore Ward No 26 Derebail North East 9,023 0.43
Mangalore Ward No 27 Boluru 7,077 0.4
Mangalore Ward No 28 Mannagudde 6,741 0.58
Mangalore Ward No 29 Kambla 6,650 0.48
Mangalore Ward No 30 Kodialbail 6,380 0.5
Mangalore Ward No 31 Bejai 8,370 0.73
Mangalore Ward No 32 Kadri North 7,158 1.35
Mangalore Ward No 33 Kadri South 6,497 1.05
Mangalore Ward No 34 Shivabagh 6,396 0.62
Mangalore Ward No 35 Padavu Central 8,859 2.32
Mangalore Ward No 36 Padavu east 7,460 1.75
Mangalore Ward No 37 Maroli 7,797 1.82
Mangalore Ward No 38 Bendoor 7,322 0.78
Mangalore Ward No 39 Falnir 7,740 0.63
Mangalore Ward No 40 Court 6,917 0.59
Mangalore Ward No 41 Central Market 5,829 0.71
Mangalore Ward No 42 Dongarakeri 7,149 0.48
Mangalore Ward No 43 Kudroli 6,250 0.29
Mangalore Ward No 44 Bandaru 6,749 0.21
Mangalore Ward No 45 Port 7,449 0.5
Mangalore Ward No 46 Cantonment 6,908 0.64
Mangalore Ward No 47 Milagres 7,998 0.9
Mangalore Ward No 48 Velencia 8,509 1.17
Mangalore Ward No 49 Kankanadi 9,350 1.38
Mangalore Ward No 50 Alape South 7,026 1.13
Mangalore Ward No 51 Alape North 7,954 0.327
Mangalore Ward No 52 Kannuru 8,075 0.346
Mangalore Ward No 53 Bajal 8,602 1.91
Mangalore Ward No 54 Jappinamogaru 7,314 1.71
Lake 2016: Conference on Conservation and Sustainable Management of Ecologically
Sensitive Regions in Western Ghats [THE 10TH
BIENNIAL LAKE CONFERENCE] Date: 28-30
th December 2016, http://ces.iisc.ernet.in/energy
Venue: V.S. Acharya Auditorium, Alva's Education Foundation, Sundari Ananda Alva Campus, Vidyagiri, Moodbidri, D.K. Dist., Karnataka, India – 574227
Proceedings – Lake 2016: Ramachandra T V, Subash Chandran M D, Mohan Alva, et al., 2018. Conservation and Sustainable Management of Ecologically Sensitive
Regions in Western Ghats, , Sahyadri Conservation Series 65, , ENVIS Technical Report 120 Environmental Information System, CES, Indian Institute of Science,
Bangalore 560012
454
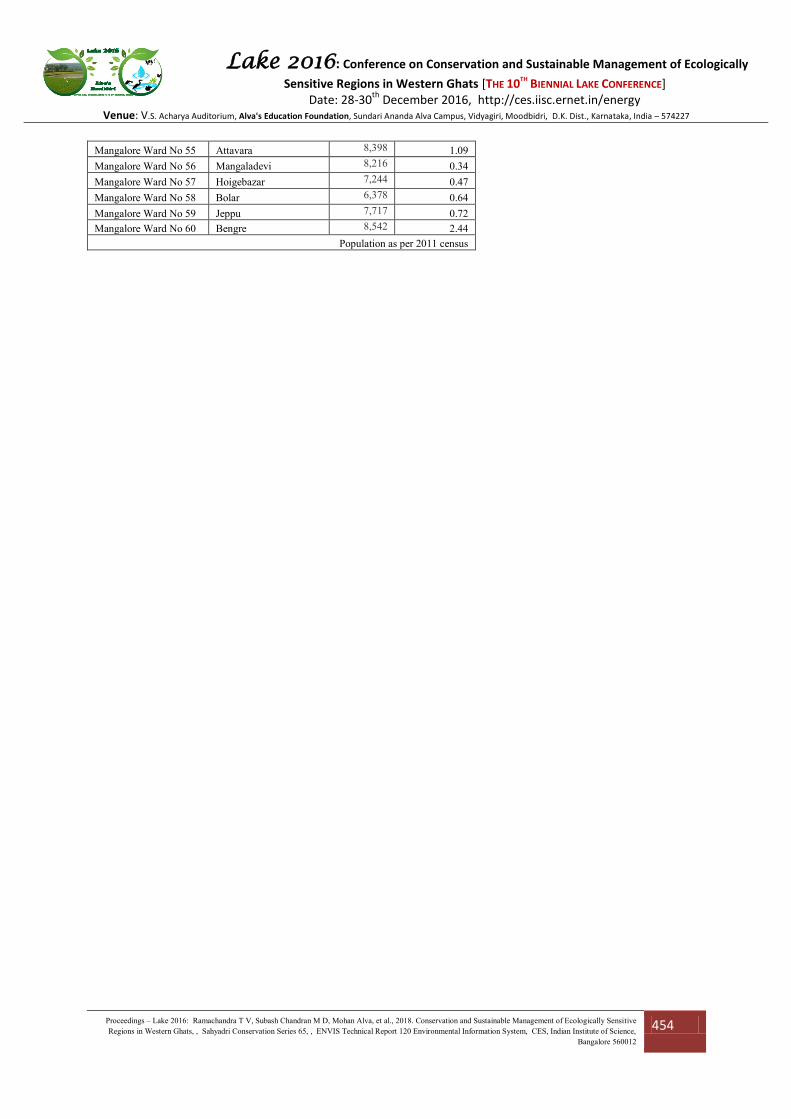
Mangalore Ward No 55 Attavara 8,398 1.09
Mangalore Ward No 56 Mangaladevi 8,216 0.34
Mangalore Ward No 57 Hoigebazar 7,244 0.47
Mangalore Ward No 58 Bolar 6,378 0.64
Mangalore Ward No 59 Jeppu 7,717 0.72
Mangalore Ward No 60 Bengre 8,542 2.44
Population as per 2011 census