10th annual alumni business conference--refic panel
TRANSCRIPT

Capital Markets Overview
CAPITAL MARKETS OVERVIEW
DEBT PLACEMENT INVESTMENT SALES PRIVATE EQUITY & CORPORATE FINANCE STRUCTURED FINANCE NOTE SALES & NOTE SALE ADVISORY LOAN SERVICING
Special “thank you” to Mark Gibson, Colby Mueck and HFF.
Much of the analytical data compiled by HFF and provided by noted sources.
Capital Markets Overview
DISCLAIMER Forward-‐Looking Statements
Certain statements in this presenta-on are “forward-‐looking statements” within the meaning of the federal securi-es laws. Statements about our beliefs and expecta-ons and statements containing the words “may,” “could,” “would,” “should,” “believe,” “expect,” “an-cipate,” “plan,” “es-mate,” “target,” “project,” “intend” and similar expressions cons-tute forward-‐looking statements. These forward-‐looking statements involve known and unknown risks, uncertain-es and other factors that may cause results and performance in future periods to be materially different from any future results or performance suggested in forward-‐looking statements in this presenta-on. Investors, poten-al investors and other readers are urged to consider these factors carefully in evalua-ng the forward-‐looking statements and are cau-oned not to place undue reliance on such forward-‐looking statements. Any forward-‐looking statements speak only as of the date of this presenta-on and, except to the extent required by applicable securi-es laws, HFF (the Company) expressly disclaims any obliga-on to update or revise any of them to reflect actual results, any changes in expecta-ons or any change in events. If the Company does update one or more forward-‐looking statements, no inference should be drawn that it will make addi-onal updates with respect to those or other forward-‐looking statements.
Industry and Market Data
In this presenta-on, we rely on and refer to informa-on and sta-s-cs regarding economic condi-ons, trends, and our market in the sectors of that market in which we compete. In par-cular, we have obtained general industry informa-on and sta-s-cs from certain third-‐party sources. We believe that these sources of informa-on and es-mates are reliable and accurate, but we have not independently verified them.
Capital Markets Overview
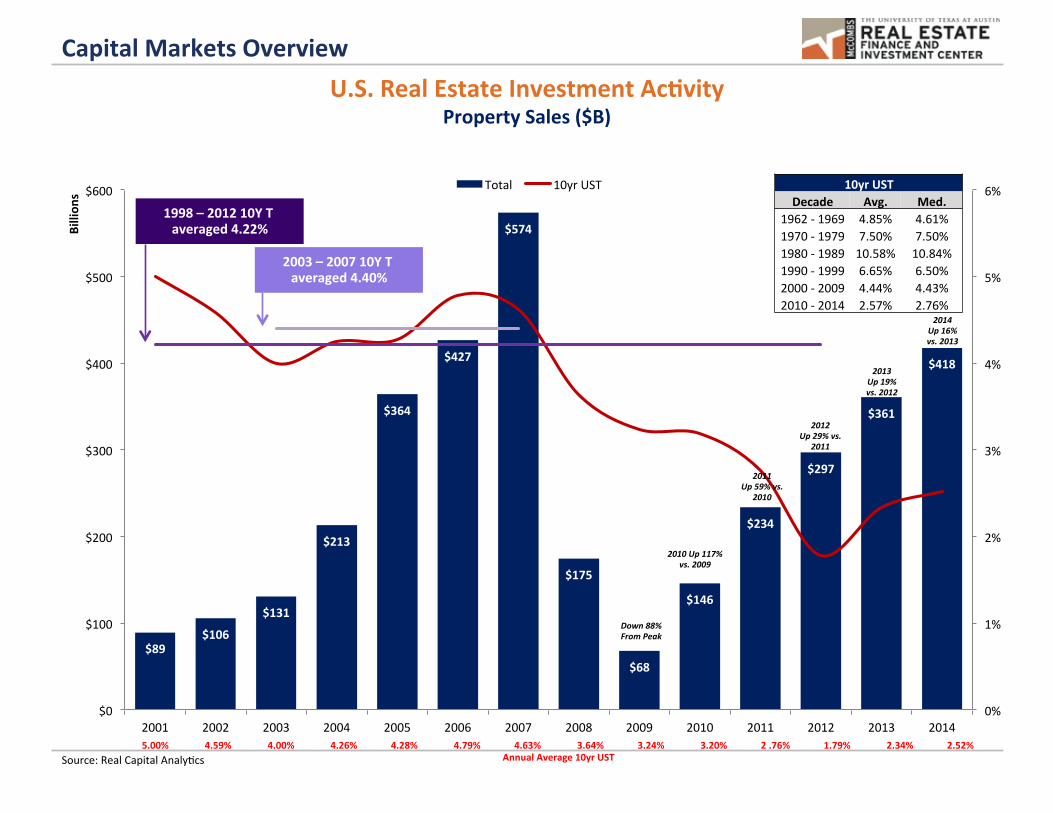
$89 $106
$131
$213
$364
$427
$574
$175
$68
$146
$234
$297
$361
$418
0%
1%
2%
3%
4%
5%
6%
$0
$100
$200
$300
$400
$500
$600
2001 2002 2003 2004 2005 2006 2007 2008 2009 2010 2011 2012 2013 2014
Billion
s
Total 10yr UST
Source: Real Capital Analy-cs
U.S. Real Estate Investment AcOvity Property Sales ($B)
Down 88% From Peak
2010 Up 117% vs. 2009
2012 Up 29% vs.
2011
2003 – 2007 10Y T averaged 4.40%
1998 – 2012 10Y T averaged 4.22%
2013 Up 19% vs. 2012
2011 Up 59% vs.
2010
10yr UST Decade Avg. Med.
1962 -‐ 1969 4.85% 4.61% 1970 -‐ 1979 7.50% 7.50% 1980 -‐ 1989 10.58% 10.84% 1990 -‐ 1999 6.65% 6.50% 2000 -‐ 2009 4.44% 4.43% 2010 -‐ 2014 2.57% 2.76%
5.00% 4.59% 4.00% 4.26% 4.28% 4.79% 4.63% 3.64% 3.24% 3.20% 2 .76% 1.79% 2.34% 2.52% Annual Average 10yr UST
2014 Up 16% vs. 2013
Capital Markets Overview
$-‐
$50
$100
$150
$200
$250
2005
2006
2007
2008
2009
2010
2011
2012
2013
2014
Billion
s
2005
2006
2007
2008
2009
2010
2011
2012
2013
2014
2005
2006
2007
2008
2009
2010
2011
2012
2013
2014
2005
2006
2007
2008
2009
2010
2011
2012
2013
2014
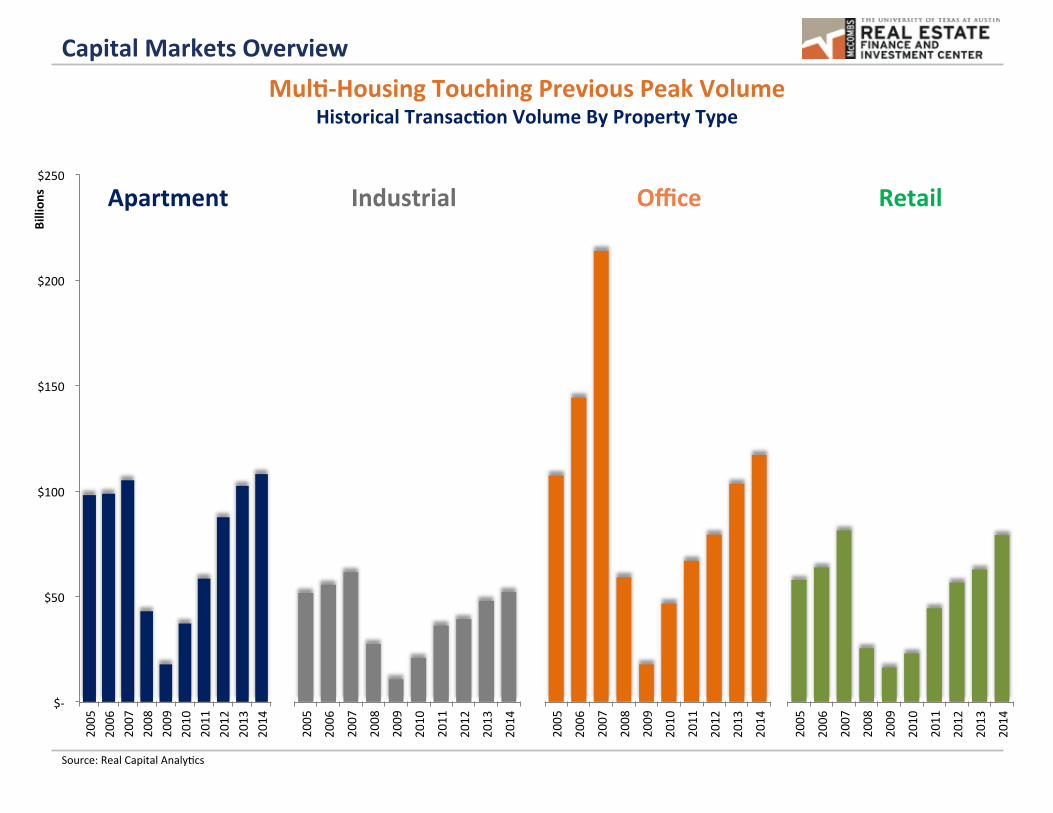
MulO-‐Housing Touching Previous Peak Volume Historical TransacOon Volume By Property Type
Source: Real Capital Analy-cs
Apartment Industrial Office Retail
Capital Markets Overview
$0
$10,000
$20,000
$30,000
$40,000
$50,000
$60,000
NYC
Metro
LA M
etro
San Francisco
DC M
etro
Chicago
Boston
Dallas
South Florida
Atlanta
Houston
Seac
le
Denver
San Jose
Phoe
nix
No NJ
San Diego
Aus-n
East Bay
Philade
lphia
Inland
Empire
Tampa
Charloce
Minne
apolis
Orla
ndo
Raleigh/Du
rham
Portland
Bal-more
Las V
egas
Nashville
San An
tonio
Tran
sacOon
Volum
e ($MM)
Office Industrial Retail Apartment Hotel Land
Source: Real Capital Analy-cs
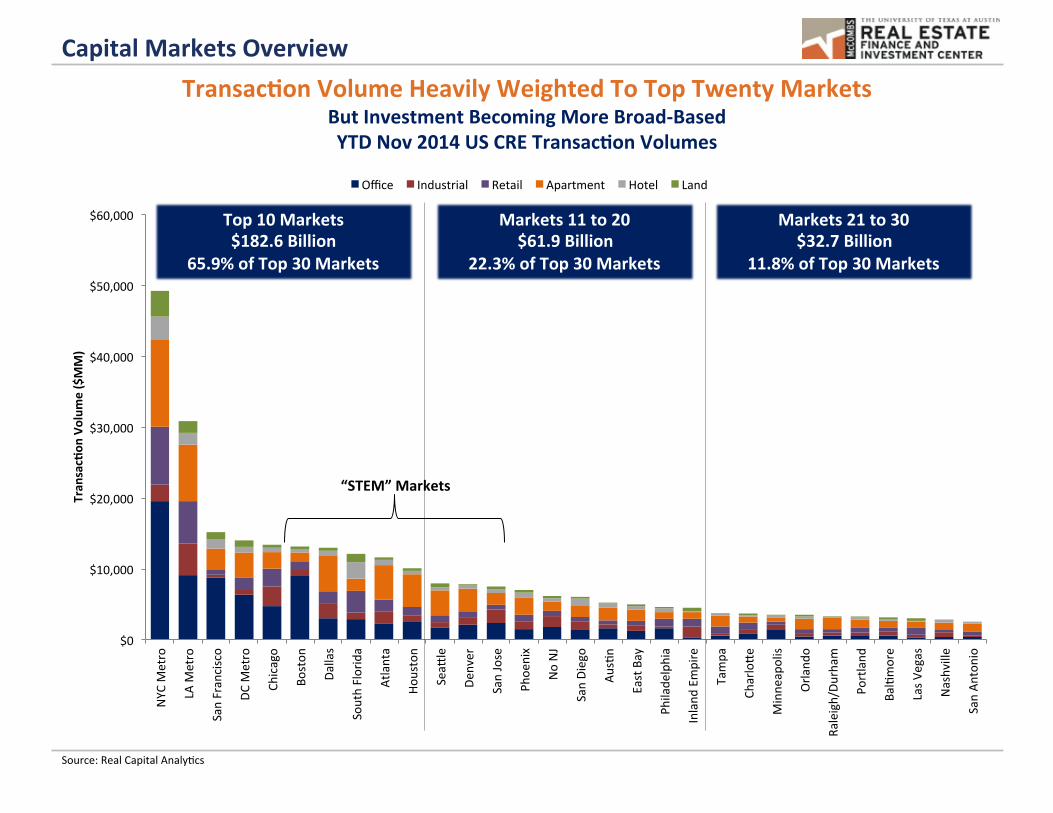
TransacOon Volume Heavily Weighted To Top Twenty Markets But Investment Becoming More Broad-‐Based YTD Nov 2014 US CRE TransacOon Volumes
Top 10 Markets $182.6 Billion
65.9% of Top 30 Markets
Markets 11 to 20 $61.9 Billion
22.3% of Top 30 Markets
Markets 21 to 30 $32.7 Billion
11.8% of Top 30 Markets
“STEM” Markets

Capital Markets Overview Major Markets Have Recovered Peak Pricing
Major Markets Are 11.0% Above Previous Peak – Non-‐Major Markets Are -‐9.7% Off Peak – NaOonal 0.2% Off Peak Major Markets Have Increased 81.1% Since Bocom, Approximately 1.4x 56.9% Gain By Non-‐Major Markets
Source: Moody’s Analy-cs/Real Capital Analy-cs Major Markets include Boston, Chicago, Los Angeles, New York, San Francisco and Washington, D.C. This index measures prices changes in US commercial real estate, based on the completed sales of the same commercial proper-es over -me, known as the “repeat-‐sales methodology.”
80
100
120
140
160
180
200
220
2001 2002 2003 2004 2005 2006 2007 2008 2009 2010 2011 2012 2013 2014
Na-onal Major Markets Non-‐Major Markets
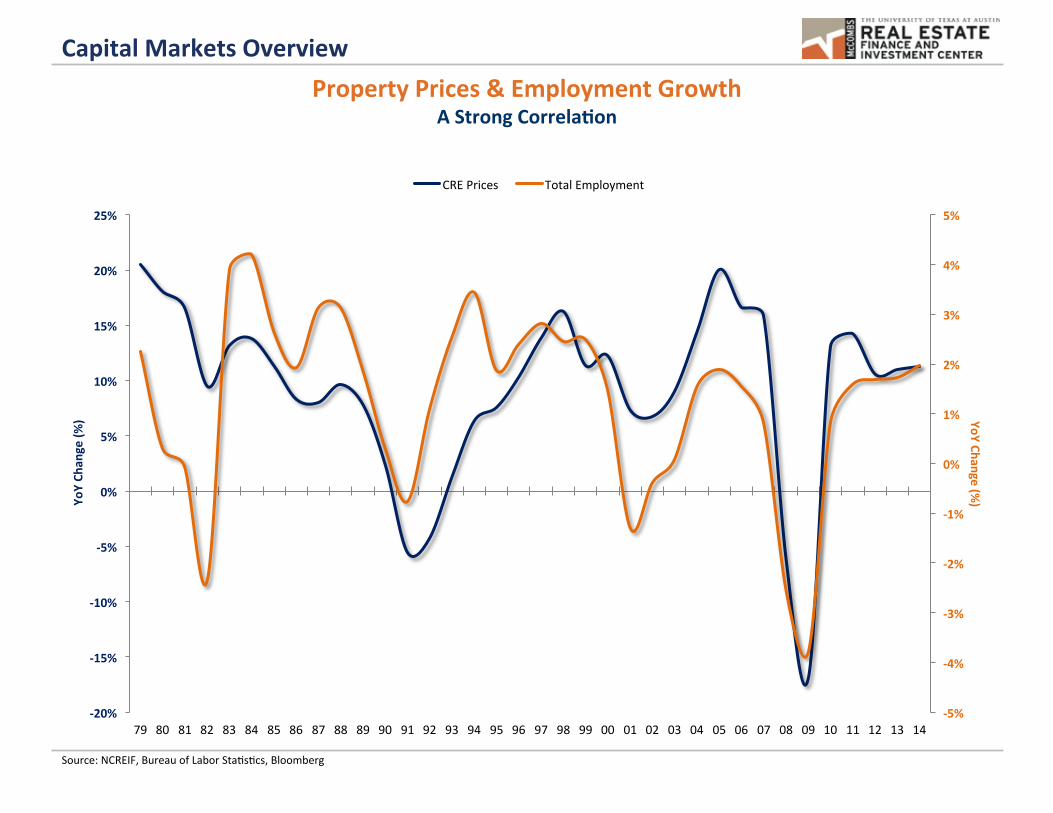
Capital Markets Overview Property Prices & Employment Growth
A Strong CorrelaOon
Source: NCREIF, Bureau of Labor Sta-s-cs, Bloomberg
-‐5%
-‐4%
-‐3%
-‐2%
-‐1%
0%
1%
2%
3%
4%
5%
-‐20%
-‐15%
-‐10%
-‐5%
0%
5%
10%
15%
20%
25%
79 80 81 82 83 84 85 86 87 88 89 90 91 92 93 94 95 96 97 98 99 00 01 02 03 04 05 06 07 08 09 10 11 12 13 14
YoY Change (%) Yo
Y Ch
ange (%
)
CRE Prices Total Employment
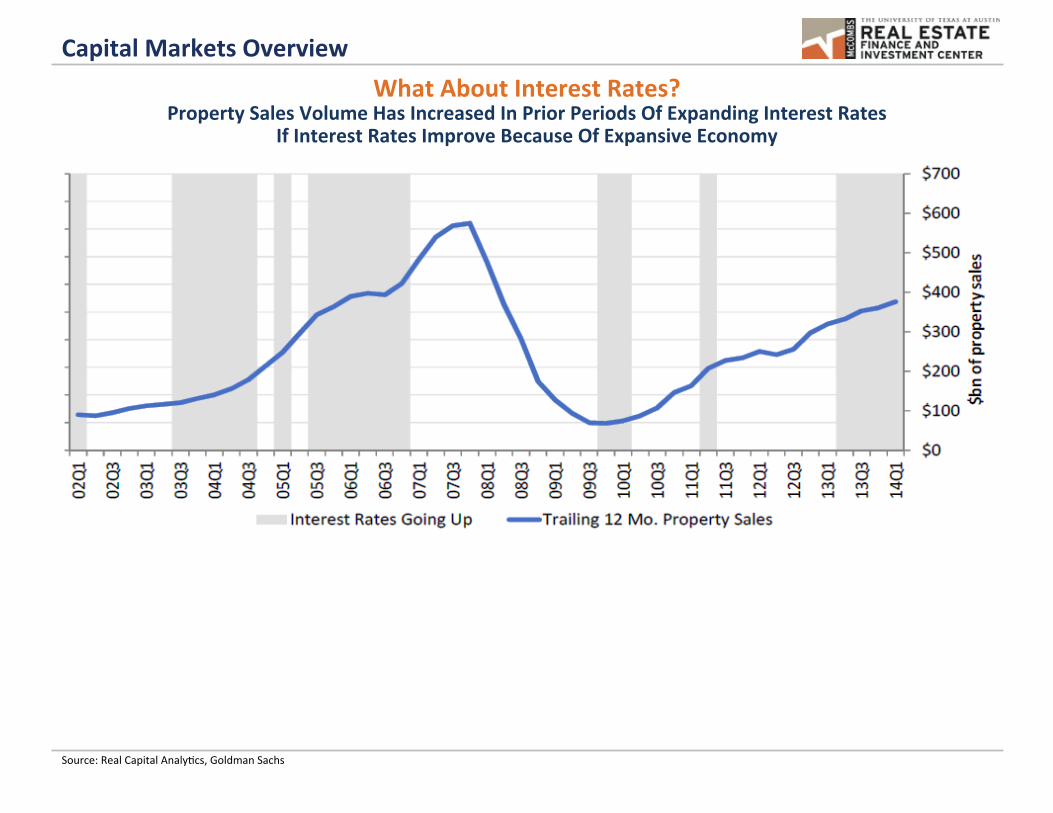
Capital Markets Overview What About Interest Rates?
Property Sales Volume Has Increased In Prior Periods Of Expanding Interest Rates If Interest Rates Improve Because Of Expansive Economy
Source: Real Capital Analy-cs, Goldman Sachs
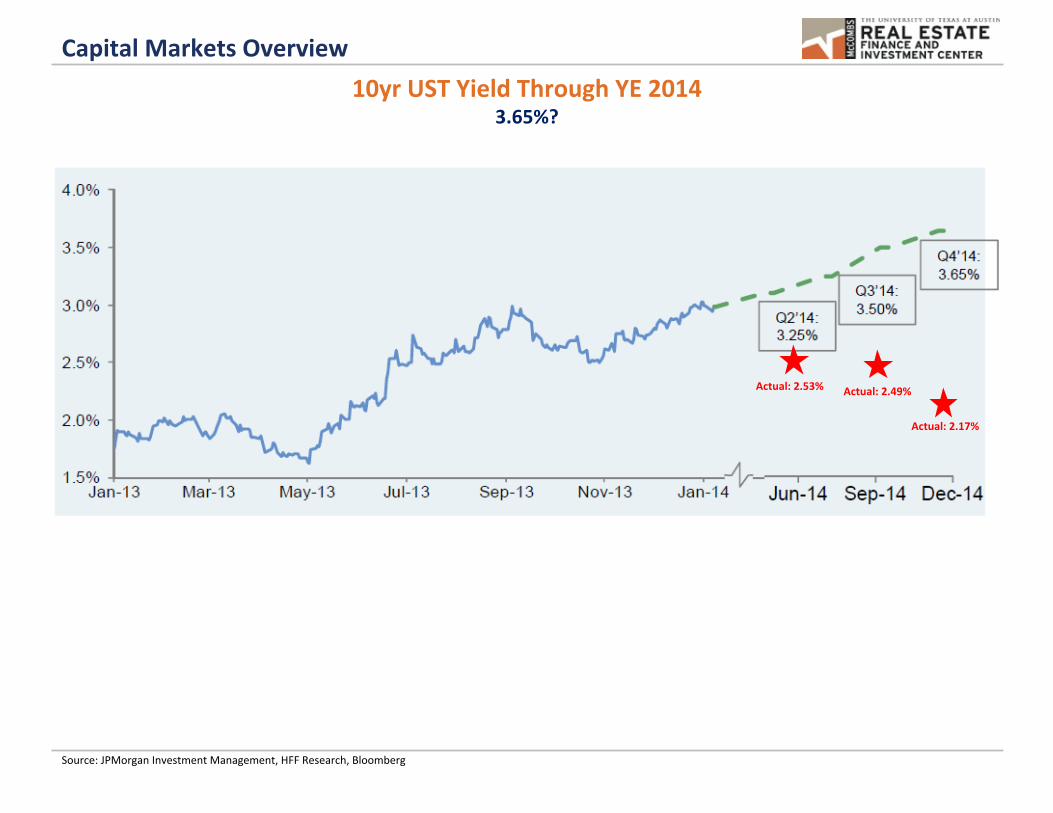
Capital Markets Overview 10yr UST Yield Through YE 2014
3.65%?
Source: JPMorgan Investment Management, HFF Research, Bloomberg
Actual: 2.53% Actual: 2.49%
Actual: 2.17%
Capital Markets Overview
Source: Cornell University, Hodes Weill, October 2014
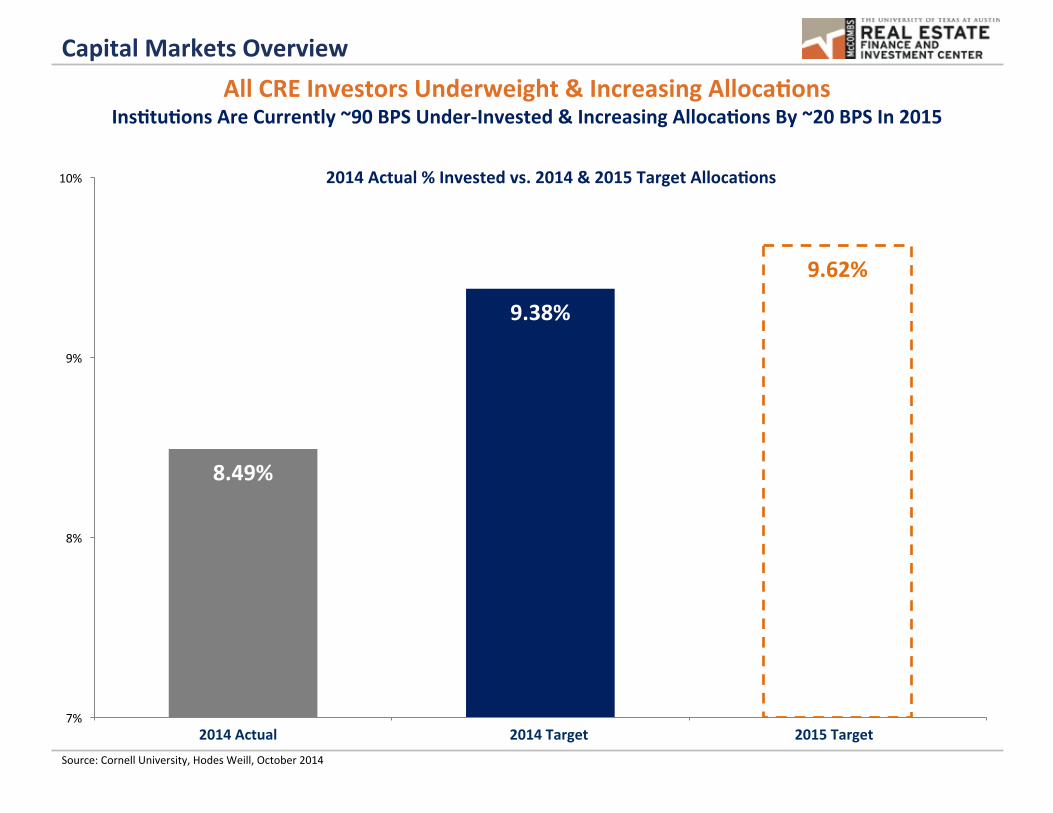
All CRE Investors Underweight & Increasing AllocaOons InsOtuOons Are Currently ~90 BPS Under-‐Invested & Increasing AllocaOons By ~20 BPS In 2015
2014 Actual % Invested vs. 2014 & 2015 Target AllocaOons
8.49%
9.38%
9.62%
7%
8%
9%
10%
2013 2014 2015f 2014 Actual 2014 Target 2015 Target
Capital Markets Overview
$25
$26 $37 $55 $70 $83
$85 $94
$80 $93
$79 $1
14
$32 $44 $5
0
$64
$91
$139
$129
$119
$160
$213
$256
$283
$58 $71
$86
$119
$161
$223 $214 $214
$240
$307
$335
$397
$0
$50
$100
$150
$200
$250
$300
$350
$400
$450
2002 2003 2004 2005 2006 2007 2008 2009 2010 2011 2012 2013
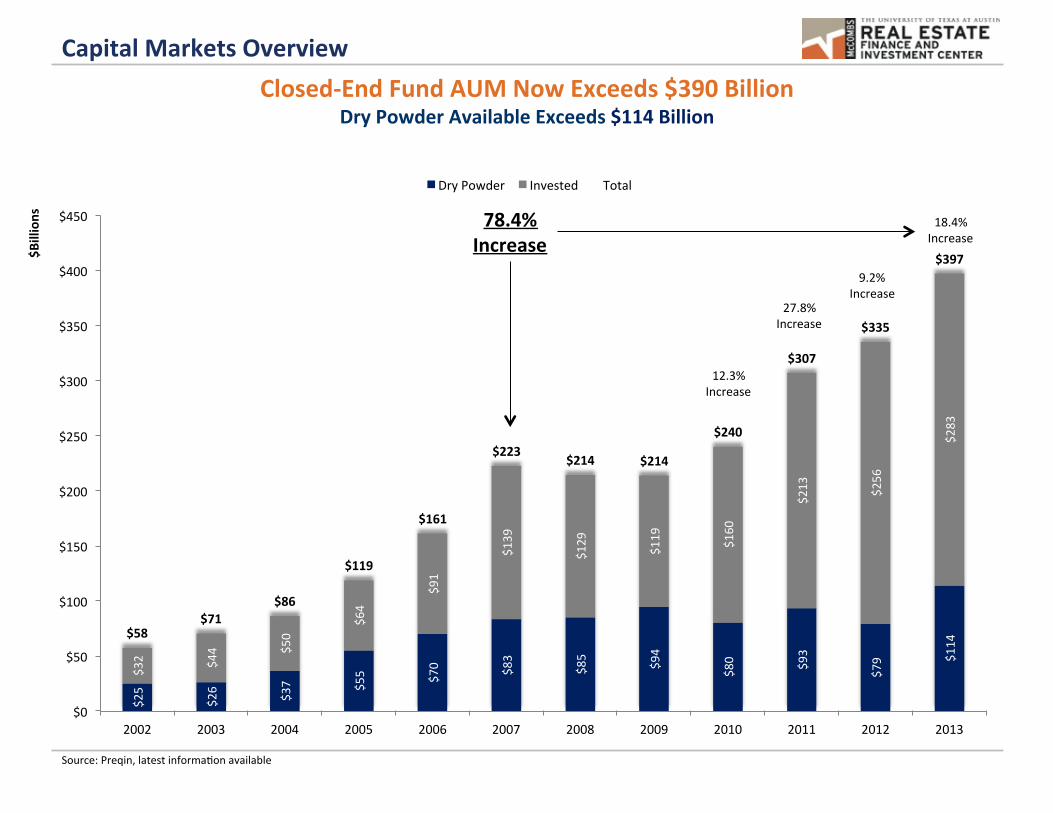
Dry Powder Invested Total
9.2% Increase
27.8% Increase
12.3% Increase
Closed-‐End Fund AUM Now Exceeds $390 Billion Dry Powder Available Exceeds $114 Billion
18.4% Increase
78.4% Increase
Source: Preqin, latest informa-on available
$Billions
Capital Markets Overview
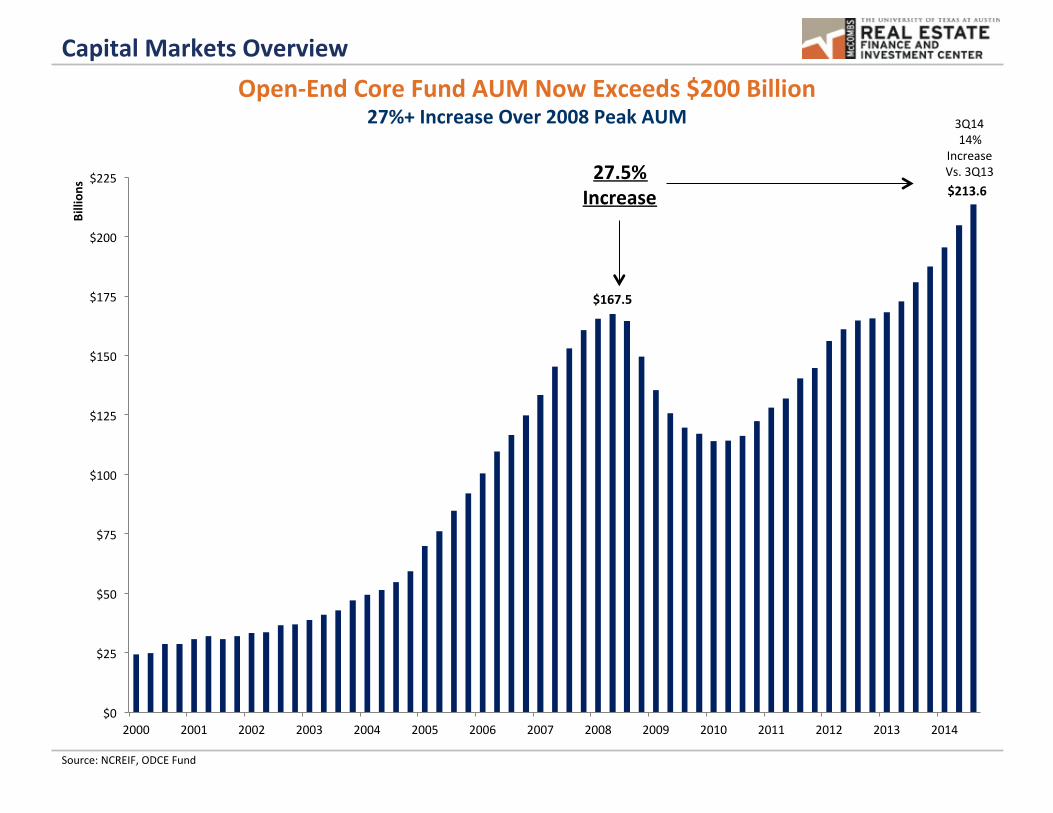
$167.5
$213.6
$0
$25
$50
$75
$100
$125
$150
$175
$200
$225
2000 2001 2002 2003 2004 2005 2006 2007 2008 2009 2010 2011 2012 2013 2014
Billion
s Open-‐End Core Fund AUM Now Exceeds $200 Billion
27%+ Increase Over 2008 Peak AUM
27.5% Increase
Source: NCREIF, ODCE Fund
3Q14 14%
Increase Vs. 3Q13