10.hemodynamic monitoring=from central venous pressure to pulse contour analysis
TRANSCRIPT

. . . . . . . . . . . . . . . . . . . . . . . . . . . . . . . . . . . . . . . . . . . . . . . . . . . . . . . . . . . . . . . . . . . . . . . .
CHAPTER 10
V O L U M E T H I R T Y - S E V E N
EDITOR: MEG A. ROSENBLATT, M.D.ASSOCIATE EDITORS: JOHN F. BUTTERWORTH IV, M.D.
JEFFREY B. GROSS, M.D.
The American Society of Anesthesiologists, Inc.. . . . . . . . . . . . . . . . . . . . . . . . . . . . . . . . . . . . . . . . . . . . . . . . . . . . . . . . . . . . . . . . . . . . . . . .
HEMODYNAMIC MONITORING:FROM CENTRAL VENOUSPRESSURE TO PULSECONTOUR ANALYSIS
ANDREW LEIBOWITZ, M.D.ASSOCIATE PROFESSOR OF ANESTHESIOLOGY AND SURGERY
MOUNT SINAI SCHOOL OF MEDICINE
NEW YORK, NEW YORK
The ASA Refresher Courses in Anesthesiology CME Program
Subscribers to ASA Refresher Courses in Anesthesiology are eligible to earn AMA
PRA Category 1 Credit(s)t. Please visit www.asa-refresher-cme.asahq.org or see
page iv at the beginning of this volume for complete details.
Accreditation and Designation StatementThe American Society of Anesthesiologists is accredited by the Accreditation
Council for Continuing Medical Education to provide continuing medical education
for physicians.
The American Society of Anesthesiologists designates this educational activity for
a maximum of 1 AMA PRA Category 1 Credit(s)t. Physicians should only claim
credit commensurate with the extent of their participation in the activity.
Author Disclosure InformationDr. Leibowitz has disclosed that he has no financial interests in or significant
relationship with any commercial companies pertaining to this educational activity.
�c 2009
The American Society of Anesthesiologists, Inc.ISSN 0363-471X
ISBN 978-1-6054-7424-3
An educational service to the profession under the auspices of
The American Society of Anesthesiologists, Inc.
Published for The Society
by Lippincott Williams & Wilkins
530 Walnut Street
Philadelphia, Pennsylvania 19106-3621
Library of Congress
Catalog Number 74-18961.
www.asa-refresher.com
PERMISSION TO PHOTOCOPY ARTICLES: This publication is protected by copyright. Permis-
sion to reproduce copies of articles for noncommercial use must be obtained from the Copyright
Clearance Center, 222 Rosewood Dr., Danvers, MA 01923; (978) 750-8400, FAX: (978) 750-4470,
www.copyright.com.

Hemodynamic Monitoring: From CentralVenous Pressure to Pulse Contour Analysis
Andrew Leibowitz, M.D.Associate Professor of Anesthesiology and Surgery
Mount Sinai School of Medicine
New York, New York
This Refresher Course reviews the physiologic underpinnings, clinical applica-
tion, and effectiveness of monitors that are used by anesthesiologists and intensivists
in their daily practice. Only those monitors that are available for use by the average
practitioner are discussed; thus, transesophageal echocardiography is not covered in
detail because of the significant additional training and certification required.However, it should be noted that there is an active movement toward recognition of
‘‘limited scope’’ or ‘‘goal-directed’’ echocardiography, sometimes also colloquially
referred to as ‘‘echo-lite,’’ which primarily focuses on cardiac filling, ventricular wall
motion, and the detection of pericardial effusion, performed by physicians who are
less than ‘‘fully’’ trained and lack certification from the American Board of
Echocardiography.
Hemodynamic monitoring has gradually shifted from invasive intravascular
monitoring toward less invasive devices. I review, in that order, techniques anddevices including central venous pressure (CVP), pulmonary artery catheter (PAC),
arterial pulse pressure variation, and the proprietary technologies of NICO, PiCCO2,
LiDCO, FloTrac/Vigileo, and Doppler (e.g., CardioQ; Deltex Medical, West Sussex,
United Kingdom). My inclusion or omission of any proprietary device should not be
interpreted as my personal recommendation or disapproval. The included devices
are representative and none of them has clearly distinguished itself as markedly
superior to the others.
The Basic Science of Clinical Management
Central Venous PressureMeasurement of CVP has been commonplace for more than 50 years since the
pioneering work of Aubaniac,1 Seldinger,2 and Wilson et al.3 CVP is simply an
intravascular pressure ideally measured in the superior vena cava. It is a false but
widely held belief that CVP can be used to estimate intravascular volume status.
Furthermore, even physicians willing to admit that this is not true usually adhere to
an equally false belief that the trend of the CVP over time correlates to the trend in
intravascular volume status. It is critical to understand that both of these beliefs are
physiologically illogical and, through studies, have been thoroughly dismissed.From a physiologic standpoint, it makes sense that volume status cannot be
inferred either from a single measurement of CVP or from its change over time. The
venous system contains 70% of the blood volume and is an extremely compliant
container, the main function of which is to return blood to the heart. Most of the
blood contained within the venous system exists within the system at a transmural
Copyright �2009 American Society of Anesthesiologists, Inc. 119

pressure of zero, whereas circulatory physiology dictates that a certain positive CVP
be maintained for blood to return to the heart and homeostasis to exist (Fig. 1).4
Therefore, even large changes in the content of this highly compliant system will not
consistently result in a net change in pressure measured in the superior vena cava.The physiologic premises dismissing the relationship between CVP and volume
have been clinically demonstrated in five studies using different methods of
determining blood volume; the inability of the CVP to predict the potential of the
cardiac output (CO) or blood pressure to increase with fluid administration has been
the subject of 19 other studies. All of these studies can now be reviewed very
succinctly in a systematic analysis that was just published by Marik et al.5 In addition,
in one recently published study by Kumar et al.,6 in volunteers given a 3-l fluid
challenge, one third of them failed to demonstrate a rise in their CVP, which is veryclear evidence that the trend over time in CVP measurement is not a reliable estimate
of what is happening to intravascular volume in even the healthiest patients in the
most stable situation possible. Therefore, in patients with cardiac depression from
anesthesia or sepsis, those with ongoing blood loss, or those with systemic
vasodilation, it is certain that no useful relationship between CVP and blood volume
exists.
Pulmonary Artery CatheterThe flow-directed, balloon-tipped PAC’s ability to measure CO and pressure in the
pulmonary artery represented a great physiologic advance. These easily obtained
measurements combined with the wedge (or pulmonary artery occlusion) pressure,
which should equal the left atrial and left ventricular pressure at end diastole, and
measurement of mixed venous oxygen saturation led to a widespread acceptance of
this technique within only a few years of its clinical introduction.7 Problems with
this technique were originally thought to be technical in nature and related to the
FIG. 1. Representation of the venous volume and dynamics that result in central venouspressure (CVP). The tub represents the blood volume. The ‘‘stressed volume’’ (Vs) is thevolume above the hole where the pressure is measured that will result in a positive pressure;the ‘‘unstressed’’ volume (Vu) is the volume less than the hole that will exist at a pressure ofzero. The measured pressure at the hole will result from a combination of the inflow from thesmaller arterial volume contained in the high-resistance arterial vessels, the relationshipbetween Vs and Vu, that is, changed by moving the hole up and down, and the venousresistance (VenR). Reprinted with permission from Gelman.5
120 LEIBOWITZ

potential failure of the wedge pressure to accurately estimate the left atrial pressure.8
Later, widespread errors in PAC use, including, most importantly, user errors in
obtaining and interpreting the wedge pressure, were demonstrated.9 More troubling,
in the past 7 years, several high-quality retrospective studies and prospectiverandomized trials (in all of which user error was nearly eliminated) have failed to
demonstrate an improvement in patient outcome associated with PAC use10--16 (see
Table 1). Several of these investigations suggest a worse outcome when a PAC is
used, even in highly competent hands using sophisticated management algorithms!
Two of these trials10,11 are particularly pertinent to anesthesiologists. The
Canadian Multicenter Trial10 reported that there was no difference in outcome in
high-risk, elderly, American Society of Anesthesiologists 3 and 4 patients (n¼ 1,994)
randomized to management with PACs and an ‘‘optimization’’ filling pressure/oxygendelivery regimen versus standard care. Moreover, the PAC group experienced a small
but statistically significant increased total complication rate related to PAC insertion.
Polanczyk et al.11 used ‘‘propensity scoring’’ to prospectively compare nonrando-
mized patients at identical risk who were managed with and without a PAC. This
‘‘matched pairs’’ analysis yielded 215 pairs of patients for investigation. Remarkably,
patients managed with a PAC had significantly more congestive heart failure and
other adverse events than their non-PAC-managed ‘‘controls.’’
Arterial Pulse Pressure VariationPulsus paradoxus, the excessive decrease in systolic pressure seen with
spontaneous ventilation in the presence of cardiac tamponade, has long been
recognized as an adverse clinical sign. More recently, the effect of positive pressure
ventilation on the arterial pulse pressure has been described17 and the physiologic
basis extensively reviewed.18,19 Understanding the three main physiologic premises
TABLE 1. Clinical Summary of Selected Recent Large Investigations Comparing
Management With Versus Without a PAC
Reference Type Patient Group
Number ofPatientsEnrolled Significant Outcome Differences
10 Prospectivemulticenter
Perioperative 1,994 More adverse events in PACgroup related to insertion
11 Observationalcohort singlecenter
Perioperative 4,059 total;215 matched
pairs
Increased heart failure andnoncardiac events in PACgroup
12 Prospectivemulticenter
General ICU 1,041 None
13 Prospectivesingle center
General ICU 201 Increased renal insufficiency andthrombocytopenia in PACgroup
14 ProspectiveMulticenter
DecompensatedHeart Failure
433 Increased infections in PACgroup
15 Prospectivemulticenter
ARDS 676 None
16 Prospectivemulticenter
ARDS 981 Increased related complicationsand blood transfusions in PACgroup
ARDS ¼ adult respiratory distress syndrome; ICU ¼ intensivecare unit; PAC ¼ pulmonary arterycatheter.
121HEMODYNAMIC MONITORING

underlies the use of this phenomena as a monitor: (1) arterial pulse pressure
(systolic--diastolic pressure) is directly proportional to stroke volume and inversely
related to arterial compliance20; (2) a positive pressure breath compresses the
pulmonary venous system, causing an increase in left ventricular preload and anincrease in stroke volume and arterial pulse pressure for a few beats; and (3) a
positive pressure breath also decreases the venous return to the right heart by
increasing intrathoracic pressure. This decreases the left ventricular filling; thus,
after a few beats of the increased pulse pressure that immediately follow a positive
pressure breath, a decrease in the pulse pressure will follow; Figure 2 demonstrates
this phenomenon.
For several reasons, in the presence of hypovolemia, the change in pulse pressure
is greater than in normovolemia. Simply summarized, in hypovolemia, the drivingforce for venous return, the mean circulatory filling pressure, is reduced, the right
atria and vena cava are thus more easily compressed, and the left ventricle is already
operating on the steep portion of the Frank--Starling curve.
Several caveats apply to the clinical application of this principle:
(1) There is no universal agreement as to which exact variable should be tracked,
but possibilities include: (a) systolic pressure at end apnea--minimum systolic
pressure (Ddown); (b) maximum systolic pressure--minimum systolicpressure; (c) 100� (maximum systolic pressure--minimum systolic pressure)/
(maximum systolic pressure--minimum systolic pressure/2) (DPP%)
(2) Increased pulse pressure variation does not necessarily mean there is a low CO
or hypovolemia, but its presence (i.e., 410%) is probably the best predictor that
the blood pressure will increase with the administration of intravenous fluids or
blood
(3) The shape of the arterial pressure tracing as well as the speed and scale of the
tracing combined with the ability to determine respiration will all impact theclinician’s ability to use these principles successfully.
The above principles were used in the design of the PiCCO, LiDCO, and FloTrac/
Vigileo devices that combine the power of continuous monitoring of DPP% or other
similar variables via pulse contour analysis with features that allow for continuous
CO reporting and also other derived variables.
FIG. 2. The variation of arterial pulse pressure with positive pressure breaths. See text forexplanation. Reprinted with permission from Michard.18
122 LEIBOWITZ

NICOs
The Fick principle states that ‘‘the total uptake or release of a substance by an
organ is the product of the blood flow to the organ and the arteriovenous
concentration difference of the substance.’’ Physicians are most familiar with theFick principle applied to oxygen used to calculate CO in which:
CO ¼VO2
CaO2�CvO2
where VO2¼ oxygen consumption; CaO2, CvO2¼ arterial, venous oxygen content.
Clinically, this principle can be used to determine CO when oxygen consumption
is determined by using a metabolic cart and an arterial sample and a mixed venous
sample of blood can be obtained and their oxygen contents determined. More
commonly, intensivists interested in the determination of oxygen consumption
rearrange this equation to determine oxygen consumption as follows:
VO2¼ CO� ðCaO2�CvO2Þ
The NICO system (Philips/Respironics) adapts this principle to CO2 to determine
CO as follows:
CO ¼VCO2
CvCO2�CaCO2
where VCO2¼CO2 clearance; CaCO2, CvCO2¼ arterial, venous CO2 content.
The device is inserted between the endotracheal tube and the breathing circuit
that ingeniously relies on the following principles: (1) CaCO2 can be estimated by
using the end-tidal CO2 in a steady state; and (2) addition of dead space and
rebreathing allow mathematical calculation of the CO as follows:
CO ¼VCO2
N
CvCO2N� CaCO2N¼
VCO2R
CvCO2R � CaCO2R
where N ¼ normal; R ¼ rebreathing.
Knowledge of algebra allows the following assumption:If
a
b¼
c
dthen
ða� cÞ
ðb� dÞ¼
a
b¼
c
d
and is applied to the above equation then:
CO ¼VCO2
N� VCO2R
ðCvCO2N� CaCO2NÞ � ðCvCO2R � CaCO2RÞ
During rebreathing, venous CO2 should be the same as under normal conditions
and CvCO2N¼CvCO2 R and thus this equation becomes:
CO ¼VCO2
N� VCO2R
CaCO2R � CaCO2N
All these variables can be measured by the device.
To use this device, the patient must be on positive pressure ventilation with stable
tidal volume and respiratory rate. The number and variety of physiologic
assumptions and mathematical manipulations are the main drawbacks to using this
monitor. The difference in the N and R CO2 is usually quite small (i.e., o 10 mmHg),
therefore, small differences in measurement may lead to large changes in calculated
123HEMODYNAMIC MONITORING

CO. In addition, shunted blood containing CO2 is eliminated from consideration in
this model. These underlying physiologic limitations combined with the ability to
only monitor CO alone seem to be the main reasons for NICO’s relatively small
market penetration.Furthermore, from a clinical and statistical point of view, it is critical to note the
standard to which the new monitoring devices are held when reporting CO. PAC-
measured CO is usually determined by three consecutive measurements that may
differ by 15% or more. On the basis of the methods of Bland and Altman,21 and the
subsequent publication of one particularly influential meta-analysis,22 a new monitor
or technique is felt to be acceptable if the CO reported is 730% of the PAC
thermodilution-determined CO and it is on this basis that all of the monitors and
techniques discussed in this Refresher Course are ‘‘acceptable.’’ Data comparingthese devices with thermodilution-determined CO usually report the bias (the
average difference between the two), precision (71 standard deviation of the bias),
and limits of agreement (72 standard deviation of the bias).
Pulse Contour DevicesThese devices use computer-driven algorithms to translate the arterial pressure
tracing into CO and other variables.23 The PiCCO and the original LiDCO (the ‘‘plus’’
model) devices require that the CO of the device be calibrated to another method,
whereas the FloTrac/Vigileo uses a more mathematically advanced algorithm andrequires no calibration. A recently updated version of the LiDCO (the ‘‘rapid’’ model)
also allows noncalibrated CO to be continuously reported. All these devices allow
continuous monitoring of the arterial pulse pressure variation, which, even in the
absence of other functionality, may be useful.
PiCCOThe PiCCO device (Pulsion Medical Systems, Munich, Germany) is widely used in
Europe and was recently introduced in the United States. The device relies on several
principles that are relatively new to most anesthesiologist and intensivists. Theprimary physiologic assumption is that the contour of the arterial pressure waveform
can be analyzed and the stroke volume equals the integral of the area under the
curve divided by the impedance of the aorta (z), or mathematically stated:
SV ¼
RdP=dt
Z
This is a variation of the idea that stroke volume is equal to pulse pressure divided
by arterial compliance. The determination of CO at any time will allow calculation ofz after which only periodic recalibration will be required. Figure 3 illustrates this
method.
The device relies on the insertion both of a proprietary arterial line with a
temperature sensor at the tip that must be placed in the femoral or axillary artery and
a central venous line with its tip in the superior vena cava. These two catheters are
used to determine CO by means of the injection of a cold fluid bolus into the
superior vena cava and monitoring of the temperature change in the artery; this is
done via a modified Stewart--Hamilton equation and the resultant value is termed the‘‘transpulmonary thermodilution CO.’’ After calibration, the device reports CO and
stroke volume continuously. From the analysis of the pulse contour, stroke volume
variance is also reported.
124 LEIBOWITZ

Further physiologic assumptions primarily relying on the concept that most of the
diminution in temperature of the injectate occurs within the pulmonary vascular bed
also permits continuous reporting of extravascular lung water, preload (referred toas global end-diastolic volume), and afterload.
The main drawback of this device is the need for both a central line and an arterial
line that are in the femoral or axillary artery. In addition, rapidly changing
hemodynamic conditions will warrant repeated cold water injectate to reliably
obtain a properly calibrated pulse contour analysis. The manufacturer recommends
recalibration at least every 8 hours.
One recent study reported a prospective (nonrandomized) multicenter investiga-
tion of 331 intensive care unit patients managed with a PAC versus PiCCO.24 Therewas no difference in the length of stay or mortality, the two main outcomes
investigated between these two groups, although the PiCCO group had a greater
positive fluid balance and a longer duration of mechanical balance.
LiDCOThe original LiDCO device (LiDCO Ltd., Cambridge, United Kingdom), much like
the PiCCO device, requires CO to be measured to ‘‘calibrate’’ its internal algorithm.25
It uses a peripheral injection of lithium ion 0.15 to 0.3 mMol with a 15-ml saline flushand a proprietary arterial line containing a lithium sensor to construct a dilution
curve for the lithium ion and:
COðL=minÞ ¼Lithium dose in mmol� 60
ð1� PCVÞ �R
d½Li�=dt
Rd[Li]/dt is the area under the primary curve and PCV is the packed cell volume [Hb
(g/dL)/34]. A correction for PCV is necessary because lithium is distributed in the
plasma.
The LiDCO device then relies on a more complex algorithm (i.e., PulseCO) thanthe PiCCO device. It assumes that arterial compliance changes with blood pressure
and this change is similar in all humans.
A few downsides to this device result from the use of lithium injections. The drug,
lithium carbonate, hyponatremia, and some other drugs that contain quaternary
ammonium ions (including some muscle relaxants), and hyponatremia interfere with
lithium injection as a calibrating standard.
t t
-∆T-∆T
Calibration
t [s]
P [mm Hg] SV
FIG. 3. The calibration of cardiac output with pulse contour. The transpulmonary cardiacoutput is obtained and used to calibrate the device so that the area under the arterial pressurecurve can subsequently be used to estimate the cardiac output. t¼ time; T¼ temperature.Reprinted with permission from Pulsion-supplied information package.
125HEMODYNAMIC MONITORING
A randomized trial by Pearse et al.26 compared the use of the LiDCO device
coupled with a goal-directed strategy versus conventional management and showed
a reduction in the complications and hospital length of stay after major surgery in the
treatment group but no difference in mortality. This was a small study of only 122patients and the treatment group received dopexamine; therefore, it is difficult to
draw any broad conclusion from this study.
FloTrac/VigileoThe FloTrac/Vigileo system (Edwards Life Sciences, Irvine, CA) differs significantly
from the PiCCO and LiDCO devices in that no external calibration for CO is required
at all and the device can be used with a standard arterial line. Instead of calibrating
the device to a measured CO (transpulmonary thermodilution CO in the case ofPiCCO and lithium dilution CO in the case of LiDCO), the arterial pressure waveform
is analyzed in conjunction with demographic data consisting of age, height, weight,
and sex. This device has recently had its algorithm updated after which bias,
precision, and limits of agreement were improved.27 The underlying mathematics
and physics used are difficult for the mathematically unsophisticated nonengineer to
comprehend.
No outcome study using the most recent version of this device has been reported.
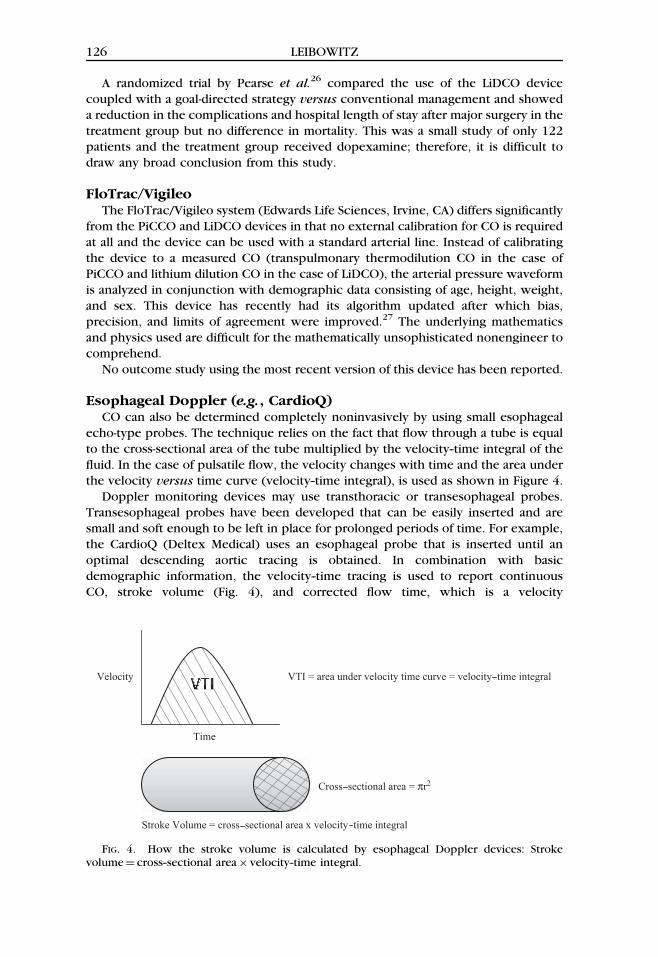
Esophageal Doppler (e.g., CardioQ)CO can also be determined completely noninvasively by using small esophageal
echo-type probes. The technique relies on the fact that flow through a tube is equal
to the cross-sectional area of the tube multiplied by the velocity--time integral of the
fluid. In the case of pulsatile flow, the velocity changes with time and the area under
the velocity versus time curve (velocity--time integral), is used as shown in Figure 4.
Doppler monitoring devices may use transthoracic or transesophageal probes.
Transesophageal probes have been developed that can be easily inserted and aresmall and soft enough to be left in place for prolonged periods of time. For example,
the CardioQ (Deltex Medical) uses an esophageal probe that is inserted until an
optimal descending aortic tracing is obtained. In combination with basic
demographic information, the velocity--time tracing is used to report continuous
CO, stroke volume (Fig. 4), and corrected flow time, which is a velocity
Time
Velocity
Stroke Volume = cross sectional area x velocity time integral
VTI = area under velocity time curve = velocity time integral
Cross sectional area = πr2
FIG. 4. How the stroke volume is calculated by esophageal Doppler devices: Strokevolume¼ cross--sectional area� velocity--time integral.
126 LEIBOWITZ

measurement corrected for age, peak velocity, minute distance, and heart rate. The
manufacturer suggests using this device to construct a volume response optimization
strategy in which the effect of successive boluses on CO, stroke volume, and velocity
can be seen and fluid titrated to optimize CO.Although there are several versions of esophageal CO devices that are available
commercially, the CardioQ is nearly unique in that several outcome studies have
been published attesting to its effectiveness. On that basis, the Center for Medicare
and Medicaid Service will reimburse physicians for using the information supplied by
esophageal Doppler for ‘‘ventilated patients in the intensive care unit and operative
patients with a need for intraoperative fluid optimization.’’ However, the majority of
the patients studied were at a relatively minimal cardiac risk and the outcome
improvements (i.e., length of stay) are of unknown importance because of the longlength of stay in both the monitored and control groups.
Conclusion
Although CVP and measurements available from the PAC show no association
with estimated intravascular volume and provide no proven outcome benefit for
manipulating hemodynamic values, there are newer monitoring techniques that may
provide benefit to patients. These monitors require a better understanding of how
the circulatory system adjusts to changes in blood volume and extracellular fluid
volume. To date, although these devices can nearly duplicate the CO data suppliedby the PAC (and do so continuously) and provide data heretofore unavailable to
clinicians, these devices have not been demonstrated to change outcomes.
References
1. Aubaniac RL: Intravenous subclavicular injection [in French]. Presse Med 1952; 60:1456--58.
2. Seldinger SI: Catheter replacement of the needle in percutaneous arteriography; a newtechnique. Acta Radiol 1952; 39:368--76.
3. Wilson IN, Grow JB, Demong CV, et al.: Central venous pressure in optimal blood volumemaintenance. Arch Surg 1962; 85:563--78.
4. Gelman S: Venous function and central venous pressure. Anesthesiology 2008; 108:735--48.
5. Marik PE, Baram M, Vahid B: Does central venous pressure predict fluid responsiveness?A systematic review of the literature and the tale of seven mares. Chest 2008; 134:172--8.
6. Kumar A, Anel R, Bunnell E, et al.: Pulmonary artery occlusion pressure and centralvenous pressure fail to predict ventricular filling volume, cardiac performance, or theresponse to volume infusion in normal subject. Crit Care Med 2004; 32:691--9.
7. Swan HJ, Ganz W, Forrester J, et al.: Catheterization of the heart in man with use of a flow-directed balloon-tipped catheter. N Engl J Med 1970; 283:447--51.
8. Raper R, Sibbald WJ: Misled by the wedge? The Swan-Ganz catheter and left ventricularpreload. Chest 1986; 89:427--34.
9. Iberti TJ, Fischer EP, Leibowitz AB, et al.: A multicenter study of physicians’ knowledge ofthe pulmonary artery catheter. Pulmonary Artery Catheter Study Group. JAMA 1990;264:2928--32.
10. Sandham JD, Hull RD, Brant RF, et al.: A randomized, controlled trial of the useof pulmonary-artery catheters in high-risk surgical patients. N Engl J Med 2003; 348:5--14.
127HEMODYNAMIC MONITORING

11. Polanczyk CA, Rohde LE, Goldman L, et al.: Right heart catheterization and cardiaccomplications in patients undergoing noncardiac surgery: An observational study. JAMA2001; 286:309--14.
12. Harvey S, Harrison DA, Singer M, et al.: Assessment of the clinical effectiveness ofpulmonary artery catheters in management of patients in intensive care (PAC-Man):A randomised controlled trial. Lancet 2005; 366:472--7.
13. Rhodes A, Cusack RJ, Newman PJ, et al.: A randomised, controlled trial of the pulmonaryartery catheter in critically ill patients. Intensive Care Med 2002; 28:256--64.
14. Binanay C, Califf RM, Hasselblad V, et al.: Evaluation study of congestive heart failureand pulmonary artery catheterization effectiveness: The ESCAPE trial. JAMA 2005;294:1625--33.
15. Richard C, Warszawski J, Anguel N, et al.: Early use of the pulmonary artery catheter andoutcomes in patients with shock and acute respiratory distress syndrome: A randomizedcontrolled trial. JAMA 2003; 290:2713--20.
16. The National Heart, Lung, and Blood Institute Acute Respiratory Distress Syndrome(ARDS) Clinical Trials Network, Wheeler AP, Bernard GR, et al.: Pulmonary arterycatheter versus central venous catheter to guide treatment of acute lung injury. N EnglJ Med 2006; 354:2213--416.
17. Rick JJ, Burke SS: Respirator pulsus paradox. South Med J 1978; 71:1376--8.18. Michard F: Changes in arterial pressure during mechanical ventilation. Anesthesiology
2005; 103:419--27.19. Perel A: Automated assessment of fluid responsiveness in mechanically ventilated patients.
Anesth Analg 2008;106:1031--3.20. Chemla D, Hebert JL, Coirault C, et al.: Total arterial compliance estimated by stroke
volume-to-aortic pulse pressure ration in humans. Am J heart Circ Physiol 1998;274:500--5.
21. Bland JM, Altman DG: Statistical methods for assessing agreement between methods ofclinical measurement. Lancet 1986; 8:307--10.
22. Critchley LA, Critchley JA: A meta-analysis of studies using bias and precision statistics tocompare cardiac output measurement techniques. J Clin Monit Comput 1999; 15:85--91.
23. Chaney JC, Derdak S: Minimally invasive hemodynamic monitoring for the intensivists.Current and emerging technology. Crit Care Med 2002; 30:2338--45.
24. Uchino S, Bellomo R, Morimatsu H, et al.: Pulmonary artery catheter versus pulsecountour analysis: A prospective epidemiologic study. Crit Care 2006; 10:R174.
25. Pearse RM, Ikram K, Barry J: Equipment review: An appraisal of the LiDCO plus method ofmeasuring cardiac output. Crit Care 2004; 8:190--5.
26. Pearse R, Dawson D, Fawcett J, et al.: Early goal-directed therapy after major surgeryreduces complications and duration of hospital stay. A randomized controlled trial. CritCare 2005; 9:R687.
27. Mayer J, Bold J, Wolf MW: Cardiac output derived from arterial pressure waveform analysisin patients undergoing cardiac surgery: Validity of a second generation device. AnesthAnalg 2008; 106:867--72.
128 LEIBOWITZ

