109 ' # '7& *#1 & 8 - opencdn.intechopen.com/pdfs-wm/28118.pdf · drug synergy...
TRANSCRIPT

3,350+OPEN ACCESS BOOKS
108,000+INTERNATIONAL
AUTHORS AND EDITORS114+ MILLION
DOWNLOADS
BOOKSDELIVERED TO
151 COUNTRIES
AUTHORS AMONG
TOP 1%MOST CITED SCIENTIST
12.2%AUTHORS AND EDITORS
FROM TOP 500 UNIVERSITIES
Selection of our books indexed in theBook Citation Index in Web of Science™
Core Collection (BKCI)
Chapter from the book Toxicity and Drug TestingDownloaded from: http://www.intechopen.com/books/toxicity-and-drug-testing
PUBLISHED BY
World's largest Science,Technology & Medicine
Open Access book publisher
Interested in publishing with IntechOpen?Contact us at [email protected]

7
Drug Synergy – Mechanisms and Methods of Analysis
Hans-Georg Breitinger The German University in Cairo,
Egypt
1. Introduction
The term synergy is derived from the Greek syn-ergos, "working together". Synergies have been described in many settings and situations of life, including mechanics, technical systems, human social life, and many more. In all cases, synergy describes the fact that a system, i.e. the combination and interaction of two or more agents or forces is such that the combined effect is greater than the sum of their individual effects. This definition implies that there are three possible ways of such an “interaction of agents or forces”: these forces could simply add up, not affecting each other (no interaction), their combination could produce a greater than expected result (synergy), or the combination could lead to a result that is less than the sum of the individual effects. This “negative” summation is called antagonism. Interactions of biologically active agents are an important aspect of pharmacology and biomedicine. In this context, interaction describes the biological activity that results from the presence of several drugs at the same time. Such situations occur in numerous clinical situations: - combinations of cytotoxic drugs in the treatment of cancer and infections require lower
doses of each drug to obtain better therapeutic effects with less side-effect toxicity. - combinations of antibiotics likewise combine better efficiency with fewer side effects
and reduced development of resistance. - many serious clinical situations require administration of several drugs simply because
of multiple therapeutic indications. Although in such a case drug combinations are not formulated to look for synergies, the interactions of these drugs need to be assessed.
- the effect of one drug may be augmented by another drug that does not produce such an effect on its own
In all these cases, multiple drugs are administered, and will show some form of interaction, synergistic, antagonistic, or none. Methods to determine and quantify drug interactions are thus an essential tool in pharmacology. Historically, extracts from plants, animals, or even soils were the first classified pharmaceuticals. These were complex mixtures rather than single agents, and some ingredients may have interacted with others. Over the years of development of pharmacy, isolation, synthesis and marketing of single drugs became the accepted standard. Whether a complex mixture or a combination of drugs is used, the biological interaction of all active substances should be known. Synergy may be observed in simple systems – two drugs that only act on one target protein can show synergism. In such a case we can study the interaction of the drugs mechanistically and determine why and
www.intechopen.com

Toxicity and Drug Testing
144
how several drugs can reinforce each other (or why they do not). Synergy may also be observed in complex settings, such as patients receiving multiple medications. Usually, more than one biological target (protein, pathway, or even organ) are involved in such cases, and single mechanistic descriptions are not appropriate. Additional parameters to consider are drug absorption, tissue distribution, and clearance. It may be expected that many drugs interfere with metabolism of other drugs. Thus, a substance B that slows down clearance of an active drug A, say by blocking metabolizing enzymes or excretion, may lead to a higher effective concentration of A that remains in the body for a longer time. As a result, one would notice a greater effect of drug A when given together with B, although the two drugs have completely different modes of action. While certainly the combination of these two drugs would have a “combined effect is greater than the sum of their individual effects”, their combination is synergistic in practical application, but not by the strict definition.
2. Basic models and mechanisms – Synergy on a molecular level
2.1 A simple reaction scheme for enzyme inhibition
Drug interaction and synergy has been intensively studied for more than 100 years, and some of the numerous concepts will be briefly introduced in this chapter. The simplest model cases will be presented, leading to a molecular definition of drug synergy. Let us assume a simple enzyme following the laws of mass action and Michaelis-Menten kinetics. In the simplest case, this enzyme has an active site, where substrate is being converted into product, and possesses one or several specific binding sites for inhibitors (Fig. 1A). A competitive inhibitor by definition binds to the active site of the enzyme, displacing the substrate. Thus, a mixture of two purely competitive inhibitors will only ever target the active site. This is known as mutually exclusive binding. If only the simplest mechanistic case is considered, one would not expect a second competitive inhibitor to have any notable effect on the first one, other than raising the total amount of inhibitory molecules.
Fig. 1. Schematic representation of inhibition mechanisms (A) Competitive inhibition. Inhibitor (open circles) binds to the active site of the target protein. The agonist (solid circles) binds to the same site. By definition of competitive inhibition, all competitive inhibitors bind to the same (active) site. Thus, binding of two competitive inhibitors must be mutually exclusive, and they cannot act synergistically on the same target protein. (B) Non-competitive inhibition. Inhibitor (open squares) binds to a site different from the active site of the target molecule. In pure non-competitive inhibition agonist binding is not affected by the inhibitor. Inhibition is due to conversion of the target protein into an inactive state.
A
B
www.intechopen.com

Drug Synergy – Mechanisms and Methods of Analysis
145
In case of non-competitive inhibition, the inhibitor binds to a location on the enzyme different from the active site. Assuming that bound inhibitor converts the enzyme into an inactive (non product-forming) state, presence of a non-competitive inhibitor simply lowers the amount of active enzyme molecules (Fig. 1B). There are states, where both substrate and inhibitor are bound to the enzyme. The effect of several non-competitive inhibitors applied together raises the question if synergy can be observed in such a simple system. If two non-competitive inhibitors bind to the same site on their target enzyme, this inhibitory site can either be occupied by inhibitor A or B, but not by both inhibitors at the same time (Fig. 2). This would be a case of mutually exclusive binding of two inhibitors. If one inhibitor is present, and the second one added, one may observe indeed a greater extend of inhibition, but this would only be due to larger amounts of inhibitory molecules being present. At all times, we could predict the total amount of inhibition by summations. In the simplest molecular case, two inhibitors targeting the same site would produce an additive effect only.
Fig. 2. Reaction scheme for two non-competitive inhibitors targeting the same site. Two non-competitive inhibitors (squares) bind to the same site on the target protein. In this case their binding is mutually exclusive. Presence of the second inhibitor increases the total amount of inhibitor causing in increased inhibitory effect. This increase is only due to simple additivity, and not synergy.
If, however, two different binding sites for non-competitive inhibitors exist on an enzyme,
two inhibitors may bind simultaneously (Fig. 3). Inspection of the reaction schemes (Fig. 2,
3) shows that if two inhibitors have specific, independent sites on the enzyme, we will
observe states where the enzyme indeed has two inhibitors bound (Fig. 3). These states
cannot exist if both inhibitors bind to the same site (Fig. 2). Thus, if two inhibitors are able to
bind simultaneously, we have a case of “mutually non-exclusive” binding. Here, presence of
the second inhibitor will not only give an additive effect (increase of the number of
inhibitory molecules), but will generate additional inhibited states of the enzyme. Therefore,
on a molecular level we would expect a superadditive effect of two such inhibitors.
It should be noted that the considerations above are made following some basic
assumptions, namely that binding of an inhibitor will convert the enzyme to an inactive
state, binding of substrate and inhibitor is reversible, and binding of any compound is fully
independent from all other compounds. Thus, the equilibrium binding constant for inhibitor
A is the same whether A binds to the unliganded enzyme, or to the enzyme that has
substrate and/or another inhibitor bound. Given these assumptions, the mechanisms for
activation (Fig. 4A), and non-competitive inhibition (Fig. 4B,C) show the different states in
which an enzyme exists in the presence of two non-competitive inhibitors that bind to the
same site (Fig. 4B), or to different sites of the enzyme (Fig. 4B).
www.intechopen.com

Toxicity and Drug Testing
146
Fig. 3. Reaction scheme for two mutually non-exclusive non-competitive inhibitors. Non-competitive inhibition by two inhibitors (squares, triangles) binding to different sites on the target protein. Here, bindign of one inhibitor does not prevent binding of the other. Note that presence of the second inhibitor creates new inactive states of the target protein that are not possible if only one inhibitor is present. This applies even in the simplest theoretical case, where binding affinities of agonist and inhibitors are completely independent of each other. Thus, in the presence of two inhibitors of the same target protein that follow the rule of Bliss independence, i.e. mutually non-exclusive binding, synergy must be a necessary consequence.
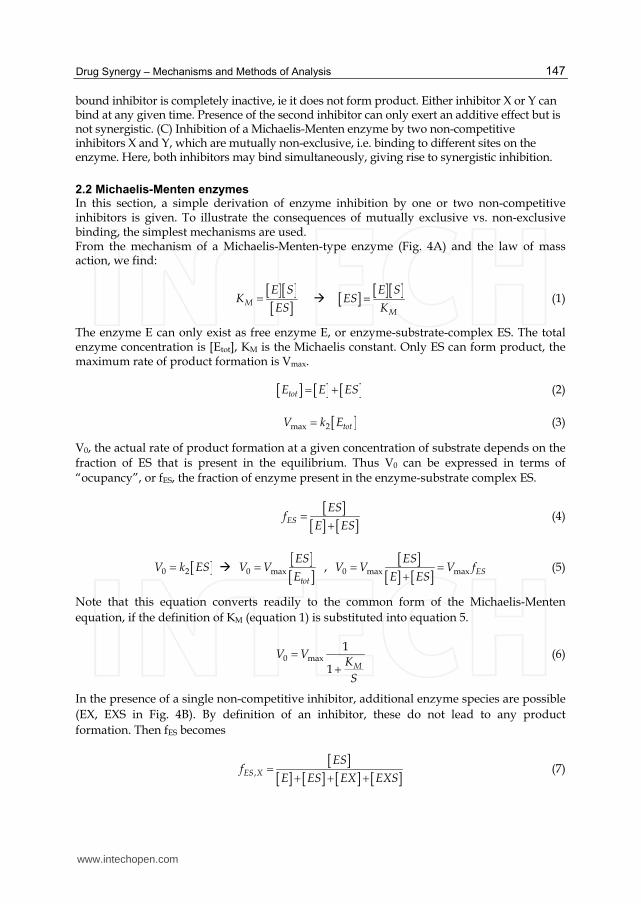
Fig. 4. Mechanism of catalysis and non-competitive inhibition of a Michaelis-Menten enzyme. (A) Mechanism for the activation of an enzyme following Michaelis-Menten kinetics. E = enzyme, S = substrate, P = product, KM = Michaelis constant, k2 = rate of product formation from ES. A simplified MM kinetic scheme is used, assuming no backward reaction EP ES. (B) Inhibition of a Michaelis-Menten enzyme by two non-competitive inhibitors X and Y, which are mutually exclusive (e.g. binding to the same site). It is assumed that enzyme with
www.intechopen.com
Drug Synergy – Mechanisms and Methods of Analysis
147
bound inhibitor is completely inactive, ie it does not form product. Either inhibitor X or Y can bind at any given time. Presence of the second inhibitor can only exert an additive effect but is not synergistic. (C) Inhibition of a Michaelis-Menten enzyme by two non-competitive inhibitors X and Y, which are mutually non-exclusive, i.e. binding to different sites on the enzyme. Here, both inhibitors may bind simultaneously, giving rise to synergistic inhibition.
2.2 Michaelis-Menten enzymes In this section, a simple derivation of enzyme inhibition by one or two non-competitive inhibitors is given. To illustrate the consequences of mutually exclusive vs. non-exclusive binding, the simplest mechanisms are used. From the mechanism of a Michaelis-Menten-type enzyme (Fig. 4A) and the law of mass action, we find:
M
E SK
ES
M
E SES
K (1)
The enzyme E can only exist as free enzyme E, or enzyme-substrate-complex ES. The total enzyme concentration is [Etot], KM is the Michaelis constant. Only ES can form product, the maximum rate of product formation is Vmax.
totE E ES (2)
max 2 totV k E (3)
V0, the actual rate of product formation at a given concentration of substrate depends on the fraction of ES that is present in the equilibrium. Thus V0 can be expressed in terms of “ocupancy”, or fES, the fraction of enzyme present in the enzyme-substrate complex ES.
ES
ESf
E ES (4)
0 2V k ES 0 max
tot
ESV V
E ,
0 max max ES
ESV V V f
E ES (5)
Note that this equation converts readily to the common form of the Michaelis-Menten
equation, if the definition of KM (equation 1) is substituted into equation 5.
0 max
1
1 M
V VK
S
(6)
In the presence of a single non-competitive inhibitor, additional enzyme species are possible
(EX, EXS in Fig. 4B). By definition of an inhibitor, these do not lead to any product
formation. Then fES becomes
,ES X
ESf
E ES EX EXS (7)
www.intechopen.com
Toxicity and Drug Testing
148
The rate of product formation in presence of one non-competitive inhibitor is
0, max
1
1 1X
M
X
V VK X
S K
(8)
For two mutually exclusive inhibitors X and Y (Fig. 4B), one obtains:
0, , max
1
1 1X Y
M
X Y
V VK X Y
S K K
(9)
And for two mutually non-exclusive inhibitors (Fig. 4C), the rate equation is
0, , max
1
1 1 1X Y
M
X Y
V VK X Y
S K K
(10)
There is a simple technique to determine the type of enzyme inhibition by two inhibitors, and whether their action on the enzyme is synergistic. To this end, the ratio of the initial rates in the absence (control, V0), and in the presence of inhibitor (V0,X) is measured. S0 is the control signal, SX is the signal obtained in the presence of inhibitor.
max
0 0
0,max
1
1
11
1 1
M
X X X
M
X
VK
S V XS
S V KVK X
S K
(11)
Thus, a straight-line curve is obtained when S0/SX is plotted against [X], the (varied) concentration of inhibitor X. The slope of this line (Fig. 6) gives the inhibition constant KX. This plot is linear over the entire range of inhibitor concentration. In the case of two mutually exclusive inhibitors, the ratio becomes
max
0 0
, 0, ,max
1
1
11
1 1
M
X Y X Y X Y
M
X Y
VK
S V X YS
S V K KVK X Y
S K K
(12)
Presence of the second inhibitor only results in an additional term (Y/KY) that shifts the
S0/SX,Y curve upwards. This term indicates additivity of the two inhibitors, but inhibitory
potency (slope of the curve) is not altered.
For two mutually non-exclusive inhibitors, the ratio is
www.intechopen.com

Drug Synergy – Mechanisms and Methods of Analysis
149
max
0 0
, 0, ,max
1
1
1 11
1 1 1
M
X Y X Y X Y
M
X Y
VK
S V X YS
S V K KVK X Y
S K K
(13)
The difference between mutually exclusive and non-exclusive inhibitors can directly be seen from an experiment where the concentration of inhibitor X is held constant, and only [Y] is varied. Equation 13 can be rearranged to:
0
,
1 1X Y X Y X
S X Y X
S K K K
(14)
Compared to the case of mutually exclusive inhibitors, the curve of S0/SX,Y. Y is shifted upwards by a constant concentration of X, and the slope of the curve also increases by a factor of (1+X/KX). The ratio method shown here applies to the simplest case of synergistic action of drugs, two substances binding to the same target. It requires some basic kinetic data to be collected and gives a simple linear graph that can be quickly inspected for a qualitative result whether two substances act on the same or on different sites on an enzyme, and thus whether these two substances can be synergistic on their target or not. It should be noted that by taking the ratios, the control signal (uninhibited case, i.e. the largest signal) is divided by a signal that becomes progressively smaller and thus carries a higher error. It is needed to detect whether two curves have the same slope (mutually exclusive binding, additive effect), or different slopes (mutually non-exclusive binding, synergy). This difference has to be clearly demonstrated from experiment and data analysis, requiring data of sufficient quality to make this distinction. The technique provides two important pieces of information: 1. The value of KX, the inhibition constant, is unchanged if two inhibitors are only
additive, and is decreased (~ higher inhibitory potency) in the presence of the second inhibitor. Therefore, we have a clear, mechanism-derived definition of synergy on the molecular level.
2. Conversely, the method allows to determine whether two inhibitors bind to the same, or to different sites on an enzyme. This may be an important result for drug development, and is obtained without need of structural data. (Note: strictly speaking, the result only tells whether binding of two inhibitors is mutually exclusive or non-exclusive)
The method has originally been presented for ligand-gated ion channels by Karpen and Hess (Karpen, Aoshima et al. 1982; Karpen and Hess 1986), and subsequently been used for the study of action of multiple inhibitors on ion channels (Karpen, Aoshima et al. 1982; Karpen and Hess 1986; Breitinger, Geetha et al. 2001; Raafat, Breitinger et al. 2010). The basic mechanism presented here is by far not sufficient to describe multimeric enzymes, enzynmes requiring cofactors, and various modes of inhibition. Enzymes may form multimers, binding of one inhibitor may affect binding of other others, and binding sites my overlap. More complex mechanisms of inhibition of Michaelis-Menten enzymes have been discussed, including those of several inhibitors acting on a single enzyme (Palatini 1983). Action of several inhibitors as well as antagonistic interaction of enzyme inhibitors have
www.intechopen.com
Toxicity and Drug Testing
150
been studied (Asante-Appiah and Chan 1996; Schenker and Baici 2009), and a major development in drug interaction analysis was the detailed mathematical treatment of enzyme kinetics and inhibition by Chou and Talalay (Chou 1976; Chou and Talalay 1977; Chou and Talalay 1981; Chou 2006; Chou 2010), covering the mechanistic Michaelis-Menten approach as well as logistic approaches.
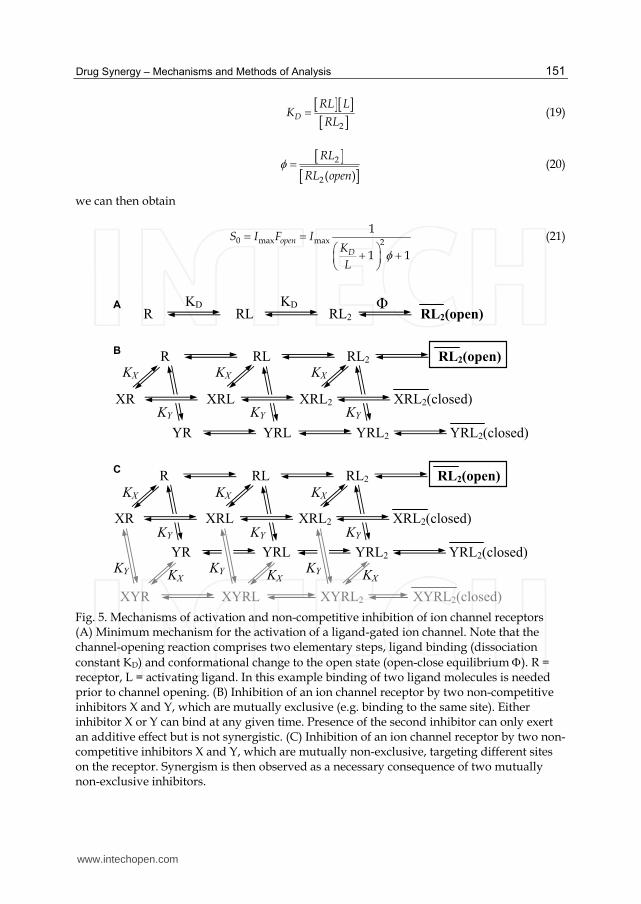
2.3 Ligand-gated ion channel receptors
Ligand-gated ion channels are principal mediators of rapid synaptic transmission between
nerve cells and in the neuromuscular junction. Compared to Michaelis-Menten type
enzymes, their mechanism of activation is more complex, requiring an additional transition
(Hess 1993; Colquhoun 1998). First step of ion channel activation is binding of the activating
ligand (a neurotransmitter), which is governed by the principle of mass action (Hess 1993;
Colquhoun 1998). Usually, more than one ligand molecule is required; depending on
receptor type, models with two or three ligands binding prior to efficient channel opening
have been discussed. Ligand binding induces an conformational change, where the receptor
protein converts from the closed to an open ion-conducting state (Fig. 5A) (Hess 1993;
Colquhoun 1998). Only the passing ions generate an electric signal and this signal can be recorded using patch-clamp techniques. Similar to the ES complex in enzymes, only the liganded receptor can undergo the opening transition. The mechanisms of non-competitive inhibition by two inhibitors binding to the same (Fig. 5B), or different (Fig. 5C) sites have been given. A similar derivation to the one for MM-enzymes can then be made. The signal in this case is not a rate of product formation, but an ionic current, namely the
rate of ion translocation through the open channel. Assuming a constant transmembrane
voltage, and only one conducting state (ie only one channel size, in reality several
conductance levels have been observed for each ion channel receptor).
The observed signal SL would then be:
L L Ch ionS I n J (15)
where IL is the observd current, nCh is the number of open channels, and Jion is the ion
translocation rate. The maximum current signal would be observed if all ion channel were
open at the same time. Fopen, the fraction of open channels, would then be equal to 1 (a
theoretical value only).
max max openS I F (16)
Assuming that only receptors with two bound ligands can undergo the opening transition
(Fig. 5A), we can define the fraction of open channels as
2
2 2
( )
2 ( )open
RL openF
R RL RL RL open (17)
Using the law of mass action, we can define
2D
R LK
RL (18)
www.intechopen.com
Drug Synergy – Mechanisms and Methods of Analysis
151
2
D
RL LK
RL (19)
2
2( )
RL
RL open (20)
we can then obtain
0 max max 2
1
1 1
open
D
S I F IK
L
(21)
Fig. 5. Mechanisms of activation and non-competitive inhibition of ion channel receptors (A) Minimum mechanism for the activation of a ligand-gated ion channel. Note that the channel-opening reaction comprises two elementary steps, ligand binding (dissociation
constant KD) and conformational change to the open state (open-close equilibrium ). R = receptor, L = activating ligand. In this example binding of two ligand molecules is needed prior to channel opening. (B) Inhibition of an ion channel receptor by two non-competitive inhibitors X and Y, which are mutually exclusive (e.g. binding to the same site). Either inhibitor X or Y can bind at any given time. Presence of the second inhibitor can only exert an additive effect but is not synergistic. (C) Inhibition of an ion channel receptor by two non-competitive inhibitors X and Y, which are mutually non-exclusive, targeting different sites on the receptor. Synergism is then observed as a necessary consequence of two mutually non-exclusive inhibitors.
www.intechopen.com
Toxicity and Drug Testing
152
In the presence of one non-competitive inhibitor X, we obtain the following equation for the signal SX:
max 2
1
1 1 1
X
D
X
S IK X
L K
(22)
where KX is the inhibition constant, L is the concentration of activating ligand, and X the concentration of inhibitor. One can now readily compute the ratios of control current signal to signal in presence of inhibitor:
max 2
0
max 2
1
1 1
11
1 1 1
D
X X
D
X
IK
LS X
S KIK X
L K
(23)
In case of two inhibitors binding to the same site (mutually exclusive), the ratio again becomes
0
,
1X Y X Y
S X Y
S K K (24)
For two non-exclusive inhibitors, targeting different sites on the recpetor, this ratio then is
0
,
1 1X Y X Y X
S X Y X
S K K K
(25)
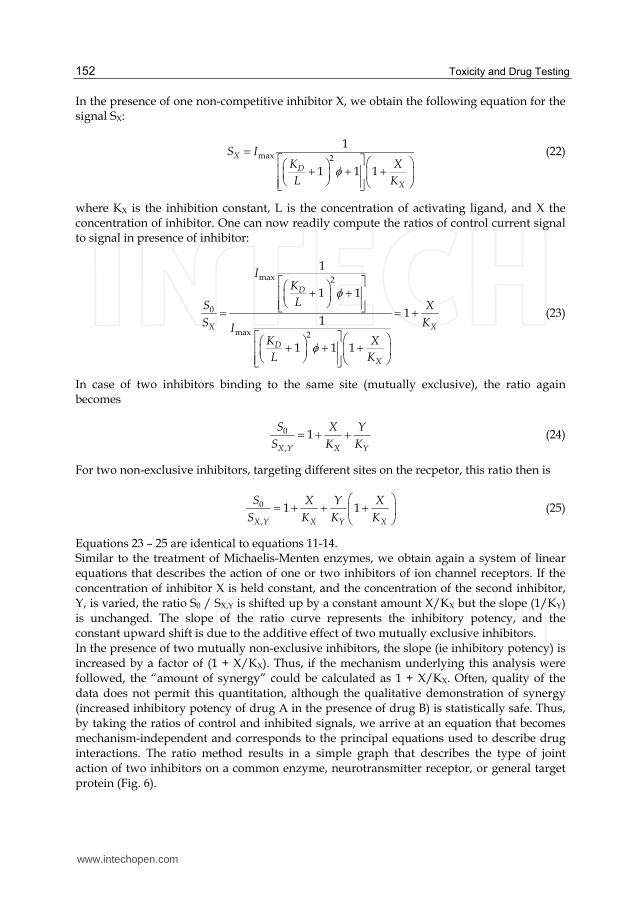
Equations 23 – 25 are identical to equations 11-14. Similar to the treatment of Michaelis-Menten enzymes, we obtain again a system of linear equations that describes the action of one or two inhibitors of ion channel receptors. If the concentration of inhibitor X is held constant, and the concentration of the second inhibitor, Y, is varied, the ratio S0 / SX,Y is shifted up by a constant amount X/KX but the slope (1/KY) is unchanged. The slope of the ratio curve represents the inhibitory potency, and the constant upward shift is due to the additive effect of two mutually exclusive inhibitors. In the presence of two mutually non-exclusive inhibitors, the slope (ie inhibitory potency) is increased by a factor of (1 + X/KX). Thus, if the mechanism underlying this analysis were followed, the “amount of synergy” could be calculated as 1 + X/KX. Often, quality of the data does not permit this quantitation, although the qualitative demonstration of synergy (increased inhibitory potency of drug A in the presence of drug B) is statistically safe. Thus, by taking the ratios of control and inhibited signals, we arrive at an equation that becomes mechanism-independent and corresponds to the principal equations used to describe drug interactions. The ratio method results in a simple graph that describes the type of joint action of two inhibitors on a common enzyme, neurotransmitter receptor, or general target protein (Fig. 6).
www.intechopen.com
Drug Synergy – Mechanisms and Methods of Analysis
153
X + Y
mutually non-exclusive
X + Y
mutually exclusive
SL
SL,X,Y
Y alone
[Inhibitor Y]
Fig. 6. Ratio method graph. Graph of signal ratio S0/SX,Y vs inhibitor concentration for the case of one inhibitor (black curve), two mutually exclusive inhibitors (gray curve), and two mutually non-exclusive inhibitors (light gray curve). In case of mutually non-exclusive binding the inhibitory potency of inhibitor Y is increased in the presence of inhibitor X, as indicated by the lower value of KY computed from the slope of the inhibition ratio curve. Note that the formalism described here becomes mechanism-independent and applies to Michaelis-Menten type enzymes as well as to more complex mechanisms of ion channel receptor inhibition.
So far, a simple description of the action of two inhibitors on a common target has been derived. The mechanisms were based upon (i) a common binding site for two inhibitors, leading to mutually exclusive binding (Fig. 2), or (ii) two independent binding sites, leading to mutually non-exclusive binding (Fig. 3), Indeed, these simple models underlie (i) the principle of Loewe additivity (Loewe 1953; Berenbaum 1989), also referred to “similar”, or “homodynamic” action of drugs. Here, the expectation value for zero interaction is just additivity. Independent inhibitor sites (Fig. 3), in contrast, correspond to Bliss independence, “dissimilar”, “heterodynamic”, or “independent” action of drugs (Bliss 1939; Berenbaum 1989). The combined effect of two such drugs will be more than additive, fulfilling the basic criterion of synergy. It has been recognized that these are the two limiting mechanisms for drug interaction (Bliss 1939; Finney 1942; Plackett and Hewlett 1948), and indeed both models are being used in the literature as zero interaction reference (Greco, Bravo et al. 1995). It is intuitive, and favoured by this author to view the concept of Loewe additivity as the zero interaction reference, and noting the superadditive response from Bliss independence as synergism. This definition is widely accepted (Segel 1975; Chou and Talalay 1977; Berenbaum 1989). Furthermore, it allows for a very intuitive definition of zero interaction, proposed by Loewe: if drug A and B are the same, B being a dilution of A. Naturally, action of “both” drugs would be similar, and thus we have a perfect model of additivity.
www.intechopen.com
Toxicity and Drug Testing
154
However, what happens if we already know that drug A and B have completely different modes of action? Two drugs could be targeting different enzymes in a biochemical pathway. Of such a combination of drugs – having dissimilar action – we would expect superadditive behaviour. Can we call this synergy, or is it just expected from the mechanism and is now our zero reference? Arguments can be found for either view, and both models (and many more) are thus used and debated in the literature. Once we move to more complicated systems, mechanism-based analysis is no longer
feasible, and more general descriptions of drug interaction are needed. However, they all
relate to the basic models of additivity and independence that were described above.
Equation 25 can be rearranged into the form
0
,
1X Y X Y X Y
S X Y X Y
S K K K K (26)
This equation is similar to a general equation that describes describing the joint action of
two drugs on a specific target or biochemical process, presented by Greco et al. (Greco,
Bravo et al. 1995).
1 2 1 2
,1 ,2 ,1 ,2
1 , , ,X X X X
D D D Df p
ID ID ID ID (27)
Here, D1 and D2 are concentrations of drug 1 and 2 in a mixture; IDX,1 and IDX,2 are the
concentrations that produce a certain effect (corresponding to EC50, or IC50 values); is the
synergism/antagonism parameter and p represents additional parameter(s) describing the
“interaction” (joint action) of the two drugs.
The models and derivations given above are indeed the simplest approach to synergism
between drugs. At this time, we do not even have a complete description of the action of
every drug. It has been pointed out that under physiological conditions, it is expected that
indeed presence of a drug will always result in an altered state of metabolism and thereby
affect other drugs (Gessner 1974). In many patients multiple drug regimes have to be given,
and the metabolism of a critically ill person may differ from a healthy “control” volunteer.
Taken together, medical reality is not sufficiently described by simplified models. However,
as shown above, even from simple model cases we can understand mechanisms of synergy
and can derive mechanism-independent formalisms to determine the type of joint action of
drug combinations.
In biomedical modelling, an alternative approach is the use of a mechanism-free description
of activity, such as enzyme activity, ion channel function, the throughput of an entire
biochemical pathway, or even cell survival in toxicity assays. The most common approach is
the use of logistic equations that simply connect concentration of an effector (agonist or
inhibitor) to the measured effect (enzyme activity, product formation, cell survival). The
most comonly used formalism is that of the Hill equation.
0 max
50
1
1n
E EEC
L
(28)
www.intechopen.com
Drug Synergy – Mechanisms and Methods of Analysis
155
Here, E0 is the observed effect, Emax is the maximum signal, EC50 is the concentration of ligand L that produces 50 % of the maximum response, and n is a coefficient defining the steepness of the dose-response curve. The similarity to Michaelis-Menten type enzyme kinetics is obvious, yet the logistic formalism is not based on any mechanism. Indeed, complex clinical situations require use of mechanism-free models to analyze drug interactions (Chou 1976; Berenbaum 1978; Berenbaum 1980; Chou and Talalay 1981; Berenbaum 1989; Tallarida 1992; Greco, Bravo et al. 1995). In the following section some principles and formalisms for the analysis of drug synergism are briefly reviewed. An exhaustive review of all concepts is outside the scope of this text, readers are directed to several excellent, comprehensive reviews (Berenbaum 1989; Greco, Bravo et al. 1995; Tallarida 2001; Chou 2002; Toews and Bylund 2005; Chou 2006; Tallarida 2006; Bijnsdorp, Giovannetti et al. 2011).
3. Mechanisms and techniques of synergy testing in complex biomedical settings
An example, modified from Berenbaum (Berenbaum 1989) is that of a woodcutter, able to cut 10 trees in a day. He is joined by a second woodcutter, also able to cut down 10 trees in a day. Together, they manage to cut 15 trees in one day. How do we describe this situation? One approach is that cutter A achieves 10 trees per day, our expectation value. Addition of cutter B results in 15 trees being cut, so there is synergy. Such an approach has been proposed e.g. by Gaddum, who only considered the effect of one agent and whether it was affected by another one being added (Gaddum 1940). This formalism is not used widely, as it obviously assigns synergism to the effects of several drugs too readily. Conversely, one would say that with two cutters, each able to cut 10 trees per day, the expectation value is 20 trees/day. If only 15 are achieved, they are antagonising each other. This is the application of additivity, and clearly, the combined effect is sub-additive, 20 trees would be just additive, and more than 20 would mean synergy. Mechanistically, one might argue that if cutter A works on a tree, then cutter B would not work on the same tree. Their action would be mutually exclusive, and the additive result would be expected. If, however, they are willing to work at the same tree together, they will be able to cut this tree in a much shorter time. In this case, they would be able to cut more than 20 trees in a day and their action would be mutually non-exclusive, leading to synergy. As stated above, pure mechanistic analysis is not sufficient (and not possible) for most clinical cases, so a general, mechanism-free analysis of drug interaction is needed. Berenbaum (Berenbaum 1989) has pointed out the similarity to non-parametric statistical tests that do not require information about the meaning of the values, or the distribution of populations from where the values originate. The equivalent in dose-response analysis is a logistic equation, that just describes a dose-response curve without any requirement of a mechanism. In such a setting, one would just define the desired outcome (enzyme inhibition, cell death, reduction of virus titer, ...), and then measure the effect achieved by varying doses of each drug alone, and in combination. The mechanisms shown above illustrate just the simplest mechanistic model. In real life, the situation is more complicated, as mechanisms of enzyme or receptor acitivity are more complex. Furthermore medical intervention is not only directed at single proteins, but at entire pathways or controlling structures, such as transcription factors, that initiate or control biochemical processes. Some therapies, such as cancer chemotherapy even aim at
www.intechopen.com

Toxicity and Drug Testing
156
cell destruction, i.e. they interfere with a complete living organism. In most of these situations, mechanisms of action are not known, or are too complex to work with. The additional problem is that with increasing complexity of the biological system, one finds an increasing paucity of experimental data. Even a simple dose-response curve, traditionally recorded with seven sensibly spaced concentration points, carries a significant error. By the rule of parsimony, one has to choose the simplest possible mechanism to describe experimental data. Thus, research is confronted with the dilemma of either oversimplification, or overinterpretation of results – a working compromise between these two extremes is needed. The pertinent models and methods have been extensively analyzed and reviewed in two excellent papers by Berenbaum (Berenbaum 1989), and Greco et al. (Greco, Bravo et al. 1995). Some of the main concepts are just briefly described: - Median effect analysis - Interaction index, isobole method and combination index - Response surface analysis
3.1 Median effect analysis
Chou et al. derived the median effect equation which follows from a detailed derivation of
MM enzyme mechanisms (Chou 1976; Chou and Talalay 1977; Chou and Talalay 1981; Chou
2006).
1
d
d
Ed
M E (29)
where d is the dose of a drug, Ed the effect caused by this amount of drug, M the median
(dose causing 50 % effect, i.e. EC50 or IC50). Indeed, such an equation can be derived by
rearrangement of the Michaelis-Menten equation (6):
0
max
0
max
[ ]
1M
V
VS
VKV
(30)
Here, [S] is the substrate concentration that gives the observed V0, KM is the Michaelis constant, and V0/Vmax is the effect caused by [S], expressed here as the fractional velocity. The median effect equation has been proposed as a central, unified equation from which the basic equation sets of Henderson-Hasselbalch, Scatchard, Hill, and Michaelis-Menten can be derived (Chou 2006; Chou 2010). The median effect equation has been derived from MM-type enzymes from mathematical analysis. It can be extended to multiple-site systems in the form (Chou 2006)
1
nd
d
E d
E M
(31)
where n is the constant giving the slope of the dose-response curve. Note that n has often been equated with the number of binding sites, but this is an oversimplification that should be avoided since it is not valid in most cases. The value of n may be a measure of the degree of cooperativity between binding sites, but nothing more.
www.intechopen.com
Drug Synergy – Mechanisms and Methods of Analysis
157
The equation can also be expressed in the form
n
A
UA
f d
f M
(32)
where fA and fUA are the fractions of affected and unaffected enzyme, respectively. The importance of the median effect equation is that it is composed of ratios of effects (Ed, (1-Ed), or fA and fUA) and of the dose ratio (actual dose d, median dose M). Although derived from mechanistic analysis, the median effect equation cancels out mechanism-specific constants, and just links dose and effect in dimensionless ratios. This makes it a very versatile tool for the analysis of complex systems. The median effect equation can be linearized by taking logarithms on either side, giving the Hill plot (see Berenbaum 1989) which is a straight line for the plot of log(fA/fUA) vs. log d.
log log logA
UA
fn d M
f
(33)
Thus the median effect equations can be seen as an extremely useful rearranged form of dose-response curves, linking ratios of drug doses to ratios of observed effects. The median equation will work with both, mechanism-based (eg Michaelis-Menten), and effect-based (eg logistic) equations, and provides a dimensionless measure for drug effects. The technique has been extensively tested and derived from mechanistic as well as purely mathematical considerations. The group of T.C. Chou have pioneered this field and developed software packages (CompuSyn ands CalcuSyn) that allow reliable testing of drug interaction parameters (Chou 2002; Chou 2006; Chou 2010). Well-founded in theory, the technique has found widespread use (Chou 2002; Chou 2006; Chou 2010; Bijnsdorp, Giovannetti et al. 2011), and the initital paper by Chou and Talalay (Chou and Talalay 1984) has been intensely cited and discussed.
3.2 Interaction index, isobole method and combination index
The interaction of two or more drugs to produce a combined effect can be described by the interaction index I (Berenbaum 1977).
1 2
,1 ,2X X
D DI
ID ID (34)
or written in terms of the median equations above
1 2
1 2
d dI
M M (35)
where, D1 , D2 d1 and d2 are concentrations of drug 1 and 2 that produce a certain effect if applied together; IDX,1 , IDX,2 , M1 and M2 are the concentrations that produce the same effect when given alone. For instance, if we want 50 % inhibition, then equation 34 would be:
1 2
50,1 50,2
D DI
IC IC (36)
www.intechopen.com

Toxicity and Drug Testing
158
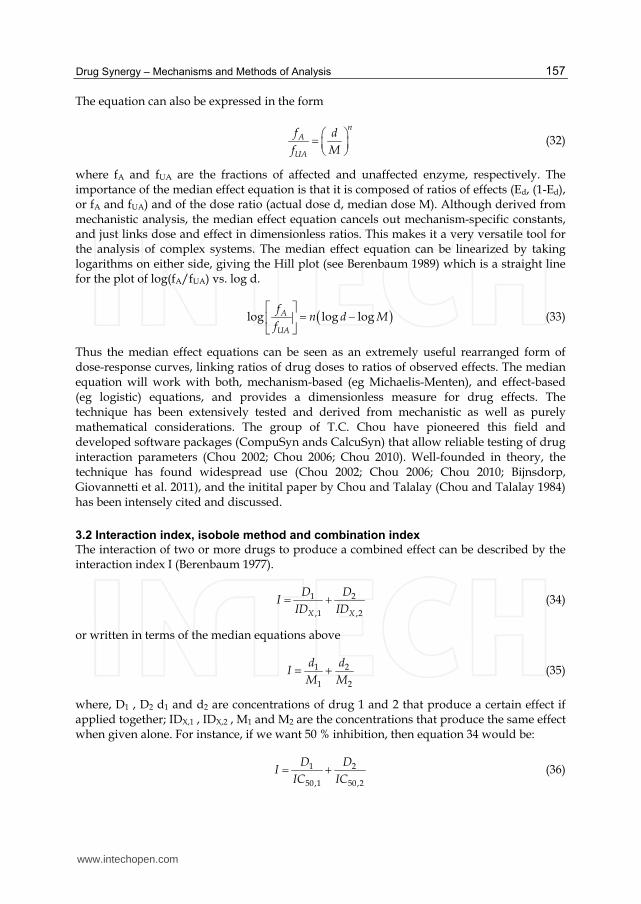
Here, IC50,1 and IC50,2 are the IC50 values of drug 1 and drug 2 alone. D1 and D2 are the doses of drug 1 and 2, respectively, that also produce 50 % inhibition when given together. The interaction index, proposed by Berenbaum (Berenbaum 1977), should be constant in case of zero interaction. The method has been extended by Berenbaum (Berenbaum 1985) and developed into a general method based on analysis of each drug alone and then simulating the combined action of both drugs based on Loewe additivity (see also Greco, Bravo et al. 1995). The interaction index underlies one of the most widely used graphical representations of drug synergism and antagonism, the isobologram. Isoboles were first used by Fraser in 1870 (Fraser 1870; Fraser 1872) as simple, intuitive illustration without mathematical derivation. Here, the doses of drugs A and B give abscissa and ordinate, respectively, and the effect of drug combinations is plotted as graph (Fig. 7). In the example (Fig. 7), the effect plotted is for 50 % inhibition of an enzyme. The effects of each drug alone (i.e. IC50) can be read from the axes. The isobologram shows an effect, such as IC50 (IC10 or IC80, whatever effect is of interest) and which drug concentration is needed to achieve this effect.
Fig. 7. Isobologram. Abscissa and ordinate units are the concentrations of drugs A and B. The solid black line connects concentrations that produce the same effect on the target protein, enzyme, or system. In this example, the IC50 line is given. In the simulation, drug A has an IC50 (concentration giving 50 % inhibition) of 500 a.u. (arbitrary units), IC50 of drug B is 100 a.u. From additivity (black line), the combination of 250 a.u. of A with 50 a.u. of B should also give 50 % inhibition (point A). If, 50 % inhibition are achieved at lower concentrations of the two drugs (e.g. 150 a.u. of A and 40 a.u. of B, point B1), the drugs would show synergism. If the observed inhibition by the combination was less than 50 %, drug A and B would interact in an antagonistic way (point C). Model lines of synergism (gray line) and antagonism (light gray line) are drawn. Note that in case of synergy between two drugs, the IC50 curve would not be a straight line but an upward concave (gray line), in case of antagonism a downward concave (light gray line). In practical application, one
www.intechopen.com
Drug Synergy – Mechanisms and Methods of Analysis
159
would determine IC50 of one drug in the presence of a constant concentration of the other. IC50 would be found with the combination of 250 a.u. of A and 24 a.u. of B (point B2), or 110 a.u. of A and 50 a.u. of B (point B3).
Equations 34 – 36 define straight lines for two drugs that do not show any interaction
(synergism or antagonism). Two drugs showing aditivity wold be expected to fall on the
additivity line (Fig. 7). If the two drugs act synergistically, lower concentrations would be
needed in the mixture to achieve the same effect. Their combination graph would be an
upward concave (gray line in Fig. 7), following the unequality
1 2
,1 ,2
1X X
D D
ID ID (37)
Conversely, two antagonistic drugs would require higher doses in combination to achieve the same effect, and the resulting isobole would be an upward convex line (red line in Fig. 7), of the general (un)equation
1 2
,1 ,2
1X X
D D
ID ID (38)
Representing a form of median effect equationry, isoboles have become a useful tool to present complex modes of drug interaction. An excellent review by Greco et al (Greco, Bravo et al. 1995) derives isoboles as 2-D sections through three-dimensional plots of drug action data. Depending on the shapes of the dose-response curves of both drugs, isoboles do not need to be linear (Greco, Bravo et al. 1995). Also, drug combinations may be biphasic, showing concentration ranges of synergy and ranges of antagonism (Berenbaum 1989). Equations 34 and 35 apply to the case of Loewe additivity, where the two drugs do not show synergy or antagonism. For drugs showing any type of interaction, equation 34 was extended to define a combination index (CI), indicating type and amount of interaction between two (or more) drugs with respect to the experimantal parameter being studied (Chou and Talalay 1983).
1 2
,1 ,2
1 for antagonism
1 for additivity
1 for synergy X X
D DCI
ID ID
(39)
The CI can take values between 1 and infinity for antagonism, and runs between 0 and 1 for synergy. Chou and Chou (1988) have introduced the dose reduction index DRI (Chou and Chou 1988), which is based on the interpretation of the Combination index equation (39). Assuming that two drugs show synergy, one expects that a lower dose of each is needed to achieve the same effect. This lower concentration (D1 and D2 in equations 34-39) can be related to the median (IC50 in equation 36), to give the dose reduction index DRI.
1 2
1 1CI
DRI DRI (40)
Both, combination index CI and DRI can be used to plot drug combination data for
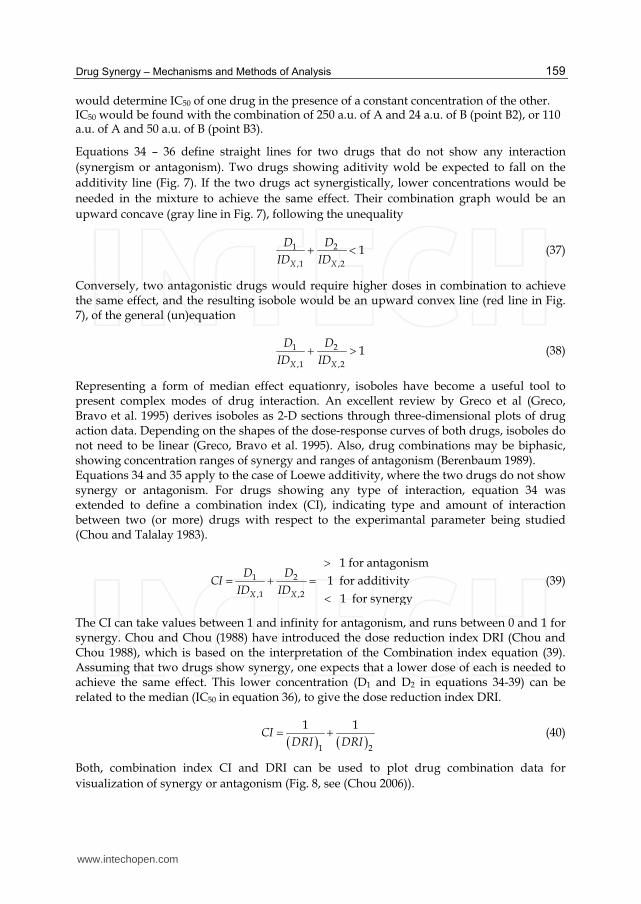
visualization of synergy or antagonism (Fig. 8, see (Chou 2006)).
www.intechopen.com
Toxicity and Drug Testing
160
Fig. 8. Visualization of drug interaction data. (A) CI-fA plot: The combination index CI is plotted versus fA, the fraction of affected enzyme or biological function. (B) DRI plot: the dose reduction index DRI is plotted against fA. See text for definitions of terms.
3.3 Response surface analysis
Response surfaces can be calculated and are a way to represent effects of drug combinations as a contour plot where drug concentrations are plotted as a horizontal x-y- plane, and the effect is plotted on the z axis. Isoboles can be seen as 2D sections through response surfaces, and the method allows graphical analysis of drug interaction data, albeit at requirement of quite some mathematical and computational effort. From the dose-response data of each drug alone, the expected response surface based on the zero interaction reference of choice, is plotted. Then actual drug combination data are entered into the plot, and similar to isobole analysis, deviations from the reference surface indicate synergism or antagonism. The technique has been applied to synergism studies (Tallarida, Stone et al. 1999), and its general use reviewed and commented in great detail (Berenbaum 1989; Greco, Bravo et al. 1995; Tallarida 2001).
3.4 Practical limitations
There is a need for a definition of synergy, antagonism, and the zero case (neither one nor
the other). Sometimes, specific problems are discussed and authors feel compelled to use a
unique treatment of the data. Pharmacologists, stasticians, clinicians, and representatives
from other fields have different views and concepts. In various major reviews, 13 models to
treat drug combination data have been proposed. The author would not encourage
decisions as to right or wrong. Each model may be appropriate for a given situation, and not
applicable to others. However, all models discussing synergy can be traced back to only two
types of the “zero” (no interaction) case as discussed before
- Loewe Additivity Both drugs exert an effect but are mutually exclusive, either one or the other can be active at a given time. This corresponds to a common site of interaction in the simplest mechanistic case (Fig. 2).
- Bliss Independence Both drugs are mutually non-exclusive, both can be active at the same time. In the simplest case, each drug has a specific, independent interaction site (Fig. 3).
A
0,0 0,2 0,4 0,6 0,8 1,00,0
0,5
1,0
1,5
2,0
Synergy
Antagonism
AdditivityCI
fA
B
0,0 0,2 0,4 0,6 0,8 1,00
1
2
3
4
Synergy
Antagonism
Additivity
DRI
fA
www.intechopen.com

Drug Synergy – Mechanisms and Methods of Analysis
161
Indeed all models refer to these two basic cases. Obviously, both have a different expecation
of joint action of two drugs. Loewe additivity is best described by equation 34, and any
deviation from this may be considered as synergy. In case of Bliss independencs, one would
expect both drugs to act independently, and therefore the zero case already includes a more
than additive effect of both drugs. The author sees two problems with this definition: (i) two
purely additive drugs would have to be called antagonistic, including the sham combination
of a drug with itself. (ii) If two mutually non-exclusive drugs already produce a
superadditive effect, and we do not yet call this synergy, how do we define “true” synergy?
In terms of isoboles, the baseline (no synergy, no antagonism) is already curved, in the ratio
method (Fig. 6), the slope of the inhibition curve is increased already for the zero case, and
one calculates a CI of less than one. Thus, to identify synergy, one has to select a gradual
increase. It may be fairly easy to identify a deviation from a straight line (isobole), but for
the CI a deviation from <1 to <<1 is expected. In the ration method, the steepness of th slope
may be hard to compute, as the ratio SX/Scontrol is toe be calculated from small numerical
values and thus carries a large error.
Thus the definition of Loewe additivity is preferred by this author as the definition of no
synergy. As shown in Fig.s 2 and 3, it can clearly be defined in mechanistic term. Dose-
response analysis also follows the definition. Addtivity correctly describes the purest
control experiment, sham mixtures of the same drug, and it follows the general definition
of synergy, where a combination produces more thant the sum of the individual
components.
It should be noted, however, that in many clinical applications, drug combinations are used
that target two completely different target proteins, or pathways. In radiotherapy, the
combination of radiation and drugs work together, and in combination lower doses of either
are required compared to a single treatment. No baseline of Loewe additivity can be
proposed for such a combination. Likewise, combinations of drugs that target completely
different cellular pathways may work synergistically towards cell killing even though the
two drugs are not mutually exclusive in their activity. Obviously, there is no single
methodology that is appropriate for all biomedical situations.
An additional problem in interpreting drug combination data is the quality of the measured
data. Biological systems invariably carry experimental error, and thus borderline cases are
almost impossible to assign. For example, a combination index is calculated to be 0.9 – is this
a real deviation from unity (and thus synergy), or is it experimental error?
Even with the best data, however, analysis of joint action of two drugs has another inherent
problem. Two different drugs may have different dose-response characteristics. In this case,
changes in effective concentrations may suggest synergy where there is none. A principal
illustration of this problem is given in Fig. 9 (adapted from Chou (Chou 2006; Chou 2010)),
showing that the same relative concentration change can produce quite different effects (Fig.
9 A,B). Even for a single compound, there is a marked difference whether one investigates
concentrations below or around EC50, or near saturation. Addition of the same drug in the
concentration range around EC50 (ie the steepest part of the dose-response curve) gives rise
to a strong increase in signal which may be misinterpreted as synergy. The shapes of
isobolograms for drugs with different dose-response characteristics, and the complications
resulting from this fact have been extensively studied (Berenbaum 1989; Greco, Bravo et al.
1995; Tallarida 2001; Chou 2006).
www.intechopen.com
Toxicity and Drug Testing
162
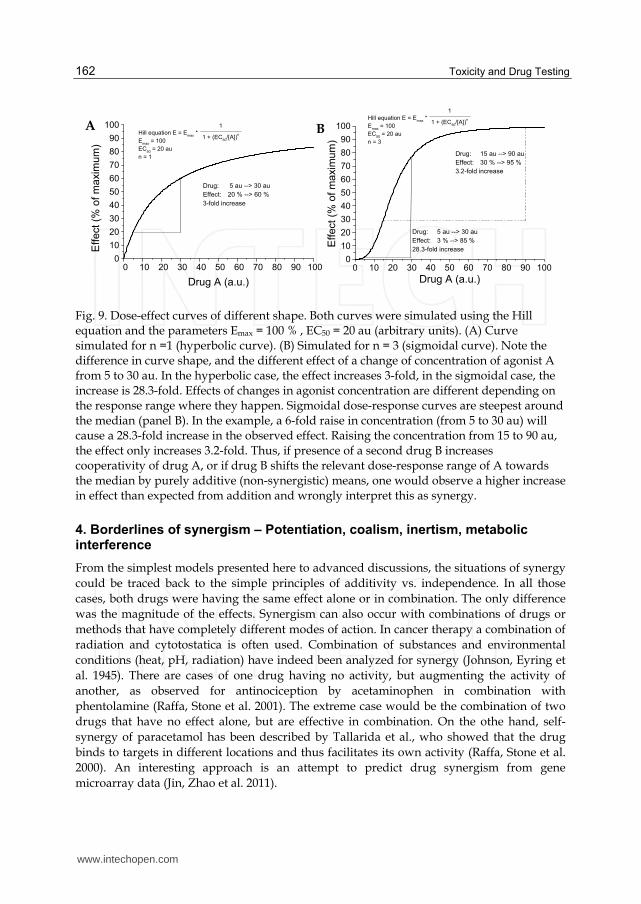
Fig. 9. Dose-effect curves of different shape. Both curves were simulated using the Hill equation and the parameters Emax = 100 % , EC50 = 20 au (arbitrary units). (A) Curve simulated for n =1 (hyperbolic curve). (B) Simulated for n = 3 (sigmoidal curve). Note the difference in curve shape, and the different effect of a change of concentration of agonist A from 5 to 30 au. In the hyperbolic case, the effect increases 3-fold, in the sigmoidal case, the increase is 28.3-fold. Effects of changes in agonist concentration are different depending on the response range where they happen. Sigmoidal dose-response curves are steepest around the median (panel B). In the example, a 6-fold raise in concentration (from 5 to 30 au) will cause a 28.3-fold increase in the observed effect. Raising the concentration from 15 to 90 au, the effect only increases 3.2-fold. Thus, if presence of a second drug B increases cooperativity of drug A, or if drug B shifts the relevant dose-response range of A towards the median by purely additive (non-synergistic) means, one would observe a higher increase in effect than expected from addition and wrongly interpret this as synergy.
4. Borderlines of synergism – Potentiation, coalism, inertism, metabolic interference
From the simplest models presented here to advanced discussions, the situations of synergy
could be traced back to the simple principles of additivity vs. independence. In all those
cases, both drugs were having the same effect alone or in combination. The only difference
was the magnitude of the effects. Synergism can also occur with combinations of drugs or
methods that have completely different modes of action. In cancer therapy a combination of
radiation and cytotostatica is often used. Combination of substances and environmental
conditions (heat, pH, radiation) have indeed been analyzed for synergy (Johnson, Eyring et
al. 1945). There are cases of one drug having no activity, but augmenting the activity of
another, as observed for antinociception by acetaminophen in combination with
phentolamine (Raffa, Stone et al. 2001). The extreme case would be the combination of two
drugs that have no effect alone, but are effective in combination. On the othe hand, self-
synergy of paracetamol has been described by Tallarida et al., who showed that the drug
binds to targets in different locations and thus facilitates its own activity (Raffa, Stone et al.
2000). An interesting approach is an attempt to predict drug synergism from gene
microarray data (Jin, Zhao et al. 2011).
0 10 20 30 40 50 60 70 80 90 1000
10
20
30
40
50
60
70
80
90
100
1 + (EC50
/[A])n
1
Hill equation E = Emax
*
Emax
= 100
EC50
= 20 au
n = 1
Drug: 5 au --> 30 au
Effect: 20 % --> 60 %
3-fold increase
Effect (%
of m
axim
um
)
Drug A (a.u.)
A
0 10 20 30 40 50 60 70 80 90 1000
10
20
30
40
50
60
70
80
90
100
Drug: 15 au --> 90 au
Effect: 30 % --> 95 %
3.2-fold increase
Hill equation E = Emax
*
Emax
= 100
EC50
= 20 au
n = 3
1 + (EC50
/[A])n
1
Drug: 5 au --> 30 au
Effect: 3 % --> 85 %
28.3-fold increase
Eff
ect (%
of
ma
xim
um
)
Drug A (a.u.)
B
www.intechopen.com
Drug Synergy – Mechanisms and Methods of Analysis
163
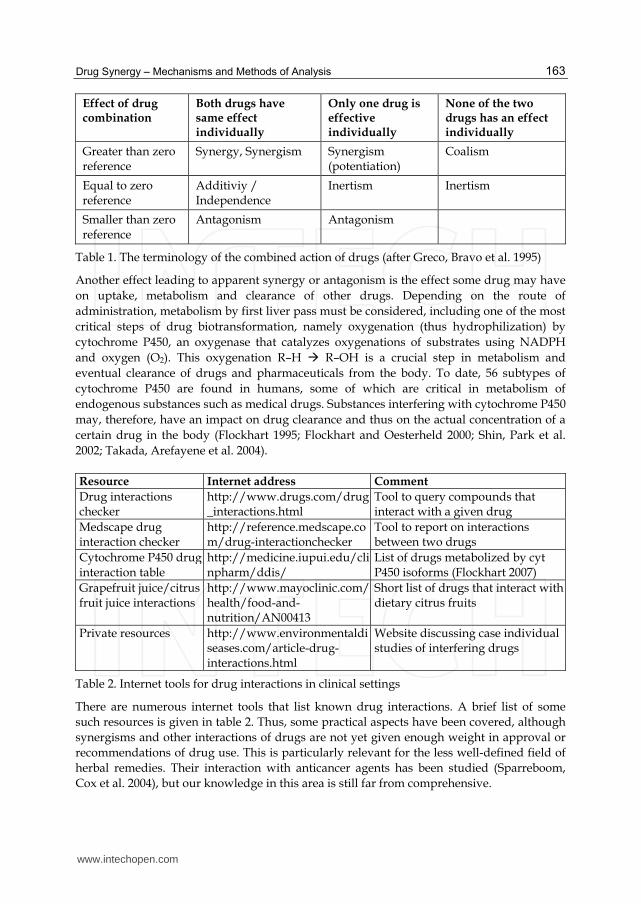
Effect of drug combination
Both drugs have same effect individually
Only one drug is effective individually
None of the two drugs has an effect individually
Greater than zero reference
Synergy, Synergism Synergism (potentiation)
Coalism
Equal to zero reference
Additiviy / Independence
Inertism Inertism
Smaller than zero reference
Antagonism Antagonism
Table 1. The terminology of the combined action of drugs (after Greco, Bravo et al. 1995)
Another effect leading to apparent synergy or antagonism is the effect some drug may have
on uptake, metabolism and clearance of other drugs. Depending on the route of
administration, metabolism by first liver pass must be considered, including one of the most
critical steps of drug biotransformation, namely oxygenation (thus hydrophilization) by
cytochrome P450, an oxygenase that catalyzes oxygenations of substrates using NADPH
and oxygen (O2). This oxygenation R–H R–OH is a crucial step in metabolism and
eventual clearance of drugs and pharmaceuticals from the body. To date, 56 subtypes of
cytochrome P450 are found in humans, some of which are critical in metabolism of
endogenous substances such as medical drugs. Substances interfering with cytochrome P450
may, therefore, have an impact on drug clearance and thus on the actual concentration of a
certain drug in the body (Flockhart 1995; Flockhart and Oesterheld 2000; Shin, Park et al.
2002; Takada, Arefayene et al. 2004).
Resource Internet address Comment
Drug interactions checker
http://www.drugs.com/drug_interactions.html
Tool to query compounds that interact with a given drug
Medscape drug interaction checker
http://reference.medscape.com/drug-interactionchecker
Tool to report on interactions between two drugs
Cytochrome P450 drug interaction table
http://medicine.iupui.edu/clinpharm/ddis/
List of drugs metabolized by cyt P450 isoforms (Flockhart 2007)
Grapefruit juice/citrus fruit juice interactions
http://www.mayoclinic.com/health/food-and-nutrition/AN00413
Short list of drugs that interact with dietary citrus fruits
Private resources http://www.environmentaldiseases.com/article-drug-interactions.html
Website discussing case individual studies of interfering drugs
Table 2. Internet tools for drug interactions in clinical settings
There are numerous internet tools that list known drug interactions. A brief list of some
such resources is given in table 2. Thus, some practical aspects have been covered, although
synergisms and other interactions of drugs are not yet given enough weight in approval or
recommendations of drug use. This is particularly relevant for the less well-defined field of
herbal remedies. Their interaction with anticancer agents has been studied (Sparreboom,
Cox et al. 2004), but our knowledge in this area is still far from comprehensive.
www.intechopen.com
Toxicity and Drug Testing
164
To date, the study of drug interaction in the biomedical field is widespread and must include the following aspects: - mechanism of action of a single drug - mechanisms of action of two (or more) drugs acting on the same physiological target - interaction of two drugs through side effects, secondary targets, etc - effects on metabolism of the primary drug - top-down observations of the performance of drug combinations in patients Going down this list it becomes clear that pure mechanistic studies – although essential – are not sufficient to cover all aspects of drug interaction. Clinical observation is the – equally essential – other end of the spectrum and the gap between these two positions is indeed narrowing.
5. References
Asante-Appiah, E. & W. W. Chan (1996). Analysis of the interactions between an enzyme and multiple inhibitors using combination plots. Biochem J Vol. 320 ( Pt 1), pp. 17-26.
Berenbaum, M. C. (1977). Synergy, additivism and antagonism in immunosuppression. A critical review. Clin Exp Immunol Vol. 28, No. 1, pp. 1-18.
Berenbaum, M. C. (1978). A method for testing for synergy with any number of agents. J Infect Dis Vol. 137, No. 2, pp. 122-130.
Berenbaum, M. C. (1980). Correlations between methods for measurement of synergy. J Infect Dis Vol. 142, No. 3, pp. 476-480.
Berenbaum, M. C. (1985). The expected effect of a combination of agents: the general solution. J Theor Biol Vol. 114, No. 3, pp. 413-431.
Berenbaum, M. C. (1989). What is synergy? Pharmacol Rev Vol. 41, No. 2, pp. 93-141. Bijnsdorp, I. V., E. Giovannetti & G. J. Peters (2011). Analysis of drug interactions. Methods
Mol Biol Vol. 731, No., pp. 421-34. Bliss, C. I. (1939). The toxicity of poisons applied jointly. Ann Appl Biol Vol. 26, pp. 585-615. Breitinger, H.-G., N. Geetha & G. P. Hess (2001). Inhibition of the serotonin 5-HT3 receptor
by nicotine, cocaine, and fluoxetine investigated by rapid chemical kinetic techniques. Biochemistry Vol. 40, No. 28, pp. 8419-8429.
Chou, T. C. (1976). Derivation and properties of Michaelis-Menten type and Hill type equations for reference ligands. J Theor Biol Vol. 59, No. 2, pp. 253-276.
Chou, T. C. (2002). Synergy determination issues. J Virol Vol. 76, No. 20, pp. 10577; author reply 10578
Chou, T. C. (2006). Theoretical basis, experimental design, and computerized simulation of synergism and antagonism in drug combination studies. Pharmacol Rev Vol. 58, No. 3, pp. 621-681.
Chou, T. C. (2010). Drug combination studies and their synergy quantification using the Chou-Talalay method. Cancer Res Vol. 70, No. 2, pp. 440-446.
Chou, T. C. & J. H. Chou (1988). Distinction between multiple ligand exclusivity and competitiveness in receptor binding topology. FASEB J. Vol. 2, pp. A1778.
Chou, T. C. & P. Talalay (1977). A simple generalized equation for the analysis of multiple inhibitions of Michaelis-Menten kinetic systems. J Biol Chem Vol. 252, No. 18, pp. 6438-6442.
www.intechopen.com
Drug Synergy – Mechanisms and Methods of Analysis
165
Chou, T. C. & P. Talalay (1981). Generalized equations for the analysis of inhibitions of Michaelis-Menten and higher-order kinetic systems with two or more mutually exclusive and nonexclusive inhibitors. Eur J Biochem Vol. 115, No. 1, pp. 207-216.
Chou, T. C. & P. Talalay (1983). Analysis of combined drug effects: a new look at a very old problem. Trends Pharmacol Sci Vol. 4, No., pp. 450–454.
Chou, T. C. & P. Talalay (1984). Quantitative analysis of dose-effect relationships: the combined effects of multiple drugs or enzyme inhibitors. Adv Enzyme Regul Vol. 22, No., pp. 27-55.
Colquhoun, D. (1998). Binding, gating, affinity and efficacy: the interpretation of structure-activity relationships for agonists and of the effects of mutating receptors. Br J Pharmacol Vol. 125, No. 5, pp. 924-947.
Finney, D. J. (1942). The analysis of toxicity tests on mixtures of poisons. Ann. App!. Biol. Vol. 29, No., pp. 82-94.
Flockhart, D. A. (1995). Drug interactions and the cytochrome P450 system. The role of cytochrome P450 2C19. Clin Pharmacokinet Vol. 29 Suppl 1, No., pp. 45-52.
Flockhart, D. A. (2007). Drug Interactions: Cytochrome P450 Drug Interaction Table. Indiana University School of Medicine . http://medicine.iupui.edu/clinpharm/ddis/
Flockhart, D. A. & J. R. Oesterheld (2000). Cytochrome P450-mediated drug interactions. Child Adolesc Psychiatr Clin N Am Vol. 9, No. 1, pp. 43-76.
Fraser, T. R. (1870). An experimental research on the antagonism between the actions of physostigma and atropia. Proc. Roy. Soc. Edin. Vol. 7, No., pp. 506-511.
Fraser, T. R. (1872). The antagonism between the actions of active substances. Br. Med. J. Vol. 2, No., pp. 485-487.
Gaddum, J. H. (1940). Pharmacology. Oxford University Press, London. Gessner, P. K. (1974). The isobolographic method applied to drug interactions. In: Drug
Interactions. P. L. Morselli, S. Garattini & S. N. Cohen (Eds), pp. 349-362, Raven Press, New York.
Greco, W. R., G. Bravo & J. C. Parsons (1995). The search for synergy: a critical review from a response surface perspective. Pharmacol Rev Vol. 47, No. 2, pp. 331-385.
Hess, G. P. (1993). Determination of the chemical mechanism of neurotransmitter receptor-mediated reactions by rapid chemical kinetic techniques. Biochemistry Vol. 32, No. 4, pp. 989-1000.
Jin, G., H. Zhao, X. Zhou & S. T. Wong (2011). An enhanced Petri-net model to predict synergistic effects of pairwise drug combinations from gene microarray data. Bioinformatics Vol. 27, No. 13, pp. i310-316.
Johnson, F. H., H. Eyring, R. Steblay, H. Chaplin, C. Huber & G. Gherardi (1945). The Nature and Control of Reactions in Bioluminescence : With Special Reference to the Mechanism of Reversible and Irreversible Inhibitions by Hydrogen and Hydroxyl Ions, Temperature, Pressure, Alcohol, Urethane, and Sulfanilamide in Bacteria. J Gen Physiol Vol. 28, No. 5, pp. 463-537.
Karpen, J. W., H. Aoshima, L. G. Abood & G. P. Hess (1982). Cocaine and phencyclidine inhibition of the acetylcholine receptor: analysis of the mechanisms of action based on measurements of ion flux in the millisecond-to-minute time region. Proc Natl Acad Sci U S A Vol. 79, No. 8, pp. 2509-2513.
Karpen, J. W. & G. P. Hess (1986). Cocaine, phencyclidine, and procaine inhibition of the acetylcholine receptor: characterization of the binding site by stopped-flow
www.intechopen.com
Toxicity and Drug Testing
166
measurements of receptor-controlled ion flux in membrane vesicles. Biochemistry Vol. 25, No. 7, pp. 1777-1785.
Loewe, S. (1953). The problem of synergism and antagonism of combined drugs. Arzneimittelforschung Vol. 3, No. 6, pp. 285-290.
Palatini, P. (1983). The interaction between full and partial inhibitors acting on a single enzyme. A theoretical analysis. Mol Pharmacol Vol. 24, No. 1, pp. 30-41.
Plackett, R. L. & P. S. Hewlett (1948). Statistical aspects of the independent joint action of poisons, particularly insecticides; the toxicity of a mixture of poisons. Ann Appl Biol Vol. 35, No. 3, pp. 347-358.
Raafat, K., U. Breitinger, L. Mahran, N. Ayoub & H. G. Breitinger (2010). Synergistic inhibition of glycinergic transmission in vitro and in vivo by flavonoids and strychnine. Toxicol Sci Vol. 118, No. 1, pp. 171-182.
Raffa, R. B., D. J. Stone, Jr. & R. J. Tallarida (2000). Discovery of "self-synergistic" spinal/supraspinal antinociception produced by acetaminophen (paracetamol). J Pharmacol Exp Ther Vol. 295, No. 1, pp. 291-294.
Raffa, R. B., D. J. Stone, Jr. & R. J. Tallarida (2001). Unexpected and pronounced antinociceptive synergy between spinal acetaminophen (paracetamol) and phentolamine. Eur J Pharmacol Vol. 412, No. 2, pp. R1-2.
Schenker, P. & A. Baici (2009). Simultaneous interaction of enzymes with two modifiers: reappraisal of kinetic models and new paradigms. J Theor Biol Vol. 261, No. 2, pp. 318-329.
Segel, I. H. (1975). Enzyme Kinetics. John Wiley, New York. Shin, J. G., J. Y. Park, M. J. Kim, J. H. Shon, Y. R. Yoon, I. J. Cha, S. S. Lee, S. W. Oh, S. W.
Kim & D. A. Flockhart (2002). Inhibitory effects of tricyclic antidepressants (TCAs) on human cytochrome P450 enzymes in vitro: mechanism of drug interaction between TCAs and phenytoin. Drug Metab Dispos Vol. 30, No. 10, pp. 1102-1107.
Sparreboom, A., M. C. Cox, M. R. Acharya & W. D. Figg (2004). Herbal remedies in the United States: potential adverse interactions with anticancer agents. J Clin Oncol Vol. 22, No. 12, pp. 2489-2503.
Takada, K., M. Arefayene, Z. Desta, C. H. Yarboro, D. T. Boumpas, J. E. Balow, D. A. Flockhart & G. G. Illei (2004). Cytochrome P450 pharmacogenetics as a predictor of toxicity and clinical response to pulse cyclophosphamide in lupus nephritis. Arthritis Rheum Vol. 50, No. 7, pp. 2202-2210.
Tallarida, R. J. (1992). Statistical analysis of drug combinations for synergism. Pain Vol. 49, No. 1, pp. 93-97.
Tallarida, R. J. (2001). Drug synergism: its detection and applications. J Pharmacol Exp Ther Vol. 298, No. 3, pp. 865-872.
Tallarida, R. J. (2006). An overview of drug combination analysis with isobolograms. J Pharmacol Exp Ther Vol. 319, No. 1, pp. 1-7.
Tallarida, R. J., D. J. Stone, Jr., J. D. McCary & R. B. Raffa (1999). Response surface analysis of synergism between morphine and clonidine. J Pharmacol Exp Ther Vol. 289, No. 1, pp. 8-13.
Toews, M. L. & D. B. Bylund (2005). Pharmacologic principles for combination therapy. Proc Am Thorac Soc Vol. 2, No. 4, pp. 282-289; discussion 290-291.
www.intechopen.com

Toxicity and Drug TestingEdited by Prof. Bill Acree
ISBN 978-953-51-0004-1Hard cover, 528 pagesPublisher InTechPublished online 10, February, 2012Published in print edition February, 2012
InTech EuropeUniversity Campus STeP Ri Slavka Krautzeka 83/A 51000 Rijeka, Croatia Phone: +385 (51) 770 447 Fax: +385 (51) 686 166www.intechopen.com
InTech ChinaUnit 405, Office Block, Hotel Equatorial Shanghai No.65, Yan An Road (West), Shanghai, 200040, China
Phone: +86-21-62489820 Fax: +86-21-62489821
Modern drug design and testing involves experimental in vivo and in vitro measurement of the drugcandidate's ADMET (adsorption, distribution, metabolism, elimination and toxicity) properties in the earlystages of drug discovery. Only a small percentage of the proposed drug candidates receive governmentapproval and reach the market place. Unfavorable pharmacokinetic properties, poor bioavailability andefficacy, low solubility, adverse side effects and toxicity concerns account for many of the drug failuresencountered in the pharmaceutical industry. Authors from several countries have contributed chaptersdetailing regulatory policies, pharmaceutical concerns and clinical practices in their respective countries withthe expectation that the open exchange of scientific results and ideas presented in this book will lead toimproved pharmaceutical products.
How to referenceIn order to correctly reference this scholarly work, feel free to copy and paste the following:
Hans-Georg Breitinger (2012). Drug Synergy – Mechanisms and Methods of Analysis, Toxicity and DrugTesting, Prof. Bill Acree (Ed.), ISBN: 978-953-51-0004-1, InTech, Available from:http://www.intechopen.com/books/toxicity-and-drug-testing/drug-synergy-mechanisms-and-methods-of-analysis