10.1.3 option iiia and 10.1.3-2 fig. 10.1.3-3
TRANSCRIPT
Upgrading Feas
ibility Study on the Upper Seti Storage Hydroelectric Project in Nepal
Final Report 10 - 17
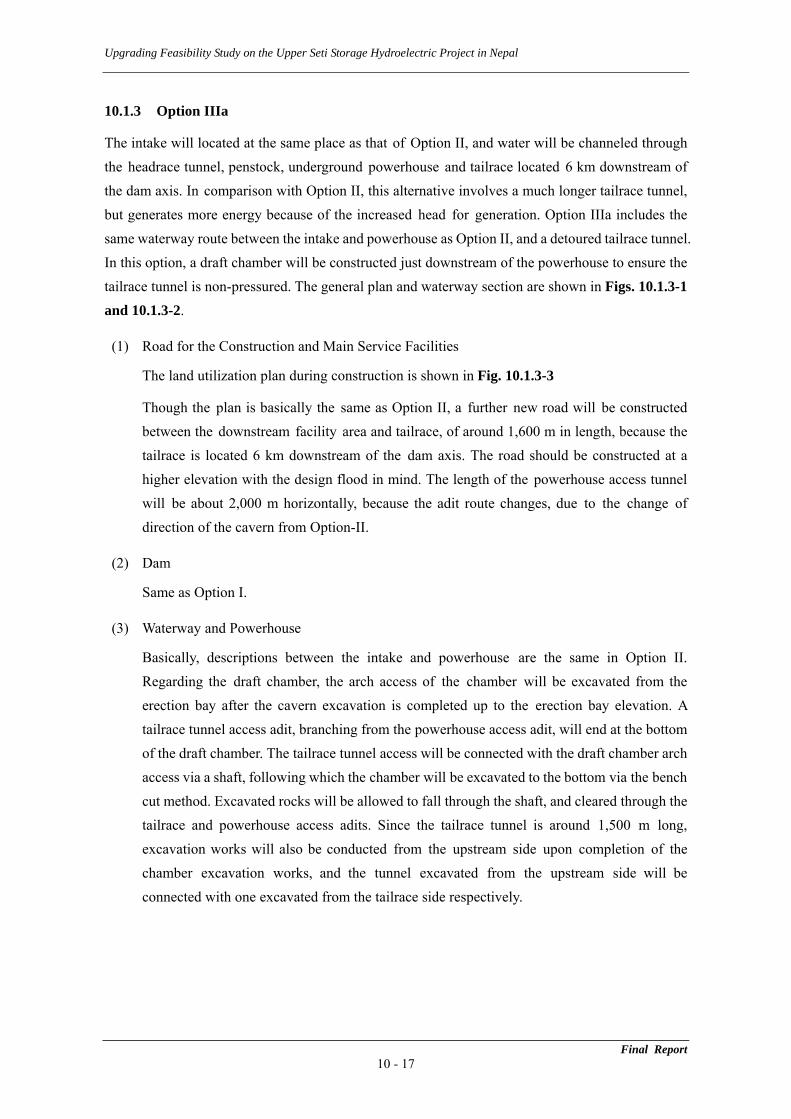
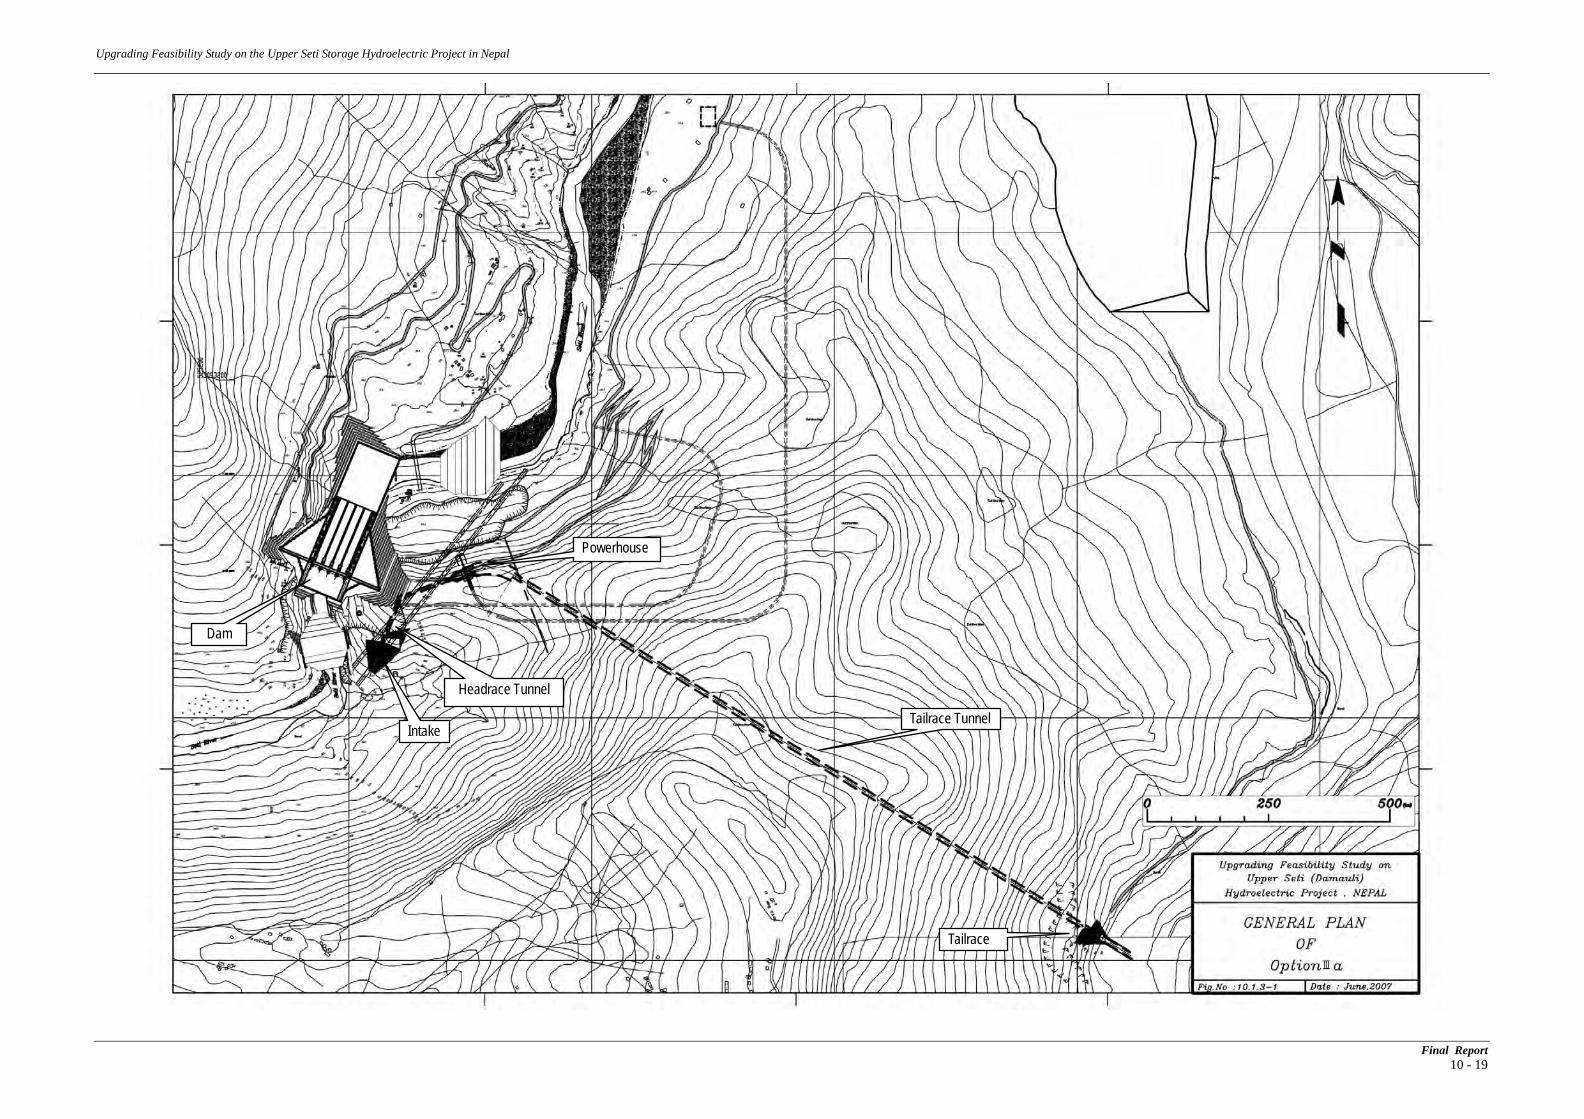
10.1.3 Option IIIa
The intake will located at the same place as that of Option II, and water will be channeled through the headrace tunnel, penstock, underground powerhouse and tailrace located 6 km downstream of the dam axis. In comparison with Option II, this alternative involves a much longer tailrace tunnel, but generates more energy because of the increased head for generation. Option IIIa includes the same waterway route between the intake and powerhouse as Option II, and a detoured tailrace tunnel. In this option, a draft chamber will be constructed just downstream of the powerhouse to ensure the tailrace tunnel is non-pressured. The general plan and waterway section are shown in Figs. 10.1.3-1 and 10.1.3-2.
(1) Road for the Construction and Main Service Facilities
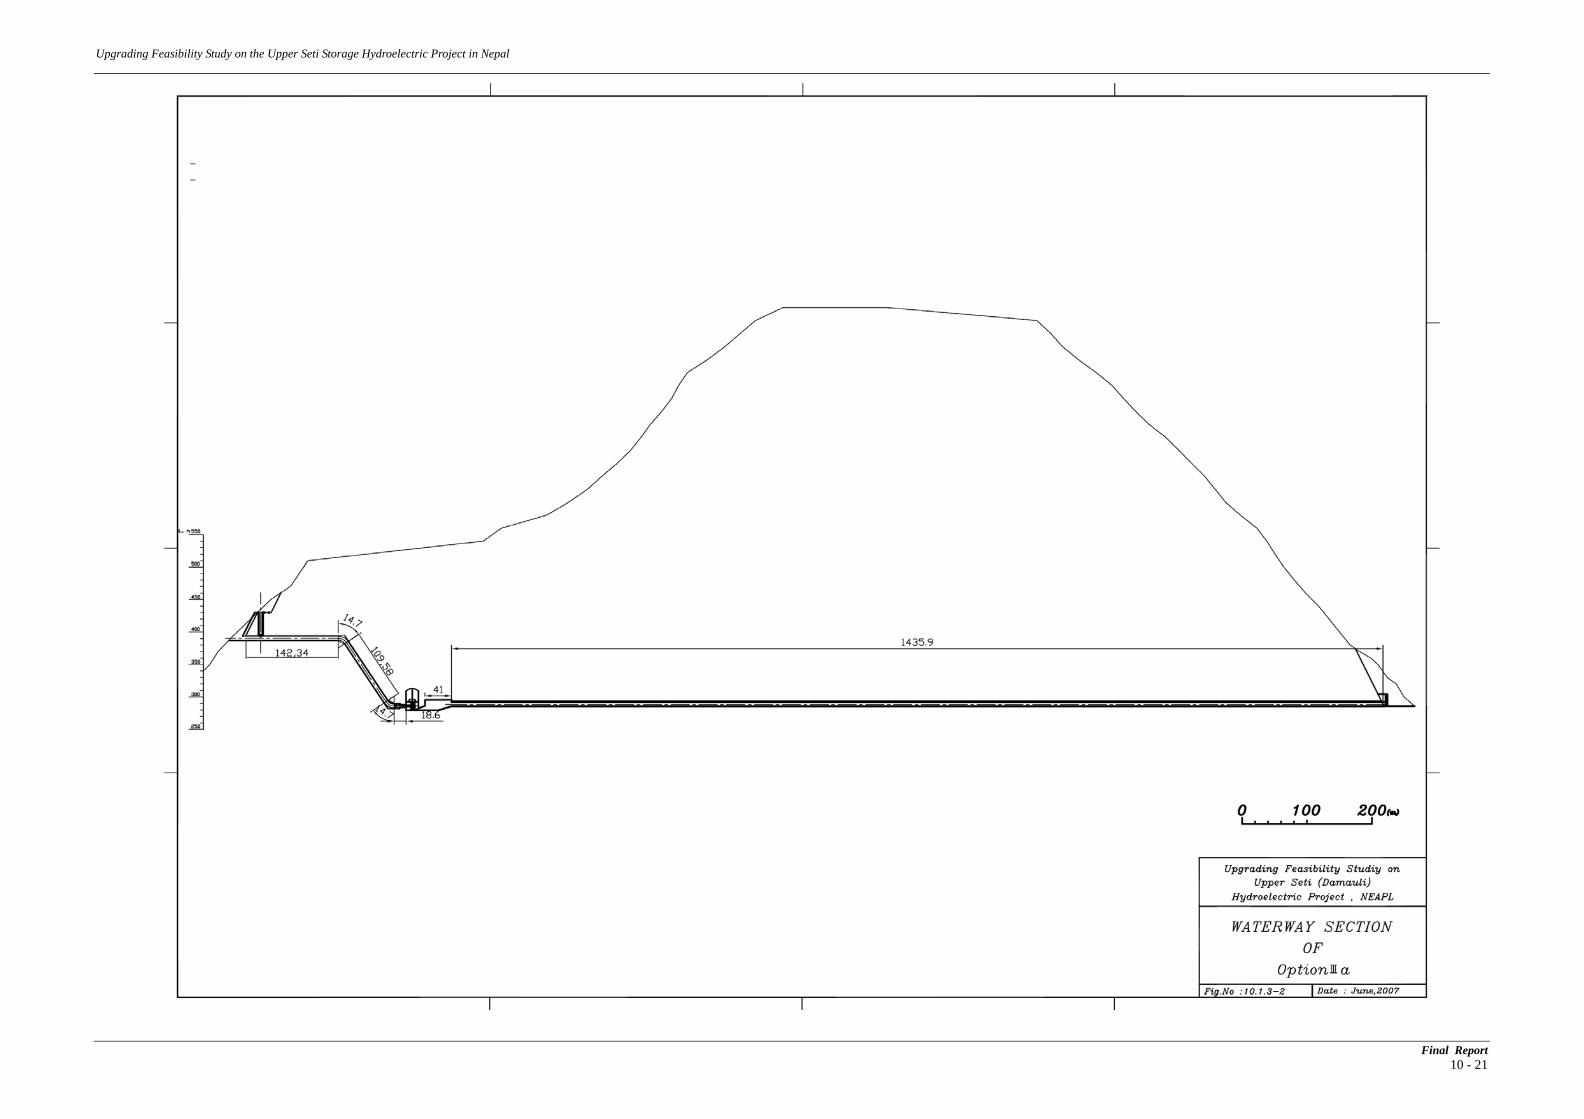
The land utilization plan during construction is shown in Fig. 10.1.3-3
Though the plan is basically the same as Option II, a further new road will be constructed between the downstream facility area and tailrace, of around 1,600 m in length, because the tailrace is located 6 km downstream of the dam axis. The road should be constructed at a higher elevation with the design flood in mind. The length of the powerhouse access tunnel will be about 2,000 m horizontally, because the adit route changes, due to the change of direction of the cavern from Option-II.
(2) Dam
Same as Option I.
(3) Waterway and Powerhouse
Basically, descriptions between the intake and powerhouse are the same in Option II. Regarding the draft chamber, the arch access of the chamber will be excavated from the erection bay after the cavern excavation is completed up to the erection bay elevation. A tailrace tunnel access adit, branching from the powerhouse access adit, will end at the bottom of the draft chamber. The tailrace tunnel access will be connected with the draft chamber arch access via a shaft, following which the chamber will be excavated to the bottom via the bench cut method. Excavated rocks will be allowed to fall through the shaft, and cleared through the tailrace and powerhouse access adits. Since the tailrace tunnel is around 1,500 m long, excavation works will also be conducted from the upstream side upon completion of the chamber excavation works, and the tunnel excavated from the upstream side will be connected with one excavated from the tailrace side respectively.
Upgrading Feasibility Study on the Upper Seti Storage Hydroelectric Project in Nepal
Final Report 10 - 19
Fig. 10.1.3-1 General Plan of Option IIIa
Dam
Intake
Headrace Tunnel
Powerhouse
Tailrace Tunnel
Tailrace
Upgrading Feasibility Study on the Upper Seti Storage Hydroelectric Project in Nepal
Final Report 10 - 21
Fig. 10.1.3-2 Waterway Section of Option IIIa
Upgrading Feasibility Study on the Upper Seti Storage Hydroelectric Project in Nepal
Final Report 10 - 23
Fig. 10.1.3-3 Land Utilization Plan of Option IIIa
Access Road (Improved)
Bridge No.2
Dam Left-abutment Access road (Newly constructed) Bridge No.1
Dam Right-embankment Access road
(Newly constructed)
Powerhouse Access Adit
Penstock Installation Adit
Switchyard
Service Road (Newly constructed)
Tailrace Access road Tailrace
Tailrace Tunnel
Batching Plant Crushing Plant
Spoil Bank Penstock yard Motor Pool Engineers’ Camp Site Camp and etc.
Upgrading Feasibility Study on the Upper Seti Storage Hydroelectric Project in Nepal
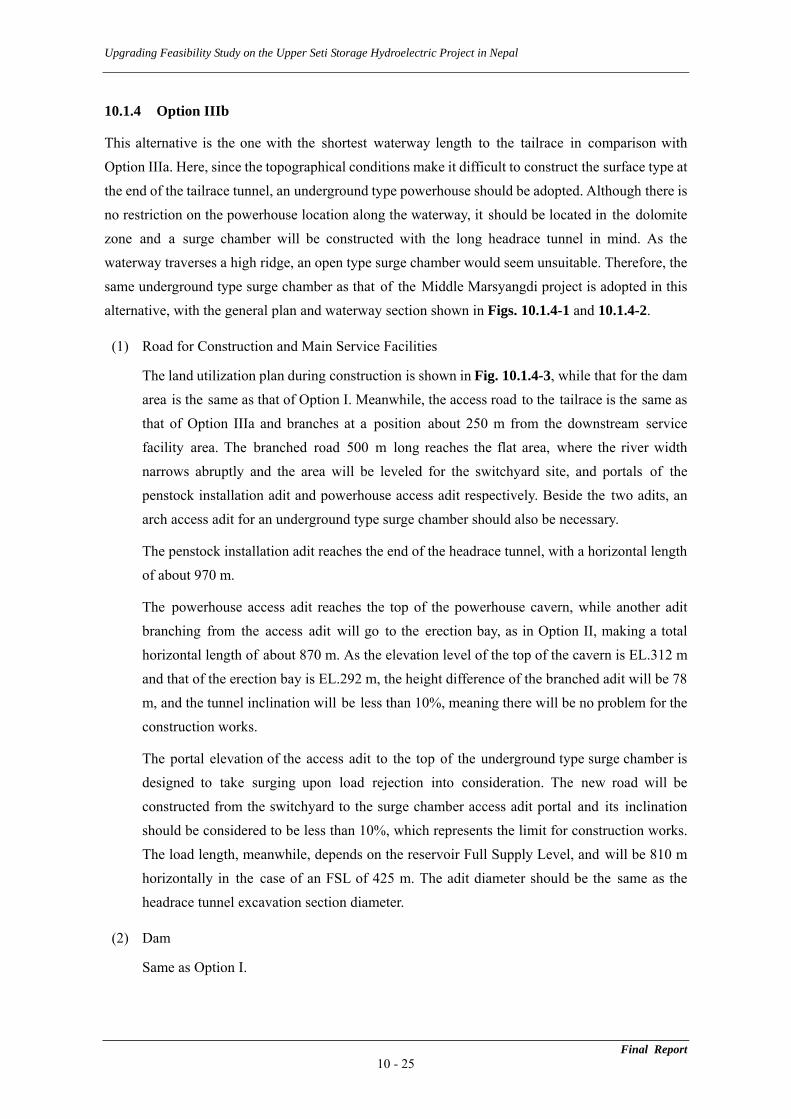
10.1.4 Option IIIb
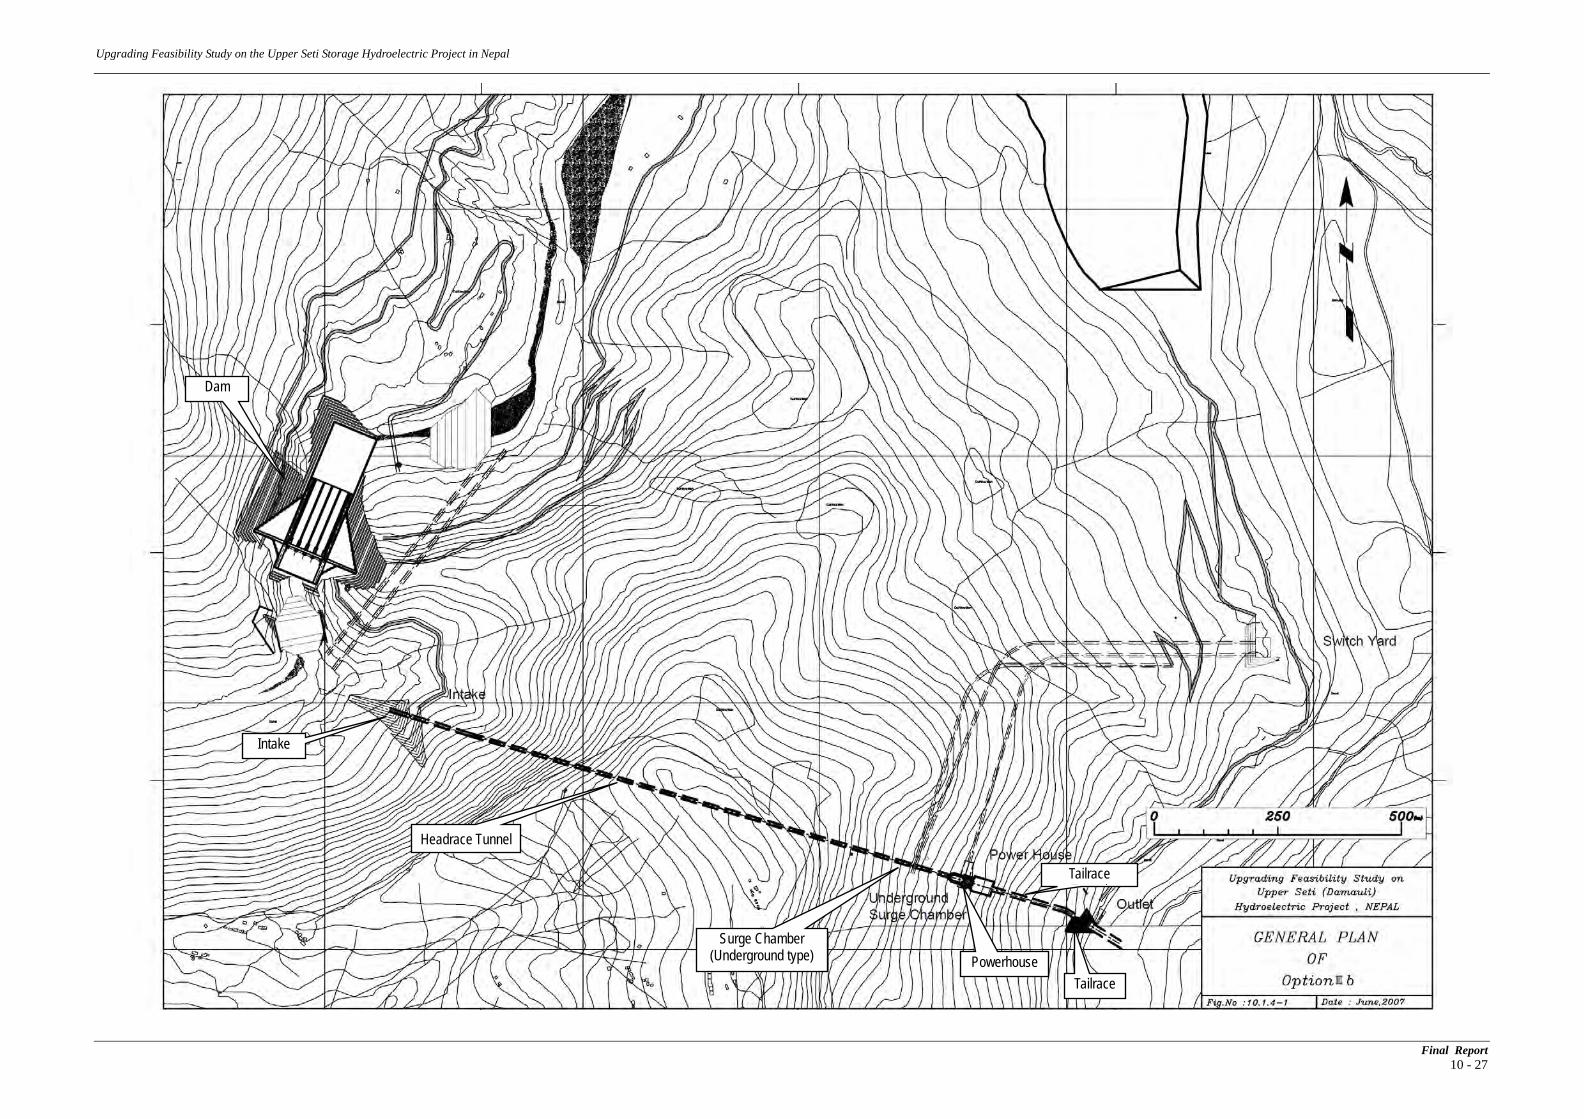
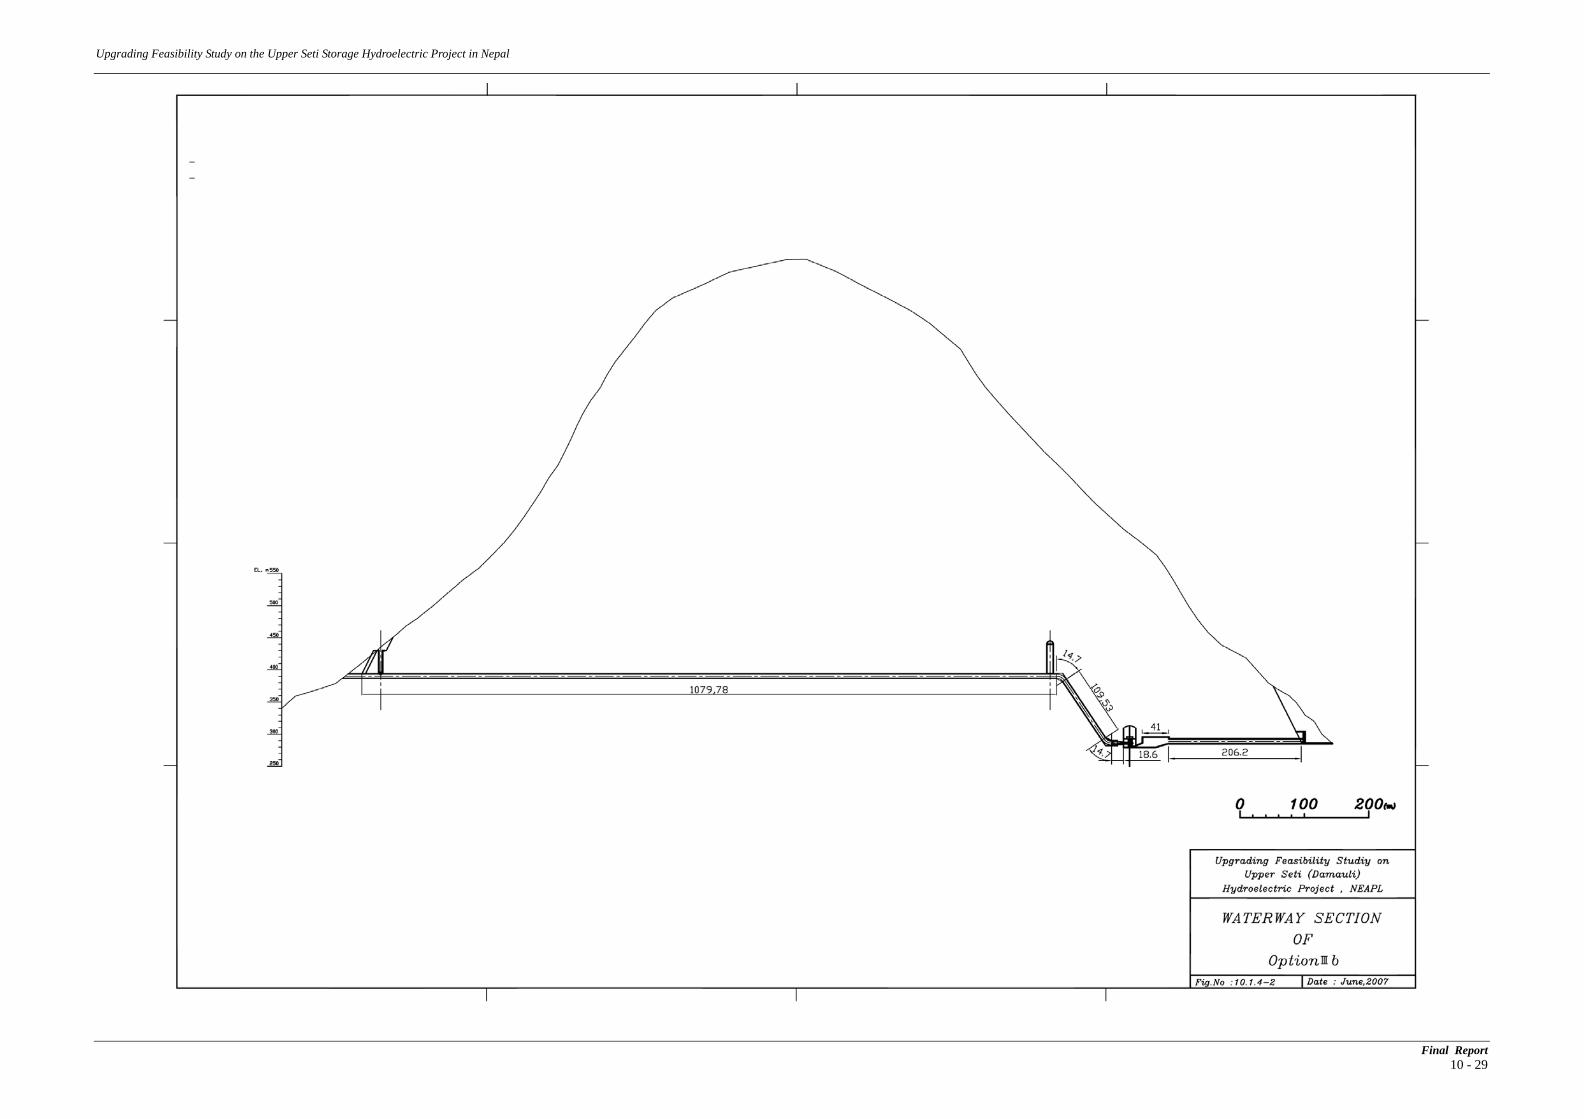
This alternative is the one with the shortest waterway length to the tailrace in comparison with Option IIIa. Here, since the topographical conditions make it difficult to construct the surface type at the end of the tailrace tunnel, an underground type powerhouse should be adopted. Although there is no restriction on the powerhouse location along the waterway, it should be located in the dolomite zone and a surge chamber will be constructed with the long headrace tunnel in mind. As the waterway traverses a high ridge, an open type surge chamber would seem unsuitable. Therefore, the same underground type surge chamber as that of the Middle Marsyangdi project is adopted in this alternative, with the general plan and waterway section shown in Figs. 10.1.4-1 and 10.1.4-2.
(1) Road for Construction and Main Service Facilities
The land utilization plan during construction is shown in Fig. 10.1.4-3, while that for the dam area is the same as that of Option I. Meanwhile, the access road to the tailrace is the same as that of Option IIIa and branches at a position about 250 m from the downstream service facility area. The branched road 500 m long reaches the flat area, where the river width narrows abruptly and the area will be leveled for the switchyard site, and portals of the penstock installation adit and powerhouse access adit respectively. Beside the two adits, an arch access adit for an underground type surge chamber should also be necessary.
The penstock installation adit reaches the end of the headrace tunnel, with a horizontal length of about 970 m.
The powerhouse access adit reaches the top of the powerhouse cavern, while another adit branching from the access adit will go to the erection bay, as in Option II, making a total horizontal length of about 870 m. As the elevation level of the top of the cavern is EL.312 m and that of the erection bay is EL.292 m, the height difference of the branched adit will be 78 m, and the tunnel inclination will be less than 10%, meaning there will be no problem for the construction works.
The portal elevation of the access adit to the top of the underground type surge chamber is designed to take surging upon load rejection into consideration. The new road will be constructed from the switchyard to the surge chamber access adit portal and its inclination should be considered to be less than 10%, which represents the limit for construction works. The load length, meanwhile, depends on the reservoir Full Supply Level, and will be 810 m horizontally in the case of an FSL of 425 m. The adit diameter should be the same as the headrace tunnel excavation section diameter.
(2) Dam
Same as Option I.
Final Report 10 - 25
Upgrading Feas
ibility Study on the Upper Seti Storage Hydroelectric Project in Nepal
Final Report 10 - 26
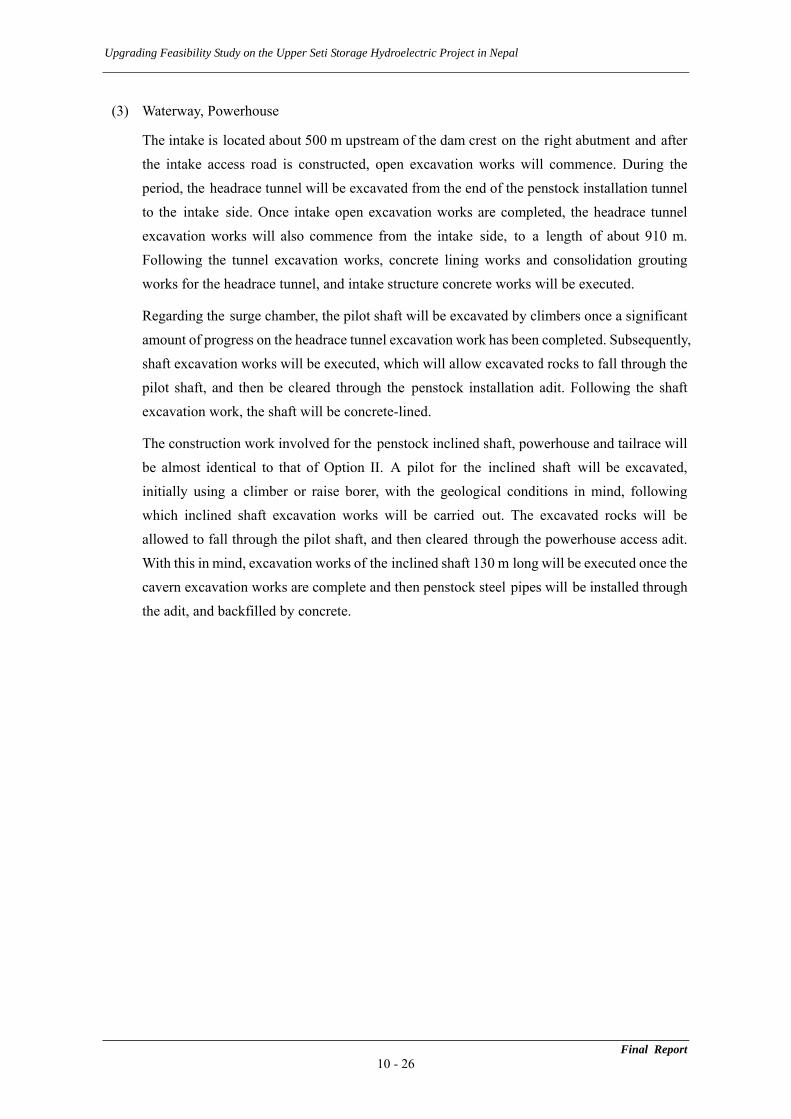
(3) Waterway, Powerhouse
The intake is located about 500 m upstream of the dam crest on the right abutment and after the intake access road is constructed, open excavation works will commence. During the period, the headrace tunnel will be excavated from the end of the penstock installation tunnel to the intake side. Once intake open excavation works are completed, the headrace tunnel excavation works will also commence from the intake side, to a length of about 910 m. Following the tunnel excavation works, concrete lining works and consolidation grouting works for the headrace tunnel, and intake structure concrete works will be executed.
Regarding the surge chamber, the pilot shaft will be excavated by climbers once a significant amount of progress on the headrace tunnel excavation work has been completed. Subsequently, shaft excavation works will be executed, which will allow excavated rocks to fall through the pilot shaft, and then be cleared through the penstock installation adit. Following the shaft excavation work, the shaft will be concrete-lined.
The construction work involved for the penstock inclined shaft, powerhouse and tailrace will be almost identical to that of Option II. A pilot for the inclined shaft will be excavated, initially using a climber or raise borer, with the geological conditions in mind, following which inclined shaft excavation works will be carried out. The excavated rocks will be allowed to fall through the pilot shaft, and then cleared through the powerhouse access adit. With this in mind, excavation works of the inclined shaft 130 m long will be executed once the cavern excavation works are complete and then penstock steel pipes will be installed through the adit, and backfilled by concrete.
Upgrading Feasibility Study on the Upper Seti Storage Hydroelectric Project in Nepal
Final Report 10 - 27
Fig. 10.1.4-1 General Plan of Option IIIb
Dam
Intake
Headrace Tunnel
Surge Chamber (Underground type) Powerhouse
Tailrace
Tailrace T l
Upgrading Feasibility Study on the Upper Seti Storage Hydroelectric Project in Nepal
Final Report 10 - 29
Fig. 10.1.4-2 Waterway Section of Option IIIb
Upgrading Feasibility Study on the Upper Seti Storage Hydroelectric Project in Nepal
Final Report 10 - 31
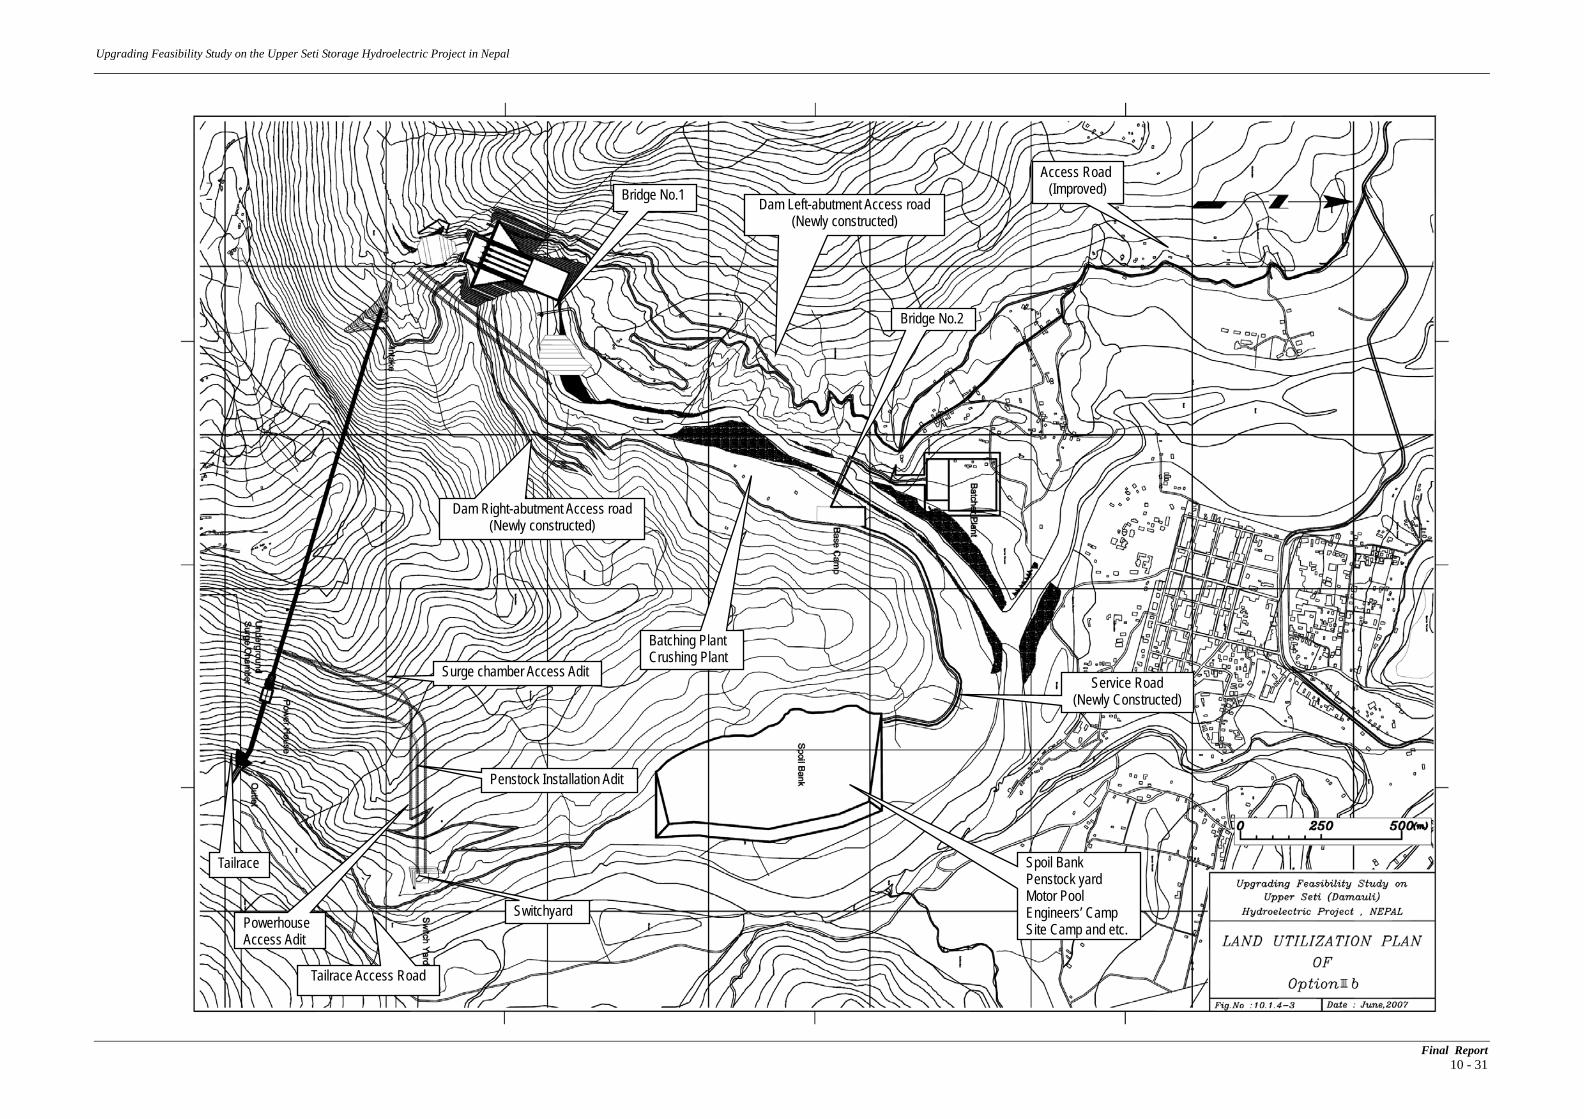
Fig. 10.1.4-3 Land Utilization Plan of Option IIIb
Access Road (Improved)
Dam Left-abutment Access road (Newly constructed)
Bridge No.1
Dam Right-abutment Access road (Newly constructed)
Bridge No.2
Service Road (Newly Constructed)
Tailrace Access Road
Tailrace
Switchyard
Penstock Installation Adit
Surge chamber Access Adit
Powerhouse Access Adit
Batching Plant Crushing Plant
Spoil Bank Penstock yard Motor Pool Engineers’ Camp Site Camp and etc.
Upgrading Feas
ibility Study on the Upper Seti Storage Hydroelectric Project in Nepal
Final Report 10 - 33
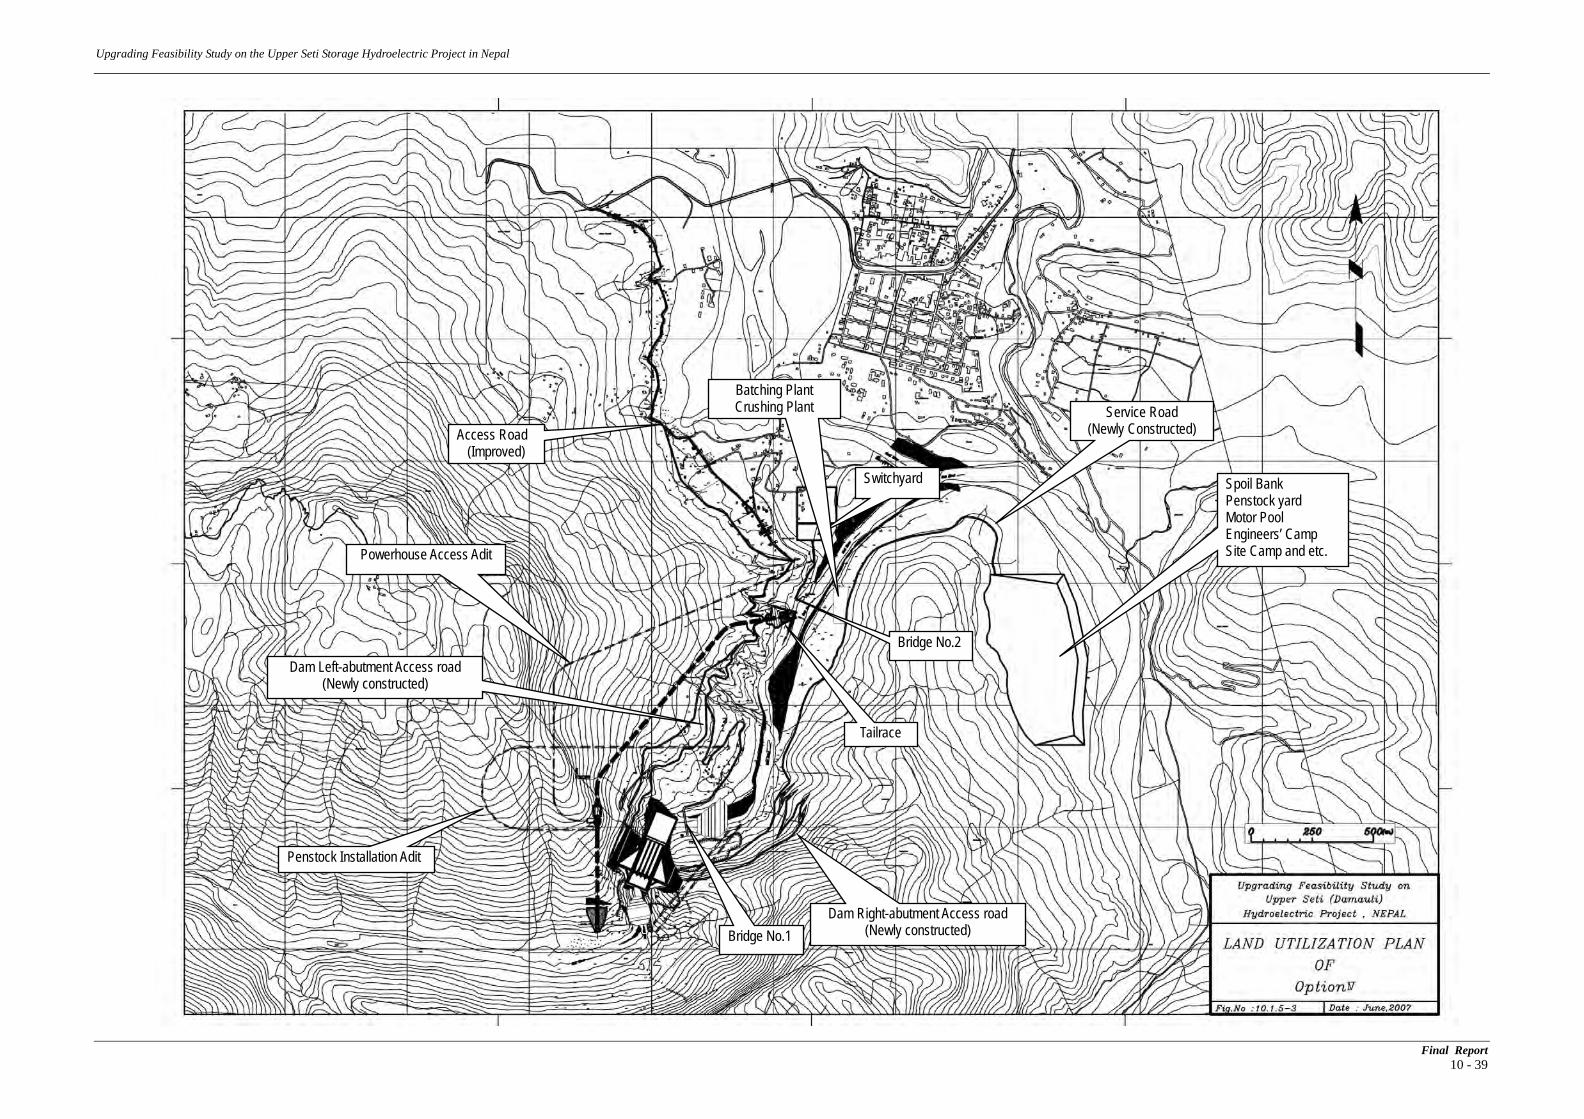
10.1.5 Option IV
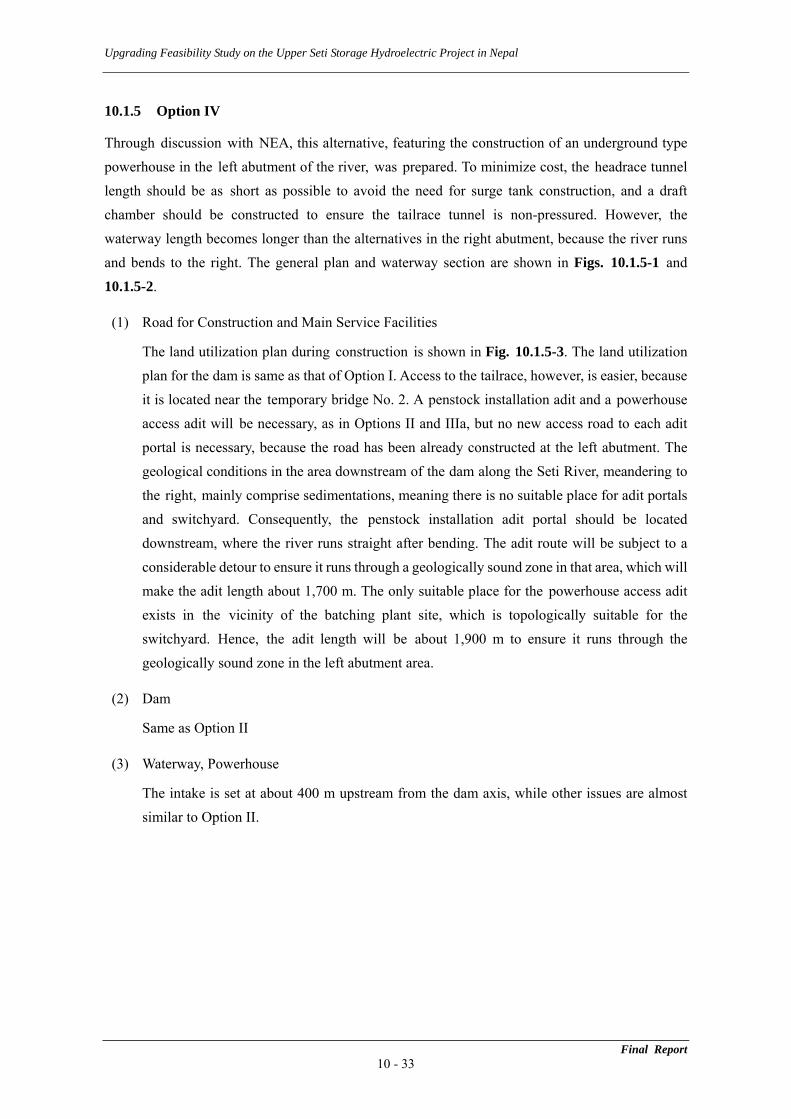
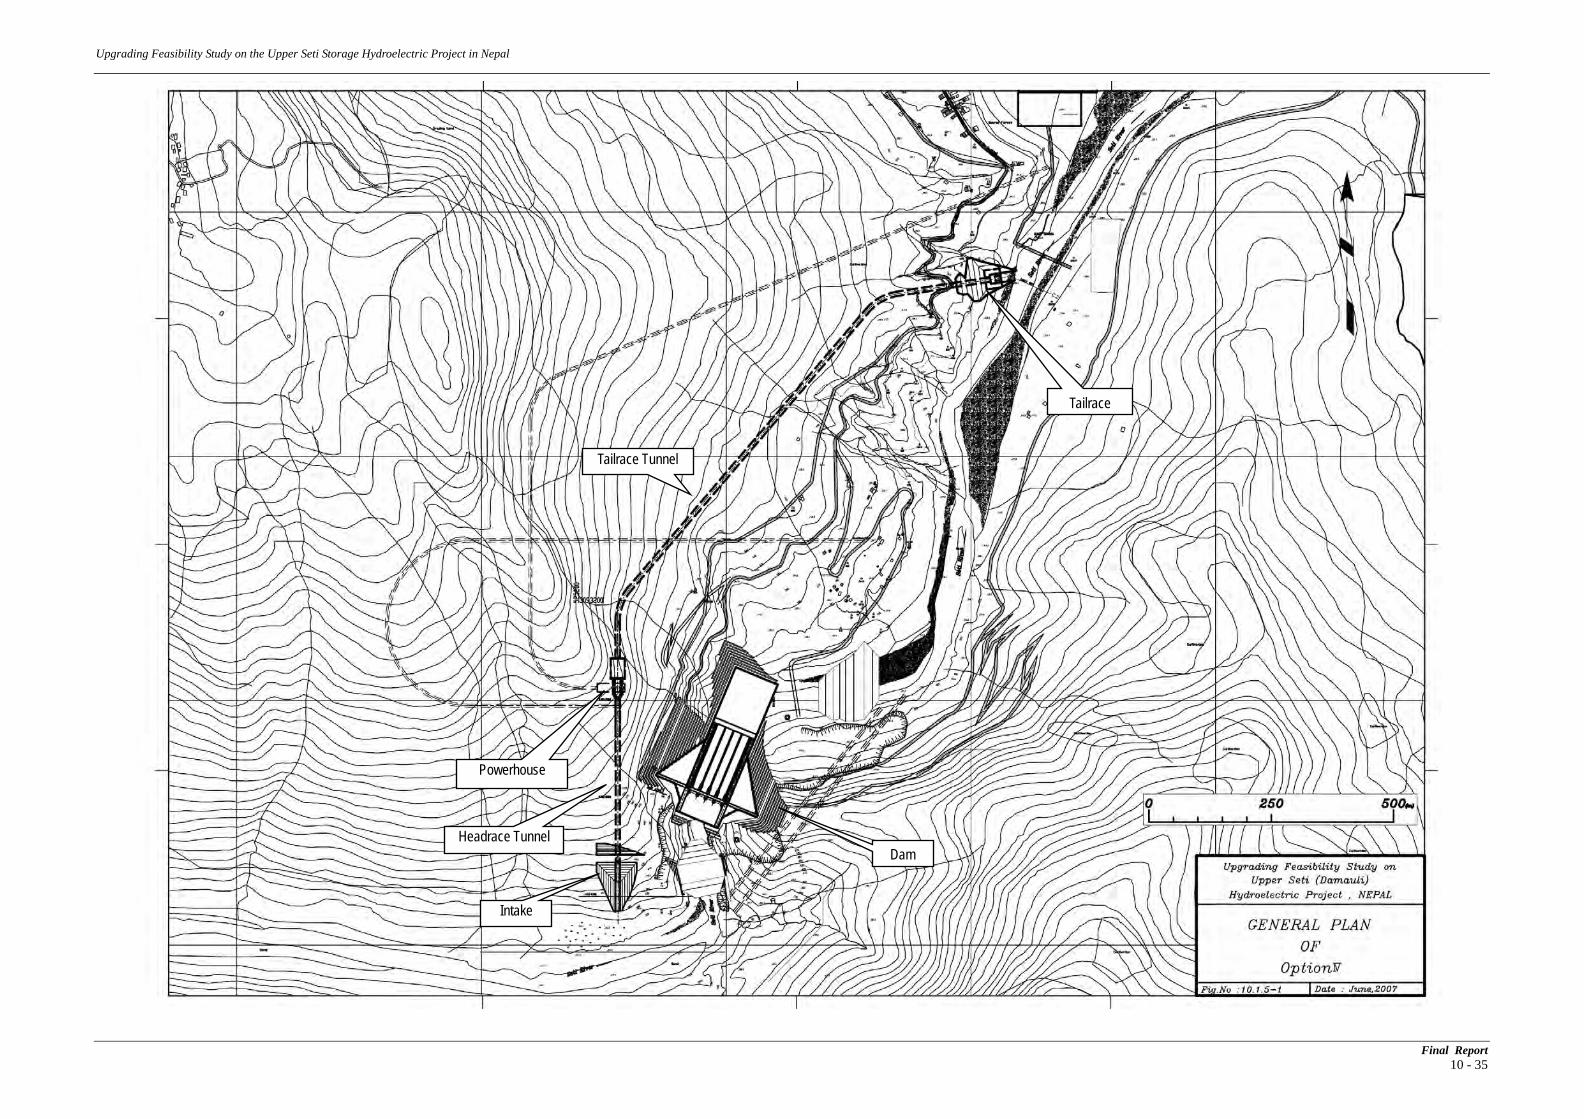
Through discussion with NEA, this alternative, featuring the construction of an underground type powerhouse in the left abutment of the river, was prepared. To minimize cost, the headrace tunnel length should be as short as possible to avoid the need for surge tank construction, and a draft chamber should be constructed to ensure the tailrace tunnel is non-pressured. However, the waterway length becomes longer than the alternatives in the right abutment, because the river runs and bends to the right. The general plan and waterway section are shown in Figs. 10.1.5-1 and 10.1.5-2.
(1) Road for Construction and Main Service Facilities
The land utilization plan during construction is shown in Fig. 10.1.5-3. The land utilization plan for the dam is same as that of Option I. Access to the tailrace, however, is easier, because it is located near the temporary bridge No. 2. A penstock installation adit and a powerhouse access adit will be necessary, as in Options II and IIIa, but no new access road to each adit portal is necessary, because the road has been already constructed at the left abutment. The geological conditions in the area downstream of the dam along the Seti River, meandering to the right, mainly comprise sedimentations, meaning there is no suitable place for adit portals and switchyard. Consequently, the penstock installation adit portal should be located downstream, where the river runs straight after bending. The adit route will be subject to a considerable detour to ensure it runs through a geologically sound zone in that area, which will make the adit length about 1,700 m. The only suitable place for the powerhouse access adit exists in the vicinity of the batching plant site, which is topologically suitable for the switchyard. Hence, the adit length will be about 1,900 m to ensure it runs through the geologically sound zone in the left abutment area.
(2) Dam
Same as Option II
(3) Waterway, Powerhouse
The intake is set at about 400 m upstream from the dam axis, while other issues are almost similar to Option II.
Upgrading Feasibility Study on the Upper Seti Storage Hydroelectric Project in Nepal
Final Report 10 - 35
Fig. 10.1.5-1 General Plan of Option IV
Intake
Headrace Tunnel
Powerhouse
Tailrace Tunnel
Tailrace
Dam
Upgrading Feasibility Study on the Upper Seti Storage Hydroelectric Project in Nepal
Final Report 10 - 37
Fig. 10.1.5-2 Waterway Section of Option IV
Upgrading Feasibility Study on the Upper Seti Storage Hydroelectric Project in Nepal
Final Report 10 - 39
Fig. 10.1.5-3 Land Utilization Plan of Option IV
Access Road (Improved)
Dam Left-abutment Access road (Newly constructed)
Bridge No.1 Dam Right-abutment Access road
(Newly constructed)
Bridge No.2
Service Road (Newly Constructed)
Tailrace
Switchyard
Penstock Installation Adit
Powerhouse Access Adit
Batching Plant Crushing Plant
Spoil Bank Penstock yard Motor Pool Engineers’ Camp Site Camp and etc.
Upgrading Feasibility Study on the Upper Seti Storage Hydroelectric Project in Nepal
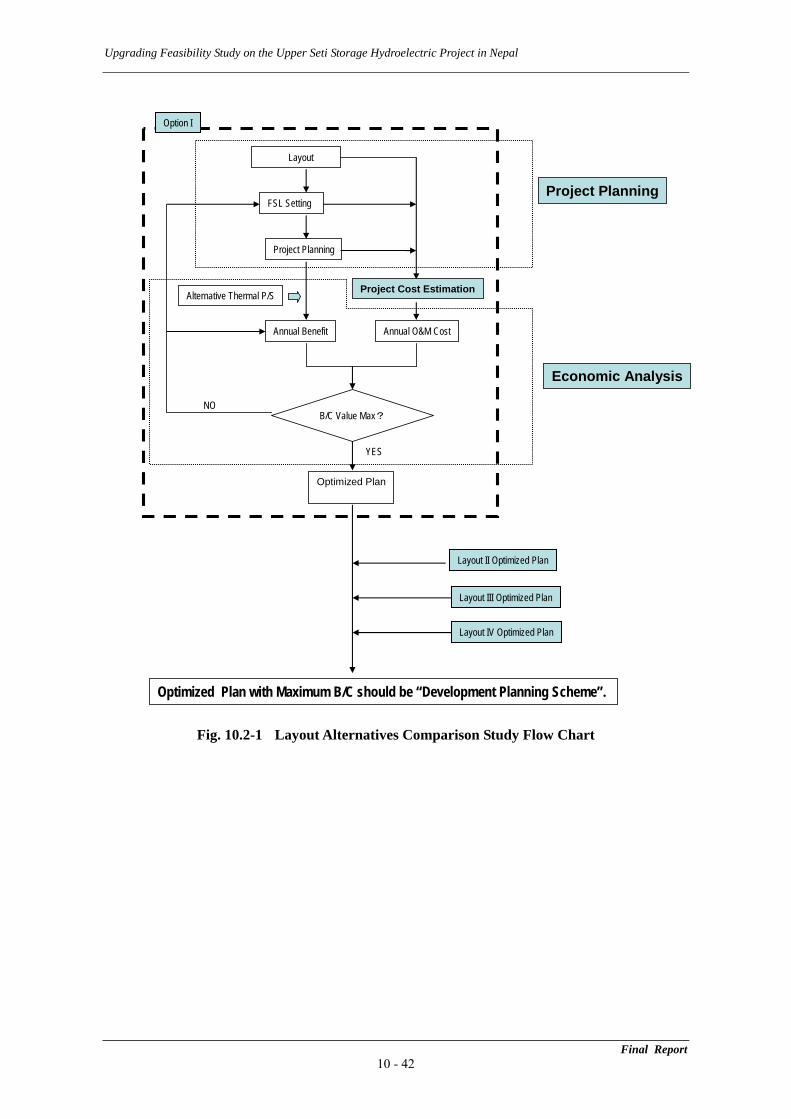
10.2 Comparative Study of Layout Alternatives
In the alternative study executed by NEA for F/S in 2001 and 2004, FSL was defined at elevation to avoid a considerable environmental impact. Because there is an FSL whereby the number of resettled people increases abruptly if the FSL is higher, NEA’s alternative study was conducted only using the specified FSL. In this study, FSL alternatives are set taking topographical and environmental conditions into consideration for the above 5 layout alternatives, in order to conduct a numerically comparative study at each FSL. Economical parameters of all alternatives were compared, and the most economical alternative, which means that generating optimal effects in terms of both costs and benefit, should be chosen as the development planning option.
A flowchart for the comparative study is shown in Fig. 10.2-1. The comparative study is composed of 3 parts, i.e. planning, cost estimation, and economical analysis and the procedures of each part are shown as follows:
Final Report 10 - 41
Upgrading Feasibility Study on the Upper Seti Storage Hydroelectric Project in Nepal
Layout
FSL Setting
Project Planning
Project Cost Estimation
Annual Benefit Annual O&M Cost
Alternative Thermal P/S
B/C Value Max?NO
YES
Optimized Plan
Layout II Optimized Plan
Layout III Optimized Plan
Layout IV Optimized Plan
Option I
Optimized Plan with Maximum B/C should be “Development Planning Scheme”.
Project Planning
Economic Analysis
Fig. 10.2-1 Layout Alternatives Comparison Study Flow Chart
Final Report 10 - 42
Upgrading Feasibility Study on the Upper Seti Storage Hydroelectric Project in Nepal
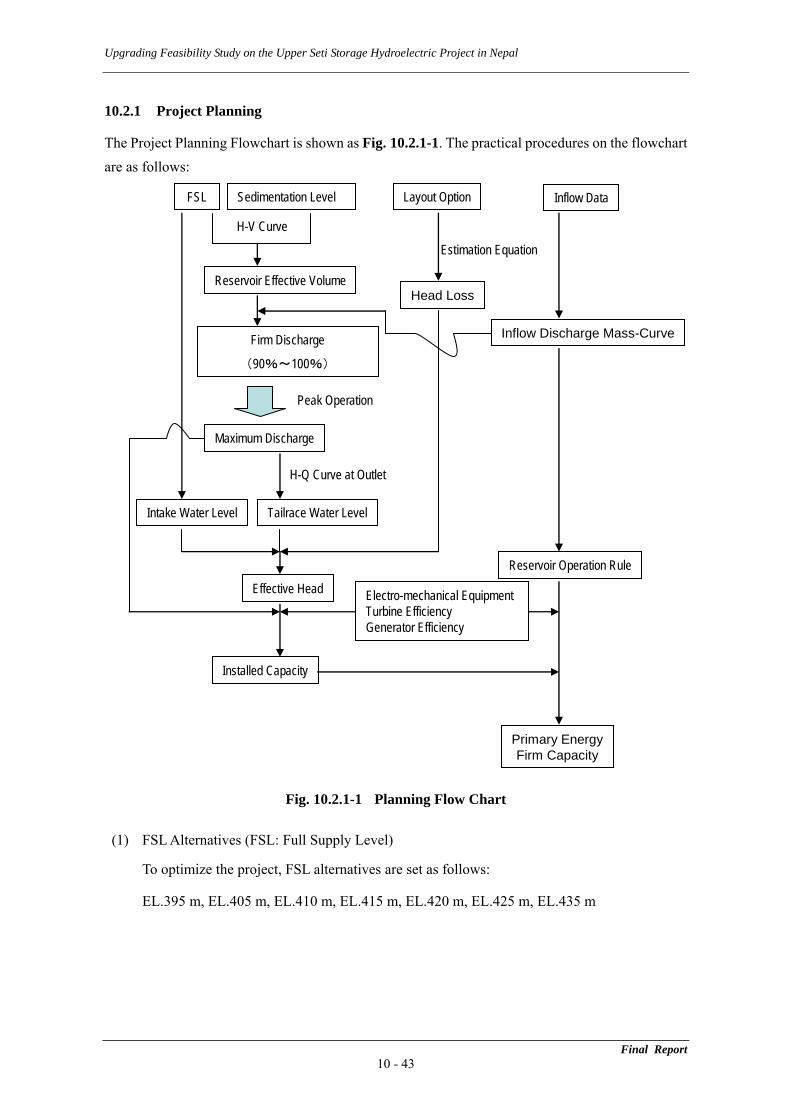
10.2.1 Project Planning
The Project Planning Flowchart is shown as Fig. 10.2.1-1. The practical procedures on the flowchart are as follows:
FSL Sedimentation Level
H-V Curve
Reservoir Effective Volume
Firm Discharge
(90%~100%)
Peak Operation
Layout Option
Maximum Discharge
H-Q Curve at Outlet
Head Loss
Estimation Equation
Tailrace Water LevelIntake Water Level
Effective Head Electro-mechanical EquipmentTurbine EfficiencyGenerator Efficiency
Installed Capacity
Inflow Data
Inflow Discharge Mass-Curve
Reservoir Operation Rule
Primary EnergyFirm Capacity
Fig. 10.2.1-1 Planning Flow Chart (1) FSL Alternatives (FSL: Full Supply Level)
To optimize the project, FSL alternatives are set as follows:
EL.395 m, EL.405 m, EL.410 m, EL.415 m, EL.420 m, EL.425 m, EL.435 m
Final Report 10 - 43
Upgrading Feasibility Study on the Upper Seti Storage Hydroelectric Project in Nepal
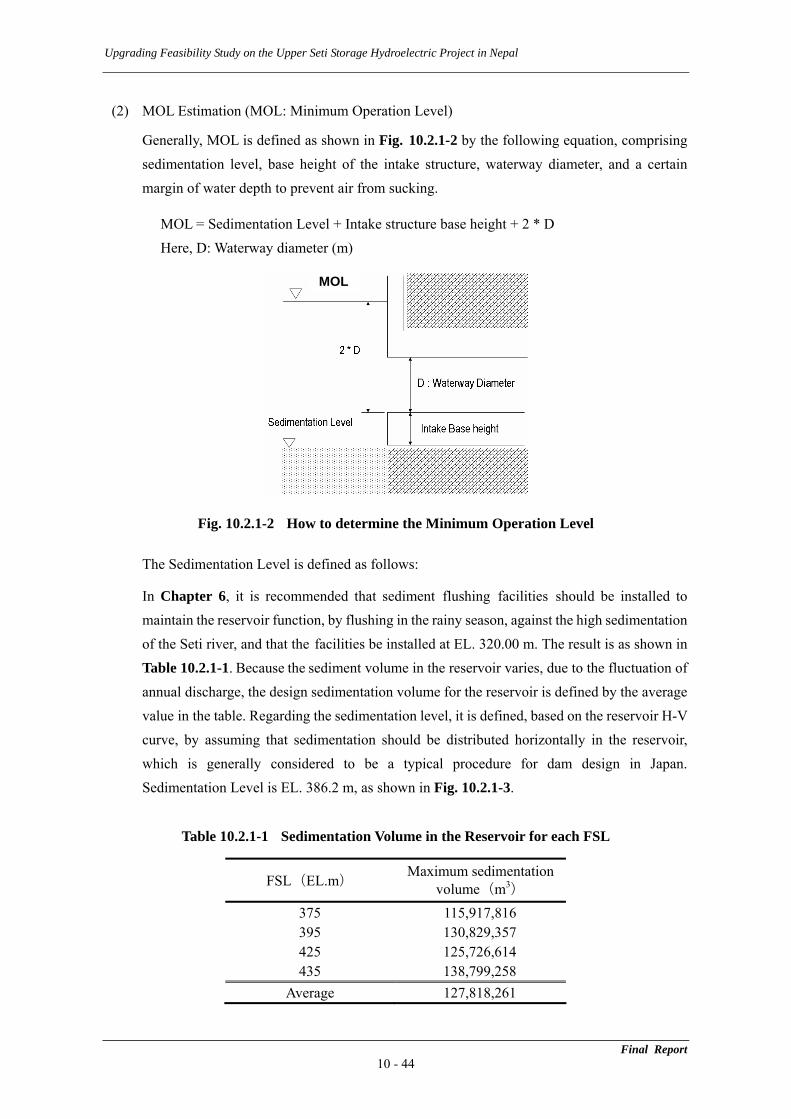
(2) MOL Estimation (MOL: Minimum Operation Level)
Generally, MOL is defined as shown in Fig. 10.2.1-2 by the following equation, comprising sedimentation level, base height of the intake structure, waterway diameter, and a certain margin of water depth to prevent air from sucking.
MOL = Sedimentation Level + Intake structure base height + 2 * D Here, D: Waterway diameter (m)
MOL
Fig. 10.2.1-2 How to determine the Minimum Operation Level
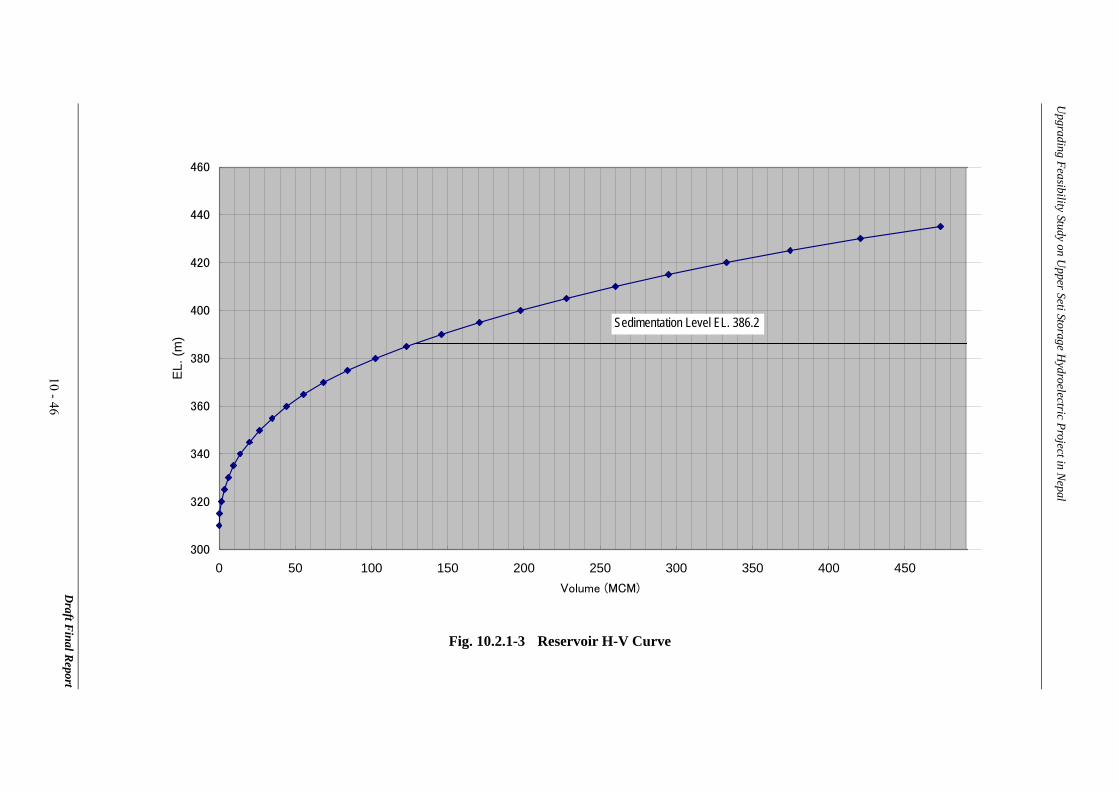
The Sedimentation Level is defined as follows:
In Chapter 6, it is recommended that sediment flushing facilities should be installed to maintain the reservoir function, by flushing in the rainy season, against the high sedimentation of the Seti river, and that the facilities be installed at EL. 320.00 m. The result is as shown in Table 10.2.1-1. Because the sediment volume in the reservoir varies, due to the fluctuation of annual discharge, the design sedimentation volume for the reservoir is defined by the average value in the table. Regarding the sedimentation level, it is defined, based on the reservoir H-V curve, by assuming that sedimentation should be distributed horizontally in the reservoir, which is generally considered to be a typical procedure for dam design in Japan. Sedimentation Level is EL. 386.2 m, as shown in Fig. 10.2.1-3.
Table 10.2.1-1 Sedimentation Volume in the Reservoir for each FSL
Maximum sedimentation volume(m3) FSL(EL.m)
375 115,917,816 395 130,829,357 425 125,726,614 435 138,799,258
Average 127,818,261
Final Report 10 - 44
Upgrading Feas
ibility Study on the Upper Seti Storage Hydroelectric Project in Nepal
Final Report 10 - 45
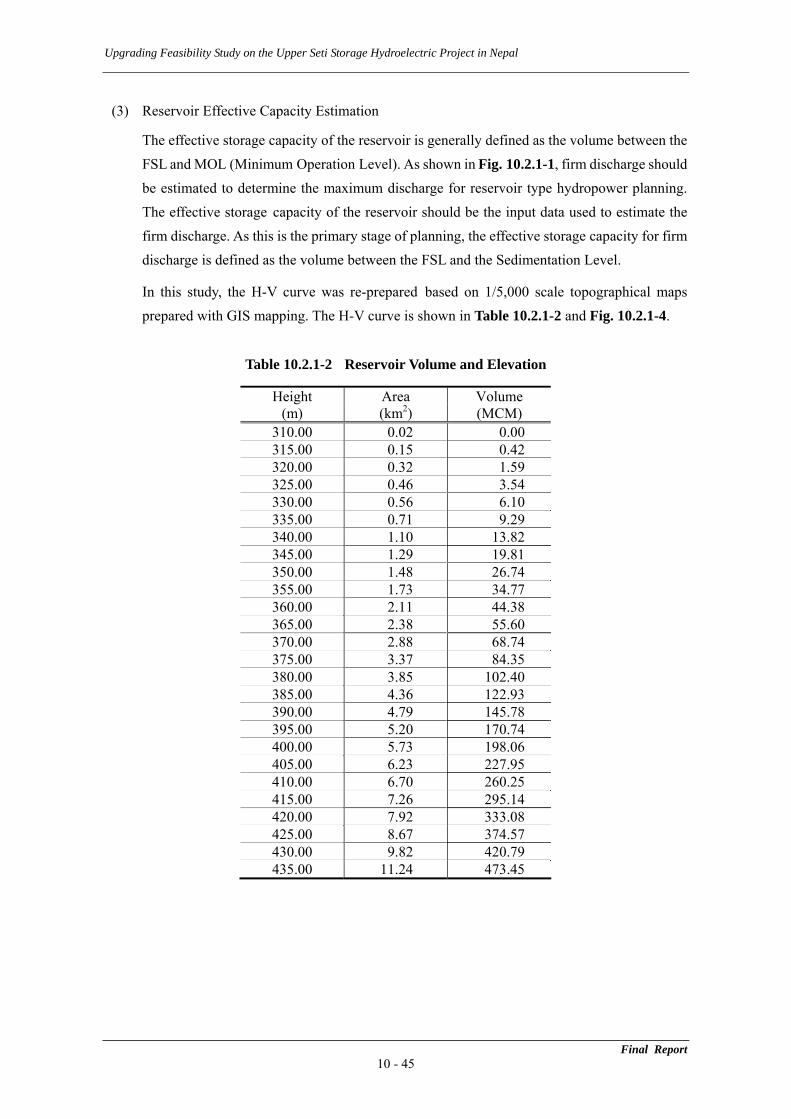
(3) Reservoir Effective Capacity Estimation
The effective storage capacity of the reservoir is generally defined as the volume between the FSL and MOL (Minimum Operation Level). As shown in Fig. 10.2.1-1, firm discharge should be estimated to determine the maximum discharge for reservoir type hydropower planning. The effective storage capacity of the reservoir should be the input data used to estimate the firm discharge. As this is the primary stage of planning, the effective storage capacity for firm discharge is defined as the volume between the FSL and the Sedimentation Level.
In this study, the H-V curve was re-prepared based on 1/5,000 scale topographical maps prepared with GIS mapping. The H-V curve is shown in Table 10.2.1-2 and Fig. 10.2.1-4.
Table 10.2.1-2 Reservoir Volume and Elevation
Height Area Volume (m) (km2) (MCM)
310.00 0.02 0.00 315.00 0.15 0.42 320.00 0.32 1.59 325.00 0.46 3.54 330.00 0.56 6.10 335.00 0.71 9.29 340.00 1.10 13.82 345.00 1.29 19.81 350.00 1.48 26.74 355.00 1.73 34.77 360.00 2.11 44.38 365.00 2.38 55.60 370.00 2.88 68.74 375.00 3.37 84.35 380.00 3.85 102.40 385.00 4.36 122.93 390.00 4.79 145.78 395.00 5.20 170.74 400.00 5.73 198.06 405.00 6.23 227.95 410.00 6.70 260.25 415.00 7.26 295.14 420.00 7.92 333.08 425.00 8.67 374.57 430.00 9.82 420.79 435.00 11.24 473.45
Upgrading Feasibility Study on U
pper Seti Storage Hydroelectric Project in N
epal
300
320
340
360
380
400
420
440
460
0 50 100 150 200 250 300 350 400 450Volume (MCM)
EL.
(m)
Sedimentation Level EL. 386.2
Fig. 10.2.1-3 Reservoir H-V Curve
Draft F
inal Report
10-46
Upgrading Feasibility Study on the Upper Seti Storage Hydroelectric Project in Nepal
(4) Discharge for Environmental flow
Because the river discharge in all layout alternatives except Option I decreases between the dam and tailrace, environmental flow should be discharged from an environmental perspective. Even in Option-I, discharge will decrease in the downstream section of the dam, while power is not generated in daytime due to the peak operation of the project.
Although the amount of compensatory flow is determined during the environmental impact assessment, this has not been determined for the current optimization study. Hence, 2.4 m3/s, which corresponds to the minimum monthly run-off at the dam site, has been applied to the environmental flow, based on the environmental regulations in Nepal.
The environmental flow of 2.4 m3/s should be discharged while power is not generated in the dry season for Option I, as stated in the Feasibility Study by NEA. For the other layout alternatives, a environmental flow of 2.4 m3/s should be discharged at all times throughout the year.
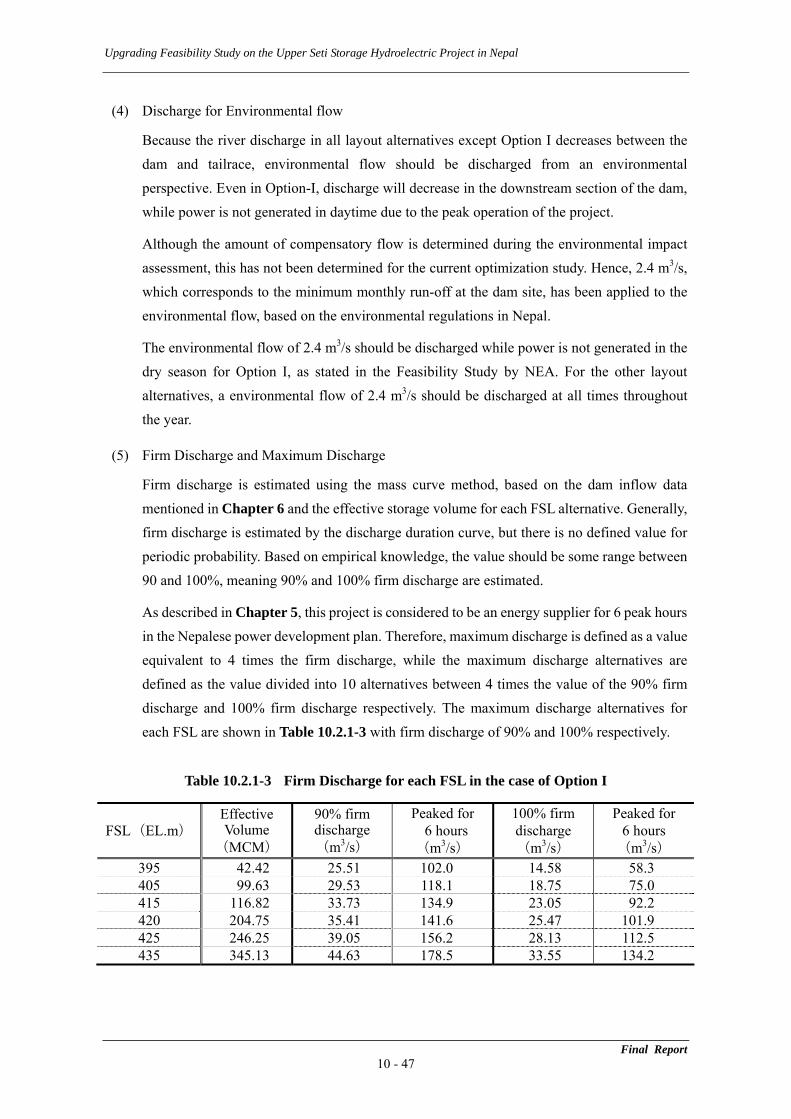
(5) Firm Discharge and Maximum Discharge
Firm discharge is estimated using the mass curve method, based on the dam inflow data mentioned in Chapter 6 and the effective storage volume for each FSL alternative. Generally, firm discharge is estimated by the discharge duration curve, but there is no defined value for periodic probability. Based on empirical knowledge, the value should be some range between 90 and 100%, meaning 90% and 100% firm discharge are estimated.
As described in Chapter 5, this project is considered to be an energy supplier for 6 peak hours in the Nepalese power development plan. Therefore, maximum discharge is defined as a value equivalent to 4 times the firm discharge, while the maximum discharge alternatives are defined as the value divided into 10 alternatives between 4 times the value of the 90% firm discharge and 100% firm discharge respectively. The maximum discharge alternatives for each FSL are shown in Table 10.2.1-3 with firm discharge of 90% and 100% respectively.
Table 10.2.1-3 Firm Discharge for each FSL in the case of Option I
100% firm Peaked for Peaked for Effective Volume
90% firm discharge discharge 6 hours 6 hours FSL(EL.m) (m3/s) (m3/s) (m3/s) (m3/s) (MCM)
395 42.42 25.51 102.0 14.58 58.3 405 99.63 29.53 118.1 18.75 75.0 415 116.82 33.73 134.9 23.05 92.2 420 204.75 35.41 141.6 25.47 101.9 425 246.25 39.05 156.2 28.13 112.5 435 345.13 44.63 178.5 33.55 134.2
Final Report 10 - 47
Upgrading Feasibility Study on the Upper Seti Storage Hydroelectric Project in Nepal
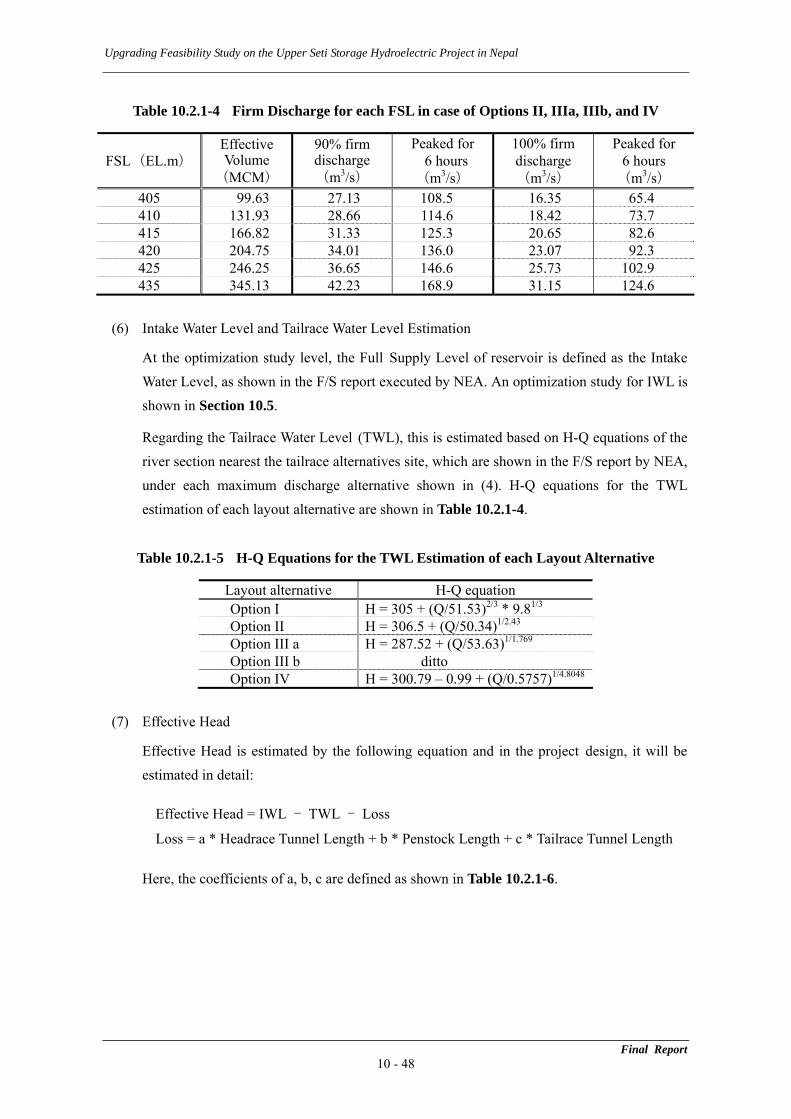
Table 10.2.1-4 Firm Discharge for each FSL in case of Options II, IIIa, IIIb, and IV
100% firm Peaked for Peaked for Effective Volume
90% firm discharge discharge 6 hours 6 hours FSL(EL.m) (m3/s) (m3/s) (m3/s) (m3/s) (MCM)
405 99.63 27.13 108.5 16.35 65.4 410 131.93 28.66 114.6 18.42 73.7 415 166.82 31.33 125.3 20.65 82.6 420 204.75 34.01 136.0 23.07 92.3 425 246.25 36.65 146.6 25.73 102.9 435 345.13 42.23 168.9 31.15 124.6
(6) Intake Water Level and Tailrace Water Level Estimation
At the optimization study level, the Full Supply Level of reservoir is defined as the Intake Water Level, as shown in the F/S report executed by NEA. An optimization study for IWL is shown in Section 10.5.
Regarding the Tailrace Water Level (TWL), this is estimated based on H-Q equations of the river section nearest the tailrace alternatives site, which are shown in the F/S report by NEA, under each maximum discharge alternative shown in (4). H-Q equations for the TWL estimation of each layout alternative are shown in Table 10.2.1-4.
Table 10.2.1-5 H-Q Equations for the TWL Estimation of each Layout Alternative
Layout alternative H-Q equation H = 305 + (Q/51.53)2/3 * 9.81/3 Option I H = 306.5 + (Q/50.34)1/2.43 Option II H = 287.52 + (Q/53.63)1/1.769 Option III a
Option III b ditto H = 300.79 – 0.99 + (Q/0.5757)1/4.8048 Option IV
(7) Effective Head
Effective Head is estimated by the following equation and in the project design, it will be estimated in detail:
Effective Head = IWL - TWL - Loss
Loss = a * Headrace Tunnel Length + b * Penstock Length + c * Tailrace Tunnel Length
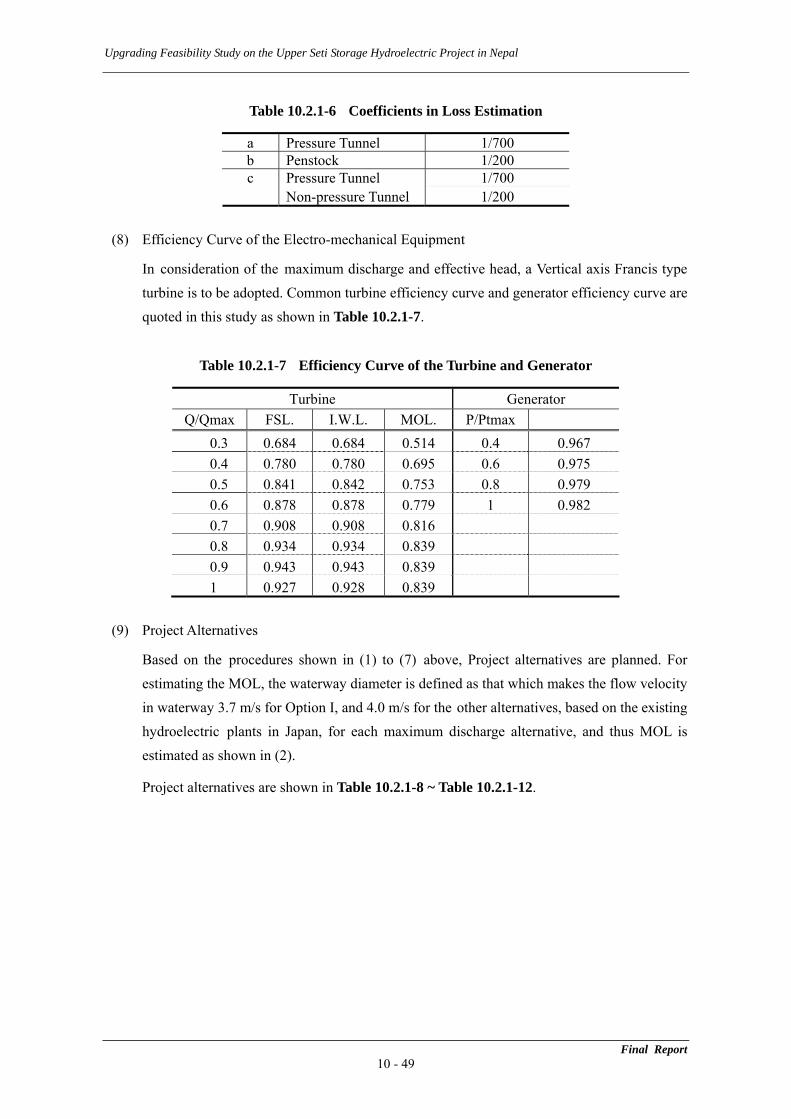
Here, the coefficients of a, b, c are defined as shown in Table 10.2.1-6.
Final Report 10 - 48
Upgrading Feasibility Study on the Upper Seti Storage Hydroelectric Project in Nepal
Table 10.2.1-6 Coefficients in Loss Estimation
a Pressure Tunnel 1/700 b Penstock 1/200
Pressure Tunnel 1/700 c Non-pressure Tunnel 1/200
(8) Efficiency Curve of the Electro-mechanical Equipment
In consideration of the maximum discharge and effective head, a Vertical axis Francis type turbine is to be adopted. Common turbine efficiency curve and generator efficiency curve are quoted in this study as shown in Table 10.2.1-7.
Table 10.2.1-7 Efficiency Curve of the Turbine and Generator
Turbine Generator Q/Qmax FSL. I.W.L. MOL. P/Ptmax
0.3 0.684 0.684 0.514 0.4 0.967 0.4 0.780 0.780 0.695 0.6 0.975 0.5 0.841 0.842 0.753 0.8 0.979 0.6 0.878 0.878 0.779 1 0.982 0.7 0.908 0.908 0.816 0.8 0.934 0.934 0.839 0.9 0.943 0.943 0.839 1 0.927 0.928 0.839
(9) Project Alternatives
Based on the procedures shown in (1) to (7) above, Project alternatives are planned. For estimating the MOL, the waterway diameter is defined as that which makes the flow velocity in waterway 3.7 m/s for Option I, and 4.0 m/s for the other alternatives, based on the existing hydroelectric plants in Japan, for each maximum discharge alternative, and thus MOL is estimated as shown in (2).
Project alternatives are shown in Table 10.2.1-8 ~ Table 10.2.1-12.
Final Report 10 - 49

Upgrading Feasibility Study on the Upper Seti Storage Hydroelectric Project in Nepal
Final Report 10 - 50
Table 10.2.1-8 Main Features of Alternatives for Option I j
1 2 3 4 5 6 7 8 9 10Qmax m3/s 58.3 63.2 68 72.9 77.7 82.6FSL EL.m 395 395 395 395 395 395MOL EL.m 393.6 393.8 394 394.2 394.6 394.8Effective Vol. MCM 7.00 6.00 5.00 4.00 2.00 1.00TWL EL.m 307.3 307.5 307.6 307.7 307.8 307.9Loss m 1 1 1 1 1 1Effective Head m 86.7 86.5 86.4 86.3 86.2 86.1Pmax MW 45 49 52 56 60 63
1 2 3 4 5 6 7 8 9 10Qmax m3/s 75 79.8 84.6 89.4 94.2 99 103.7 108.5 113.3 118.12FSL EL.m 405 405 405 405 405 405 405 405 405 405MOL EL.m 394.4 394.6 394.8 395.0 395.2 395.4 395.6 395.8 396 396.2Effective Vol. MCM 60.2 59.2 58.2 57.2 56.1 55 53.9 52.8 51.7 50.7TWL EL.m 307.7 307.9 308 308.1 308.2 308.3 308.4 308.5 308.6 308.7Loss m 1 1 1 1 1 1 1 1 1 1Effective Head m 96.3 96.1 96 95.9 95.8 95.7 95.6 95.5 95.4 95.3Pmax MW 64 68 72 76 81 85 88 92 96 100
1 2 3 4 5 6 7 8 9 10Qmax m3/s 83.3 87.8 92.4 96.9 101.5 106 110.6 115.1 119.7 124.2FSL EL.m 410 410 410 410 410 410 410 410 410 410MOL EL.m 394.8 395 395.2 395.4 395.6 395.8 396 396.2 396.2 396.4Effective Vol. MCM 90.5 89.5 88.5 87.5 86.5 85.5 84.5 83.5 83.5 82.5TWL EL.m 307.9 308.1 308.2 308.3 308.4 308.5 308.6 308.7 308.8 308.8Loss m 1 1 1 1 1 1 1 1 1 1Effective Head m 101.1 100.9 100.8 100.7 100.6 100.5 100.4 100.3 100.2 100.2Pmax MW 75 79 83 87 91 95 99 103 107 111
1 2 3 4 5 6 7 8 9 10Qmax m3/s 92.2 96.9 101.7 106.4 111.2 115.9 120.7 125.4 130.2 134.92FSL EL.m 415 415 415 415 415 415 415 415 415 415MOL EL.m 395.2 395.4 395.6 395.8 396 396.2 396.4 396.4 396.6 396.8Effective Vol. MCM 123.3 122.2 121.1 120 118.9 117.8 116.8 116.8 115.7 114.6TWL EL.m 308.2 308.3 308.4 308.5 308.6 308.7 308.8 308.9 309 309.1Loss m 1 1 1 1 1 1 1 1 1 1Effective Head m 105.8 105.7 105.6 105.5 105.4 105.3 105.2 105.1 105 104.9Pmax MW 87 91 96 100 105 109 113 118 122 126
1 2 3 4 5 6 7 8 9 10Qmax m3/s 101.88 106.7 111.6 116.5 121.3 126.2 131 135.9 140.7 145.6FSL EL.m 420 420 420 420 420 420 420 420 420 420MOL EL.m 395.6 395.8 396 396.2 396.4 396.6 396.6 396.8 397 397.2Effective Vol. MCM 159.1 158 156.9 155.8 154.7 153.6 153.6 152.5 151.4 150.3TWL EL.m 308.4 308.5 308.6 308.7 308.8 308.9 309 309.1 309.2 309.3Loss m 1 1 1 1 1 1 1 1 1 1Effective Head m 110.6 110.5 110.4 110.3 110.2 110.1 110 109.9 109.8 109.7Pmax MW 101 105 110 115 119 124 129 133 138 143
1 2 3 4 5 6 7 8 9 10Qmax m3/s 112.5 117.4 122.2 127.1 131.9 136.8 141.6 146.5 151.3 156.2FSL EL.m 425 425 425 425 425 425 425 425 425 425MOL EL.m 396 396.2 396.4 396.6 396.8 397 397 397.2 397.4 397.6Effective Vol. MCM 198.4 197.3 196.2 195.1 194 192.9 192.9 191.8 190.7 189.6TWL EL.m 308.6 308.7 308.8 308.9 309 309.1 309.2 309.3 309.4 309.5Loss m 1 1 1 1 1 1 1 1 1 1Effective Head m 115.4 115.3 115.2 115.1 115 114.9 114.8 114.7 114.6 114.5Pmax MW 116 121 126 131 135 140 145 150 155 160
1 2 3 4 5 6 7 8 9 10Qmax m3/s 134.2 139.1 144 149 153.9 158.8 163.7 168.7 173.6 178.5FSL EL.m 435 435 435 435 435 435 435 435 435 435MOL EL.m 396.8 397 397.2 397.4 397.4 397.6 397.8 398 398.2 398.2Effective Vol. MCM 292.9 291.8 290.7 289.6 289.6 288.5 287.4 286.3 285.2 285.2TWL EL.m 309.1 309.1 309.2 309.3 309.4 309.5 309.6 309.7 309.8 309.9Loss m 1 1 1 1 1 1 1 1 1 1Effective Head m 124.9 124.9 124.8 124.7 124.6 124.5 124.4 124.3 124.2 124.1Pmax MW 150 155 160 166 171 176 182 187 192 198
Item Unit FSL=395
Item Unit FSL=425
Unit FSL=410
Item Unit FSL=420
Item Unit FSL=435
Item Unit FSL=405
Item Unit FSL=415
Item
Note: The numbers 1 to 10 mean case No. of maximum discharge at the same FSL.
Upgrading Feasibility Study on the Upper Seti Storage Hydroelectric Project in Nepal
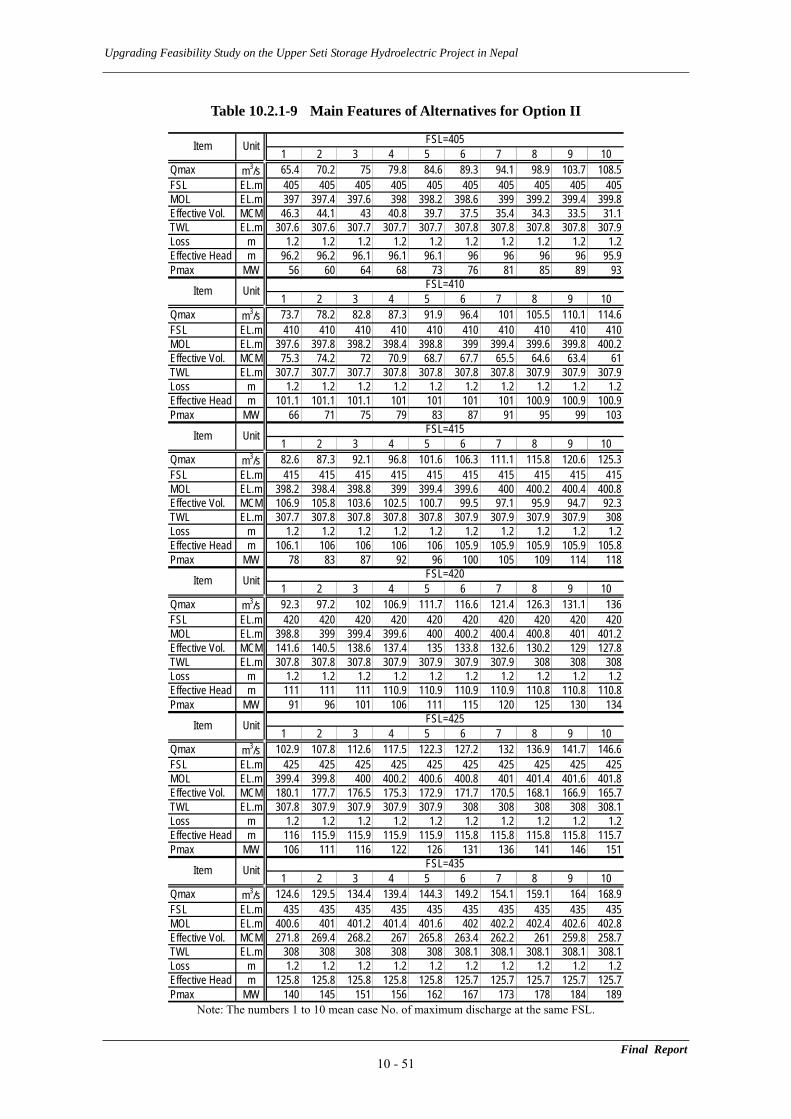
Table 10.2.1-9 Main Features of Alternatives for Option II
1 2 3 4 5 6 7 8 9 10Qmax m3/s 65.4 70.2 75 79.8 84.6 89.3 94.1 98.9 103.7 108.5FSL EL.m 405 405 405 405 405 405 405 405 405 405MOL EL.m 397 397.4 397.6 398 398.2 398.6 399 399.2 399.4 399.8Effective Vol. MCM 46.3 44.1 43 40.8 39.7 37.5 35.4 34.3 33.5 31.1TWL EL.m 307.6 307.6 307.7 307.7 307.7 307.8 307.8 307.8 307.8 307.9Loss m 1.2 1.2 1.2 1.2 1.2 1.2 1.2 1.2 1.2 1.2Effective Head m 96.2 96.2 96.1 96.1 96.1 96 96 96 96 95.9Pmax MW 56 60 64 68 73 76 81 85 89 93
1 2 3 4 5 6 7 8 9 10Qmax m3/s 73.7 78.2 82.8 87.3 91.9 96.4 101 105.5 110.1 114.6FSL EL.m 410 410 410 410 410 410 410 410 410 410MOL EL.m 397.6 397.8 398.2 398.4 398.8 399 399.4 399.6 399.8 400.2Effective Vol. MCM 75.3 74.2 72 70.9 68.7 67.7 65.5 64.6 63.4 61TWL EL.m 307.7 307.7 307.7 307.8 307.8 307.8 307.8 307.9 307.9 307.9Loss m 1.2 1.2 1.2 1.2 1.2 1.2 1.2 1.2 1.2 1.2Effective Head m 101.1 101.1 101.1 101 101 101 101 100.9 100.9 100.9Pmax MW 66 71 75 79 83 87 91 95 99 103
1 2 3 4 5 6 7 8 9 10Qmax m3/s 82.6 87.3 92.1 96.8 101.6 106.3 111.1 115.8 120.6 125.3FSL EL.m 415 415 415 415 415 415 415 415 415 415MOL EL.m 398.2 398.4 398.8 399 399.4 399.6 400 400.2 400.4 400.8Effective Vol. MCM 106.9 105.8 103.6 102.5 100.7 99.5 97.1 95.9 94.7 92.3TWL EL.m 307.7 307.8 307.8 307.8 307.8 307.9 307.9 307.9 307.9 308Loss m 1.2 1.2 1.2 1.2 1.2 1.2 1.2 1.2 1.2 1.2Effective Head m 106.1 106 106 106 106 105.9 105.9 105.9 105.9 105.8Pmax MW 78 83 87 92 96 100 105 109 114 118
1 2 3 4 5 6 7 8 9 10Qmax m3/s 92.3 97.2 102 106.9 111.7 116.6 121.4 126.3 131.1 136FSL EL.m 420 420 420 420 420 420 420 420 420 420MOL EL.m 398.8 399 399.4 399.6 400 400.2 400.4 400.8 401 401.2Effective Vol. MCM 141.6 140.5 138.6 137.4 135 133.8 132.6 130.2 129 127.8TWL EL.m 307.8 307.8 307.8 307.9 307.9 307.9 307.9 308 308 308Loss m 1.2 1.2 1.2 1.2 1.2 1.2 1.2 1.2 1.2 1.2Effective Head m 111 111 111 110.9 110.9 110.9 110.9 110.8 110.8 110.8Pmax MW 91 96 101 106 111 115 120 125 130 134
1 2 3 4 5 6 7 8 9 10Qmax m3/s 102.9 107.8 112.6 117.5 122.3 127.2 132 136.9 141.7 146.6FSL EL.m 425 425 425 425 425 425 425 425 425 425MOL EL.m 399.4 399.8 400 400.2 400.6 400.8 401 401.4 401.6 401.8Effective Vol. MCM 180.1 177.7 176.5 175.3 172.9 171.7 170.5 168.1 166.9 165.7TWL EL.m 307.8 307.9 307.9 307.9 307.9 308 308 308 308 308.1Loss m 1.2 1.2 1.2 1.2 1.2 1.2 1.2 1.2 1.2 1.2Effective Head m 116 115.9 115.9 115.9 115.9 115.8 115.8 115.8 115.8 115.7Pmax MW 106 111 116 122 126 131 136 141 146 151
1 2 3 4 5 6 7 8 9 10Qmax m3/s 124.6 129.5 134.4 139.4 144.3 149.2 154.1 159.1 164 168.9FSL EL.m 435 435 435 435 435 435 435 435 435 435MOL EL.m 400.6 401 401.2 401.4 401.6 402 402.2 402.4 402.6 402.8Effective Vol. MCM 271.8 269.4 268.2 267 265.8 263.4 262.2 261 259.8 258.7TWL EL.m 308 308 308 308 308 308.1 308.1 308.1 308.1 308.1Loss m 1.2 1.2 1.2 1.2 1.2 1.2 1.2 1.2 1.2 1.2Effective Head m 125.8 125.8 125.8 125.8 125.8 125.7 125.7 125.7 125.7 125.7Pmax MW 140 145 151 156 162 167 173 178 184 189
Unit
Item Unit FSL=405
Item Unit FSL=415
Item
Item Unit FSL=435
Unit FSL=410
Item Unit FSL=425
FSL=420Item
Note: The numbers 1 to 10 mean case No. of maximum discharge at the same FSL.
Final Report 10 - 51
Upgrading Feasibility Study on the Upper Seti Storage Hydroelectric Project in Nepal
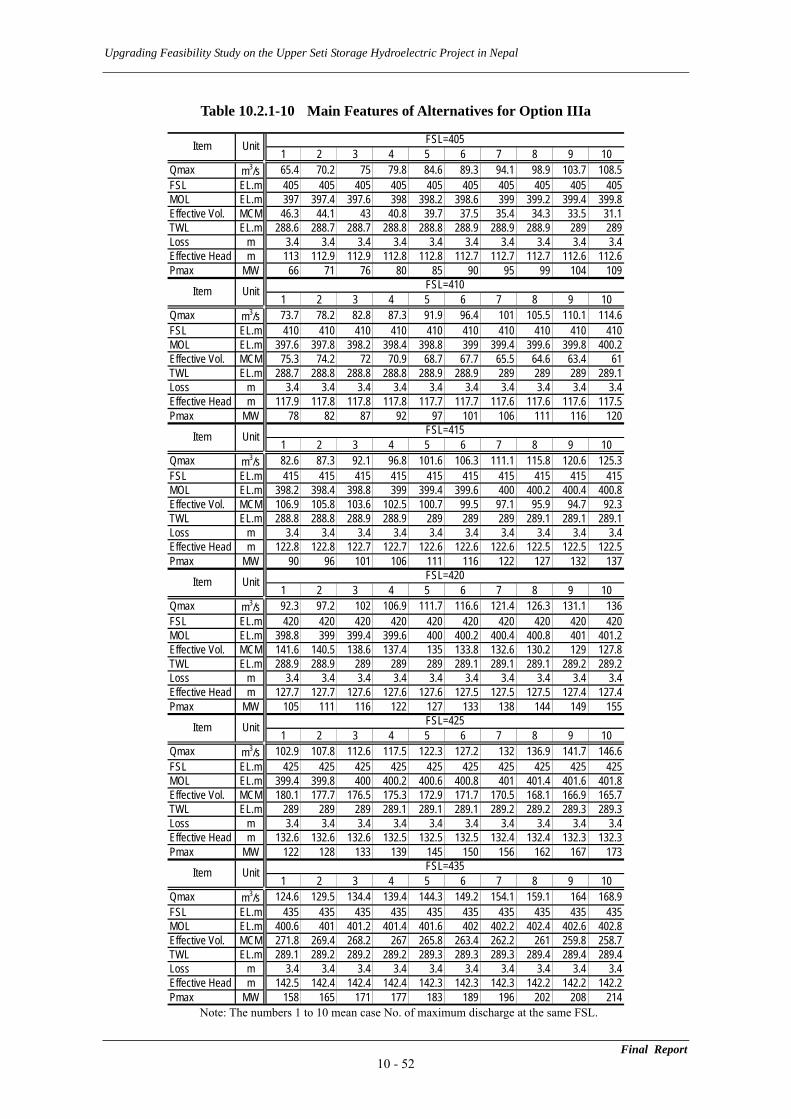
Table 10.2.1-10 Main Features of Alternatives for Option IIIa
1 2 3 4 5 6 7 8 9 10Qmax m3/s 65.4 70.2 75 79.8 84.6 89.3 94.1 98.9 103.7 108.5FSL EL.m 405 405 405 405 405 405 405 405 405 405MOL EL.m 397 397.4 397.6 398 398.2 398.6 399 399.2 399.4 399.8Effective Vol. MCM 46.3 44.1 43 40.8 39.7 37.5 35.4 34.3 33.5 31.1TWL EL.m 288.6 288.7 288.7 288.8 288.8 288.9 288.9 288.9 289 289Loss m 3.4 3.4 3.4 3.4 3.4 3.4 3.4 3.4 3.4 3.4Effective Head m 113 112.9 112.9 112.8 112.8 112.7 112.7 112.7 112.6 112.6Pmax MW 66 71 76 80 85 90 95 99 104 109
1 2 3 4 5 6 7 8 9 10Qmax m3/s 73.7 78.2 82.8 87.3 91.9 96.4 101 105.5 110.1 114.6FSL EL.m 410 410 410 410 410 410 410 410 410 410MOL EL.m 397.6 397.8 398.2 398.4 398.8 399 399.4 399.6 399.8 400.2Effective Vol. MCM 75.3 74.2 72 70.9 68.7 67.7 65.5 64.6 63.4 61TWL EL.m 288.7 288.8 288.8 288.8 288.9 288.9 289 289 289 289.1Loss m 3.4 3.4 3.4 3.4 3.4 3.4 3.4 3.4 3.4 3.4Effective Head m 117.9 117.8 117.8 117.8 117.7 117.7 117.6 117.6 117.6 117.5Pmax MW 78 82 87 92 97 101 106 111 116 120
1 2 3 4 5 6 7 8 9 10Qmax m3/s 82.6 87.3 92.1 96.8 101.6 106.3 111.1 115.8 120.6 125.3FSL EL.m 415 415 415 415 415 415 415 415 415 415MOL EL.m 398.2 398.4 398.8 399 399.4 399.6 400 400.2 400.4 400.8Effective Vol. MCM 106.9 105.8 103.6 102.5 100.7 99.5 97.1 95.9 94.7 92.3TWL EL.m 288.8 288.8 288.9 288.9 289 289 289 289.1 289.1 289.1Loss m 3.4 3.4 3.4 3.4 3.4 3.4 3.4 3.4 3.4 3.4Effective Head m 122.8 122.8 122.7 122.7 122.6 122.6 122.6 122.5 122.5 122.5Pmax MW 90 96 101 106 111 116 122 127 132 137
1 2 3 4 5 6 7 8 9 10Qmax m3/s 92.3 97.2 102 106.9 111.7 116.6 121.4 126.3 131.1 136FSL EL.m 420 420 420 420 420 420 420 420 420 420MOL EL.m 398.8 399 399.4 399.6 400 400.2 400.4 400.8 401 401.2Effective Vol. MCM 141.6 140.5 138.6 137.4 135 133.8 132.6 130.2 129 127.8TWL EL.m 288.9 288.9 289 289 289 289.1 289.1 289.1 289.2 289.2Loss m 3.4 3.4 3.4 3.4 3.4 3.4 3.4 3.4 3.4 3.4Effective Head m 127.7 127.7 127.6 127.6 127.6 127.5 127.5 127.5 127.4 127.4Pmax MW 105 111 116 122 127 133 138 144 149 155
1 2 3 4 5 6 7 8 9 10Qmax m3/s 102.9 107.8 112.6 117.5 122.3 127.2 132 136.9 141.7 146.6FSL EL.m 425 425 425 425 425 425 425 425 425 425MOL EL.m 399.4 399.8 400 400.2 400.6 400.8 401 401.4 401.6 401.8Effective Vol. MCM 180.1 177.7 176.5 175.3 172.9 171.7 170.5 168.1 166.9 165.7TWL EL.m 289 289 289 289.1 289.1 289.1 289.2 289.2 289.3 289.3Loss m 3.4 3.4 3.4 3.4 3.4 3.4 3.4 3.4 3.4 3.4Effective Head m 132.6 132.6 132.6 132.5 132.5 132.5 132.4 132.4 132.3 132.3Pmax MW 122 128 133 139 145 150 156 162 167 173
1 2 3 4 5 6 7 8 9 10Qmax m3/s 124.6 129.5 134.4 139.4 144.3 149.2 154.1 159.1 164 168.9FSL EL.m 435 435 435 435 435 435 435 435 435 435MOL EL.m 400.6 401 401.2 401.4 401.6 402 402.2 402.4 402.6 402.8Effective Vol. MCM 271.8 269.4 268.2 267 265.8 263.4 262.2 261 259.8 258.7TWL EL.m 289.1 289.2 289.2 289.2 289.3 289.3 289.3 289.4 289.4 289.4Loss m 3.4 3.4 3.4 3.4 3.4 3.4 3.4 3.4 3.4 3.4Effective Head m 142.5 142.4 142.4 142.4 142.3 142.3 142.3 142.2 142.2 142.2Pmax MW 158 165 171 177 183 189 196 202 208 214
FSL=420
Item Unit FSL=405
Item Unit FSL=415
Item
Item Unit FSL=435
Unit FSL=410
Item Unit FSL=425
Item Unit
Note: The numbers 1 to 10 mean case No. of maximum discharge at the same FSL.
Final Report 10 - 52
Upgrading Feasibility Study on the Upper Seti Storage Hydroelectric Project in Nepal
Final Report 10 - 53
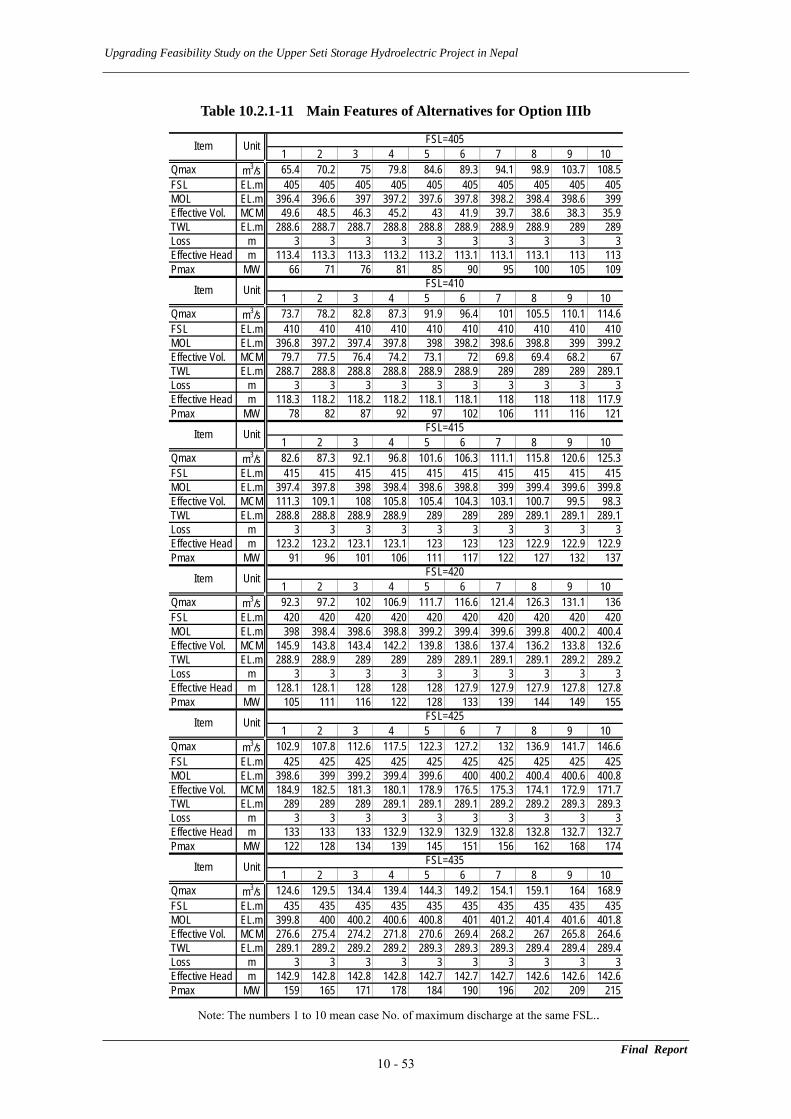
Table 10.2.1-11 Main Features of Alternatives for Option IIIb
1 2 3 4 5 6 7 8 9 10Qmax m3/s 65.4 70.2 75 79.8 84.6 89.3 94.1 98.9 103.7 108.5FSL EL.m 405 405 405 405 405 405 405 405 405 405MOL EL.m 396.4 396.6 397 397.2 397.6 397.8 398.2 398.4 398.6 399Effective Vol. MCM 49.6 48.5 46.3 45.2 43 41.9 39.7 38.6 38.3 35.9TWL EL.m 288.6 288.7 288.7 288.8 288.8 288.9 288.9 288.9 289 289Loss m 3 3 3 3 3 3 3 3 3Effective Head m 113.4 113.3 113.3 113.2 113.2 113.1 113.1 113.1 113 113Pmax MW 66 71 76 81 85 90 95 100 105 109
1 2 3 4 5 6 7 8 9 10Qmax m3/s 73.7 78.2 82.8 87.3 91.9 96.4 101 105.5 110.1 114.6FSL EL.m 410 410 410 410 410 410 410 410 410 410MOL EL.m 396.8 397.2 397.4 397.8 398 398.2 398.6 398.8 399 399.2Effective Vol. MCM 79.7 77.5 76.4 74.2 73.1 72 69.8 69.4 68.2 67TWL EL.m 288.7 288.8 288.8 288.8 288.9 288.9 289 289 289 289.1Loss m 3 3 3 3 3 3 3 3 3Effective Head m 118.3 118.2 118.2 118.2 118.1 118.1 118 118 118 117.9Pmax MW 78 82 87 92 97 102 106 111 116 121
1 2 3 4 5 6 7 8 9 10Qmax m3/s 82.6 87.3 92.1 96.8 101.6 106.3 111.1 115.8 120.6 125.3FSL EL.m 415 415 415 415 415 415 415 415 415 415MOL EL.m 397.4 397.8 398 398.4 398.6 398.8 399 399.4 399.6 399.8Effective Vol. MCM 111.3 109.1 108 105.8 105.4 104.3 103.1 100.7 99.5 98.3TWL EL.m 288.8 288.8 288.9 288.9 289 289 289 289.1 289.1 289.1Loss m 3 3 3 3 3 3 3 3 3Effective Head m 123.2 123.2 123.1 123.1 123 123 123 122.9 122.9 122.9Pmax MW 91 96 101 106 111 117 122 127 132 137
1 2 3 4 5 6 7 8 9 10Qmax m3/s 92.3 97.2 102 106.9 111.7 116.6 121.4 126.3 131.1 136FSL EL.m 420 420 420 420 420 420 420 420 420 420MOL EL.m 398 398.4 398.6 398.8 399.2 399.4 399.6 399.8 400.2 400.4Effective Vol. MCM 145.9 143.8 143.4 142.2 139.8 138.6 137.4 136.2 133.8 132.6TWL EL.m 288.9 288.9 289 289 289 289.1 289.1 289.1 289.2 289.2Loss m 3 3 3 3 3 3 3 3 3Effective Head m 128.1 128.1 128 128 128 127.9 127.9 127.9 127.8 127.8Pmax MW 105 111 116 122 128 133 139 144 149 155
1 2 3 4 5 6 7 8 9 10Qmax m3/s 102.9 107.8 112.6 117.5 122.3 127.2 132 136.9 141.7 146.6FSL EL.m 425 425 425 425 425 425 425 425 425 425MOL EL.m 398.6 399 399.2 399.4 399.6 400 400.2 400.4 400.6 400.8Effective Vol. MCM 184.9 182.5 181.3 180.1 178.9 176.5 175.3 174.1 172.9 171.7TWL EL.m 289 289 289 289.1 289.1 289.1 289.2 289.2 289.3 289.3Loss m 3 3 3 3 3 3 3 3 3Effective Head m 133 133 133 132.9 132.9 132.9 132.8 132.8 132.7 132.7Pmax MW 122 128 134 139 145 151 156 162 168 174
1 2 3 4 5 6 7 8 9 10Qmax m3/s 124.6 129.5 134.4 139.4 144.3 149.2 154.1 159.1 164 168.9FSL EL.m 435 435 435 435 435 435 435 435 435 435MOL EL.m 399.8 400 400.2 400.6 400.8 401 401.2 401.4 401.6 401.8Effective Vol. MCM 276.6 275.4 274.2 271.8 270.6 269.4 268.2 267 265.8 264.6TWL EL.m 289.1 289.2 289.2 289.2 289.3 289.3 289.3 289.4 289.4 289.4Loss m 3 3 3 3 3 3 3 3 3Effective Head m 142.9 142.8 142.8 142.8 142.7 142.7 142.7 142.6 142.6 142.6Pmax MW 159 165 171 178 184 190 196 202 209 215
FSL=420
Item Unit FSL=405
Item Unit FSL=415
Item
Item Unit FSL=435
Unit FSL=410
Item Unit FSL=425
Item Unit
3
3
3
3
3
3
Note: The numbers 1 to 10 mean case No. of maximum discharge at the same FSL..
Upgrading Feasibility Study on the Upper Seti Storage Hydroelectric Project in Nepal
Final Report 10 - 54
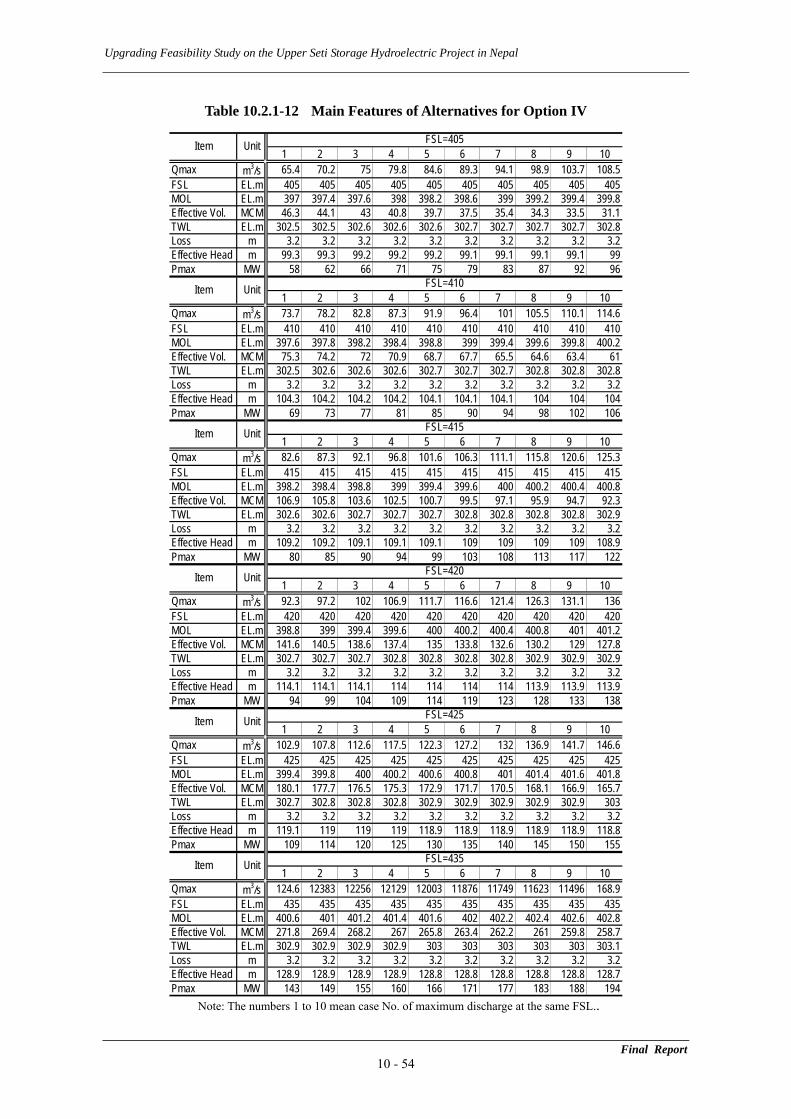
Table 10.2.1-12 Main Features of Alternatives for Option IV
1 2 3 4 5 6 7 8 9 10Qmax m3/s 65.4 70.2 75 79.8 84.6 89.3 94.1 98.9 103.7 108.5FSL EL.m 405 405 405 405 405 405 405 405 405 405MOL EL.m 397 397.4 397.6 398 398.2 398.6 399 399.2 399.4 399.8Effective Vol. MCM 46.3 44.1 43 40.8 39.7 37.5 35.4 34.3 33.5 31.1TWL EL.m 302.5 302.5 302.6 302.6 302.6 302.7 302.7 302.7 302.7 302.8Loss m 3.2 3.2 3.2 3.2 3.2 3.2 3.2 3.2 3.2 3.Effective Head m 99.3 99.3 99.2 99.2 99.2 99.1 99.1 99.1 99.1 99Pmax MW 58 62 66 71 75 79 83 87 92 96
1 2 3 4 5 6 7 8 9 10Qmax m3/s 73.7 78.2 82.8 87.3 91.9 96.4 101 105.5 110.1 114.6FSL EL.m 410 410 410 410 410 410 410 410 410 410MOL EL.m 397.6 397.8 398.2 398.4 398.8 399 399.4 399.6 399.8 400.2Effective Vol. MCM 75.3 74.2 72 70.9 68.7 67.7 65.5 64.6 63.4 61TWL EL.m 302.5 302.6 302.6 302.6 302.7 302.7 302.7 302.8 302.8 302.8Loss m 3.2 3.2 3.2 3.2 3.2 3.2 3.2 3.2 3.2 3.Effective Head m 104.3 104.2 104.2 104.2 104.1 104.1 104.1 104 104 104Pmax MW 69 73 77 81 85 90 94 98 102 106
1 2 3 4 5 6 7 8 9 10Qmax m3/s 82.6 87.3 92.1 96.8 101.6 106.3 111.1 115.8 120.6 125.3FSL EL.m 415 415 415 415 415 415 415 415 415 415MOL EL.m 398.2 398.4 398.8 399 399.4 399.6 400 400.2 400.4 400.8Effective Vol. MCM 106.9 105.8 103.6 102.5 100.7 99.5 97.1 95.9 94.7 92.3TWL EL.m 302.6 302.6 302.7 302.7 302.7 302.8 302.8 302.8 302.8 302.9Loss m 3.2 3.2 3.2 3.2 3.2 3.2 3.2 3.2 3.2 3.Effective Head m 109.2 109.2 109.1 109.1 109.1 109 109 109 109 108.9Pmax MW 80 85 90 94 99 103 108 113 117 122
1 2 3 4 5 6 7 8 9 10Qmax m3/s 92.3 97.2 102 106.9 111.7 116.6 121.4 126.3 131.1 136FSL EL.m 420 420 420 420 420 420 420 420 420 420MOL EL.m 398.8 399 399.4 399.6 400 400.2 400.4 400.8 401 401.2Effective Vol. MCM 141.6 140.5 138.6 137.4 135 133.8 132.6 130.2 129 127.8TWL EL.m 302.7 302.7 302.7 302.8 302.8 302.8 302.8 302.9 302.9 302.9Loss m 3.2 3.2 3.2 3.2 3.2 3.2 3.2 3.2 3.2 3.Effective Head m 114.1 114.1 114.1 114 114 114 114 113.9 113.9 113.9Pmax MW 94 99 104 109 114 119 123 128 133 138
1 2 3 4 5 6 7 8 9 10Qmax m3/s 102.9 107.8 112.6 117.5 122.3 127.2 132 136.9 141.7 146.6FSL EL.m 425 425 425 425 425 425 425 425 425 425MOL EL.m 399.4 399.8 400 400.2 400.6 400.8 401 401.4 401.6 401.8Effective Vol. MCM 180.1 177.7 176.5 175.3 172.9 171.7 170.5 168.1 166.9 165.7TWL EL.m 302.7 302.8 302.8 302.8 302.9 302.9 302.9 302.9 302.9 303Loss m 3.2 3.2 3.2 3.2 3.2 3.2 3.2 3.2 3.2 3.Effective Head m 119.1 119 119 119 118.9 118.9 118.9 118.9 118.9 118.8Pmax MW 109 114 120 125 130 135 140 145 150 155
1 2 3 4 5 6 7 8 9 10Qmax m3/s 124.6 12383 12256 12129 12003 11876 11749 11623 11496 168.9FSL EL.m 435 435 435 435 435 435 435 435 435 435MOL EL.m 400.6 401 401.2 401.4 401.6 402 402.2 402.4 402.6 402.8Effective Vol. MCM 271.8 269.4 268.2 267 265.8 263.4 262.2 261 259.8 258.7TWL EL.m 302.9 302.9 302.9 302.9 303 303 303 303 303 303.1Loss m 3.2 3.2 3.2 3.2 3.2 3.2 3.2 3.2 3.2 3.Effective Head m 128.9 128.9 128.9 128.9 128.8 128.8 128.8 128.8 128.8 128.7Pmax MW 143 149 155 160 166 171 177 183 188 194
FSL=420
Item Unit FSL=405
Item Unit FSL=415
Item
Item Unit FSL=435
Unit FSL=410
Item Unit FSL=425
Item Unit
2
2
2
2
2
2
Note: The numbers 1 to 10 mean case No. of maximum discharge at the same FSL..
Upgrading Feasibility Study on the Upper Seti Storage Hydroelectric Project in Nepal
Final Report 10 - 55
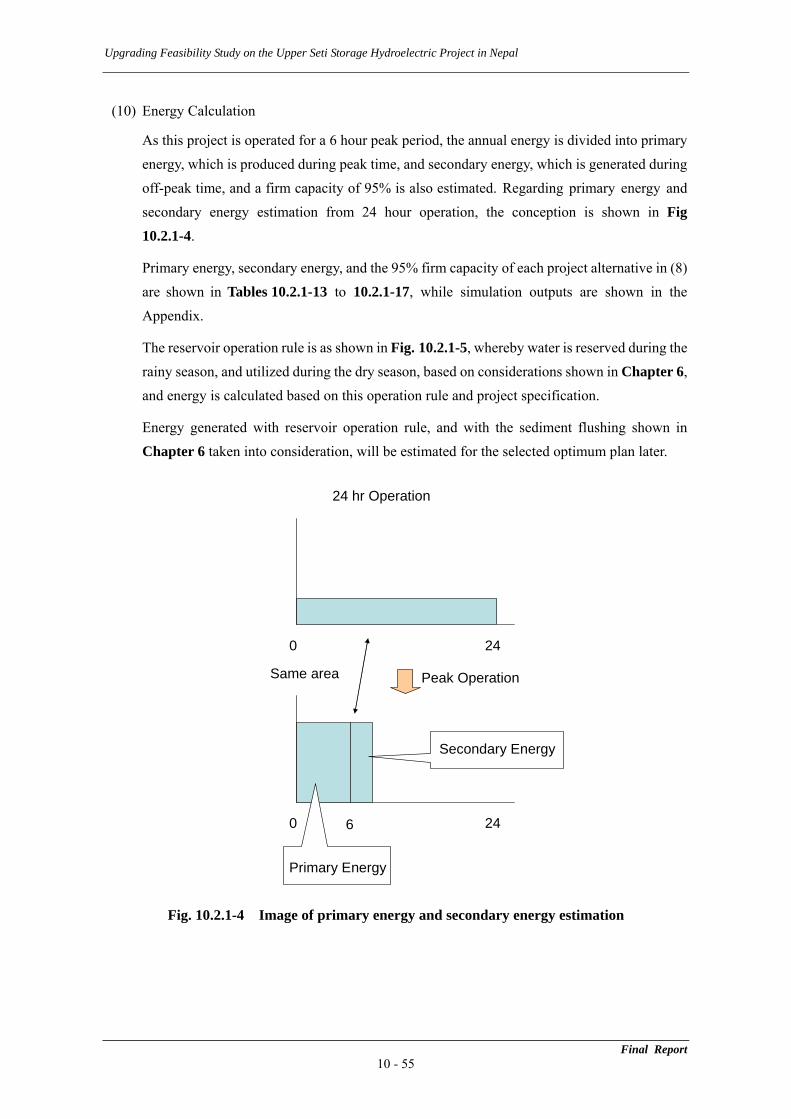
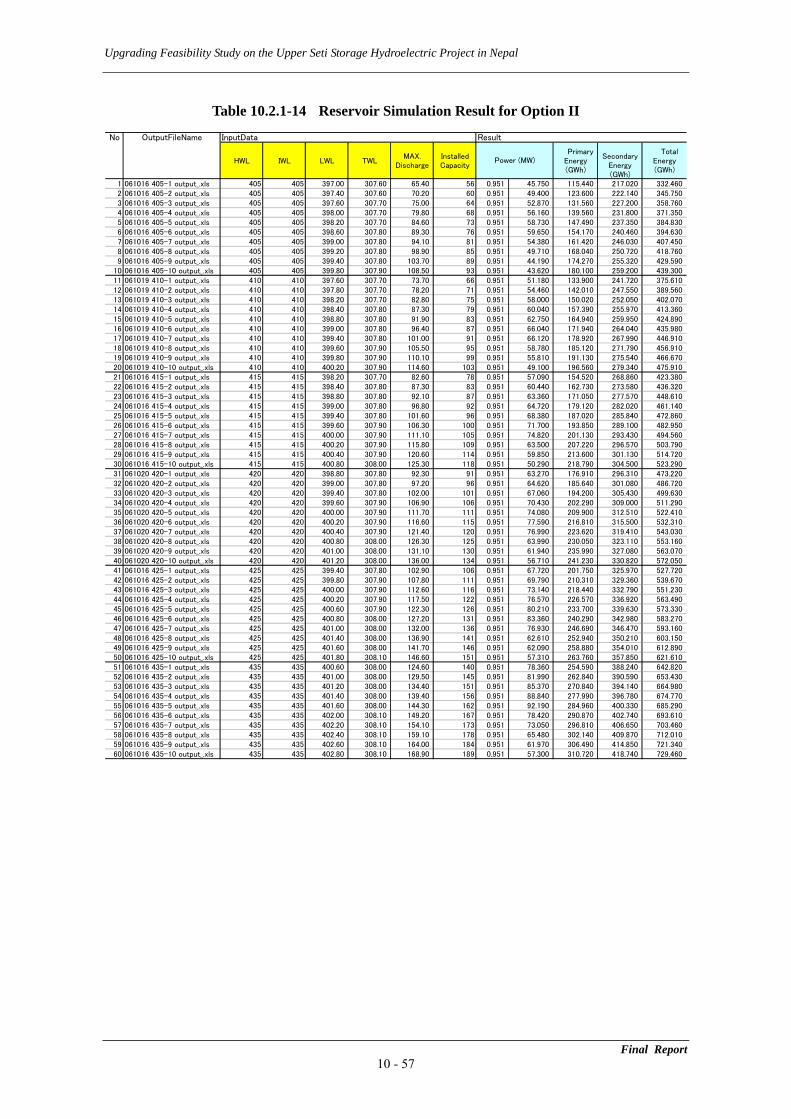
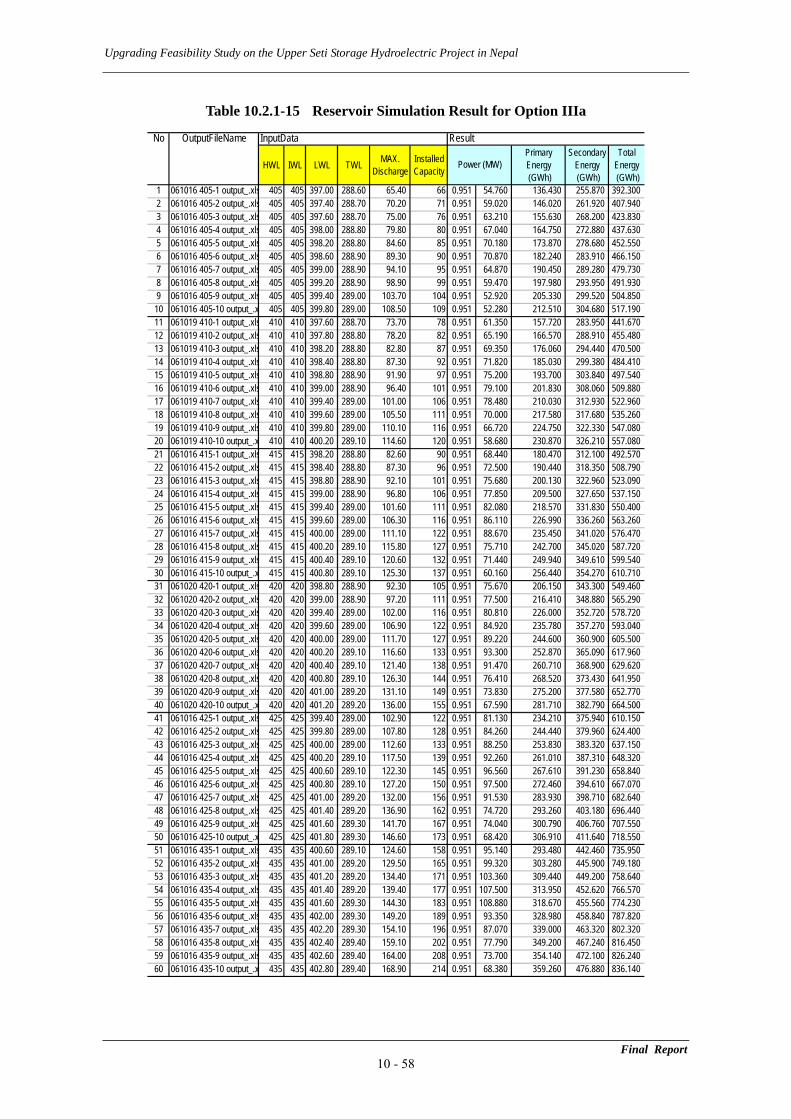
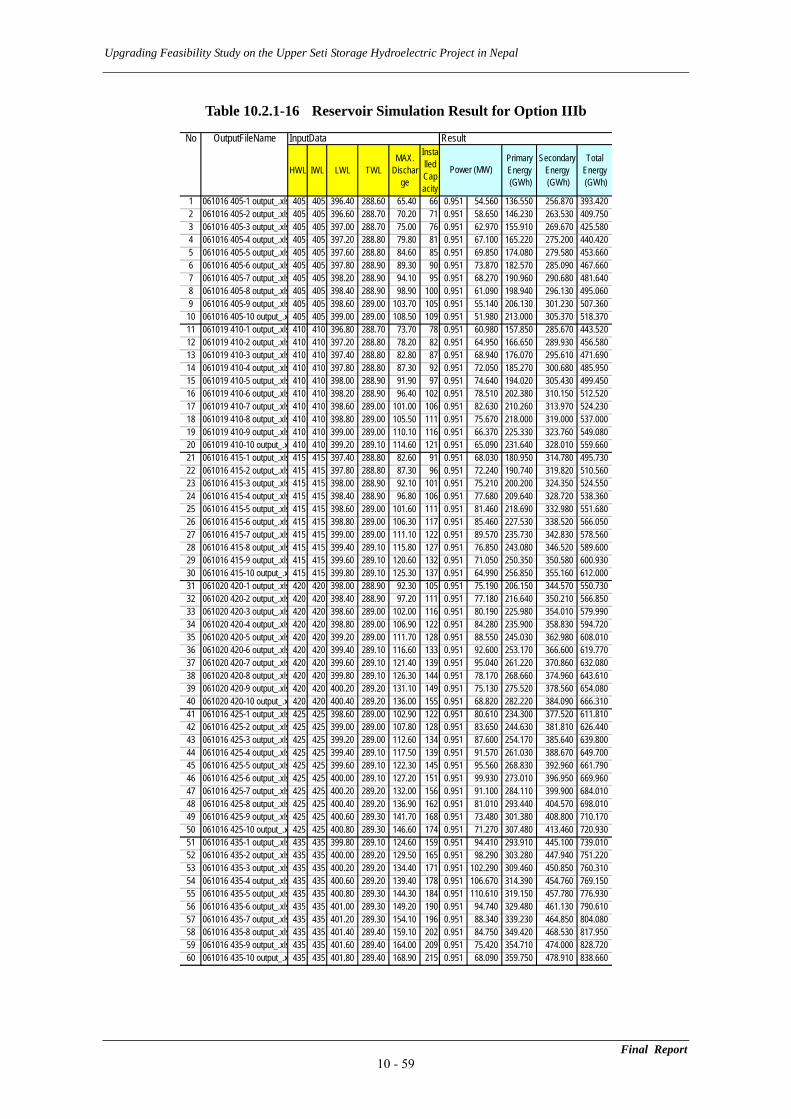
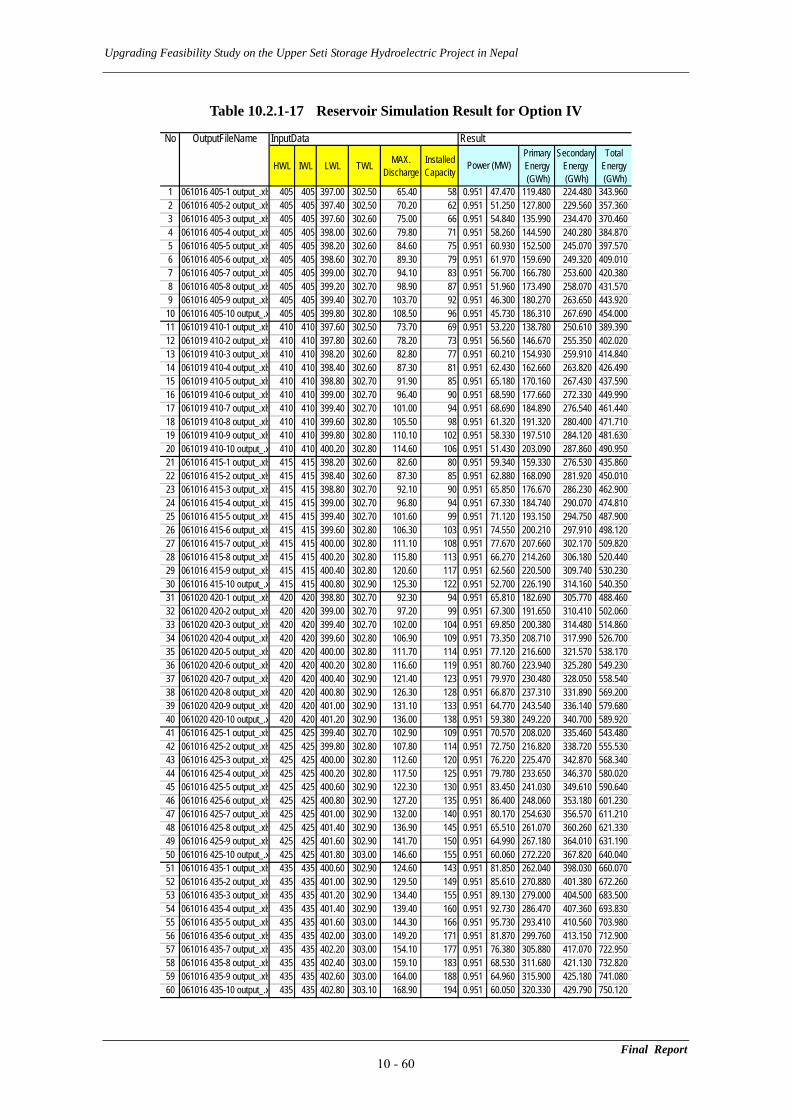
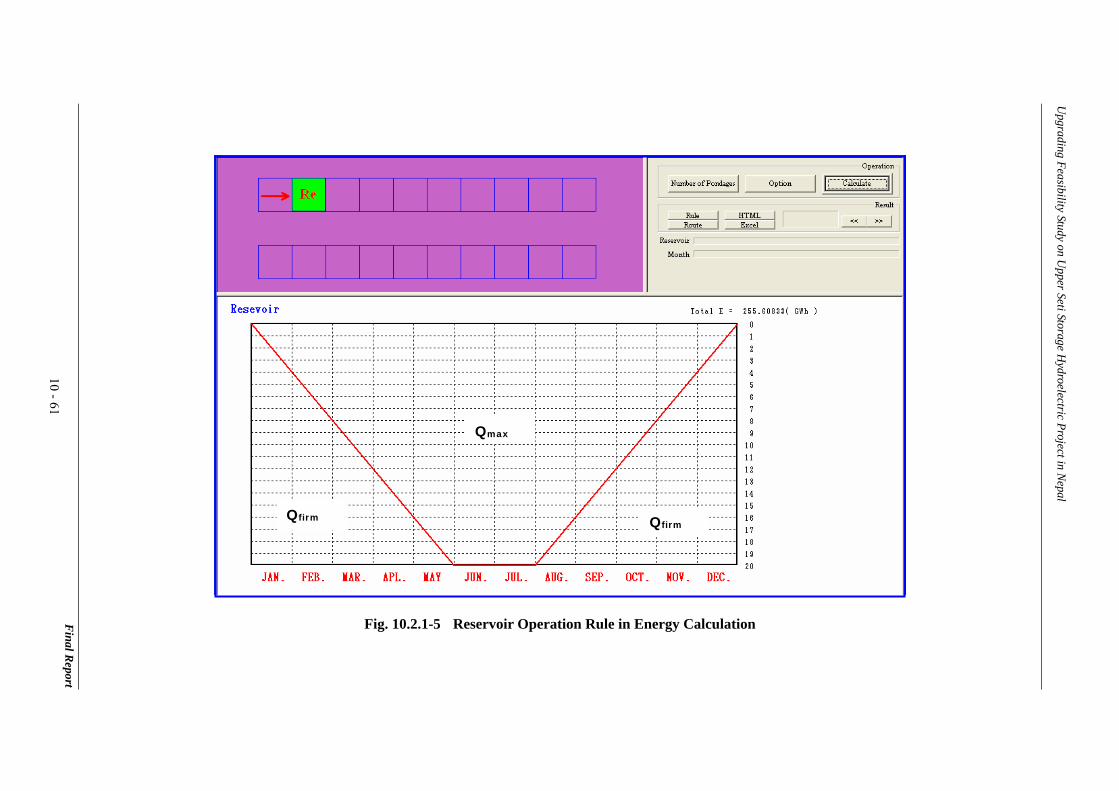
(10) Energy Calculation
As this project is operated for a 6 hour peak period, the annual energy is divided into primary energy, which is produced during peak time, and secondary energy, which is generated during off-peak time, and a firm capacity of 95% is also estimated. Regarding primary energy and secondary energy estimation from 24 hour operation, the conception is shown in Fig 10.2.1-4.
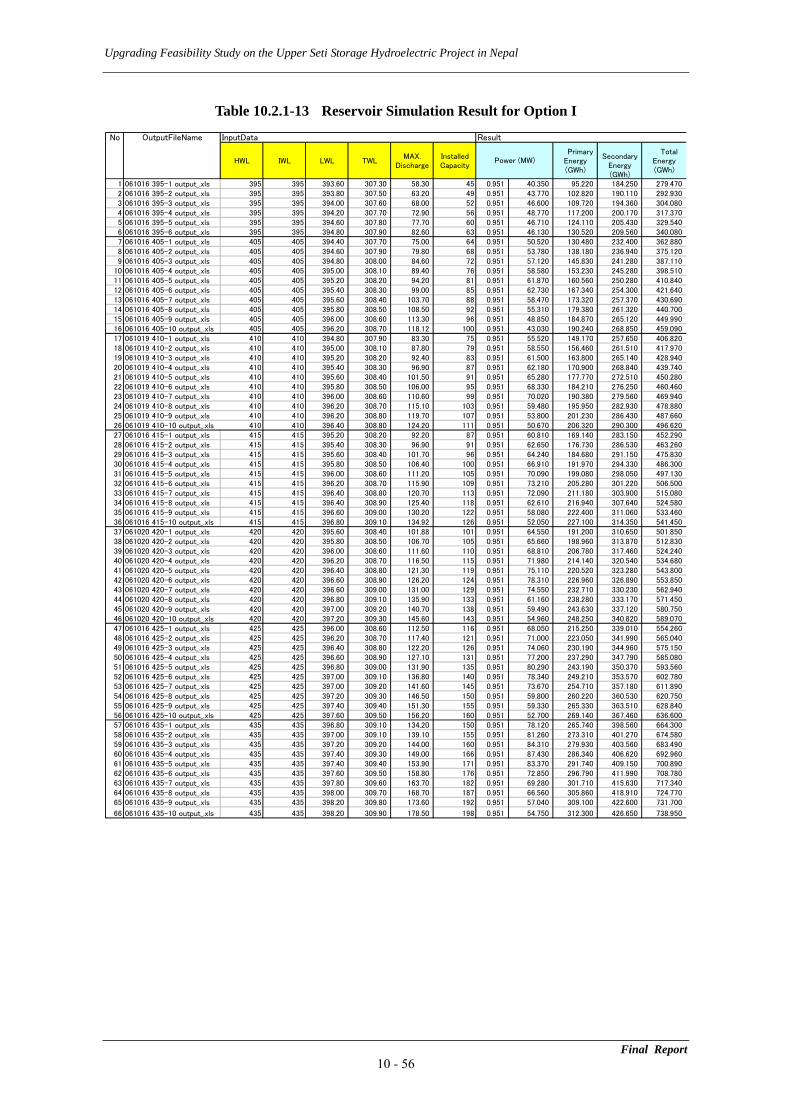
Primary energy, secondary energy, and the 95% firm capacity of each project alternative in (8) are shown in Tables 10.2.1-13 to 10.2.1-17, while simulation outputs are shown in the Appendix.
The reservoir operation rule is as shown in Fig. 10.2.1-5, whereby water is reserved during the rainy season, and utilized during the dry season, based on considerations shown in Chapter 6, and energy is calculated based on this operation rule and project specification.
Energy generated with reservoir operation rule, and with the sediment flushing shown in Chapter 6 taken into consideration, will be estimated for the selected optimum plan later.
0 2
24 hr Operation
4
0 26 4
Peak Operation
Primary Energy
Secondary Energy
Same area
Fig. 10.2.1-4 Image of primary energy and secondary energy estimation
Upgrading Feasibility Study on the Upper Seti Storage Hydroelectric Project in Nepal
Table 10.2.1-13 Reservoir Simulation Result for Option I
No OutputFileName InputData Result
HWL IWL LWL TWLMAX.
DischargeInstalledCapacity
PrimaryEnergy(GWh)
Secondary
Energy(GWh)
TotalEnergy(GWh)
1 061016 395-1 output_.xls 395 395 393.60 307.30 58.30 45 0.951 40.350 95.220 184.250 279.4702 061016 395-2 output_.xls 395 395 393.80 307.50 63.20 49 0.951 43.770 102.820 190.110 292.9303 061016 395-3 output_.xls 395 395 394.00 307.60 68.00 52 0.951 46.600 109.720 194.360 304.0804 061016 395-4 output_.xls 395 395 394.20 307.70 72.90 56 0.951 48.770 117.200 200.170 317.3705 061016 395-5 output_.xls 395 395 394.60 307.80 77.70 60 0.951 46.710 124.110 205.430 329.5406 061016 395-6 output_.xls 395 395 394.80 307.90 82.60 63 0.951 46.130 130.520 209.560 340.0807 061016 405-1 output_.xls 405 405 394.40 307.70 75.00 64 0.951 50.520 130.480 232.400 362.8808 061016 405-2 output_.xls 405 405 394.60 307.90 79.80 68 0.951 53.780 138.180 236.940 375.1209 061016 405-3 output_.xls 405 405 394.80 308.00 84.60 72 0.951 57.120 145.830 241.280 387.110
10 061016 405-4 output_.xls 405 405 395.00 308.10 89.40 76 0.951 58.580 153.230 245.280 398.51011 061016 405-5 output_.xls 405 405 395.20 308.20 94.20 81 0.951 61.870 160.560 250.280 410.84012 061016 405-6 output_.xls 405 405 395.40 308.30 99.00 85 0.951 62.730 167.340 254.300 421.64013 061016 405-7 output_.xls 405 405 395.60 308.40 103.70 88 0.951 58.470 173.320 257.370 430.69014 061016 405-8 output_.xls 405 405 395.80 308.50 108.50 92 0.951 55.310 179.380 261.320 440.70015 061016 405-9 output_.xls 405 405 396.00 308.60 113.30 96 0.951 48.850 184.870 265.120 449.99016 061016 405-10 output_.xls 405 405 396.20 308.70 118.12 100 0.951 43.030 190.240 268.850 459.09017 061019 410-1 output_.xls 410 410 394.80 307.90 83.30 75 0.951 55.520 149.170 257.650 406.82018 061019 410-2 output_.xls 410 410 395.00 308.10 87.80 79 0.951 58.550 156.460 261.510 417.97019 061019 410-3 output_.xls 410 410 395.20 308.20 92.40 83 0.951 61.500 163.800 265.140 428.94020 061019 410-4 output_.xls 410 410 395.40 308.30 96.90 87 0.951 62.180 170.900 268.840 439.74021 061019 410-5 output_.xls 410 410 395.60 308.40 101.50 91 0.951 65.280 177.770 272.510 450.28022 061019 410-6 output_.xls 410 410 395.80 308.50 106.00 95 0.951 68.330 184.210 276.250 460.46023 061019 410-7 output_.xls 410 410 396.00 308.60 110.60 99 0.951 70.020 190.380 279.560 469.94024 061019 410-8 output_.xls 410 410 396.20 308.70 115.10 103 0.951 59.480 195.950 282.930 478.88025 061019 410-9 output_.xls 410 410 396.20 308.80 119.70 107 0.951 53.800 201.230 286.430 487.66026 061019 410-10 output_.xls 410 410 396.40 308.80 124.20 111 0.951 50.670 206.320 290.300 496.62027 061016 415-1 output_.xls 415 415 395.20 308.20 92.20 87 0.951 60.810 169.140 283.150 452.29028 061016 415-2 output_.xls 415 415 395.40 308.30 96.90 91 0.951 62.650 176.730 286.530 463.26029 061016 415-3 output_.xls 415 415 395.60 308.40 101.70 96 0.951 64.240 184.680 291.150 475.83030 061016 415-4 output_.xls 415 415 395.80 308.50 106.40 100 0.951 66.910 191.970 294.330 486.30031 061016 415-5 output_.xls 415 415 396.00 308.60 111.20 105 0.951 70.090 199.080 298.050 497.13032 061016 415-6 output_.xls 415 415 396.20 308.70 115.90 109 0.951 73.210 205.280 301.220 506.50033 061016 415-7 output_.xls 415 415 396.40 308.80 120.70 113 0.951 72.090 211.180 303.900 515.08034 061016 415-8 output_.xls 415 415 396.40 308.90 125.40 118 0.951 62.610 216.940 307.640 524.58035 061016 415-9 output_.xls 415 415 396.60 309.00 130.20 122 0.951 58.080 222.400 311.060 533.46036 061016 415-10 output_.xls 415 415 396.80 309.10 134.92 126 0.951 52.050 227.100 314.350 541.45037 061020 420-1 output_.xls 420 420 395.60 308.40 101.88 101 0.951 64.550 191.200 310.650 501.85038 061020 420-2 output_.xls 420 420 395.80 308.50 106.70 105 0.951 65.660 198.960 313.870 512.83039 061020 420-3 output_.xls 420 420 396.00 308.60 111.60 110 0.951 68.810 206.780 317.460 524.24040 061020 420-4 output_.xls 420 420 396.20 308.70 116.50 115 0.951 71.980 214.140 320.540 534.68041 061020 420-5 output_.xls 420 420 396.40 308.80 121.30 119 0.951 75.110 220.520 323.280 543.80042 061020 420-6 output_.xls 420 420 396.60 308.90 126.20 124 0.951 78.310 226.960 326.890 553.85043 061020 420-7 output_.xls 420 420 396.60 309.00 131.00 129 0.951 74.550 232.710 330.230 562.94044 061020 420-8 output_.xls 420 420 396.80 309.10 135.90 133 0.951 61.160 238.280 333.170 571.45045 061020 420-9 output_.xls 420 420 397.00 309.20 140.70 138 0.951 59.490 243.630 337.120 580.75046 061020 420-10 output_.xls 420 420 397.20 309.30 145.60 143 0.951 54.960 248.250 340.820 589.07047 061016 425-1 output_.xls 425 425 396.00 308.60 112.50 116 0.951 68.050 215.250 339.010 554.26048 061016 425-2 output_.xls 425 425 396.20 308.70 117.40 121 0.951 71.000 223.050 341.990 565.04049 061016 425-3 output_.xls 425 425 396.40 308.80 122.20 126 0.951 74.060 230.190 344.960 575.15050 061016 425-4 output_.xls 425 425 396.60 308.90 127.10 131 0.951 77.200 237.290 347.790 585.08051 061016 425-5 output_.xls 425 425 396.80 309.00 131.90 135 0.951 80.290 243.190 350.370 593.56052 061016 425-6 output_.xls 425 425 397.00 309.10 136.80 140 0.951 78.340 249.210 353.570 602.78053 061016 425-7 output_.xls 425 425 397.00 309.20 141.60 145 0.951 73.670 254.710 357.180 611.89054 061016 425-8 output_.xls 425 425 397.20 309.30 146.50 150 0.951 59.800 260.220 360.530 620.75055 061016 425-9 output_.xls 425 425 397.40 309.40 151.30 155 0.951 59.330 265.330 363.510 628.84056 061016 425-10 output_.xls 425 425 397.60 309.50 156.20 160 0.951 52.700 269.140 367.460 636.60057 061016 435-1 output_.xls 435 435 396.80 309.10 134.20 150 0.951 78.120 265.740 398.560 664.30058 061016 435-2 output_.xls 435 435 397.00 309.10 139.10 155 0.951 81.260 273.310 401.270 674.58059 061016 435-3 output_.xls 435 435 397.20 309.20 144.00 160 0.951 84.310 279.930 403.560 683.49060 061016 435-4 output_.xls 435 435 397.40 309.30 149.00 166 0.951 87.430 286.340 406.620 692.96061 061016 435-5 output_.xls 435 435 397.40 309.40 153.90 171 0.951 83.370 291.740 409.150 700.89062 061016 435-6 output_.xls 435 435 397.60 309.50 158.80 176 0.951 72.850 296.790 411.990 708.78063 061016 435-7 output_.xls 435 435 397.80 309.60 163.70 182 0.951 69.280 301.710 415.630 717.34064 061016 435-8 output_.xls 435 435 398.00 309.70 168.70 187 0.951 66.560 305.860 418.910 724.77065 061016 435-9 output_.xls 435 435 398.20 309.80 173.60 192 0.951 57.040 309.100 422.600 731.700
66 061016 435-10 output_.xls 435 435 398.20 309.90 178.50 198 0.951 54.750 312.300 426.650 738.950
Power (MW)
Final Report 10 - 56
Upgrading Feasibility Study on the Upper Seti Storage Hydroelectric Project in Nepal
Table 10.2.1-14 Reservoir Simulation Result for Option II
No OutputFileName InputData Result
HWL IWL LWL TWLMAX.
DischargeInstalledCapacity
PrimaryEnergy(GWh)
Secondary
Energy(GWh)
TotalEnergy(GWh)
1 061016 405-1 output_.xls 405 405 397.00 307.60 65.40 56 0.951 45.750 115.440 217.020 332.4602 061016 405-2 output_.xls 405 405 397.40 307.60 70.20 60 0.951 49.400 123.600 222.140 345.7503 061016 405-3 output_.xls 405 405 397.60 307.70 75.00 64 0.951 52.870 131.560 227.200 358.7604 061016 405-4 output_.xls 405 405 398.00 307.70 79.80 68 0.951 56.160 139.560 231.800 371.3505 061016 405-5 output_.xls 405 405 398.20 307.70 84.60 73 0.951 58.730 147.490 237.350 384.8306 061016 405-6 output_.xls 405 405 398.60 307.80 89.30 76 0.951 59.650 154.170 240.460 394.6307 061016 405-7 output_.xls 405 405 399.00 307.80 94.10 81 0.951 54.380 161.420 246.030 407.4508 061016 405-8 output_.xls 405 405 399.20 307.80 98.90 85 0.951 49.710 168.040 250.720 418.7609 061016 405-9 output_.xls 405 405 399.40 307.80 103.70 89 0.951 44.190 174.270 255.320 429.590
10 061016 405-10 output_.xls 405 405 399.80 307.90 108.50 93 0.951 43.620 180.100 259.200 439.30011 061019 410-1 output_.xls 410 410 397.60 307.70 73.70 66 0.951 51.180 133.900 241.720 375.61012 061019 410-2 output_.xls 410 410 397.80 307.70 78.20 71 0.951 54.460 142.010 247.550 389.56013 061019 410-3 output_.xls 410 410 398.20 307.70 82.80 75 0.951 58.000 150.020 252.050 402.07014 061019 410-4 output_.xls 410 410 398.40 307.80 87.30 79 0.951 60.040 157.390 255.970 413.36015 061019 410-5 output_.xls 410 410 398.80 307.80 91.90 83 0.951 62.750 164.940 259.950 424.89016 061019 410-6 output_.xls 410 410 399.00 307.80 96.40 87 0.951 66.040 171.940 264.040 435.98017 061019 410-7 output_.xls 410 410 399.40 307.80 101.00 91 0.951 66.120 178.920 267.990 446.91018 061019 410-8 output_.xls 410 410 399.60 307.90 105.50 95 0.951 58.780 185.120 271.790 456.91019 061019 410-9 output_.xls 410 410 399.80 307.90 110.10 99 0.951 55.810 191.130 275.540 466.67020 061019 410-10 output_.xls 410 410 400.20 307.90 114.60 103 0.951 49.100 196.560 279.340 475.91021 061016 415-1 output_.xls 415 415 398.20 307.70 82.60 78 0.951 57.090 154.520 268.860 423.38022 061016 415-2 output_.xls 415 415 398.40 307.80 87.30 83 0.951 60.440 162.730 273.580 436.32023 061016 415-3 output_.xls 415 415 398.80 307.80 92.10 87 0.951 63.360 171.050 277.570 448.61024 061016 415-4 output_.xls 415 415 399.00 307.80 96.80 92 0.951 64.720 179.120 282.020 461.14025 061016 415-5 output_.xls 415 415 399.40 307.80 101.60 96 0.951 68.380 187.020 285.840 472.86026 061016 415-6 output_.xls 415 415 399.60 307.90 106.30 100 0.951 71.700 193.850 289.100 482.95027 061016 415-7 output_.xls 415 415 400.00 307.90 111.10 105 0.951 74.820 201.130 293.430 494.56028 061016 415-8 output_.xls 415 415 400.20 307.90 115.80 109 0.951 63.500 207.220 296.570 503.79029 061016 415-9 output_.xls 415 415 400.40 307.90 120.60 114 0.951 59.850 213.600 301.130 514.72030 061016 415-10 output_.xls 415 415 400.80 308.00 125.30 118 0.951 50.290 218.790 304.500 523.29031 061020 420-1 output_.xls 420 420 398.80 307.80 92.30 91 0.951 63.270 176.910 296.310 473.22032 061020 420-2 output_.xls 420 420 399.00 307.80 97.20 96 0.951 64.620 185.640 301.080 486.72033 061020 420-3 output_.xls 420 420 399.40 307.80 102.00 101 0.951 67.060 194.200 305.430 499.63034 061020 420-4 output_.xls 420 420 399.60 307.90 106.90 106 0.951 70.430 202.290 309.000 511.29035 061020 420-5 output_.xls 420 420 400.00 307.90 111.70 111 0.951 74.080 209.900 312.510 522.41036 061020 420-6 output_.xls 420 420 400.20 307.90 116.60 115 0.951 77.590 216.810 315.500 532.31037 061020 420-7 output_.xls 420 420 400.40 307.90 121.40 120 0.951 76.990 223.620 319.410 543.03038 061020 420-8 output_.xls 420 420 400.80 308.00 126.30 125 0.951 63.990 230.050 323.110 553.16039 061020 420-9 output_.xls 420 420 401.00 308.00 131.10 130 0.951 61.940 235.990 327.080 563.07040 061020 420-10 output_.xls 420 420 401.20 308.00 136.00 134 0.951 56.710 241.230 330.820 572.05041 061016 425-1 output_.xls 425 425 399.40 307.80 102.90 106 0.951 67.720 201.750 325.970 527.72042 061016 425-2 output_.xls 425 425 399.80 307.90 107.80 111 0.951 69.790 210.310 329.360 539.67043 061016 425-3 output_.xls 425 425 400.00 307.90 112.60 116 0.951 73.140 218.440 332.790 551.23044 061016 425-4 output_.xls 425 425 400.20 307.90 117.50 122 0.951 76.570 226.570 336.920 563.49045 061016 425-5 output_.xls 425 425 400.60 307.90 122.30 126 0.951 80.210 233.700 339.630 573.33046 061016 425-6 output_.xls 425 425 400.80 308.00 127.20 131 0.951 83.360 240.290 342.980 583.27047 061016 425-7 output_.xls 425 425 401.00 308.00 132.00 136 0.951 76.930 246.690 346.470 593.16048 061016 425-8 output_.xls 425 425 401.40 308.00 136.90 141 0.951 62.610 252.940 350.210 603.15049 061016 425-9 output_.xls 425 425 401.60 308.00 141.70 146 0.951 62.090 258.880 354.010 612.89050 061016 425-10 output_.xls 425 425 401.80 308.10 146.60 151 0.951 57.310 263.760 357.850 621.61051 061016 435-1 output_.xls 435 435 400.60 308.00 124.60 140 0.951 78.360 254.590 388.240 642.82052 061016 435-2 output_.xls 435 435 401.00 308.00 129.50 145 0.951 81.990 262.840 390.590 653.43053 061016 435-3 output_.xls 435 435 401.20 308.00 134.40 151 0.951 85.370 270.840 394.140 664.98054 061016 435-4 output_.xls 435 435 401.40 308.00 139.40 156 0.951 88.840 277.990 396.780 674.77055 061016 435-5 output_.xls 435 435 401.60 308.00 144.30 162 0.951 92.190 284.960 400.330 685.29056 061016 435-6 output_.xls 435 435 402.00 308.10 149.20 167 0.951 78.420 290.870 402.740 693.61057 061016 435-7 output_.xls 435 435 402.20 308.10 154.10 173 0.951 73.050 296.810 406.650 703.46058 061016 435-8 output_.xls 435 435 402.40 308.10 159.10 178 0.951 65.480 302.140 409.870 712.01059 061016 435-9 output_.xls 435 435 402.60 308.10 164.00 184 0.951 61.970 306.490 414.850 721.34060 061016 435-10 output_.xls 435 435 402.80 308.10 168.90 189 0.951 57.300 310.720 418.740 729.460
Power (MW)
Final Report 10 - 57
Upgrading Feasibility Study on the Upper Seti Storage Hydroelectric Project in Nepal
Table 10.2.1-15 Reservoir Simulation Result for Option IIIa
No OutputFileName InputData Result
HWL IWL LWL TWL MAX.Discharge
InstalledCapacity
PrimaryEnergy (GWh)
SecondaryEnergy (GWh)
TotalEnergy (GWh)
1 061016 405-1 output_.xls 405 405 397.00 288.60 65.40 66 0.951 54.760 136.430 255.870 392.3002 061016 405-2 output_.xls 405 405 397.40 288.70 70.20 71 0.951 59.020 146.020 261.920 407.9403 061016 405-3 output_.xls 405 405 397.60 288.70 75.00 76 0.951 63.210 155.630 268.200 423.8304 061016 405-4 output_.xls 405 405 398.00 288.80 79.80 80 0.951 67.040 164.750 272.880 437.6305 061016 405-5 output_.xls 405 405 398.20 288.80 84.60 85 0.951 70.180 173.870 278.680 452.5506 061016 405-6 output_.xls 405 405 398.60 288.90 89.30 90 0.951 70.870 182.240 283.910 466.1507 061016 405-7 output_.xls 405 405 399.00 288.90 94.10 95 0.951 64.870 190.450 289.280 479.7308 061016 405-8 output_.xls 405 405 399.20 288.90 98.90 99 0.951 59.470 197.980 293.950 491.9309 061016 405-9 output_.xls 405 405 399.40 289.00 103.70 104 0.951 52.920 205.330 299.520 504.85010 061016 405-10 output_.x 405 405 399.80 289.00 108.50 109 0.951 52.280 212.510 304.680 517.19011 061019 410-1 output_.xls 410 410 397.60 288.70 73.70 78 0.951 61.350 157.720 283.950 441.67012 061019 410-2 output_.xls 410 410 397.80 288.80 78.20 82 0.951 65.190 166.570 288.910 455.48013 061019 410-3 output_.xls 410 410 398.20 288.80 82.80 87 0.951 69.350 176.060 294.440 470.50014 061019 410-4 output_.xls 410 410 398.40 288.80 87.30 92 0.951 71.820 185.030 299.380 484.41015 061019 410-5 output_.xls 410 410 398.80 288.90 91.90 97 0.951 75.200 193.700 303.840 497.54016 061019 410-6 output_.xls 410 410 399.00 288.90 96.40 101 0.951 79.100 201.830 308.060 509.88017 061019 410-7 output_.xls 410 410 399.40 289.00 101.00 106 0.951 78.480 210.030 312.930 522.96018 061019 410-8 output_.xls 410 410 399.60 289.00 105.50 111 0.951 70.000 217.580 317.680 535.26019 061019 410-9 output_.xls 410 410 399.80 289.00 110.10 116 0.951 66.720 224.750 322.330 547.08020 061019 410-10 output_.x 410 410 400.20 289.10 114.60 120 0.951 58.680 230.870 326.210 557.08021 061016 415-1 output_.xls 415 415 398.20 288.80 82.60 90 0.951 68.440 180.470 312.100 492.57022 061016 415-2 output_.xls 415 415 398.40 288.80 87.30 96 0.951 72.500 190.440 318.350 508.79023 061016 415-3 output_.xls 415 415 398.80 288.90 92.10 101 0.951 75.680 200.130 322.960 523.09024 061016 415-4 output_.xls 415 415 399.00 288.90 96.80 106 0.951 77.850 209.500 327.650 537.15025 061016 415-5 output_.xls 415 415 399.40 289.00 101.60 111 0.951 82.080 218.570 331.830 550.40026 061016 415-6 output_.xls 415 415 399.60 289.00 106.30 116 0.951 86.110 226.990 336.260 563.26027 061016 415-7 output_.xls 415 415 400.00 289.00 111.10 122 0.951 88.670 235.450 341.020 576.47028 061016 415-8 output_.xls 415 415 400.20 289.10 115.80 127 0.951 75.710 242.700 345.020 587.72029 061016 415-9 output_.xls 415 415 400.40 289.10 120.60 132 0.951 71.440 249.940 349.610 599.54030 061016 415-10 output_.x 415 415 400.80 289.10 125.30 137 0.951 60.160 256.440 354.270 610.71031 061020 420-1 output_.xls 420 420 398.80 288.90 92.30 105 0.951 75.670 206.150 343.300 549.46032 061020 420-2 output_.xls 420 420 399.00 288.90 97.20 111 0.951 77.500 216.410 348.880 565.29033 061020 420-3 output_.xls 420 420 399.40 289.00 102.00 116 0.951 80.810 226.000 352.720 578.72034 061020 420-4 output_.xls 420 420 399.60 289.00 106.90 122 0.951 84.920 235.780 357.270 593.04035 061020 420-5 output_.xls 420 420 400.00 289.00 111.70 127 0.951 89.220 244.600 360.900 605.50036 061020 420-6 output_.xls 420 420 400.20 289.10 116.60 133 0.951 93.300 252.870 365.090 617.96037 061020 420-7 output_.xls 420 420 400.40 289.10 121.40 138 0.951 91.470 260.710 368.900 629.62038 061020 420-8 output_.xls 420 420 400.80 289.10 126.30 144 0.951 76.410 268.520 373.430 641.95039 061020 420-9 output_.xls 420 420 401.00 289.20 131.10 149 0.951 73.830 275.200 377.580 652.77040 061020 420-10 output_.x 420 420 401.20 289.20 136.00 155 0.951 67.590 281.710 382.790 664.50041 061016 425-1 output_.xls 425 425 399.40 289.00 102.90 122 0.951 81.130 234.210 375.940 610.15042 061016 425-2 output_.xls 425 425 399.80 289.00 107.80 128 0.951 84.260 244.440 379.960 624.40043 061016 425-3 output_.xls 425 425 400.00 289.00 112.60 133 0.951 88.250 253.830 383.320 637.15044 061016 425-4 output_.xls 425 425 400.20 289.10 117.50 139 0.951 92.260 261.010 387.310 648.32045 061016 425-5 output_.xls 425 425 400.60 289.10 122.30 145 0.951 96.560 267.610 391.230 658.84046 061016 425-6 output_.xls 425 425 400.80 289.10 127.20 150 0.951 97.500 272.460 394.610 667.07047 061016 425-7 output_.xls 425 425 401.00 289.20 132.00 156 0.951 91.530 283.930 398.710 682.64048 061016 425-8 output_.xls 425 425 401.40 289.20 136.90 162 0.951 74.720 293.260 403.180 696.44049 061016 425-9 output_.xls 425 425 401.60 289.30 141.70 167 0.951 74.040 300.790 406.760 707.55050 061016 425-10 output_.x 425 425 401.80 289.30 146.60 173 0.951 68.420 306.910 411.640 718.55051 061016 435-1 output_.xls 435 435 400.60 289.10 124.60 158 0.951 95.140 293.480 442.460 735.95052 061016 435-2 output_.xls 435 435 401.00 289.20 129.50 165 0.951 99.320 303.280 445.900 749.18053 061016 435-3 output_.xls 435 435 401.20 289.20 134.40 171 0.951 103.360 309.440 449.200 758.64054 061016 435-4 output_.xls 435 435 401.40 289.20 139.40 177 0.951 107.500 313.950 452.620 766.57055 061016 435-5 output_.xls 435 435 401.60 289.30 144.30 183 0.951 108.880 318.670 455.560 774.23056 061016 435-6 output_.xls 435 435 402.00 289.30 149.20 189 0.951 93.350 328.980 458.840 787.82057 061016 435-7 output_.xls 435 435 402.20 289.30 154.10 196 0.951 87.070 339.000 463.320 802.32058 061016 435-8 output_.xls 435 435 402.40 289.40 159.10 202 0.951 77.790 349.200 467.240 816.45059 061016 435-9 output_.xls 435 435 402.60 289.40 164.00 208 0.951 73.700 354.140 472.100 826.24060 061016 435-10 output_.x 435 435 402.80 289.40 168.90 214 0.951 68.380 359.260 476.880 836.140
Power (MW)
Final Report 10 - 58
Upgrading Feasibility Study on the Upper Seti Storage Hydroelectric Project in Nepal
Table 10.2.1-16 Reservoir Simulation Result for Option IIIb
No OutputFileName InputData Result
HWL IWL LWL TWLMAX.
Discharge
InstalledCapacity
PrimaryEnergy (GWh)
SecondaryEnergy (GWh)
TotalEnergy (GWh)
1 061016 405-1 output_.xls 405 405 396.40 288.60 65.40 66 0.951 54.560 136.550 256.870 393.4202 061016 405-2 output_.xls 405 405 396.60 288.70 70.20 71 0.951 58.650 146.230 263.530 409.7503 061016 405-3 output_.xls 405 405 397.00 288.70 75.00 76 0.951 62.970 155.910 269.670 425.5804 061016 405-4 output_.xls 405 405 397.20 288.80 79.80 81 0.951 67.100 165.220 275.200 440.4205 061016 405-5 output_.xls 405 405 397.60 288.80 84.60 85 0.951 69.850 174.080 279.580 453.6606 061016 405-6 output_.xls 405 405 397.80 288.90 89.30 90 0.951 73.870 182.570 285.090 467.6607 061016 405-7 output_.xls 405 405 398.20 288.90 94.10 95 0.951 68.270 190.960 290.680 481.6408 061016 405-8 output_.xls 405 405 398.40 288.90 98.90 100 0.951 61.090 198.940 296.130 495.0609 061016 405-9 output_.xls 405 405 398.60 289.00 103.70 105 0.951 55.140 206.130 301.230 507.360
10 061016 405-10 output_.x 405 405 399.00 289.00 108.50 109 0.951 51.980 213.000 305.370 518.37011 061019 410-1 output_.xls 410 410 396.80 288.70 73.70 78 0.951 60.980 157.850 285.670 443.52012 061019 410-2 output_.xls 410 410 397.20 288.80 78.20 82 0.951 64.950 166.650 289.930 456.58013 061019 410-3 output_.xls 410 410 397.40 288.80 82.80 87 0.951 68.940 176.070 295.610 471.69014 061019 410-4 output_.xls 410 410 397.80 288.80 87.30 92 0.951 72.050 185.270 300.680 485.95015 061019 410-5 output_.xls 410 410 398.00 288.90 91.90 97 0.951 74.640 194.020 305.430 499.45016 061019 410-6 output_.xls 410 410 398.20 288.90 96.40 102 0.951 78.510 202.380 310.150 512.52017 061019 410-7 output_.xls 410 410 398.60 289.00 101.00 106 0.951 82.630 210.260 313.970 524.23018 061019 410-8 output_.xls 410 410 398.80 289.00 105.50 111 0.951 75.670 218.000 319.000 537.00019 061019 410-9 output_.xls 410 410 399.00 289.00 110.10 116 0.951 66.370 225.330 323.760 549.08020 061019 410-10 output_.x 410 410 399.20 289.10 114.60 121 0.951 65.090 231.640 328.010 559.66021 061016 415-1 output_.xls 415 415 397.40 288.80 82.60 91 0.951 68.030 180.950 314.780 495.73022 061016 415-2 output_.xls 415 415 397.80 288.80 87.30 96 0.951 72.240 190.740 319.820 510.56023 061016 415-3 output_.xls 415 415 398.00 288.90 92.10 101 0.951 75.210 200.200 324.350 524.55024 061016 415-4 output_.xls 415 415 398.40 288.90 96.80 106 0.951 77.680 209.640 328.720 538.36025 061016 415-5 output_.xls 415 415 398.60 289.00 101.60 111 0.951 81.460 218.690 332.980 551.68026 061016 415-6 output_.xls 415 415 398.80 289.00 106.30 117 0.951 85.460 227.530 338.520 566.05027 061016 415-7 output_.xls 415 415 399.00 289.00 111.10 122 0.951 89.570 235.730 342.830 578.56028 061016 415-8 output_.xls 415 415 399.40 289.10 115.80 127 0.951 76.850 243.080 346.520 589.60029 061016 415-9 output_.xls 415 415 399.60 289.10 120.60 132 0.951 71.050 250.350 350.580 600.93030 061016 415-10 output_.x 415 415 399.80 289.10 125.30 137 0.951 64.990 256.850 355.160 612.00031 061020 420-1 output_.xls 420 420 398.00 288.90 92.30 105 0.951 75.190 206.150 344.570 550.73032 061020 420-2 output_.xls 420 420 398.40 288.90 97.20 111 0.951 77.180 216.640 350.210 566.85033 061020 420-3 output_.xls 420 420 398.60 289.00 102.00 116 0.951 80.190 225.980 354.010 579.99034 061020 420-4 output_.xls 420 420 398.80 289.00 106.90 122 0.951 84.280 235.900 358.830 594.72035 061020 420-5 output_.xls 420 420 399.20 289.00 111.70 128 0.951 88.550 245.030 362.980 608.01036 061020 420-6 output_.xls 420 420 399.40 289.10 116.60 133 0.951 92.600 253.170 366.600 619.77037 061020 420-7 output_.xls 420 420 399.60 289.10 121.40 139 0.951 95.040 261.220 370.860 632.08038 061020 420-8 output_.xls 420 420 399.80 289.10 126.30 144 0.951 78.170 268.660 374.960 643.61039 061020 420-9 output_.xls 420 420 400.20 289.20 131.10 149 0.951 75.130 275.520 378.560 654.08040 061020 420-10 output_.x 420 420 400.40 289.20 136.00 155 0.951 68.820 282.220 384.090 666.31041 061016 425-1 output_.xls 425 425 398.60 289.00 102.90 122 0.951 80.610 234.300 377.520 611.81042 061016 425-2 output_.xls 425 425 399.00 289.00 107.80 128 0.951 83.650 244.630 381.810 626.44043 061016 425-3 output_.xls 425 425 399.20 289.00 112.60 134 0.951 87.600 254.170 385.640 639.80044 061016 425-4 output_.xls 425 425 399.40 289.10 117.50 139 0.951 91.570 261.030 388.670 649.70045 061016 425-5 output_.xls 425 425 399.60 289.10 122.30 145 0.951 95.560 268.830 392.960 661.79046 061016 425-6 output_.xls 425 425 400.00 289.10 127.20 151 0.951 99.930 273.010 396.950 669.96047 061016 425-7 output_.xls 425 425 400.20 289.20 132.00 156 0.951 91.100 284.110 399.900 684.01048 061016 425-8 output_.xls 425 425 400.40 289.20 136.90 162 0.951 81.010 293.440 404.570 698.01049 061016 425-9 output_.xls 425 425 400.60 289.30 141.70 168 0.951 73.480 301.380 408.800 710.17050 061016 425-10 output_.x 425 425 400.80 289.30 146.60 174 0.951 71.270 307.480 413.460 720.93051 061016 435-1 output_.xls 435 435 399.80 289.10 124.60 159 0.951 94.410 293.910 445.100 739.01052 061016 435-2 output_.xls 435 435 400.00 289.20 129.50 165 0.951 98.290 303.280 447.940 751.22053 061016 435-3 output_.xls 435 435 400.20 289.20 134.40 171 0.951 102.290 309.460 450.850 760.31054 061016 435-4 output_.xls 435 435 400.60 289.20 139.40 178 0.951 106.670 314.390 454.760 769.15055 061016 435-5 output_.xls 435 435 400.80 289.30 144.30 184 0.951 110.610 319.150 457.780 776.93056 061016 435-6 output_.xls 435 435 401.00 289.30 149.20 190 0.951 94.740 329.480 461.130 790.61057 061016 435-7 output_.xls 435 435 401.20 289.30 154.10 196 0.951 88.340 339.230 464.850 804.08058 061016 435-8 output_.xls 435 435 401.40 289.40 159.10 202 0.951 84.750 349.420 468.530 817.95059 061016 435-9 output_.xls 435 435 401.60 289.40 164.00 209 0.951 75.420 354.710 474.000 828.72060 061016 435-10 output_.x 435 435 401.80 289.40 168.90 215 0.951 68.090 359.750 478.910 838.660
Power (MW)
Final Report 10 - 59
Upgrading Feas
ibility Study on the Upper Seti Storage Hydroelectric Project in Nepal
Final Report 10 - 60
Table 10.2.1-17 Reservoir Simulation Result for Option IV
No OutputFileName InputData Result
HWL IWL LWL TWL MAX.Discharge
InstalledCapacity
PrimaryEnergy (GWh)
SecondaryEnergy (GWh)
TotalEnergy (GWh)
1 061016 405-1 output_.xls 405 405 397.00 302.50 65.40 58 0.951 47.470 119.480 224.480 343.9602 061016 405-2 output_.xls 405 405 397.40 302.50 70.20 62 0.951 51.250 127.800 229.560 357.3603 061016 405-3 output_.xls 405 405 397.60 302.60 75.00 66 0.951 54.840 135.990 234.470 370.4604 061016 405-4 output_.xls 405 405 398.00 302.60 79.80 71 0.951 58.260 144.590 240.280 384.8705 061016 405-5 output_.xls 405 405 398.20 302.60 84.60 75 0.951 60.930 152.500 245.070 397.5706 061016 405-6 output_.xls 405 405 398.60 302.70 89.30 79 0.951 61.970 159.690 249.320 409.0107 061016 405-7 output_.xls 405 405 399.00 302.70 94.10 83 0.951 56.700 166.780 253.600 420.3808 061016 405-8 output_.xls 405 405 399.20 302.70 98.90 87 0.951 51.960 173.490 258.070 431.5709 061016 405-9 output_.xls 405 405 399.40 302.70 103.70 92 0.951 46.300 180.270 263.650 443.92010 061016 405-10 output_.x 405 405 399.80 302.80 108.50 96 0.951 45.730 186.310 267.690 454.00011 061019 410-1 output_.xls 410 410 397.60 302.50 73.70 69 0.951 53.220 138.780 250.610 389.39012 061019 410-2 output_.xls 410 410 397.80 302.60 78.20 73 0.951 56.560 146.670 255.350 402.02013 061019 410-3 output_.xls 410 410 398.20 302.60 82.80 77 0.951 60.210 154.930 259.910 414.84014 061019 410-4 output_.xls 410 410 398.40 302.60 87.30 81 0.951 62.430 162.660 263.820 426.49015 061019 410-5 output_.xls 410 410 398.80 302.70 91.90 85 0.951 65.180 170.160 267.430 437.59016 061019 410-6 output_.xls 410 410 399.00 302.70 96.40 90 0.951 68.590 177.660 272.330 449.99017 061019 410-7 output_.xls 410 410 399.40 302.70 101.00 94 0.951 68.690 184.890 276.540 461.44018 061019 410-8 output_.xls 410 410 399.60 302.80 105.50 98 0.951 61.320 191.320 280.400 471.71019 061019 410-9 output_.xls 410 410 399.80 302.80 110.10 102 0.951 58.330 197.510 284.120 481.63020 061019 410-10 output_.x 410 410 400.20 302.80 114.60 106 0.951 51.430 203.090 287.860 490.95021 061016 415-1 output_.xls 415 415 398.20 302.60 82.60 80 0.951 59.340 159.330 276.530 435.86022 061016 415-2 output_.xls 415 415 398.40 302.60 87.30 85 0.951 62.880 168.090 281.920 450.01023 061016 415-3 output_.xls 415 415 398.80 302.70 92.10 90 0.951 65.850 176.670 286.230 462.90024 061016 415-4 output_.xls 415 415 399.00 302.70 96.80 94 0.951 67.330 184.740 290.070 474.81025 061016 415-5 output_.xls 415 415 399.40 302.70 101.60 99 0.951 71.120 193.150 294.750 487.90026 061016 415-6 output_.xls 415 415 399.60 302.80 106.30 103 0.951 74.550 200.210 297.910 498.12027 061016 415-7 output_.xls 415 415 400.00 302.80 111.10 108 0.951 77.670 207.660 302.170 509.82028 061016 415-8 output_.xls 415 415 400.20 302.80 115.80 113 0.951 66.270 214.260 306.180 520.44029 061016 415-9 output_.xls 415 415 400.40 302.80 120.60 117 0.951 62.560 220.500 309.740 530.23030 061016 415-10 output_.x 415 415 400.80 302.90 125.30 122 0.951 52.700 226.190 314.160 540.35031 061020 420-1 output_.xls 420 420 398.80 302.70 92.30 94 0.951 65.810 182.690 305.770 488.46032 061020 420-2 output_.xls 420 420 399.00 302.70 97.20 99 0.951 67.300 191.650 310.410 502.06033 061020 420-3 output_.xls 420 420 399.40 302.70 102.00 104 0.951 69.850 200.380 314.480 514.86034 061020 420-4 output_.xls 420 420 399.60 302.80 106.90 109 0.951 73.350 208.710 317.990 526.70035 061020 420-5 output_.xls 420 420 400.00 302.80 111.70 114 0.951 77.120 216.600 321.570 538.17036 061020 420-6 output_.xls 420 420 400.20 302.80 116.60 119 0.951 80.760 223.940 325.280 549.23037 061020 420-7 output_.xls 420 420 400.40 302.90 121.40 123 0.951 79.970 230.480 328.050 558.54038 061020 420-8 output_.xls 420 420 400.80 302.90 126.30 128 0.951 66.870 237.310 331.890 569.20039 061020 420-9 output_.xls 420 420 401.00 302.90 131.10 133 0.951 64.770 243.540 336.140 579.68040 061020 420-10 output_.x 420 420 401.20 302.90 136.00 138 0.951 59.380 249.220 340.700 589.92041 061016 425-1 output_.xls 425 425 399.40 302.70 102.90 109 0.951 70.570 208.020 335.460 543.48042 061016 425-2 output_.xls 425 425 399.80 302.80 107.80 114 0.951 72.750 216.820 338.720 555.53043 061016 425-3 output_.xls 425 425 400.00 302.80 112.60 120 0.951 76.220 225.470 342.870 568.34044 061016 425-4 output_.xls 425 425 400.20 302.80 117.50 125 0.951 79.780 233.650 346.370 580.02045 061016 425-5 output_.xls 425 425 400.60 302.90 122.30 130 0.951 83.450 241.030 349.610 590.64046 061016 425-6 output_.xls 425 425 400.80 302.90 127.20 135 0.951 86.400 248.060 353.180 601.23047 061016 425-7 output_.xls 425 425 401.00 302.90 132.00 140 0.951 80.170 254.630 356.570 611.21048 061016 425-8 output_.xls 425 425 401.40 302.90 136.90 145 0.951 65.510 261.070 360.260 621.33049 061016 425-9 output_.xls 425 425 401.60 302.90 141.70 150 0.951 64.990 267.180 364.010 631.19050 061016 425-10 output_.x 425 425 401.80 303.00 146.60 155 0.951 60.060 272.220 367.820 640.04051 061016 435-1 output_.xls 435 435 400.60 302.90 124.60 143 0.951 81.850 262.040 398.030 660.07052 061016 435-2 output_.xls 435 435 401.00 302.90 129.50 149 0.951 85.610 270.880 401.380 672.26053 061016 435-3 output_.xls 435 435 401.20 302.90 134.40 155 0.951 89.130 279.000 404.500 683.50054 061016 435-4 output_.xls 435 435 401.40 302.90 139.40 160 0.951 92.730 286.470 407.360 693.83055 061016 435-5 output_.xls 435 435 401.60 303.00 144.30 166 0.951 95.730 293.410 410.560 703.98056 061016 435-6 output_.xls 435 435 402.00 303.00 149.20 171 0.951 81.870 299.760 413.150 712.90057 061016 435-7 output_.xls 435 435 402.20 303.00 154.10 177 0.951 76.380 305.880 417.070 722.95058 061016 435-8 output_.xls 435 435 402.40 303.00 159.10 183 0.951 68.530 311.680 421.130 732.82059 061016 435-9 output_.xls 435 435 402.60 303.00 164.00 188 0.951 64.960 315.900 425.180 741.08060 061016 435-10 output_.x 435 435 402.80 303.10 168.90 194 0.951 60.050 320.330 429.790 750.120
Power (MW)
Upgrading Feasibility Study on U
pper Seti Storage Hydroelectric Project in N
epal
Fig. 10.2.1-5 Reservoir Operation Rule in Energy Calculation
Qfirm
Qmax
Qfirm
Final R
eport10
-61
Upgrading Feasibility Study on the Upper Seti Storage Hydroelectric Project in Nepal
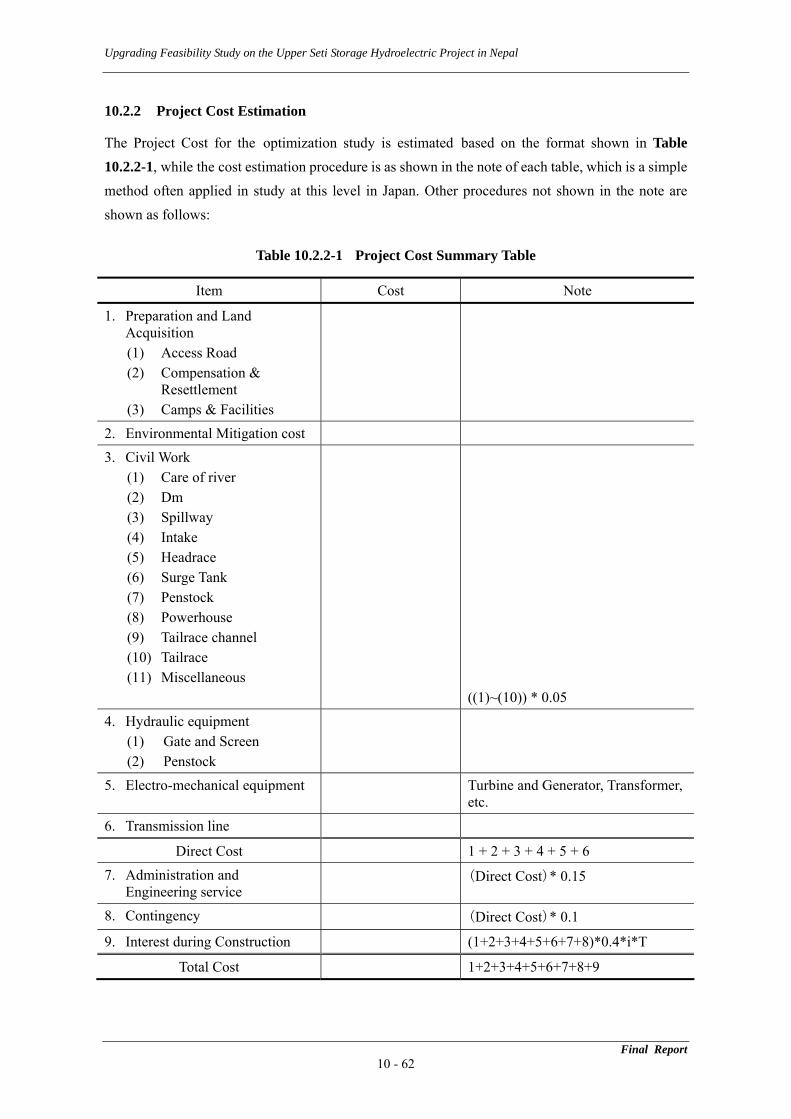
10.2.2 Project Cost Estimation
The Project Cost for the optimization study is estimated based on the format shown in Table 10.2.2-1, while the cost estimation procedure is as shown in the note of each table, which is a simple method often applied in study at this level in Japan. Other procedures not shown in the note are shown as follows:
Table 10.2.2-1 Project Cost Summary Table
Item Cost Note
1. Preparation and Land Acquisition
(1) Access Road (2) Compensation &
Resettlement
(3) Camps & Facilities 2. Environmental Mitigation cost 3. Civil Work
(1) Care of river (2) Dm (3) Spillway (4) Intake (5) Headrace (6) Surge Tank (7) Penstock (8) Powerhouse (9) Tailrace channel (10) Tailrace (11) Miscellaneous
((1)~(10)) * 0.05 4. Hydraulic equipment
(1) Gate and Screen (2) Penstock
5. Electro-mechanical equipment Turbine and Generator, Transformer, etc.
6. Transmission line
Direct Cost 1 + 2 + 3 + 4 + 5 + 6 7. Administration and
Engineering service (Direct Cost)* 0.15
8. Contingency (Direct Cost)* 0.1
9. Interest during Construction (1+2+3+4+5+6+7+8)*0.4*i*T
Total Cost 1+2+3+4+5+6+7+8+9
Final Report 10 - 62
Upgrading Feasibility Study on the Upper Seti Storage Hydroelectric Project in Nepal
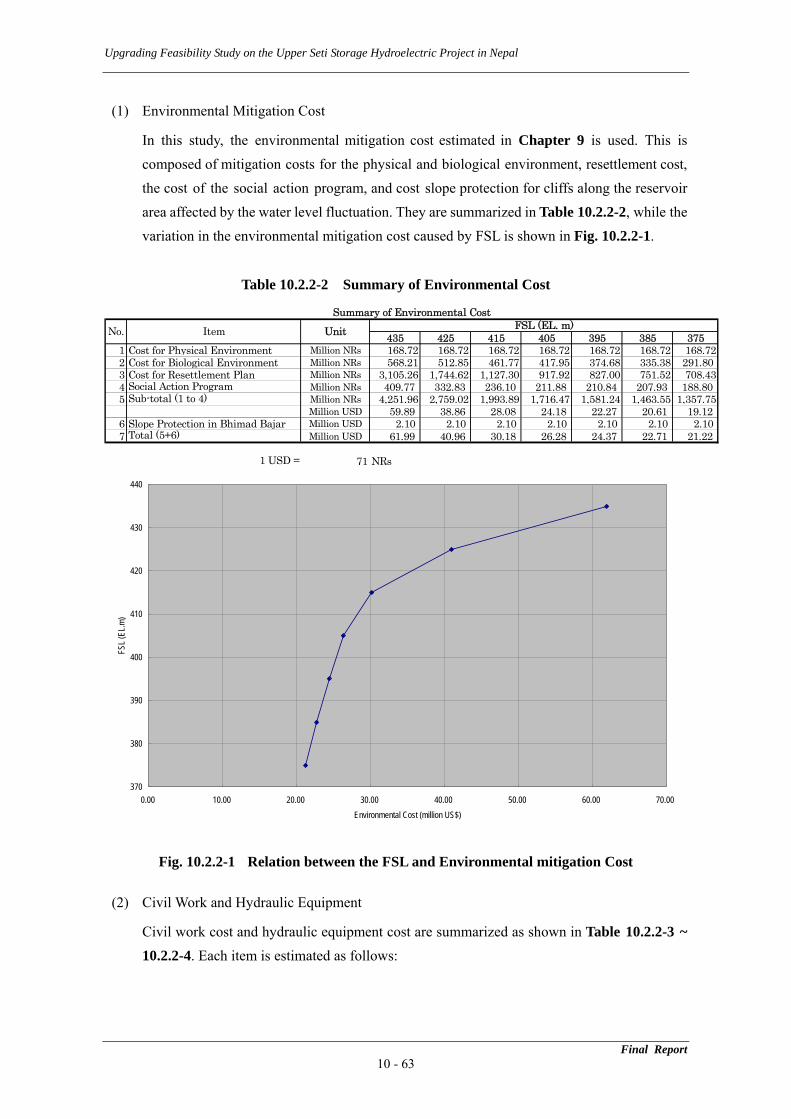
(1) Environmental Mitigation Cost
In this study, the environmental mitigation cost estimated in Chapter 9 is used. This is composed of mitigation costs for the physical and biological environment, resettlement cost, the cost of the social action program, and cost slope protection for cliffs along the reservoir area affected by the water level fluctuation. They are summarized in Table 10.2.2-2, while the variation in the environmental mitigation cost caused by FSL is shown in Fig. 10.2.2-1.
Table 10.2.2-2 Summary of Environmental Cost
435 425 415 405 395 385 3751 Cost for Physical Environment Million NRs 168.72 168.72 168.72 168.72 168.72 168.72 168.722 Cost for Biological Environment Million NRs 568.21 512.85 461.77 417.95 374.68 335.38 291.803 Cost for Resettlement Plan Million NRs 3,105.26 1,744.62 1,127.30 917.92 827.00 751.52 708.434 Social Action Program Million NRs 409.77 332.83 236.10 211.88 210.84 207.93 188.805 Sub-total (1 to 4) Million NRs 4,251.96 2,759.02 1,993.89 1,716.47 1,581.24 1,463.55 1,357.75
Million USD 59.89 38.86 28.08 24.18 22.27 20.61 19.126 Slope Protection in Bhimad Bajar Million USD 2.10 2.10 2.10 2.10 2.10 2.10 2.107 Total (5+6) Million USD 61.99 40.96 30.18 26.28 24.37 22.71 21.22
1 USD = 71 NRs
Summary of Environmental Cost
No. Item Unit FSL (EL. m)
370
380
390
400
410
420
430
440
0.00 10.00 20.00 30.00 40.00 50.00 60.00 70.00Environmental Cost (million US$)
FSL (
EL.m
)
Fig. 10.2.2-1 Relation between the FSL and Environmental mitigation Cost (2) Civil Work and Hydraulic Equipment
Civil work cost and hydraulic equipment cost are summarized as shown in Table 10.2.2-3 ~ 10.2.2-4. Each item is estimated as follows:
Final Report 10 - 63
Upgrading Feasibility Study on the Upper Seti Storage Hydroelectric Project in Nepal
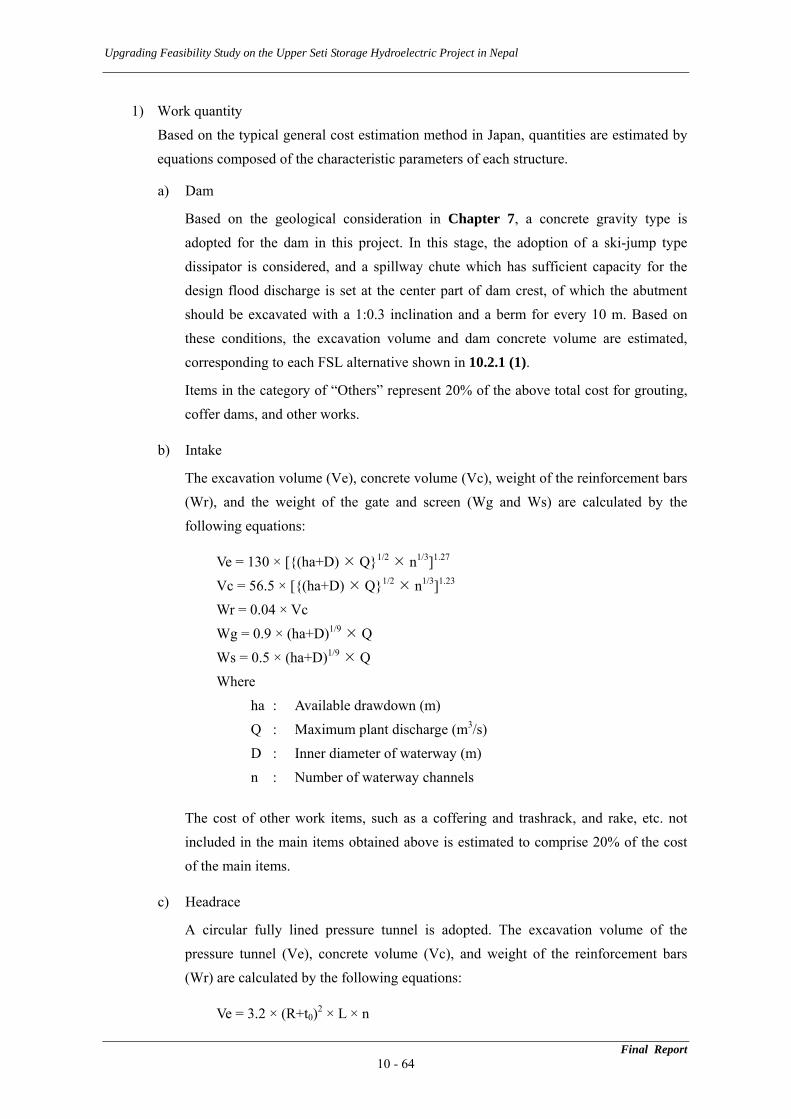
1) Work quantity Based on the typical general cost estimation method in Japan, quantities are estimated by equations composed of the characteristic parameters of each structure.
a) Dam
Based on the geological consideration in Chapter 7, a concrete gravity type is adopted for the dam in this project. In this stage, the adoption of a ski-jump type dissipator is considered, and a spillway chute which has sufficient capacity for the design flood discharge is set at the center part of dam crest, of which the abutment should be excavated with a 1:0.3 inclination and a berm for every 10 m. Based on these conditions, the excavation volume and dam concrete volume are estimated, corresponding to each FSL alternative shown in 10.2.1 (1).
Items in the category of “Others” represent 20% of the above total cost for grouting, coffer dams, and other works.
b) Intake
The excavation volume (Ve), concrete volume (Vc), weight of the reinforcement bars (Wr), and the weight of the gate and screen (Wg and Ws) are calculated by the following equations:
Ve = 130 × [{(ha+D) Q}1/2 n1/3]1.27 Vc = 56.5 × [{(ha+D) Q}1/2 n1/3]1.23 Wr = 0.04 × Vc Wg = 0.9 × (ha+D)1/9 Q Ws = 0.5 × (ha+D)1/9 Q Where
ha : Available drawdown (m) Q : Maximum plant discharge (m3/s) D : Inner diameter of waterway (m) n : Number of waterway channels
The cost of other work items, such as a coffering and trashrack, and rake, etc. not included in the main items obtained above is estimated to comprise 20% of the cost of the main items.
c) Headrace
A circular fully lined pressure tunnel is adopted. The excavation volume of the pressure tunnel (Ve), concrete volume (Vc), and weight of the reinforcement bars (Wr) are calculated by the following equations:
Ve = 3.2 × (R+t0)2 × L × n
Final Report 10 - 64
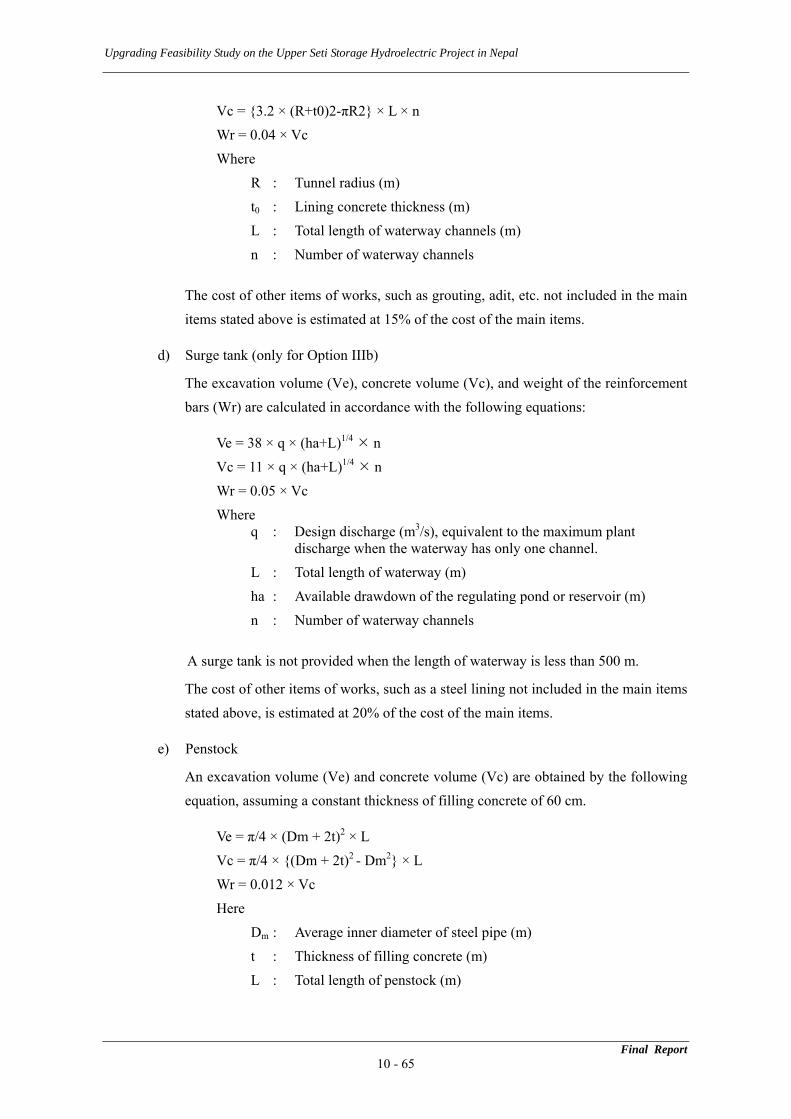
Upgrading Feasibility Study on the Upper Seti Storage Hydroelectric Project in Nepal
Vc = {3.2 × (R+t0)2-πR2} × L × n Wr = 0.04 × Vc Where
R : Tunnel radius (m) t0 : Lining concrete thickness (m) L : Total length of waterway channels (m) n : Number of waterway channels
The cost of other items of works, such as grouting, adit, etc. not included in the main items stated above is estimated at 15% of the cost of the main items.
d) Surge tank (only for Option IIIb)
The excavation volume (Ve), concrete volume (Vc), and weight of the reinforcement bars (Wr) are calculated in accordance with the following equations:
Ve = 38 × q × (ha+L)1/4 n Vc = 11 × q × (ha+L)1/4 n Wr = 0.05 × Vc Where
q : Design discharge (m3/s), equivalent to the maximum plant discharge when the waterway has only one channel.
L : Total length of waterway (m) ha : Available drawdown of the regulating pond or reservoir (m) n : Number of waterway channels
A surge tank is not provided when the length of waterway is less than 500 m.
The cost of other items of works, such as a steel lining not included in the main items stated above, is estimated at 20% of the cost of the main items.
e) Penstock
An excavation volume (Ve) and concrete volume (Vc) are obtained by the following equation, assuming a constant thickness of filling concrete of 60 cm.
Ve = π/4 × (Dm + 2t)2 × L Vc = π/4 × {(Dm + 2t)2 - Dm2} × L Wr = 0.012 × Vc Here
Dm : Average inner diameter of steel pipe (m) t : Thickness of filling concrete (m) L : Total length of penstock (m)
Final Report 10 - 65
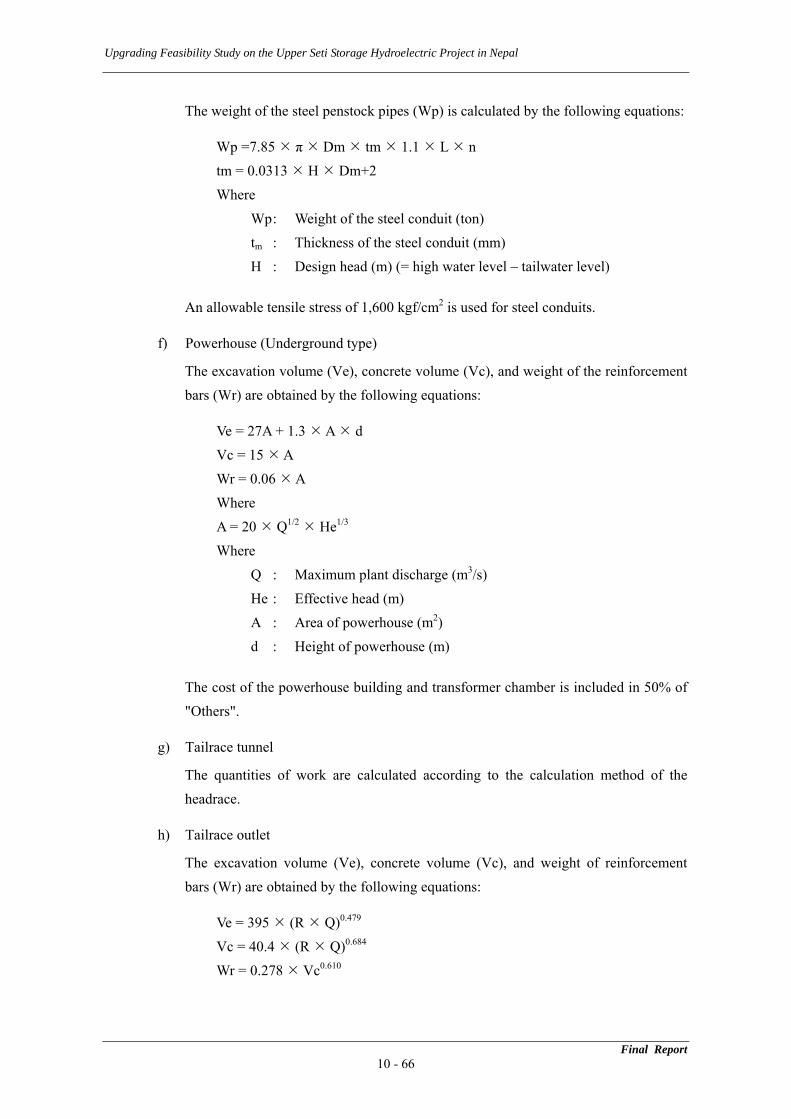
Upgrading Feasibility Study on the Upper Seti Storage Hydroelectric Project in Nepal
The weight of the steel penstock pipes (Wp) is calculated by the following equations:
Wp =7.85 π Dm tm 1.1 L n tm = 0.0313 H Dm+2 Where
Wp : Weight of the steel conduit (ton) tm : Thickness of the steel conduit (mm) H : Design head (m) (= high water level – tailwater level)
An allowable tensile stress of 1,600 kgf/cm2 is used for steel conduits.
f) Powerhouse (Underground type)
The excavation volume (Ve), concrete volume (Vc), and weight of the reinforcement bars (Wr) are obtained by the following equations:
Ve = 27A + 1.3 A d Vc = 15 A Wr = 0.06 A Where A = 20 Q1/2 He1/3 Where
Q : Maximum plant discharge (m3/s) He : Effective head (m) A : Area of powerhouse (m2) d : Height of powerhouse (m)
The cost of the powerhouse building and transformer chamber is included in 50% of "Others".
g) Tailrace tunnel
The quantities of work are calculated according to the calculation method of the headrace.
h) Tailrace outlet
The excavation volume (Ve), concrete volume (Vc), and weight of reinforcement bars (Wr) are obtained by the following equations:
Ve = 395 (R Q)0.479 Vc = 40.4 (R Q)0.684 Wr = 0.278 Vc0.610
Final Report 10 - 66
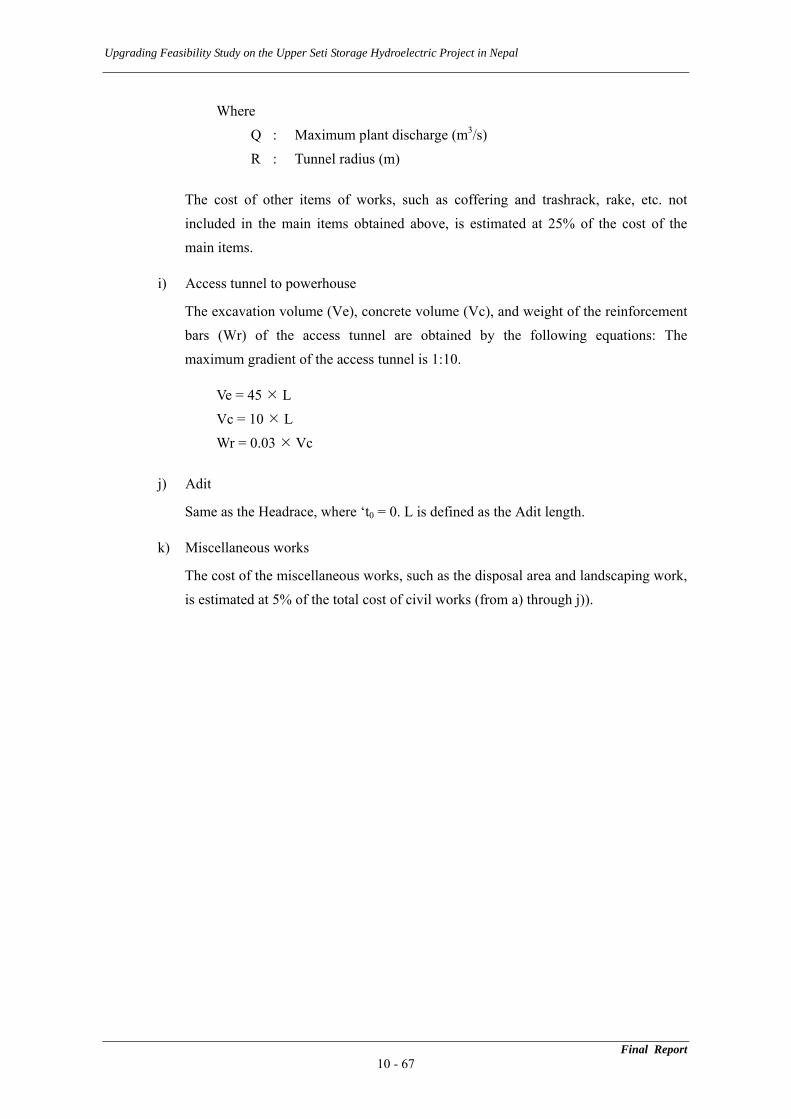
Upgrading Feasibility Study on the Upper Seti Storage Hydroelectric Project in Nepal
Where Q : Maximum plant discharge (m3/s) R : Tunnel radius (m)
The cost of other items of works, such as coffering and trashrack, rake, etc. not included in the main items obtained above, is estimated at 25% of the cost of the main items.
i) Access tunnel to powerhouse
The excavation volume (Ve), concrete volume (Vc), and weight of the reinforcement bars (Wr) of the access tunnel are obtained by the following equations: The maximum gradient of the access tunnel is 1:10.
Ve = 45 L Vc = 10 L Wr = 0.03 Vc
j) Adit
Same as the Headrace, where ‘t0 = 0. L is defined as the Adit length.
k) Miscellaneous works
The cost of the miscellaneous works, such as the disposal area and landscaping work, is estimated at 5% of the total cost of civil works (from a) through j)).
Final Report 10 - 67
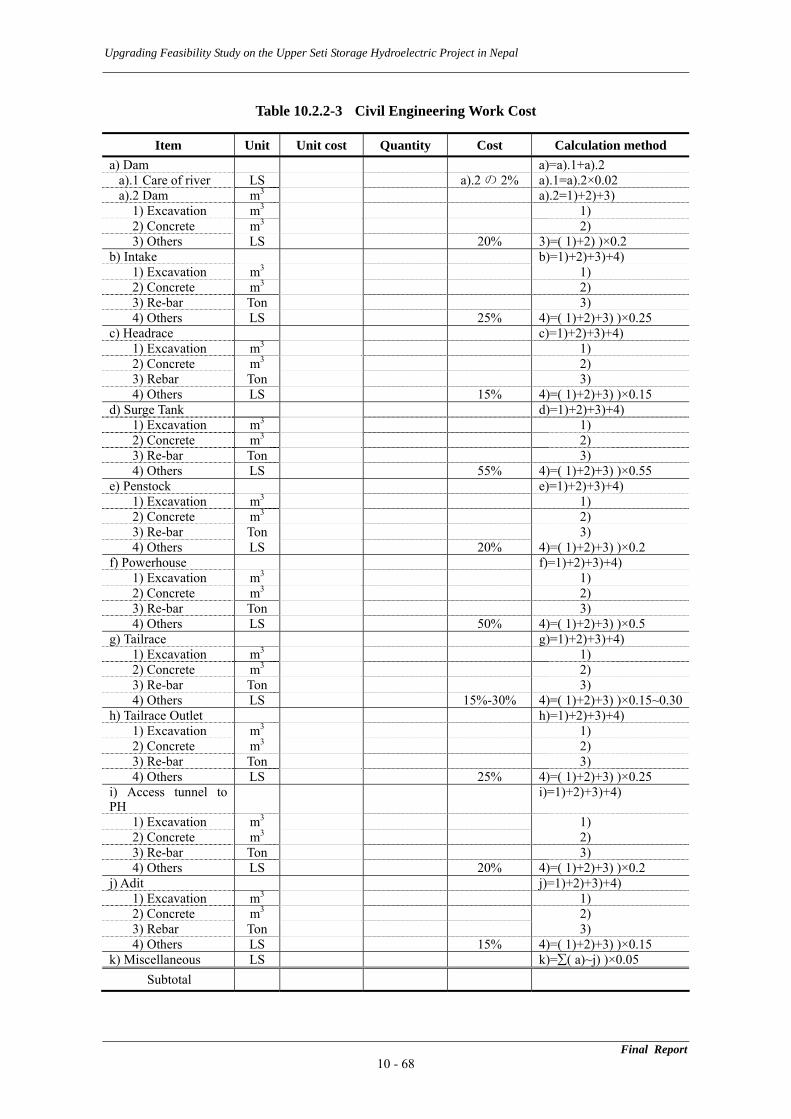
Upgrading Feasibility Study on the Upper Seti Storage Hydroelectric Project in Nepal
Final Report 10 - 68
Table 10.2.2-3 Civil Engineering Work Cost
Item Unit Unit cost Quantity Cost Calculation method a) Dam a)=a).1+a).2
a).1 Care of river LS a).2 の 2% a).1=a).2×0.02 a).2 Dam m3 a).2=1)+2)+3)
1) Excavation m3 1) 2) Concrete m3 2) 3) Others LS 20% 3)=( 1)+2) )×0.2
b) Intake b)=1)+2)+3)+4) 1) Excavation m3 1) 2) Concrete m3 2) 3) Re-bar Ton 3) 4) Others LS 25% 4)=( 1)+2)+3) )×0.25
c) Headrace c)=1)+2)+3)+4) 1) Excavation m3 1) 2) Concrete m3 2) 3) Rebar Ton 3) 4) Others LS 15% 4)=( 1)+2)+3) )×0.15
d) Surge Tank d)=1)+2)+3)+4) 1) Excavation m3 1) 2) Concrete m3 2) 3) Re-bar Ton 3) 4) Others LS 55% 4)=( 1)+2)+3) )×0.55
e) Penstock e)=1)+2)+3)+4) 1) Excavation m3 1) 2) Concrete m3 2) 3) Re-bar Ton 3) 4) Others LS 20% 4)=( 1)+2)+3) )×0.2
f) Powerhouse f)=1)+2)+3)+4) 1) Excavation m3 1) 2) Concrete m3 2) 3) Re-bar Ton 3) 4) Others LS 50% 4)=( 1)+2)+3) )×0.5
g) Tailrace g)=1)+2)+3)+4) 1) Excavation m3 1) 2) Concrete m3 2) 3) Re-bar Ton 3) 4) Others LS 15%-30% 4)=( 1)+2)+3) )×0.15~0.30
h) Tailrace Outlet h)=1)+2)+3)+4) 1) Excavation m3 1) 2) Concrete m3 2) 3) Re-bar Ton 3) 4) Others LS 25% 4)=( 1)+2)+3) )×0.25
i) Access tunnel to PH
i)=1)+2)+3)+4)
1) Excavation m3 1) 2) Concrete m3 2) 3) Re-bar Ton 3) 4) Others LS 20% 4)=( 1)+2)+3) )×0.2
j) Adit j)=1)+2)+3)+4) 1) Excavation m3 1) 2) Concrete m3 2) 3) Rebar Ton 3) 4) Others LS 15% 4)=( 1)+2)+3) )×0.15
k) Miscellaneous LS k)=∑( a)~j) )×0.05 Subtotal
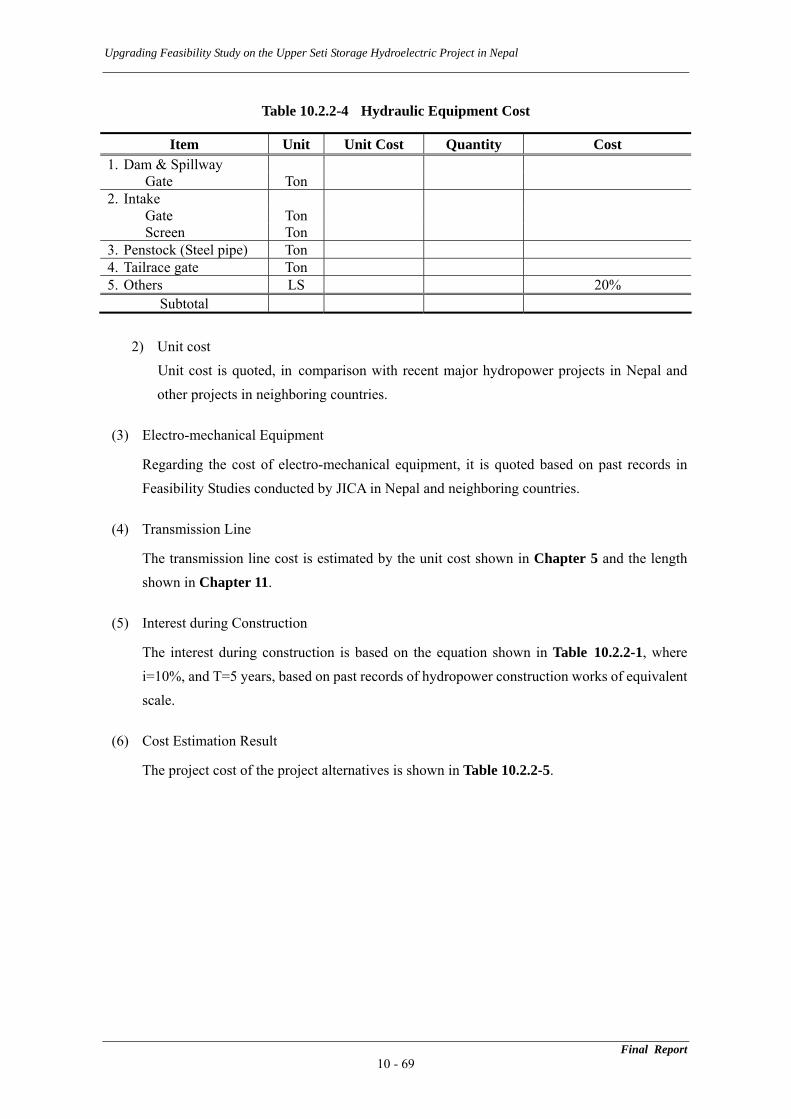
Upgrading Feasibility Study on the Upper Seti Storage Hydroelectric Project in Nepal
Table 10.2.2-4 Hydraulic Equipment Cost
Item Unit Unit Cost Quantity Cost 1. Dam & Spillway
Gate Ton 2. Intake
Gate Ton Screen Ton
3. Penstock (Steel pipe) Ton 4. Tailrace gate Ton 5. Others LS 20%
Subtotal
2) Unit cost Unit cost is quoted, in comparison with recent major hydropower projects in Nepal and other projects in neighboring countries.
(3) Electro-mechanical Equipment
Regarding the cost of electro-mechanical equipment, it is quoted based on past records in Feasibility Studies conducted by JICA in Nepal and neighboring countries.
(4) Transmission Line
The transmission line cost is estimated by the unit cost shown in Chapter 5 and the length shown in Chapter 11.
(5) Interest during Construction
The interest during construction is based on the equation shown in Table 10.2.2-1, where i=10%, and T=5 years, based on past records of hydropower construction works of equivalent scale.
(6) Cost Estimation Result
The project cost of the project alternatives is shown in Table 10.2.2-5.
Final Report 10 - 69
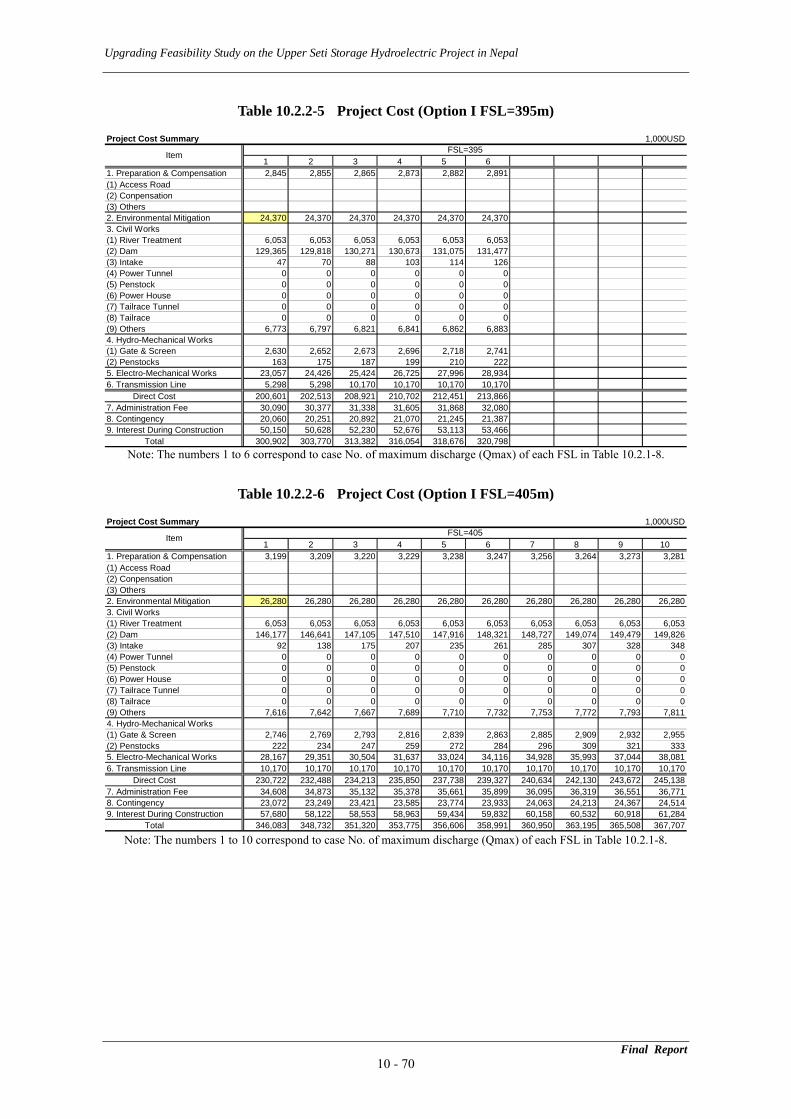
Upgrading Feasibility Study on the Upper Seti Storage Hydroelectric Project in Nepal
Table 10.2.2-5 Project Cost (Option I FSL=395m)
Project Cost Summary 1,000USD
1 2 3 4 5 61. Preparation & Compensation 2,845 2,855 2,865 2,873 2,882 2,891(1) Access Road(2) Conpensation(3) Others2. Environmental Mitigation 24,370 24,370 24,370 24,370 24,370 24,3703. Civil Works(1) River Treatment 6,053 6,053 6,053 6,053 6,053 6,053(2) Dam 129,365 129,818 130,271 130,673 131,075 131,477(3) Intake 47 70 88 103 114 126(4) Power Tunnel 0 0 0 0 0 0(5) Penstock 0 0 0 0 0 0(6) Power House 0 0 0 0 0 0(7) Tailrace Tunnel 0 0 0 0 0 0(8) Tailrace 0 0 0 0 0 0(9) Others 6,773 6,797 6,821 6,841 6,862 6,8834. Hydro-Mechanical Works(1) Gate & Screen 2,630 2,652 2,673 2,696 2,718 2,741(2) Penstocks 163 175 187 199 210 2225. Electro-Mechanical Works 23,057 24,426 25,424 26,725 27,996 28,9346. Transmission Line 5,298 5,298 10,170 10,170 10,170 10,170
Direct Cost 200,601 202,513 208,921 210,702 212,451 213,8667. Administration Fee 30,090 30,377 31,338 31,605 31,868 32,0808. Contingency 20,060 20,251 20,892 21,070 21,245 21,3879. Interest During Construction 50,150 50,628 52,230 52,676 53,113 53,466
Total 300,902 303,770 313,382 316,054 318,676 320,798
Item FSL=395
Note: The numbers 1 to 6 correspond to case No. of maximum discharge (Qmax) of each FSL in Table 10.2.1-8.
Table 10.2.2-6 Project Cost (Option I FSL=405m)
Project Cost Summary 1,000USD
1 2 3 4 5 6 7 8 9 101. Preparation & Compensation 3,199 3,209 3,220 3,229 3,238 3,247 3,256 3,264 3,273 3,281(1) Access Road(2) Conpensation(3) Others2. Environmental Mitigation 26,280 26,280 26,280 26,280 26,280 26,280 26,280 26,280 26,280 26,2803. Civil Works(1) River Treatment 6,053 6,053 6,053 6,053 6,053 6,053 6,053 6,053 6,053 6,053(2) Dam 146,177 146,641 147,105 147,510 147,916 148,321 148,727 149,074 149,479 149,826(3) Intake 92 138 175 207 235 261 285 307 328 348(4) Power Tunnel 0 0 0 0 0 0 0 0 0 0(5) Penstock 0 0 0 0 0 0 0 0 0 0(6) Power House 0 0 0 0 0 0 0 0 0 0(7) Tailrace Tunnel 0 0 0 0 0 0 0 0 0 0(8) Tailrace 0 0 0 0 0 0 0 0 0 0(9) Others 7,616 7,642 7,667 7,689 7,710 7,732 7,753 7,772 7,793 7,8114. Hydro-Mechanical Works(1) Gate & Screen 2,746 2,769 2,793 2,816 2,839 2,863 2,885 2,909 2,932 2,955(2) Penstocks 222 234 247 259 272 284 296 309 321 3335. Electro-Mechanical Works 28,167 29,351 30,504 31,637 33,024 34,116 34,928 35,993 37,044 38,0816. Transmission Line 10,170 10,170 10,170 10,170 10,170 10,170 10,170 10,170 10,170 10,170
Direct Cost 230,722 232,488 234,213 235,850 237,738 239,327 240,634 242,130 243,672 245,1387. Administration Fee 34,608 34,873 35,132 35,378 35,661 35,899 36,095 36,319 36,551 36,7718. Contingency 23,072 23,249 23,421 23,585 23,774 23,933 24,063 24,213 24,367 24,5149. Interest During Construction 57,680 58,122 58,553 58,963 59,434 59,832 60,158 60,532 60,918 61,284
Total 346,083 348,732 351,320 353,775 356,606 358,991 360,950 363,195 365,508 367,707
Item FSL=405
Note: The numbers 1 to 10 correspond to case No. of maximum discharge (Qmax) of each FSL in Table 10.2.1-8.
Final Report 10 - 70
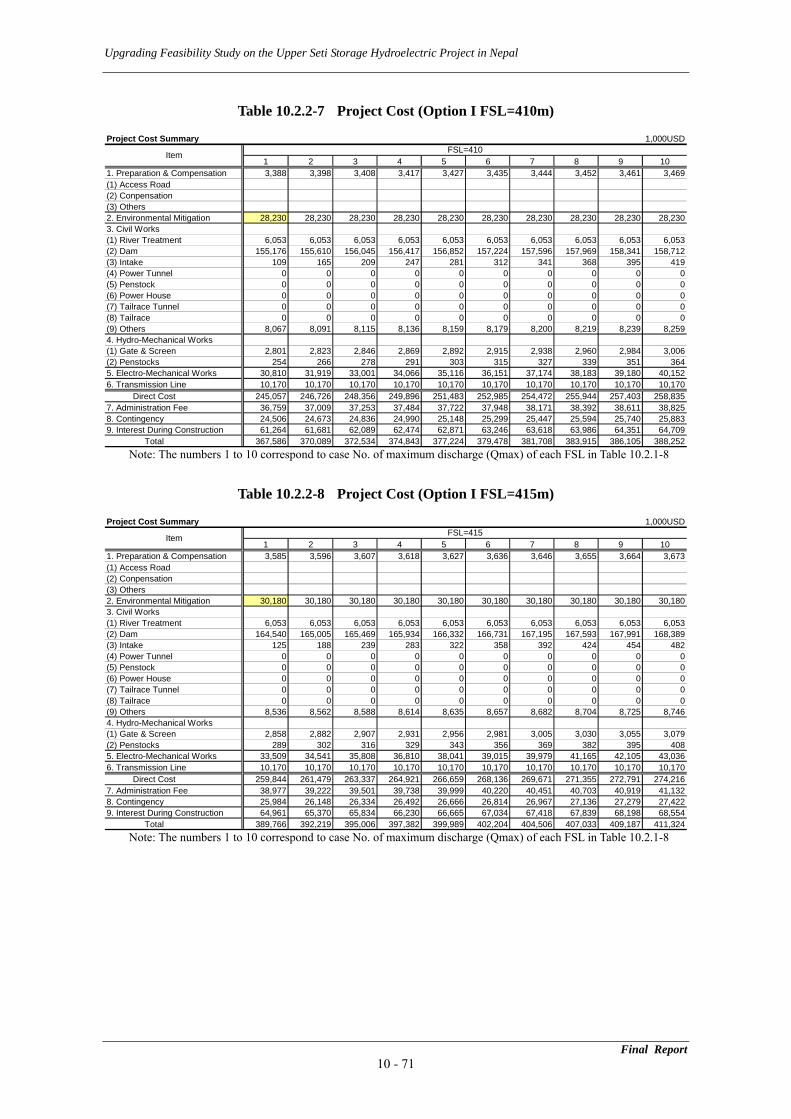
Upgrading Feasibility Study on the Upper Seti Storage Hydroelectric Project in Nepal
Table 10.2.2-7 Project Cost (Option I FSL=410m)
Project Cost Summary 1,000USD
1 2 3 4 5 6 7 8 9 101. Preparation & Compensation 3,388 3,398 3,408 3,417 3,427 3,435 3,444 3,452 3,461 3,469(1) Access Road(2) Conpensation(3) Others2. Environmental Mitigation 28,230 28,230 28,230 28,230 28,230 28,230 28,230 28,230 28,230 28,2303. Civil Works(1) River Treatment 6,053 6,053 6,053 6,053 6,053 6,053 6,053 6,053 6,053 6,053(2) Dam 155,176 155,610 156,045 156,417 156,852 157,224 157,596 157,969 158,341 158,712(3) Intake 109 165 209 247 281 312 341 368 395 419(4) Power Tunnel 0 0 0 0 0 0 0 0 0 0(5) Penstock 0 0 0 0 0 0 0 0 0 0(6) Power House 0 0 0 0 0 0 0 0 0 0(7) Tailrace Tunnel 0 0 0 0 0 0 0 0 0 0(8) Tailrace 0 0 0 0 0 0 0 0 0 0(9) Others 8,067 8,091 8,115 8,136 8,159 8,179 8,200 8,219 8,239 8,2594. Hydro-Mechanical Works(1) Gate & Screen 2,801 2,823 2,846 2,869 2,892 2,915 2,938 2,960 2,984 3,006(2) Penstocks 254 266 278 291 303 315 327 339 351 3645. Electro-Mechanical Works 30,810 31,919 33,001 34,066 35,116 36,151 37,174 38,183 39,180 40,1526. Transmission Line 10,170 10,170 10,170 10,170 10,170 10,170 10,170 10,170 10,170 10,170
Direct Cost 245,057 246,726 248,356 249,896 251,483 252,985 254,472 255,944 257,403 258,8357. Administration Fee 36,759 37,009 37,253 37,484 37,722 37,948 38,171 38,392 38,611 38,8258. Contingency 24,506 24,673 24,836 24,990 25,148 25,299 25,447 25,594 25,740 25,8839. Interest During Construction 61,264 61,681 62,089 62,474 62,871 63,246 63,618 63,986 64,351 64,709
Total 367,586 370,089 372,534 374,843 377,224 379,478 381,708 383,915 386,105 388,252
Item FSL=410
Note: The numbers 1 to 10 correspond to case No. of maximum discharge (Qmax) of each FSL in Table 10.2.1-8
Table 10.2.2-8 Project Cost (Option I FSL=415m)
Project Cost Summary 1,000USD
1 2 3 4 5 6 7 8 9 101. Preparation & Compensation 3,585 3,596 3,607 3,618 3,627 3,636 3,646 3,655 3,664 3,673(1) Access Road(2) Conpensation(3) Others2. Environmental Mitigation 30,180 30,180 30,180 30,180 30,180 30,180 30,180 30,180 30,180 30,1803. Civil Works(1) River Treatment 6,053 6,053 6,053 6,053 6,053 6,053 6,053 6,053 6,053 6,053(2) Dam 164,540 165,005 165,469 165,934 166,332 166,731 167,195 167,593 167,991 168,389(3) Intake 125 188 239 283 322 358 392 424 454 482(4) Power Tunnel 0 0 0 0 0 0 0 0 0 0(5) Penstock 0 0 0 0 0 0 0 0 0 0(6) Power House 0 0 0 0 0 0 0 0 0 0(7) Tailrace Tunnel 0 0 0 0 0 0 0 0 0 0(8) Tailrace 0 0 0 0 0 0 0 0 0 0(9) Others 8,536 8,562 8,588 8,614 8,635 8,657 8,682 8,704 8,725 8,7464. Hydro-Mechanical Works(1) Gate & Screen 2,858 2,882 2,907 2,931 2,956 2,981 3,005 3,030 3,055 3,079(2) Penstocks 289 302 316 329 343 356 369 382 395 4085. Electro-Mechanical Works 33,509 34,541 35,808 36,810 38,041 39,015 39,979 41,165 42,105 43,0366. Transmission Line 10,170 10,170 10,170 10,170 10,170 10,170 10,170 10,170 10,170 10,170
Direct Cost 259,844 261,479 263,337 264,921 266,659 268,136 269,671 271,355 272,791 274,2167. Administration Fee 38,977 39,222 39,501 39,738 39,999 40,220 40,451 40,703 40,919 41,1328. Contingency 25,984 26,148 26,334 26,492 26,666 26,814 26,967 27,136 27,279 27,4229. Interest During Construction 64,961 65,370 65,834 66,230 66,665 67,034 67,418 67,839 68,198 68,554
Total 389,766 392,219 395,006 397,382 399,989 402,204 404,506 407,033 409,187 411,324
Item FSL=415
Note: The numbers 1 to 10 correspond to case No. of maximum discharge (Qmax) of each FSL in Table 10.2.1-8
Final Report 10 - 71
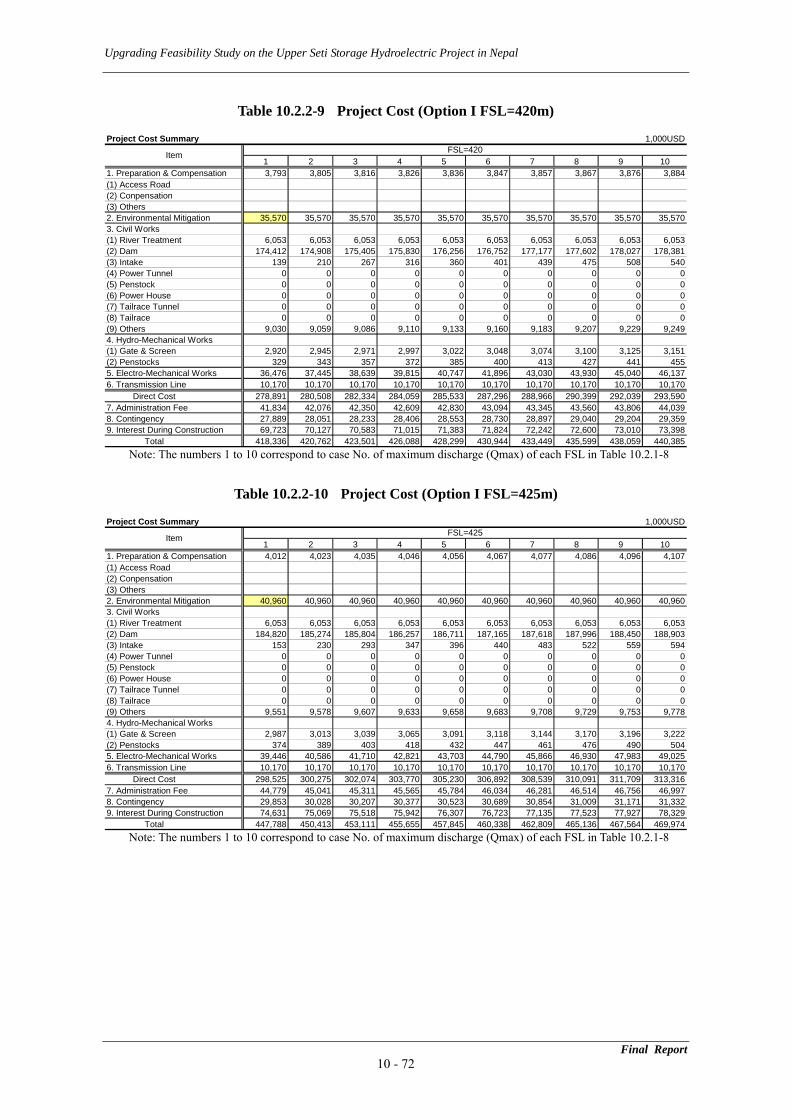
Upgrading Feasibility Study on the Upper Seti Storage Hydroelectric Project in Nepal
Table 10.2.2-9 Project Cost (Option I FSL=420m)
Project Cost Summary 1,000USD
1 2 3 4 5 6 7 8 9 101. Preparation & Compensation 3,793 3,805 3,816 3,826 3,836 3,847 3,857 3,867 3,876 3,884(1) Access Road(2) Conpensation(3) Others2. Environmental Mitigation 35,570 35,570 35,570 35,570 35,570 35,570 35,570 35,570 35,570 35,5703. Civil Works(1) River Treatment 6,053 6,053 6,053 6,053 6,053 6,053 6,053 6,053 6,053 6,053(2) Dam 174,412 174,908 175,405 175,830 176,256 176,752 177,177 177,602 178,027 178,381(3) Intake 139 210 267 316 360 401 439 475 508 540(4) Power Tunnel 0 0 0 0 0 0 0 0 0 0(5) Penstock 0 0 0 0 0 0 0 0 0 0(6) Power House 0 0 0 0 0 0 0 0 0 0(7) Tailrace Tunnel 0 0 0 0 0 0 0 0 0 0(8) Tailrace 0 0 0 0 0 0 0 0 0 0(9) Others 9,030 9,059 9,086 9,110 9,133 9,160 9,183 9,207 9,229 9,2494. Hydro-Mechanical Works(1) Gate & Screen 2,920 2,945 2,971 2,997 3,022 3,048 3,074 3,100 3,125 3,151(2) Penstocks 329 343 357 372 385 400 413 427 441 4555. Electro-Mechanical Works 36,476 37,445 38,639 39,815 40,747 41,896 43,030 43,930 45,040 46,1376. Transmission Line 10,170 10,170 10,170 10,170 10,170 10,170 10,170 10,170 10,170 10,170
Direct Cost 278,891 280,508 282,334 284,059 285,533 287,296 288,966 290,399 292,039 293,5907. Administration Fee 41,834 42,076 42,350 42,609 42,830 43,094 43,345 43,560 43,806 44,0398. Contingency 27,889 28,051 28,233 28,406 28,553 28,730 28,897 29,040 29,204 29,3599. Interest During Construction 69,723 70,127 70,583 71,015 71,383 71,824 72,242 72,600 73,010 73,398
Total 418,336 420,762 423,501 426,088 428,299 430,944 433,449 435,599 438,059 440,385
Item FSL=420
Note: The numbers 1 to 10 correspond to case No. of maximum discharge (Qmax) of each FSL in Table 10.2.1-8
Table 10.2.2-10 Project Cost (Option I FSL=425m)
Project Cost Summary 1,000USD
1 2 3 4 5 6 7 8 9 101. Preparation & Compensation 4,012 4,023 4,035 4,046 4,056 4,067 4,077 4,086 4,096 4,107(1) Access Road(2) Conpensation(3) Others2. Environmental Mitigation 40,960 40,960 40,960 40,960 40,960 40,960 40,960 40,960 40,960 40,9603. Civil Works(1) River Treatment 6,053 6,053 6,053 6,053 6,053 6,053 6,053 6,053 6,053 6,053(2) Dam 184,820 185,274 185,804 186,257 186,711 187,165 187,618 187,996 188,450 188,903(3) Intake 153 230 293 347 396 440 483 522 559 594(4) Power Tunnel 0 0 0 0 0 0 0 0 0 0(5) Penstock 0 0 0 0 0 0 0 0 0 0(6) Power House 0 0 0 0 0 0 0 0 0 0(7) Tailrace Tunnel 0 0 0 0 0 0 0 0 0 0(8) Tailrace 0 0 0 0 0 0 0 0 0 0(9) Others 9,551 9,578 9,607 9,633 9,658 9,683 9,708 9,729 9,753 9,7784. Hydro-Mechanical Works(1) Gate & Screen 2,987 3,013 3,039 3,065 3,091 3,118 3,144 3,170 3,196 3,222(2) Penstocks 374 389 403 418 432 447 461 476 490 5045. Electro-Mechanical Works 39,446 40,586 41,710 42,821 43,703 44,790 45,866 46,930 47,983 49,0256. Transmission Line 10,170 10,170 10,170 10,170 10,170 10,170 10,170 10,170 10,170 10,170
Direct Cost 298,525 300,275 302,074 303,770 305,230 306,892 308,539 310,091 311,709 313,3167. Administration Fee 44,779 45,041 45,311 45,565 45,784 46,034 46,281 46,514 46,756 46,9978. Contingency 29,853 30,028 30,207 30,377 30,523 30,689 30,854 31,009 31,171 31,3329. Interest During Construction 74,631 75,069 75,518 75,942 76,307 76,723 77,135 77,523 77,927 78,329
Total 447,788 450,413 453,111 455,655 457,845 460,338 462,809 465,136 467,564 469,974
Item FSL=425
Note: The numbers 1 to 10 correspond to case No. of maximum discharge (Qmax) of each FSL in Table 10.2.1-8
Final Report 10 - 72
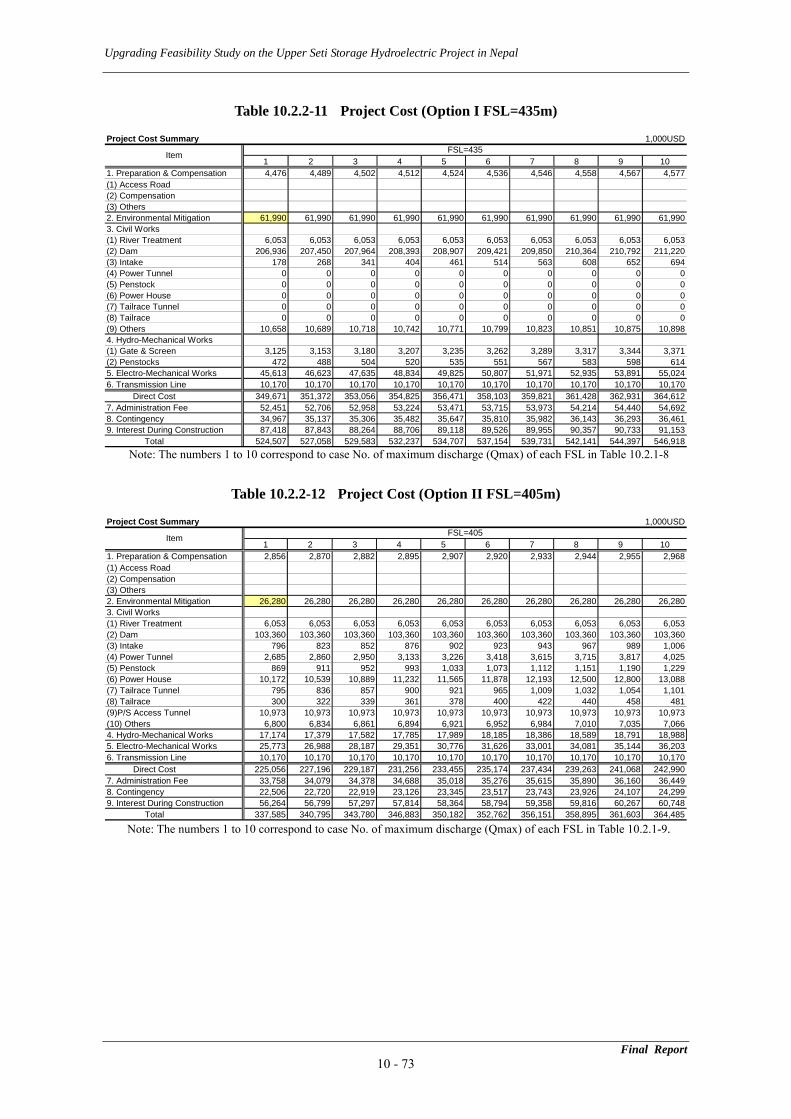
Upgrading Feasibility Study on the Upper Seti Storage Hydroelectric Project in Nepal
Table 10.2.2-11 Project Cost (Option I FSL=435m)
Project Cost Summary 1,000USD
1 2 3 4 5 6 7 8 9 101. Preparation & Compensation 4,476 4,489 4,502 4,512 4,524 4,536 4,546 4,558 4,567 4,577(1) Access Road(2) Compensation(3) Others2. Environmental Mitigation 61,990 61,990 61,990 61,990 61,990 61,990 61,990 61,990 61,990 61,9903. Civil Works(1) River Treatment 6,053 6,053 6,053 6,053 6,053 6,053 6,053 6,053 6,053 6,053(2) Dam 206,936 207,450 207,964 208,393 208,907 209,421 209,850 210,364 210,792 211,220(3) Intake 178 268 341 404 461 514 563 608 652 694(4) Power Tunnel 0 0 0 0 0 0 0 0 0 0(5) Penstock 0 0 0 0 0 0 0 0 0 0(6) Power House 0 0 0 0 0 0 0 0 0 0(7) Tailrace Tunnel 0 0 0 0 0 0 0 0 0 0(8) Tailrace 0 0 0 0 0 0 0 0 0 0(9) Others 10,658 10,689 10,718 10,742 10,771 10,799 10,823 10,851 10,875 10,8984. Hydro-Mechanical Works(1) Gate & Screen 3,125 3,153 3,180 3,207 3,235 3,262 3,289 3,317 3,344 3,371(2) Penstocks 472 488 504 520 535 551 567 583 598 6145. Electro-Mechanical Works 45,613 46,623 47,635 48,834 49,825 50,807 51,971 52,935 53,891 55,0246. Transmission Line 10,170 10,170 10,170 10,170 10,170 10,170 10,170 10,170 10,170 10,170
Direct Cost 349,671 351,372 353,056 354,825 356,471 358,103 359,821 361,428 362,931 364,6127. Administration Fee 52,451 52,706 52,958 53,224 53,471 53,715 53,973 54,214 54,440 54,6928. Contingency 34,967 35,137 35,306 35,482 35,647 35,810 35,982 36,143 36,293 36,4619. Interest During Construction 87,418 87,843 88,264 88,706 89,118 89,526 89,955 90,357 90,733 91,153
Total 524,507 527,058 529,583 532,237 534,707 537,154 539,731 542,141 544,397 546,918
Item FSL=435
Note: The numbers 1 to 10 correspond to case No. of maximum discharge (Qmax) of each FSL in Table 10.2.1-8
Table 10.2.2-12 Project Cost (Option II FSL=405m)
Project Cost Summary 1,000USD
1 2 3 4 5 6 7 8 9 101. Preparation & Compensation 2,856 2,870 2,882 2,895 2,907 2,920 2,933 2,944 2,955 2,968(1) Access Road(2) Compensation(3) Others2. Environmental Mitigation 26,280 26,280 26,280 26,280 26,280 26,280 26,280 26,280 26,280 26,2803. Civil Works(1) River Treatment 6,053 6,053 6,053 6,053 6,053 6,053 6,053 6,053 6,053 6,053(2) Dam 103,360 103,360 103,360 103,360 103,360 103,360 103,360 103,360 103,360 103,360(3) Intake 796 823 852 876 902 923 943 967 989 1,006(4) Power Tunnel 2,685 2,860 2,950 3,133 3,226 3,418 3,615 3,715 3,817 4,025(5) Penstock 869 911 952 993 1,033 1,073 1,112 1,151 1,190 1,229(6) Power House 10,172 10,539 10,889 11,232 11,565 11,878 12,193 12,500 12,800 13,088(7) Tailrace Tunnel 795 836 857 900 921 965 1,009 1,032 1,054 1,101(8) Tailrace 300 322 339 361 378 400 422 440 458 481(9)P/S Access Tunnel 10,973 10,973 10,973 10,973 10,973 10,973 10,973 10,973 10,973 10,973(10) Others 6,800 6,834 6,861 6,894 6,921 6,952 6,984 7,010 7,035 7,0664. Hydro-Mechanical Works 17,174 17,379 17,582 17,785 17,989 18,185 18,386 18,589 18,791 18,9885. Electro-Mechanical Works 25,773 26,988 28,187 29,351 30,776 31,626 33,001 34,081 35,144 36,2036. Transmission Line 10,170 10,170 10,170 10,170 10,170 10,170 10,170 10,170 10,170 10,170
Direct Cost 225,056 227,196 229,187 231,256 233,455 235,174 237,434 239,263 241,068 242,9907. Administration Fee 33,758 34,079 34,378 34,688 35,018 35,276 35,615 35,890 36,160 36,4498. Contingency 22,506 22,720 22,919 23,126 23,345 23,517 23,743 23,926 24,107 24,2999. Interest During Construction 56,264 56,799 57,297 57,814 58,364 58,794 59,358 59,816 60,267 60,748
Total 337,585 340,795 343,780 346,883 350,182 352,762 356,151 358,895 361,603 364,485
Item FSL=405
Note: The numbers 1 to 10 correspond to case No. of maximum discharge (Qmax) of each FSL in Table 10.2.1-9.
Final Report 10 - 73
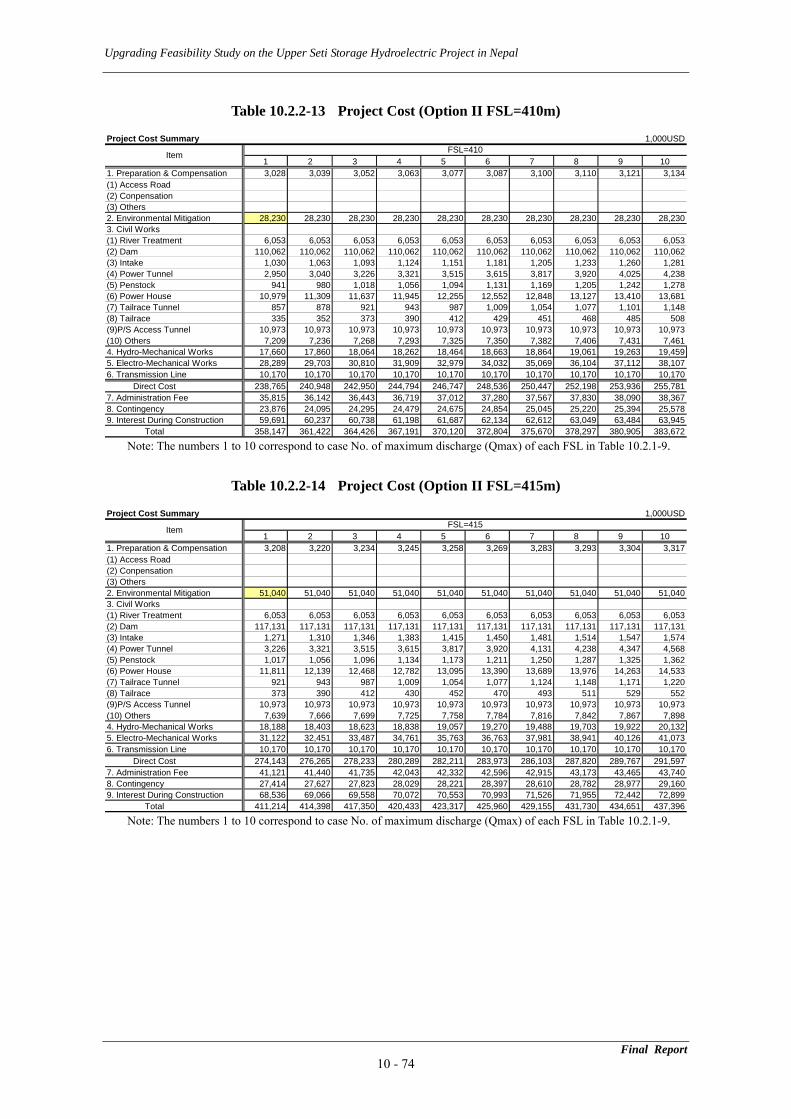
Upgrading Feasibility Study on the Upper Seti Storage Hydroelectric Project in Nepal
Table 10.2.2-13 Project Cost (Option II FSL=410m)
Project Cost Summary 1,000USD
1 2 3 4 5 6 7 8 9 101. Preparation & Compensation 3,028 3,039 3,052 3,063 3,077 3,087 3,100 3,110 3,121 3,134(1) Access Road(2) Conpensation(3) Others2. Environmental Mitigation 28,230 28,230 28,230 28,230 28,230 28,230 28,230 28,230 28,230 28,2303. Civil Works(1) River Treatment 6,053 6,053 6,053 6,053 6,053 6,053 6,053 6,053 6,053 6,053(2) Dam 110,062 110,062 110,062 110,062 110,062 110,062 110,062 110,062 110,062 110,062(3) Intake 1,030 1,063 1,093 1,124 1,151 1,181 1,205 1,233 1,260 1,281(4) Power Tunnel 2,950 3,040 3,226 3,321 3,515 3,615 3,817 3,920 4,025 4,238(5) Penstock 941 980 1,018 1,056 1,094 1,131 1,169 1,205 1,242 1,278(6) Power House 10,979 11,309 11,637 11,945 12,255 12,552 12,848 13,127 13,410 13,681(7) Tailrace Tunnel 857 878 921 943 987 1,009 1,054 1,077 1,101 1,148(8) Tailrace 335 352 373 390 412 429 451 468 485 508(9)P/S Access Tunnel 10,973 10,973 10,973 10,973 10,973 10,973 10,973 10,973 10,973 10,973(10) Others 7,209 7,236 7,268 7,293 7,325 7,350 7,382 7,406 7,431 7,4614. Hydro-Mechanical Works 17,660 17,860 18,064 18,262 18,464 18,663 18,864 19,061 19,263 19,4595. Electro-Mechanical Works 28,289 29,703 30,810 31,909 32,979 34,032 35,069 36,104 37,112 38,1076. Transmission Line 10,170 10,170 10,170 10,170 10,170 10,170 10,170 10,170 10,170 10,170
Direct Cost 238,765 240,948 242,950 244,794 246,747 248,536 250,447 252,198 253,936 255,7817. Administration Fee 35,815 36,142 36,443 36,719 37,012 37,280 37,567 37,830 38,090 38,3678. Contingency 23,876 24,095 24,295 24,479 24,675 24,854 25,045 25,220 25,394 25,5789. Interest During Construction 59,691 60,237 60,738 61,198 61,687 62,134 62,612 63,049 63,484 63,945
Total 358,147 361,422 364,426 367,191 370,120 372,804 375,670 378,297 380,905 383,672
Item FSL=410
Note: The numbers 1 to 10 correspond to case No. of maximum discharge (Qmax) of each FSL in Table 10.2.1-9.
Table 10.2.2-14 Project Cost (Option II FSL=415m)
Project Cost Summary 1,000USD
1 2 3 4 5 6 7 8 9 101. Preparation & Compensation 3,208 3,220 3,234 3,245 3,258 3,269 3,283 3,293 3,304 3,317(1) Access Road(2) Conpensation(3) Others2. Environmental Mitigation 51,040 51,040 51,040 51,040 51,040 51,040 51,040 51,040 51,040 51,0403. Civil Works(1) River Treatment 6,053 6,053 6,053 6,053 6,053 6,053 6,053 6,053 6,053 6,053(2) Dam 117,131 117,131 117,131 117,131 117,131 117,131 117,131 117,131 117,131 117,131(3) Intake 1,271 1,310 1,346 1,383 1,415 1,450 1,481 1,514 1,547 1,574(4) Power Tunnel 3,226 3,321 3,515 3,615 3,817 3,920 4,131 4,238 4,347 4,568(5) Penstock 1,017 1,056 1,096 1,134 1,173 1,211 1,250 1,287 1,325 1,362(6) Power House 11,811 12,139 12,468 12,782 13,095 13,390 13,689 13,976 14,263 14,533(7) Tailrace Tunnel 921 943 987 1,009 1,054 1,077 1,124 1,148 1,171 1,220(8) Tailrace 373 390 412 430 452 470 493 511 529 552(9)P/S Access Tunnel 10,973 10,973 10,973 10,973 10,973 10,973 10,973 10,973 10,973 10,973(10) Others 7,639 7,666 7,699 7,725 7,758 7,784 7,816 7,842 7,867 7,8984. Hydro-Mechanical Works 18,188 18,403 18,623 18,838 19,057 19,270 19,488 19,703 19,922 20,1325. Electro-Mechanical Works 31,122 32,451 33,487 34,761 35,763 36,763 37,981 38,941 40,126 41,0736. Transmission Line 10,170 10,170 10,170 10,170 10,170 10,170 10,170 10,170 10,170 10,170
Direct Cost 274,143 276,265 278,233 280,289 282,211 283,973 286,103 287,820 289,767 291,5977. Administration Fee 41,121 41,440 41,735 42,043 42,332 42,596 42,915 43,173 43,465 43,7408. Contingency 27,414 27,627 27,823 28,029 28,221 28,397 28,610 28,782 28,977 29,1609. Interest During Construction 68,536 69,066 69,558 70,072 70,553 70,993 71,526 71,955 72,442 72,899
Total 411,214 414,398 417,350 420,433 423,317 425,960 429,155 431,730 434,651 437,396
Item FSL=415
Note: The numbers 1 to 10 correspond to case No. of maximum discharge (Qmax) of each FSL in Table 10.2.1-9.
Final Report 10 - 74
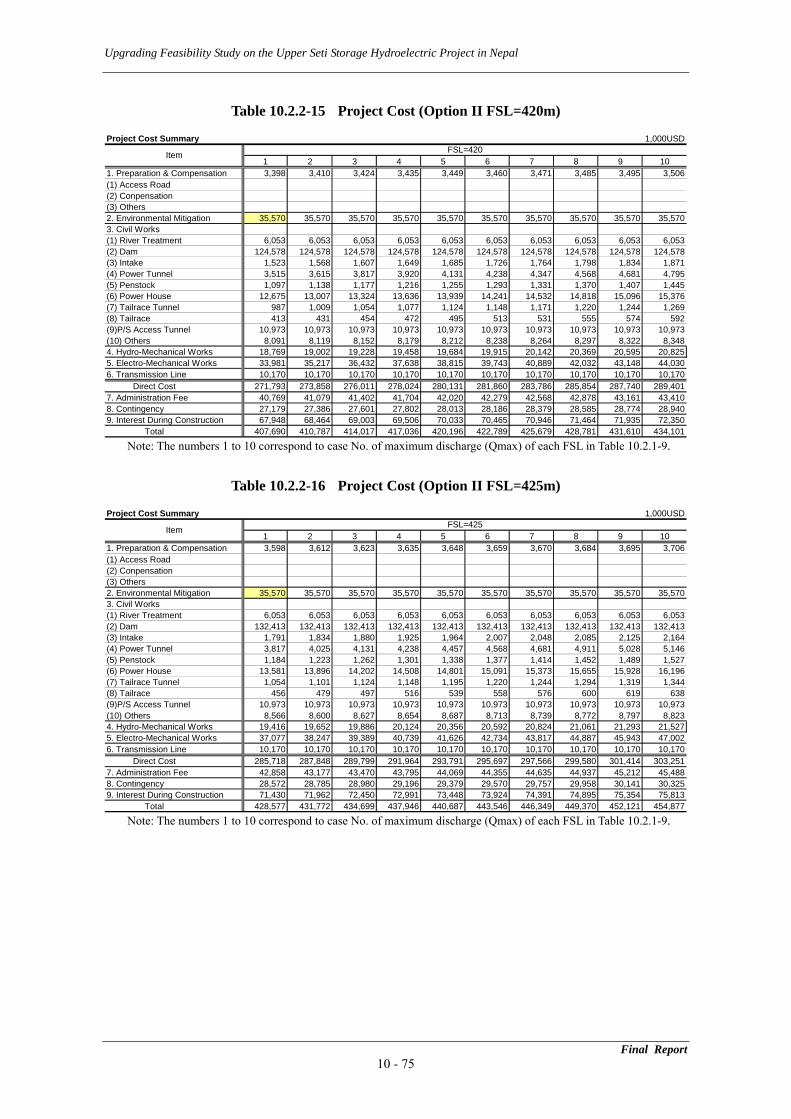
Upgrading Feasibility Study on the Upper Seti Storage Hydroelectric Project in Nepal
Table 10.2.2-15 Project Cost (Option II FSL=420m)
Project Cost Summary 1,000USD
1 2 3 4 5 6 7 8 9 101. Preparation & Compensation 3,398 3,410 3,424 3,435 3,449 3,460 3,471 3,485 3,495 3,506(1) Access Road(2) Conpensation(3) Others2. Environmental Mitigation 35,570 35,570 35,570 35,570 35,570 35,570 35,570 35,570 35,570 35,5703. Civil Works(1) River Treatment 6,053 6,053 6,053 6,053 6,053 6,053 6,053 6,053 6,053 6,053(2) Dam 124,578 124,578 124,578 124,578 124,578 124,578 124,578 124,578 124,578 124,578(3) Intake 1,523 1,568 1,607 1,649 1,685 1,726 1,764 1,798 1,834 1,871(4) Power Tunnel 3,515 3,615 3,817 3,920 4,131 4,238 4,347 4,568 4,681 4,795(5) Penstock 1,097 1,138 1,177 1,216 1,255 1,293 1,331 1,370 1,407 1,445(6) Power House 12,675 13,007 13,324 13,636 13,939 14,241 14,532 14,818 15,096 15,376(7) Tailrace Tunnel 987 1,009 1,054 1,077 1,124 1,148 1,171 1,220 1,244 1,269(8) Tailrace 413 431 454 472 495 513 531 555 574 592(9)P/S Access Tunnel 10,973 10,973 10,973 10,973 10,973 10,973 10,973 10,973 10,973 10,973(10) Others 8,091 8,119 8,152 8,179 8,212 8,238 8,264 8,297 8,322 8,3484. Hydro-Mechanical Works 18,769 19,002 19,228 19,458 19,684 19,915 20,142 20,369 20,595 20,8255. Electro-Mechanical Works 33,981 35,217 36,432 37,638 38,815 39,743 40,889 42,032 43,148 44,0306. Transmission Line 10,170 10,170 10,170 10,170 10,170 10,170 10,170 10,170 10,170 10,170
Direct Cost 271,793 273,858 276,011 278,024 280,131 281,860 283,786 285,854 287,740 289,4017. Administration Fee 40,769 41,079 41,402 41,704 42,020 42,279 42,568 42,878 43,161 43,4108. Contingency 27,179 27,386 27,601 27,802 28,013 28,186 28,379 28,585 28,774 28,9409. Interest During Construction 67,948 68,464 69,003 69,506 70,033 70,465 70,946 71,464 71,935 72,350
Total 407,690 410,787 414,017 417,036 420,196 422,789 425,679 428,781 431,610 434,101
Item FSL=420
Note: The numbers 1 to 10 correspond to case No. of maximum discharge (Qmax) of each FSL in Table 10.2.1-9.
Table 10.2.2-16 Project Cost (Option II FSL=425m)
Project Cost Summary 1,000USD
1 2 3 4 5 6 7 8 9 101. Preparation & Compensation 3,598 3,612 3,623 3,635 3,648 3,659 3,670 3,684 3,695 3,706(1) Access Road(2) Conpensation(3) Others2. Environmental Mitigation 35,570 35,570 35,570 35,570 35,570 35,570 35,570 35,570 35,570 35,5703. Civil Works(1) River Treatment 6,053 6,053 6,053 6,053 6,053 6,053 6,053 6,053 6,053 6,053(2) Dam 132,413 132,413 132,413 132,413 132,413 132,413 132,413 132,413 132,413 132,413(3) Intake 1,791 1,834 1,880 1,925 1,964 2,007 2,048 2,085 2,125 2,164(4) Power Tunnel 3,817 4,025 4,131 4,238 4,457 4,568 4,681 4,911 5,028 5,146(5) Penstock 1,184 1,223 1,262 1,301 1,338 1,377 1,414 1,452 1,489 1,527(6) Power House 13,581 13,896 14,202 14,508 14,801 15,091 15,373 15,655 15,928 16,196(7) Tailrace Tunnel 1,054 1,101 1,124 1,148 1,195 1,220 1,244 1,294 1,319 1,344(8) Tailrace 456 479 497 516 539 558 576 600 619 638(9)P/S Access Tunnel 10,973 10,973 10,973 10,973 10,973 10,973 10,973 10,973 10,973 10,973(10) Others 8,566 8,600 8,627 8,654 8,687 8,713 8,739 8,772 8,797 8,8234. Hydro-Mechanical Works 19,416 19,652 19,886 20,124 20,356 20,592 20,824 21,061 21,293 21,5275. Electro-Mechanical Works 37,077 38,247 39,389 40,739 41,626 42,734 43,817 44,887 45,943 47,0026. Transmission Line 10,170 10,170 10,170 10,170 10,170 10,170 10,170 10,170 10,170 10,170
Direct Cost 285,718 287,848 289,799 291,964 293,791 295,697 297,566 299,580 301,414 303,2517. Administration Fee 42,858 43,177 43,470 43,795 44,069 44,355 44,635 44,937 45,212 45,4888. Contingency 28,572 28,785 28,980 29,196 29,379 29,570 29,757 29,958 30,141 30,3259. Interest During Construction 71,430 71,962 72,450 72,991 73,448 73,924 74,391 74,895 75,354 75,813
Total 428,577 431,772 434,699 437,946 440,687 443,546 446,349 449,370 452,121 454,877
Item FSL=425
Note: The numbers 1 to 10 correspond to case No. of maximum discharge (Qmax) of each FSL in Table 10.2.1-9.
Final Report 10 - 75
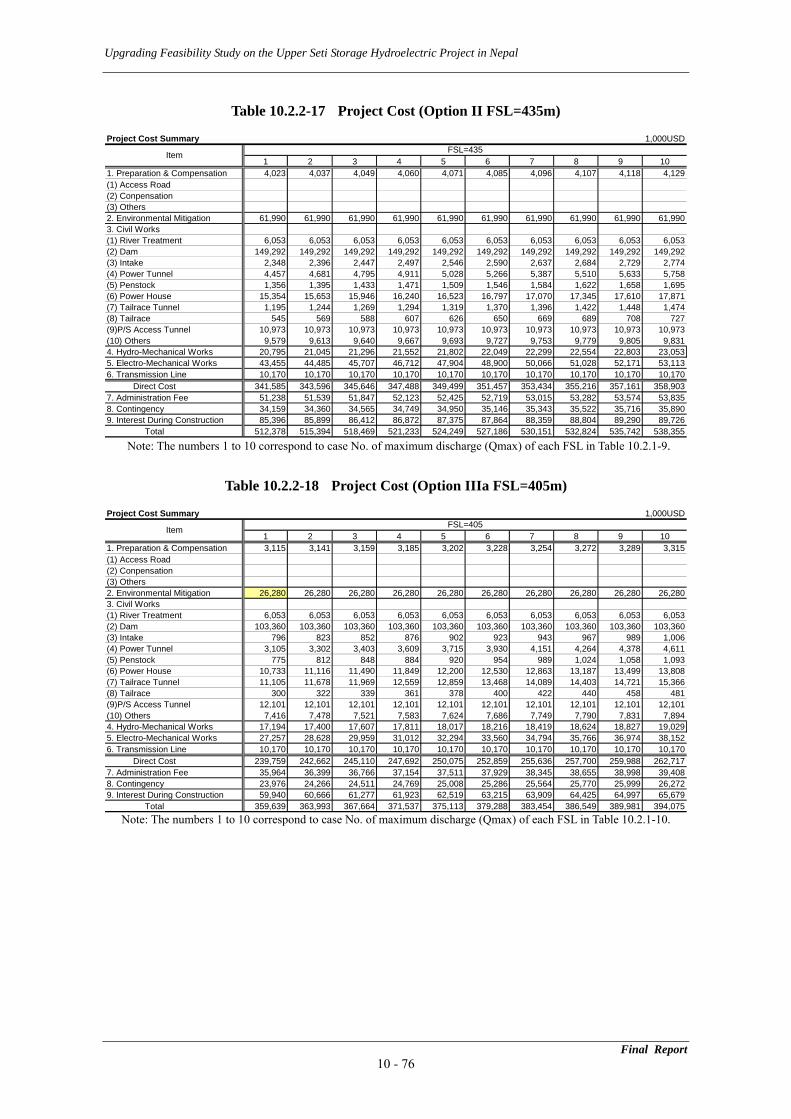
Upgrading Feasibility Study on the Upper Seti Storage Hydroelectric Project in Nepal
Table 10.2.2-17 Project Cost (Option II FSL=435m)
Project Cost Summary 1,000USD
1 2 3 4 5 6 7 8 9 101. Preparation & Compensation 4,023 4,037 4,049 4,060 4,071 4,085 4,096 4,107 4,118 4,129(1) Access Road(2) Conpensation(3) Others2. Environmental Mitigation 61,990 61,990 61,990 61,990 61,990 61,990 61,990 61,990 61,990 61,9903. Civil Works(1) River Treatment 6,053 6,053 6,053 6,053 6,053 6,053 6,053 6,053 6,053 6,053(2) Dam 149,292 149,292 149,292 149,292 149,292 149,292 149,292 149,292 149,292 149,292(3) Intake 2,348 2,396 2,447 2,497 2,546 2,590 2,637 2,684 2,729 2,774(4) Power Tunnel 4,457 4,681 4,795 4,911 5,028 5,266 5,387 5,510 5,633 5,758(5) Penstock 1,356 1,395 1,433 1,471 1,509 1,546 1,584 1,622 1,658 1,695(6) Power House 15,354 15,653 15,946 16,240 16,523 16,797 17,070 17,345 17,610 17,871(7) Tailrace Tunnel 1,195 1,244 1,269 1,294 1,319 1,370 1,396 1,422 1,448 1,474(8) Tailrace 545 569 588 607 626 650 669 689 708 727(9)P/S Access Tunnel 10,973 10,973 10,973 10,973 10,973 10,973 10,973 10,973 10,973 10,973(10) Others 9,579 9,613 9,640 9,667 9,693 9,727 9,753 9,779 9,805 9,8314. Hydro-Mechanical Works 20,795 21,045 21,296 21,552 21,802 22,049 22,299 22,554 22,803 23,0535. Electro-Mechanical Works 43,455 44,485 45,707 46,712 47,904 48,900 50,066 51,028 52,171 53,1136. Transmission Line 10,170 10,170 10,170 10,170 10,170 10,170 10,170 10,170 10,170 10,170
Direct Cost 341,585 343,596 345,646 347,488 349,499 351,457 353,434 355,216 357,161 358,9037. Administration Fee 51,238 51,539 51,847 52,123 52,425 52,719 53,015 53,282 53,574 53,8358. Contingency 34,159 34,360 34,565 34,749 34,950 35,146 35,343 35,522 35,716 35,8909. Interest During Construction 85,396 85,899 86,412 86,872 87,375 87,864 88,359 88,804 89,290 89,726
Total 512,378 515,394 518,469 521,233 524,249 527,186 530,151 532,824 535,742 538,355
Item FSL=435
Note: The numbers 1 to 10 correspond to case No. of maximum discharge (Qmax) of each FSL in Table 10.2.1-9.
Table 10.2.2-18 Project Cost (Option IIIa FSL=405m)
Project Cost Summary 1,000USD
1 2 3 4 5 6 7 8 9 101. Preparation & Compensation 3,115 3,141 3,159 3,185 3,202 3,228 3,254 3,272 3,289 3,315(1) Access Road(2) Conpensation(3) Others2. Environmental Mitigation 26,280 26,280 26,280 26,280 26,280 26,280 26,280 26,280 26,280 26,2803. Civil Works(1) River Treatment 6,053 6,053 6,053 6,053 6,053 6,053 6,053 6,053 6,053 6,053(2) Dam 103,360 103,360 103,360 103,360 103,360 103,360 103,360 103,360 103,360 103,360(3) Intake 796 823 852 876 902 923 943 967 989 1,006(4) Power Tunnel 3,105 3,302 3,403 3,609 3,715 3,930 4,151 4,264 4,378 4,611(5) Penstock 775 812 848 884 920 954 989 1,024 1,058 1,093(6) Power House 10,733 11,116 11,490 11,849 12,200 12,530 12,863 13,187 13,499 13,808(7) Tailrace Tunnel 11,105 11,678 11,969 12,559 12,859 13,468 14,089 14,403 14,721 15,366(8) Tailrace 300 322 339 361 378 400 422 440 458 481(9)P/S Access Tunnel 12,101 12,101 12,101 12,101 12,101 12,101 12,101 12,101 12,101 12,101(10) Others 7,416 7,478 7,521 7,583 7,624 7,686 7,749 7,790 7,831 7,8944. Hydro-Mechanical Works 17,194 17,400 17,607 17,811 18,017 18,216 18,419 18,624 18,827 19,0295. Electro-Mechanical Works 27,257 28,628 29,959 31,012 32,294 33,560 34,794 35,766 36,974 38,1526. Transmission Line 10,170 10,170 10,170 10,170 10,170 10,170 10,170 10,170 10,170 10,170
Direct Cost 239,759 242,662 245,110 247,692 250,075 252,859 255,636 257,700 259,988 262,7177. Administration Fee 35,964 36,399 36,766 37,154 37,511 37,929 38,345 38,655 38,998 39,4088. Contingency 23,976 24,266 24,511 24,769 25,008 25,286 25,564 25,770 25,999 26,2729. Interest During Construction 59,940 60,666 61,277 61,923 62,519 63,215 63,909 64,425 64,997 65,679
Total 359,639 363,993 367,664 371,537 375,113 379,288 383,454 386,549 389,981 394,075
Item FSL=405
Note: The numbers 1 to 10 correspond to case No. of maximum discharge (Qmax) of each FSL in Table 10.2.1-10.
Final Report 10 - 76
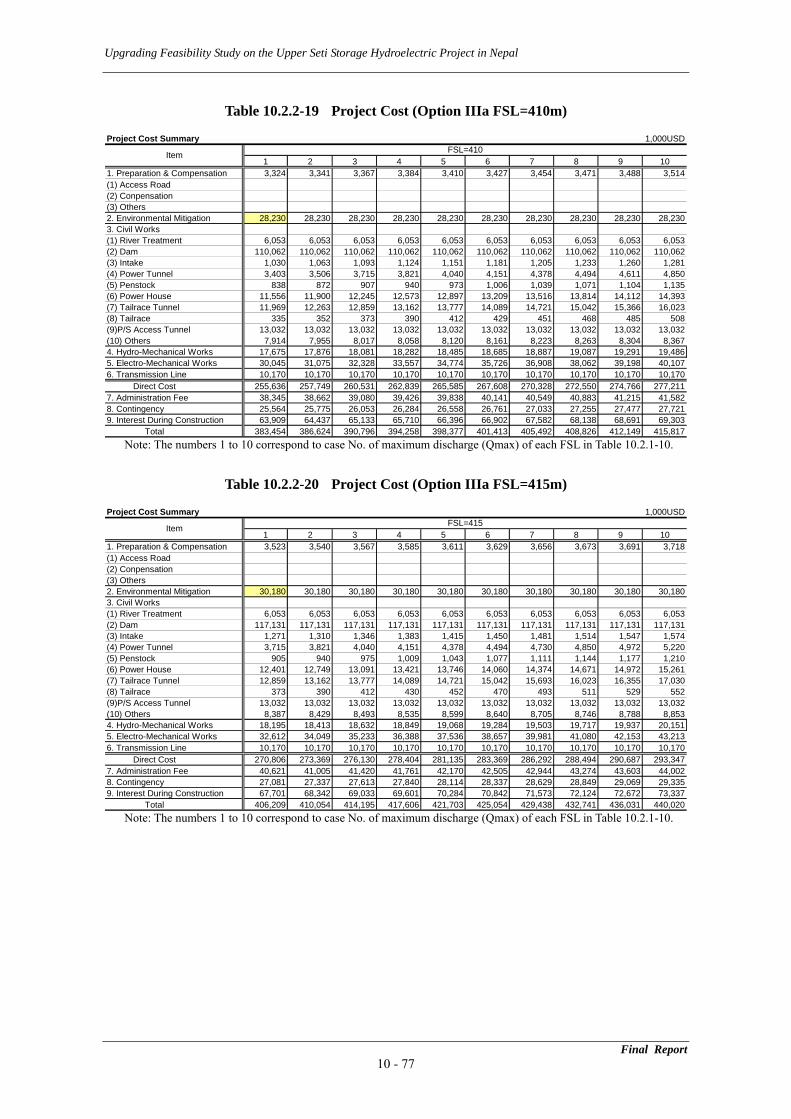
Upgrading Feasibility Study on the Upper Seti Storage Hydroelectric Project in Nepal
Table 10.2.2-19 Project Cost (Option IIIa FSL=410m)
Project Cost Summary 1,000USD
1 2 3 4 5 6 7 8 9 101. Preparation & Compensation 3,324 3,341 3,367 3,384 3,410 3,427 3,454 3,471 3,488 3,514(1) Access Road(2) Conpensation(3) Others2. Environmental Mitigation 28,230 28,230 28,230 28,230 28,230 28,230 28,230 28,230 28,230 28,2303. Civil Works(1) River Treatment 6,053 6,053 6,053 6,053 6,053 6,053 6,053 6,053 6,053 6,053(2) Dam 110,062 110,062 110,062 110,062 110,062 110,062 110,062 110,062 110,062 110,062(3) Intake 1,030 1,063 1,093 1,124 1,151 1,181 1,205 1,233 1,260 1,281(4) Power Tunnel 3,403 3,506 3,715 3,821 4,040 4,151 4,378 4,494 4,611 4,850(5) Penstock 838 872 907 940 973 1,006 1,039 1,071 1,104 1,135(6) Power House 11,556 11,900 12,245 12,573 12,897 13,209 13,516 13,814 14,112 14,393(7) Tailrace Tunnel 11,969 12,263 12,859 13,162 13,777 14,089 14,721 15,042 15,366 16,023(8) Tailrace 335 352 373 390 412 429 451 468 485 508(9)P/S Access Tunnel 13,032 13,032 13,032 13,032 13,032 13,032 13,032 13,032 13,032 13,032(10) Others 7,914 7,955 8,017 8,058 8,120 8,161 8,223 8,263 8,304 8,3674. Hydro-Mechanical Works 17,675 17,876 18,081 18,282 18,485 18,685 18,887 19,087 19,291 19,4865. Electro-Mechanical Works 30,045 31,075 32,328 33,557 34,774 35,726 36,908 38,062 39,198 40,1076. Transmission Line 10,170 10,170 10,170 10,170 10,170 10,170 10,170 10,170 10,170 10,170
Direct Cost 255,636 257,749 260,531 262,839 265,585 267,608 270,328 272,550 274,766 277,2117. Administration Fee 38,345 38,662 39,080 39,426 39,838 40,141 40,549 40,883 41,215 41,5828. Contingency 25,564 25,775 26,053 26,284 26,558 26,761 27,033 27,255 27,477 27,7219. Interest During Construction 63,909 64,437 65,133 65,710 66,396 66,902 67,582 68,138 68,691 69,303
Total 383,454 386,624 390,796 394,258 398,377 401,413 405,492 408,826 412,149 415,817
Item FSL=410
Note: The numbers 1 to 10 correspond to case No. of maximum discharge (Qmax) of each FSL in Table 10.2.1-10.
Table 10.2.2-20 Project Cost (Option IIIa FSL=415m)
Project Cost Summary 1,000USD
1 2 3 4 5 6 7 8 9 101. Preparation & Compensation 3,523 3,540 3,567 3,585 3,611 3,629 3,656 3,673 3,691 3,718(1) Access Road(2) Conpensation(3) Others2. Environmental Mitigation 30,180 30,180 30,180 30,180 30,180 30,180 30,180 30,180 30,180 30,1803. Civil Works(1) River Treatment 6,053 6,053 6,053 6,053 6,053 6,053 6,053 6,053 6,053 6,053(2) Dam 117,131 117,131 117,131 117,131 117,131 117,131 117,131 117,131 117,131 117,131(3) Intake 1,271 1,310 1,346 1,383 1,415 1,450 1,481 1,514 1,547 1,574(4) Power Tunnel 3,715 3,821 4,040 4,151 4,378 4,494 4,730 4,850 4,972 5,220(5) Penstock 905 940 975 1,009 1,043 1,077 1,111 1,144 1,177 1,210(6) Power House 12,401 12,749 13,091 13,421 13,746 14,060 14,374 14,671 14,972 15,261(7) Tailrace Tunnel 12,859 13,162 13,777 14,089 14,721 15,042 15,693 16,023 16,355 17,030(8) Tailrace 373 390 412 430 452 470 493 511 529 552(9)P/S Access Tunnel 13,032 13,032 13,032 13,032 13,032 13,032 13,032 13,032 13,032 13,032(10) Others 8,387 8,429 8,493 8,535 8,599 8,640 8,705 8,746 8,788 8,8534. Hydro-Mechanical Works 18,195 18,413 18,632 18,849 19,068 19,284 19,503 19,717 19,937 20,1515. Electro-Mechanical Works 32,612 34,049 35,233 36,388 37,536 38,657 39,981 41,080 42,153 43,2136. Transmission Line 10,170 10,170 10,170 10,170 10,170 10,170 10,170 10,170 10,170 10,170
Direct Cost 270,806 273,369 276,130 278,404 281,135 283,369 286,292 288,494 290,687 293,3477. Administration Fee 40,621 41,005 41,420 41,761 42,170 42,505 42,944 43,274 43,603 44,0028. Contingency 27,081 27,337 27,613 27,840 28,114 28,337 28,629 28,849 29,069 29,3359. Interest During Construction 67,701 68,342 69,033 69,601 70,284 70,842 71,573 72,124 72,672 73,337
Total 406,209 410,054 414,195 417,606 421,703 425,054 429,438 432,741 436,031 440,020
Item FSL=415
Note: The numbers 1 to 10 correspond to case No. of maximum discharge (Qmax) of each FSL in Table 10.2.1-10.
Final Report 10 - 77

Upgrading Feasibility Study on the Upper Seti Storage Hydroelectric Project in Nepal
Table 10.2.2-21 Project Cost (Option IIIa FSL=420m)
Project Cost Summary 1,000USD
1 2 3 4 5 6 7 8 9 101. Preparation & Compensation 3,731 3,749 3,776 3,794 3,822 3,840 3,858 3,885 3,903 3,921(1) Access Road(2) Conpensation(3) Others2. Environmental Mitigation 35,570 35,570 35,570 35,570 35,570 35,570 35,570 35,570 35,570 35,5703. Civil Works(1) River Treatment 6,053 6,053 6,053 6,053 6,053 6,053 6,053 6,053 6,053 6,053(2) Dam 124,578 124,578 124,578 124,578 124,578 124,578 124,578 124,578 124,578 124,578(3) Intake 1,523 1,568 1,607 1,649 1,685 1,726 1,764 1,798 1,834 1,871(4) Power Tunnel 4,040 4,151 4,378 4,494 4,730 4,850 4,972 5,220 5,346 5,474(5) Penstock 976 1,012 1,046 1,081 1,115 1,149 1,183 1,217 1,250 1,283(6) Power House 13,281 13,629 13,958 14,289 14,606 14,919 15,223 15,527 15,816 16,108(7) Tailrace Tunnel 13,777 14,089 14,721 15,042 15,693 16,023 16,355 17,030 17,372 17,717(8) Tailrace 413 431 454 472 495 513 531 555 574 592(9)P/S Access Tunnel 13,032 13,032 13,032 13,032 13,032 13,032 13,032 13,032 13,032 13,032(10) Others 8,884 8,927 8,991 9,034 9,099 9,142 9,185 9,250 9,293 9,3354. Hydro-Mechanical Works 18,768 19,001 19,227 19,459 19,685 19,916 20,143 20,373 20,597 20,8285. Electro-Mechanical Works 35,679 37,029 38,144 39,451 40,524 41,804 42,847 44,082 45,111 46,3166. Transmission Line 10,170 10,170 10,170 10,170 10,170 10,170 10,170 10,170 10,170 10,170
Direct Cost 290,474 292,988 295,704 298,168 300,856 303,283 305,462 308,340 310,496 312,8477. Administration Fee 43,571 43,948 44,356 44,725 45,128 45,492 45,819 46,251 46,574 46,9278. Contingency 29,047 29,299 29,570 29,817 30,086 30,328 30,546 30,834 31,050 31,2859. Interest During Construction 72,619 73,247 73,926 74,542 75,214 75,821 76,365 77,085 77,624 78,212
Total 435,712 439,481 443,557 447,252 451,284 454,925 458,193 462,509 465,745 469,271
Item FSL=420
Note: The numbers 1 to 10 correspond to case No. of maximum discharge (Qmax) of each FSL in Table 10.2.1-10.
Table 10.2.2-22 Project Cost (Option IIIa FSL=425m)
Project Cost Summary 1,000USD
1 2 3 4 5 6 7 8 9 101. Preparation & Compensation 3,950 3,978 3,996 4,014 4,042 4,060 4,078 4,106 4,124 4,142(1) Access Road(2) Compensation(3) Others2. Environmental Mitigation 40,960 40,960 40,960 40,960 40,960 40,960 40,960 40,960 40,960 40,9603. Civil Works(1) River Treatment 6,053 6,053 6,053 6,053 6,053 6,053 6,053 6,053 6,053 6,053(2) Dam 132,413 132,413 132,413 132,413 132,413 132,413 132,413 132,413 132,413 132,413(3) Intake 1,791 1,834 1,880 1,925 1,964 2,007 2,048 2,085 2,125 2,164(4) Power Tunnel 4,378 4,611 4,730 4,850 5,095 5,220 5,346 5,603 5,733 5,866(5) Penstock 1,053 1,088 1,121 1,156 1,189 1,223 1,256 1,290 1,322 1,355(6) Power House 14,200 14,534 14,854 15,170 15,477 15,784 16,075 16,370 16,651 16,936(7) Tailrace Tunnel 14,721 15,366 15,693 16,023 16,691 17,030 17,372 18,064 18,415 18,769(8) Tailrace 456 479 497 516 539 558 576 600 619 638(9)P/S Access Tunnel 13,032 13,032 13,032 13,032 13,032 13,032 13,032 13,032 13,032 13,032(10) Others 9,405 9,470 9,514 9,557 9,623 9,666 9,709 9,776 9,818 9,8614. Hydro-Mechanical Works 19,402 19,640 19,874 20,110 20,342 20,580 20,811 21,048 21,278 21,5155. Electro-Mechanical Works 38,948 40,217 41,260 42,504 43,721 44,722 45,921 47,093 48,071 49,2186. Transmission Line 10,170 10,170 10,170 10,170 10,170 10,170 10,170 10,170 10,170 10,170
Direct Cost 310,931 313,844 316,045 318,451 321,310 323,477 325,818 328,662 330,783 333,0917. Administration Fee 46,640 47,077 47,407 47,768 48,197 48,522 48,873 49,299 49,617 49,9648. Contingency 31,093 31,384 31,604 31,845 32,131 32,348 32,582 32,866 33,078 33,3099. Interest During Construction 77,733 78,461 79,011 79,613 80,328 80,869 81,455 82,165 82,696 83,273
Total 466,396 470,767 474,067 477,677 481,965 485,215 488,727 492,993 496,175 499,637
Item FSL=425
Note: The numbers 1 to 10 correspond to case No. of maximum discharge (Qmax) of each FSL in Table 10.2.1-10.
Final Report 10 - 78
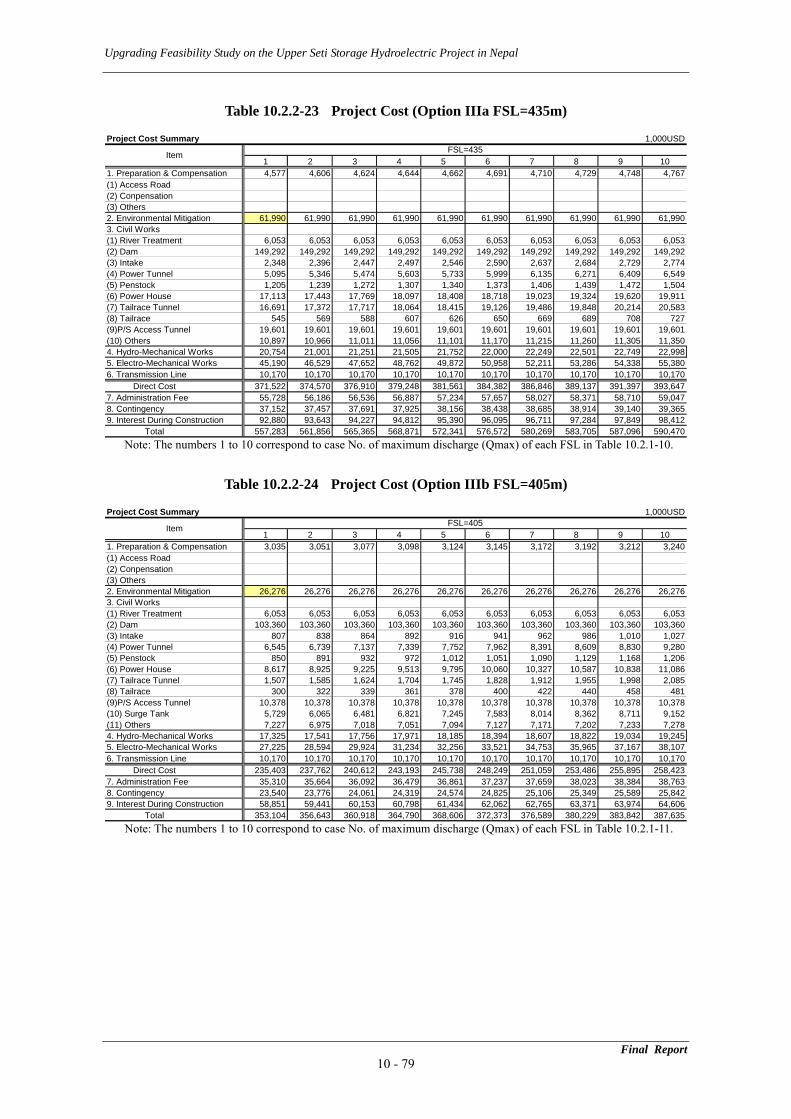
Upgrading Feasibility Study on the Upper Seti Storage Hydroelectric Project in Nepal
Table 10.2.2-23 Project Cost (Option IIIa FSL=435m)
Project Cost Summary 1,000USD
1 2 3 4 5 6 7 8 9 101. Preparation & Compensation 4,577 4,606 4,624 4,644 4,662 4,691 4,710 4,729 4,748 4,767(1) Access Road(2) Conpensation(3) Others2. Environmental Mitigation 61,990 61,990 61,990 61,990 61,990 61,990 61,990 61,990 61,990 61,9903. Civil Works(1) River Treatment 6,053 6,053 6,053 6,053 6,053 6,053 6,053 6,053 6,053 6,053(2) Dam 149,292 149,292 149,292 149,292 149,292 149,292 149,292 149,292 149,292 149,292(3) Intake 2,348 2,396 2,447 2,497 2,546 2,590 2,637 2,684 2,729 2,774(4) Power Tunnel 5,095 5,346 5,474 5,603 5,733 5,999 6,135 6,271 6,409 6,549(5) Penstock 1,205 1,239 1,272 1,307 1,340 1,373 1,406 1,439 1,472 1,504(6) Power House 17,113 17,443 17,769 18,097 18,408 18,718 19,023 19,324 19,620 19,911(7) Tailrace Tunnel 16,691 17,372 17,717 18,064 18,415 19,126 19,486 19,848 20,214 20,583(8) Tailrace 545 569 588 607 626 650 669 689 708 727(9)P/S Access Tunnel 19,601 19,601 19,601 19,601 19,601 19,601 19,601 19,601 19,601 19,601(10) Others 10,897 10,966 11,011 11,056 11,101 11,170 11,215 11,260 11,305 11,3504. Hydro-Mechanical Works 20,754 21,001 21,251 21,505 21,752 22,000 22,249 22,501 22,749 22,9985. Electro-Mechanical Works 45,190 46,529 47,652 48,762 49,872 50,958 52,211 53,286 54,338 55,3806. Transmission Line 10,170 10,170 10,170 10,170 10,170 10,170 10,170 10,170 10,170 10,170
Direct Cost 371,522 374,570 376,910 379,248 381,561 384,382 386,846 389,137 391,397 393,6477. Administration Fee 55,728 56,186 56,536 56,887 57,234 57,657 58,027 58,371 58,710 59,0478. Contingency 37,152 37,457 37,691 37,925 38,156 38,438 38,685 38,914 39,140 39,3659. Interest During Construction 92,880 93,643 94,227 94,812 95,390 96,095 96,711 97,284 97,849 98,412
Total 557,283 561,856 565,365 568,871 572,341 576,572 580,269 583,705 587,096 590,470
Item FSL=435
Note: The numbers 1 to 10 correspond to case No. of maximum discharge (Qmax) of each FSL in Table 10.2.1-10.
Table 10.2.2-24 Project Cost (Option IIIb FSL=405m)
Project Cost Summary 1,000USD
1 2 3 4 5 6 7 8 9 101. Preparation & Compensation 3,035 3,051 3,077 3,098 3,124 3,145 3,172 3,192 3,212 3,240(1) Access Road(2) Conpensation(3) Others2. Environmental Mitigation 26,276 26,276 26,276 26,276 26,276 26,276 26,276 26,276 26,276 26,2763. Civil Works(1) River Treatment 6,053 6,053 6,053 6,053 6,053 6,053 6,053 6,053 6,053 6,053(2) Dam 103,360 103,360 103,360 103,360 103,360 103,360 103,360 103,360 103,360 103,360(3) Intake 807 838 864 892 916 941 962 986 1,010 1,027(4) Power Tunnel 6,545 6,739 7,137 7,339 7,752 7,962 8,391 8,609 8,830 9,280(5) Penstock 850 891 932 972 1,012 1,051 1,090 1,129 1,168 1,206(6) Power House 8,617 8,925 9,225 9,513 9,795 10,060 10,327 10,587 10,838 11,086(7) Tailrace Tunnel 1,507 1,585 1,624 1,704 1,745 1,828 1,912 1,955 1,998 2,085(8) Tailrace 300 322 339 361 378 400 422 440 458 481(9)P/S Access Tunnel 10,378 10,378 10,378 10,378 10,378 10,378 10,378 10,378 10,378 10,378(10) Surge Tank 5,729 6,065 6,481 6,821 7,245 7,583 8,014 8,362 8,711 9,152(11) Others 7,227 6,975 7,018 7,051 7,094 7,127 7,171 7,202 7,233 7,2784. Hydro-Mechanical Works 17,325 17,541 17,756 17,971 18,185 18,394 18,607 18,822 19,034 19,2455. Electro-Mechanical Works 27,225 28,594 29,924 31,234 32,256 33,521 34,753 35,965 37,167 38,1076. Transmission Line 10,170 10,170 10,170 10,170 10,170 10,170 10,170 10,170 10,170 10,170
Direct Cost 235,403 237,762 240,612 243,193 245,738 248,249 251,059 253,486 255,895 258,4237. Administration Fee 35,310 35,664 36,092 36,479 36,861 37,237 37,659 38,023 38,384 38,7638. Contingency 23,540 23,776 24,061 24,319 24,574 24,825 25,106 25,349 25,589 25,8429. Interest During Construction 58,851 59,441 60,153 60,798 61,434 62,062 62,765 63,371 63,974 64,606
Total 353,104 356,643 360,918 364,790 368,606 372,373 376,589 380,229 383,842 387,635
Item FSL=405
Note: The numbers 1 to 10 correspond to case No. of maximum discharge (Qmax) of each FSL in Table 10.2.1-11.
Final Report 10 - 79
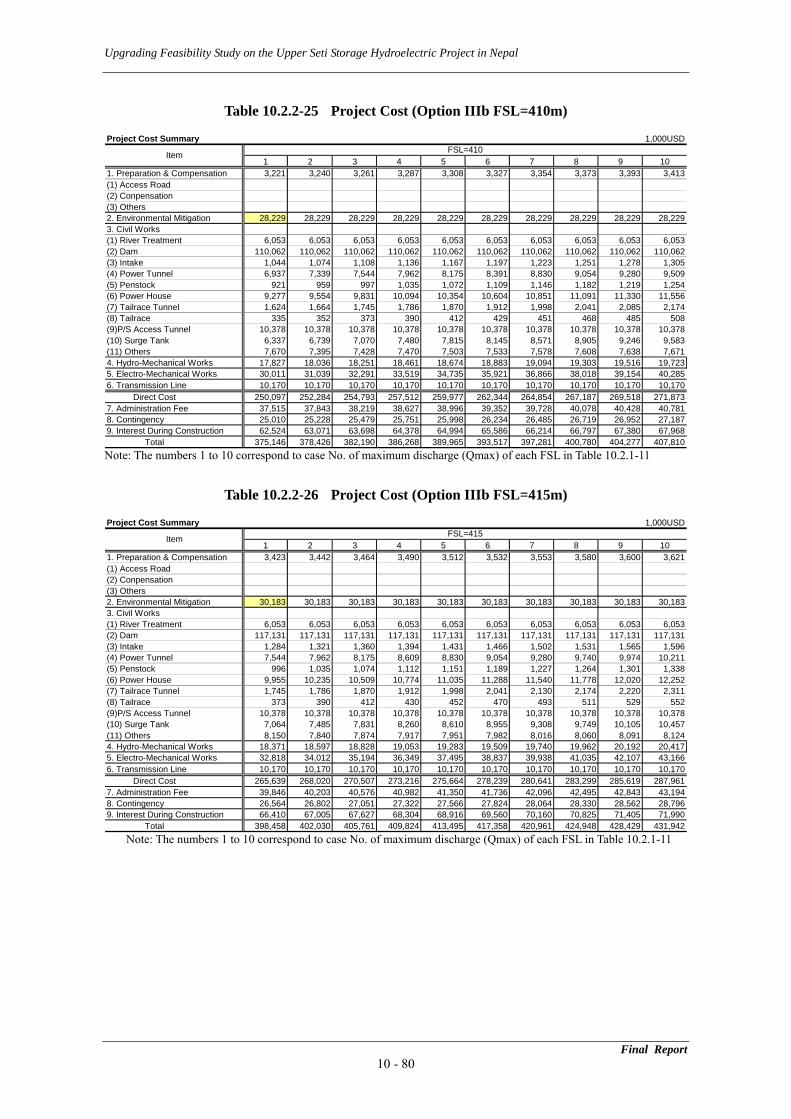
Upgrading Feasibility Study on the Upper Seti Storage Hydroelectric Project in Nepal
Table 10.2.2-25 Project Cost (Option IIIb FSL=410m)
Project Cost Summary 1,000USD
1 2 3 4 5 6 7 8 9 101. Preparation & Compensation 3,221 3,240 3,261 3,287 3,308 3,327 3,354 3,373 3,393 3,413(1) Access Road(2) Conpensation(3) Others2. Environmental Mitigation 28,229 28,229 28,229 28,229 28,229 28,229 28,229 28,229 28,229 28,2293. Civil Works(1) River Treatment 6,053 6,053 6,053 6,053 6,053 6,053 6,053 6,053 6,053 6,053(2) Dam 110,062 110,062 110,062 110,062 110,062 110,062 110,062 110,062 110,062 110,062(3) Intake 1,044 1,074 1,108 1,136 1,167 1,197 1,223 1,251 1,278 1,305(4) Power Tunnel 6,937 7,339 7,544 7,962 8,175 8,391 8,830 9,054 9,280 9,509(5) Penstock 921 959 997 1,035 1,072 1,109 1,146 1,182 1,219 1,254(6) Power House 9,277 9,554 9,831 10,094 10,354 10,604 10,851 11,091 11,330 11,556(7) Tailrace Tunnel 1,624 1,664 1,745 1,786 1,870 1,912 1,998 2,041 2,085 2,174(8) Tailrace 335 352 373 390 412 429 451 468 485 508(9)P/S Access Tunnel 10,378 10,378 10,378 10,378 10,378 10,378 10,378 10,378 10,378 10,378(10) Surge Tank 6,337 6,739 7,070 7,480 7,815 8,145 8,571 8,905 9,246 9,583(11) Others 7,670 7,395 7,428 7,470 7,503 7,533 7,578 7,608 7,638 7,6714. Hydro-Mechanical Works 17,827 18,036 18,251 18,461 18,674 18,883 19,094 19,303 19,516 19,7235. Electro-Mechanical Works 30,011 31,039 32,291 33,519 34,735 35,921 36,866 38,018 39,154 40,2856. Transmission Line 10,170 10,170 10,170 10,170 10,170 10,170 10,170 10,170 10,170 10,170
Direct Cost 250,097 252,284 254,793 257,512 259,977 262,344 264,854 267,187 269,518 271,8737. Administration Fee 37,515 37,843 38,219 38,627 38,996 39,352 39,728 40,078 40,428 40,7818. Contingency 25,010 25,228 25,479 25,751 25,998 26,234 26,485 26,719 26,952 27,1879. Interest During Construction 62,524 63,071 63,698 64,378 64,994 65,586 66,214 66,797 67,380 67,968
Total 375,146 378,426 382,190 386,268 389,965 393,517 397,281 400,780 404,277 407,810
Item FSL=410
Note: The numbers 1 to 10 correspond to case No. of maximum discharge (Qmax) of each FSL in Table 10.2.1-11
Table 10.2.2-26 Project Cost (Option IIIb FSL=415m)
Project Cost Summary 1,000USD
1 2 3 4 5 6 7 8 9 101. Preparation & Compensation 3,423 3,442 3,464 3,490 3,512 3,532 3,553 3,580 3,600 3,621(1) Access Road(2) Conpensation(3) Others2. Environmental Mitigation 30,183 30,183 30,183 30,183 30,183 30,183 30,183 30,183 30,183 30,1833. Civil Works(1) River Treatment 6,053 6,053 6,053 6,053 6,053 6,053 6,053 6,053 6,053 6,053(2) Dam 117,131 117,131 117,131 117,131 117,131 117,131 117,131 117,131 117,131 117,131(3) Intake 1,284 1,321 1,360 1,394 1,431 1,466 1,502 1,531 1,565 1,596(4) Power Tunnel 7,544 7,962 8,175 8,609 8,830 9,054 9,280 9,740 9,974 10,211(5) Penstock 996 1,035 1,074 1,112 1,151 1,189 1,227 1,264 1,301 1,338(6) Power House 9,955 10,235 10,509 10,774 11,035 11,288 11,540 11,778 12,020 12,252(7) Tailrace Tunnel 1,745 1,786 1,870 1,912 1,998 2,041 2,130 2,174 2,220 2,311(8) Tailrace 373 390 412 430 452 470 493 511 529 552(9)P/S Access Tunnel 10,378 10,378 10,378 10,378 10,378 10,378 10,378 10,378 10,378 10,378(10) Surge Tank 7,064 7,485 7,831 8,260 8,610 8,955 9,308 9,749 10,105 10,457(11) Others 8,150 7,840 7,874 7,917 7,951 7,982 8,016 8,060 8,091 8,1244. Hydro-Mechanical Works 18,371 18,597 18,828 19,053 19,283 19,509 19,740 19,962 20,192 20,4175. Electro-Mechanical Works 32,818 34,012 35,194 36,349 37,495 38,837 39,938 41,035 42,107 43,1666. Transmission Line 10,170 10,170 10,170 10,170 10,170 10,170 10,170 10,170 10,170 10,170
Direct Cost 265,639 268,020 270,507 273,216 275,664 278,239 280,641 283,299 285,619 287,9617. Administration Fee 39,846 40,203 40,576 40,982 41,350 41,736 42,096 42,495 42,843 43,1948. Contingency 26,564 26,802 27,051 27,322 27,566 27,824 28,064 28,330 28,562 28,7969. Interest During Construction 66,410 67,005 67,627 68,304 68,916 69,560 70,160 70,825 71,405 71,990
Total 398,458 402,030 405,761 409,824 413,495 417,358 420,961 424,948 428,429 431,942
Item FSL=415
Note: The numbers 1 to 10 correspond to case No. of maximum discharge (Qmax) of each FSL in Table 10.2.1-11
Final Report 10 - 80
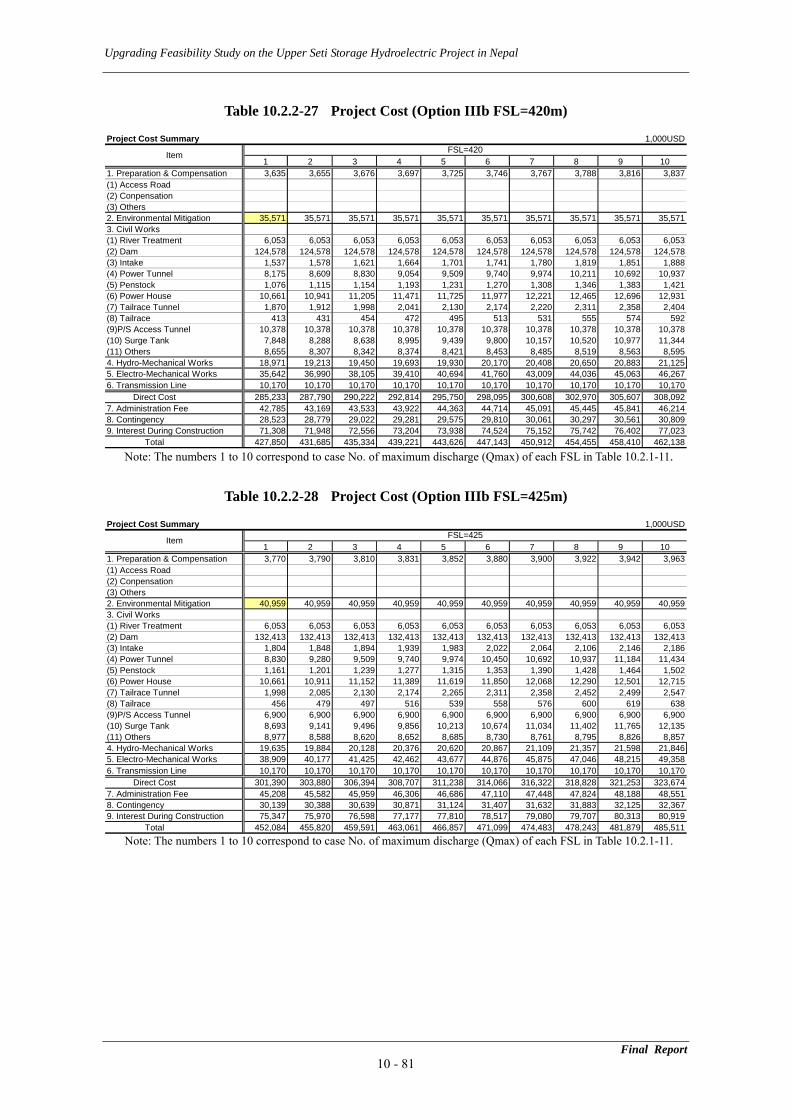
Upgrading Feasibility Study on the Upper Seti Storage Hydroelectric Project in Nepal
Table 10.2.2-27 Project Cost (Option IIIb FSL=420m)
Project Cost Summary 1,000USD
1 2 3 4 5 6 7 8 9 101. Preparation & Compensation 3,635 3,655 3,676 3,697 3,725 3,746 3,767 3,788 3,816 3,837(1) Access Road(2) Conpensation(3) Others2. Environmental Mitigation 35,571 35,571 35,571 35,571 35,571 35,571 35,571 35,571 35,571 35,5713. Civil Works(1) River Treatment 6,053 6,053 6,053 6,053 6,053 6,053 6,053 6,053 6,053 6,053(2) Dam 124,578 124,578 124,578 124,578 124,578 124,578 124,578 124,578 124,578 124,578(3) Intake 1,537 1,578 1,621 1,664 1,701 1,741 1,780 1,819 1,851 1,888(4) Power Tunnel 8,175 8,609 8,830 9,054 9,509 9,740 9,974 10,211 10,692 10,937(5) Penstock 1,076 1,115 1,154 1,193 1,231 1,270 1,308 1,346 1,383 1,421(6) Power House 10,661 10,941 11,205 11,471 11,725 11,977 12,221 12,465 12,696 12,931(7) Tailrace Tunnel 1,870 1,912 1,998 2,041 2,130 2,174 2,220 2,311 2,358 2,404(8) Tailrace 413 431 454 472 495 513 531 555 574 592(9)P/S Access Tunnel 10,378 10,378 10,378 10,378 10,378 10,378 10,378 10,378 10,378 10,378(10) Surge Tank 7,848 8,288 8,638 8,995 9,439 9,800 10,157 10,520 10,977 11,344(11) Others 8,655 8,307 8,342 8,374 8,421 8,453 8,485 8,519 8,563 8,5954. Hydro-Mechanical Works 18,971 19,213 19,450 19,693 19,930 20,170 20,408 20,650 20,883 21,1255. Electro-Mechanical Works 35,642 36,990 38,105 39,410 40,694 41,760 43,009 44,036 45,063 46,2676. Transmission Line 10,170 10,170 10,170 10,170 10,170 10,170 10,170 10,170 10,170 10,170
Direct Cost 285,233 287,790 290,222 292,814 295,750 298,095 300,608 302,970 305,607 308,0927. Administration Fee 42,785 43,169 43,533 43,922 44,363 44,714 45,091 45,445 45,841 46,2148. Contingency 28,523 28,779 29,022 29,281 29,575 29,810 30,061 30,297 30,561 30,8099. Interest During Construction 71,308 71,948 72,556 73,204 73,938 74,524 75,152 75,742 76,402 77,023
Total 427,850 431,685 435,334 439,221 443,626 447,143 450,912 454,455 458,410 462,138
Item FSL=420
Note: The numbers 1 to 10 correspond to case No. of maximum discharge (Qmax) of each FSL in Table 10.2.1-11.
Table 10.2.2-28 Project Cost (Option IIIb FSL=425m)
Project Cost Summary 1,000USD
1 2 3 4 5 6 7 8 9 101. Preparation & Compensation 3,770 3,790 3,810 3,831 3,852 3,880 3,900 3,922 3,942 3,963(1) Access Road(2) Conpensation(3) Others2. Environmental Mitigation 40,959 40,959 40,959 40,959 40,959 40,959 40,959 40,959 40,959 40,9593. Civil Works(1) River Treatment 6,053 6,053 6,053 6,053 6,053 6,053 6,053 6,053 6,053 6,053(2) Dam 132,413 132,413 132,413 132,413 132,413 132,413 132,413 132,413 132,413 132,413(3) Intake 1,804 1,848 1,894 1,939 1,983 2,022 2,064 2,106 2,146 2,186(4) Power Tunnel 8,830 9,280 9,509 9,740 9,974 10,450 10,692 10,937 11,184 11,434(5) Penstock 1,161 1,201 1,239 1,277 1,315 1,353 1,390 1,428 1,464 1,502(6) Power House 10,661 10,911 11,152 11,389 11,619 11,850 12,068 12,290 12,501 12,715(7) Tailrace Tunnel 1,998 2,085 2,130 2,174 2,265 2,311 2,358 2,452 2,499 2,547(8) Tailrace 456 479 497 516 539 558 576 600 619 638(9)P/S Access Tunnel 6,900 6,900 6,900 6,900 6,900 6,900 6,900 6,900 6,900 6,900(10) Surge Tank 8,693 9,141 9,496 9,856 10,213 10,674 11,034 11,402 11,765 12,135(11) Others 8,977 8,588 8,620 8,652 8,685 8,730 8,761 8,795 8,826 8,8574. Hydro-Mechanical Works 19,635 19,884 20,128 20,376 20,620 20,867 21,109 21,357 21,598 21,8465. Electro-Mechanical Works 38,909 40,177 41,425 42,462 43,677 44,876 45,875 47,046 48,215 49,3586. Transmission Line 10,170 10,170 10,170 10,170 10,170 10,170 10,170 10,170 10,170 10,170
Direct Cost 301,390 303,880 306,394 308,707 311,238 314,066 316,322 318,828 321,253 323,6747. Administration Fee 45,208 45,582 45,959 46,306 46,686 47,110 47,448 47,824 48,188 48,5518. Contingency 30,139 30,388 30,639 30,871 31,124 31,407 31,632 31,883 32,125 32,3679. Interest During Construction 75,347 75,970 76,598 77,177 77,810 78,517 79,080 79,707 80,313 80,919
Total 452,084 455,820 459,591 463,061 466,857 471,099 474,483 478,243 481,879 485,511
Item FSL=425
Note: The numbers 1 to 10 correspond to case No. of maximum discharge (Qmax) of each FSL in Table 10.2.1-11.
Final Report 10 - 81
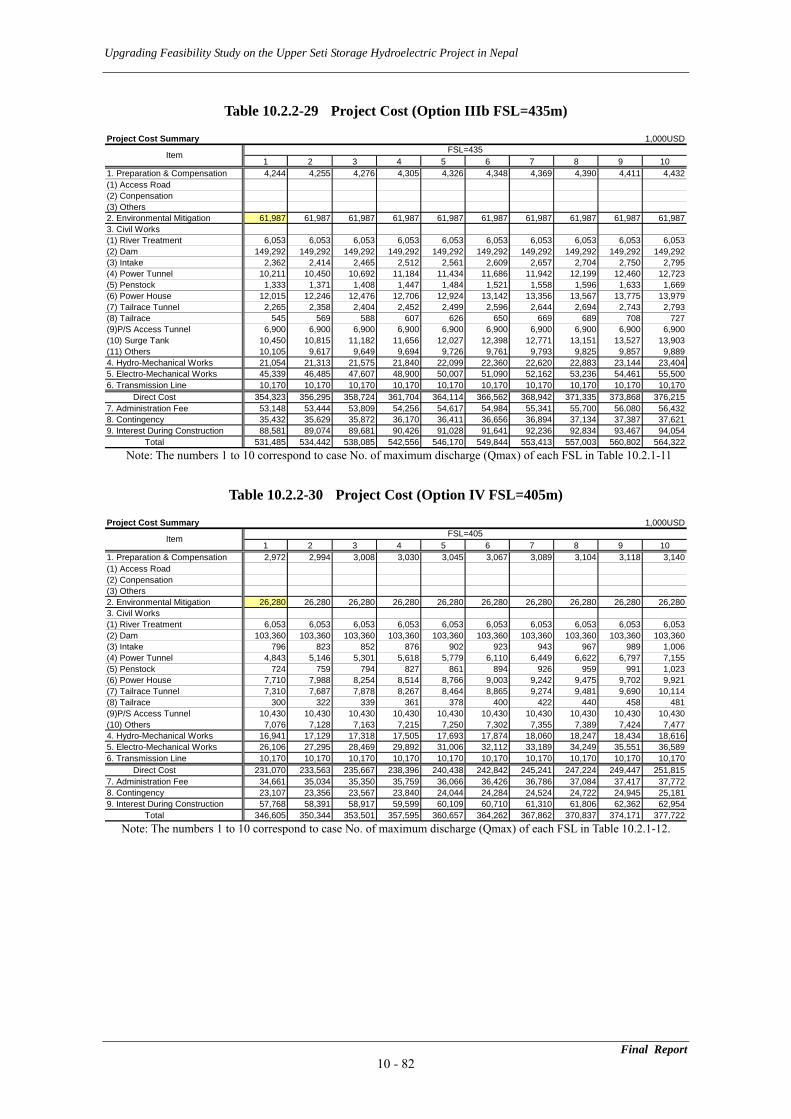
Upgrading Feasibility Study on the Upper Seti Storage Hydroelectric Project in Nepal
Table 10.2.2-29 Project Cost (Option IIIb FSL=435m)
Project Cost Summary 1,000USD
1 2 3 4 5 6 7 8 9 101. Preparation & Compensation 4,244 4,255 4,276 4,305 4,326 4,348 4,369 4,390 4,411 4,432(1) Access Road(2) Conpensation(3) Others2. Environmental Mitigation 61,987 61,987 61,987 61,987 61,987 61,987 61,987 61,987 61,987 61,9873. Civil Works(1) River Treatment 6,053 6,053 6,053 6,053 6,053 6,053 6,053 6,053 6,053 6,053(2) Dam 149,292 149,292 149,292 149,292 149,292 149,292 149,292 149,292 149,292 149,292(3) Intake 2,362 2,414 2,465 2,512 2,561 2,609 2,657 2,704 2,750 2,795(4) Power Tunnel 10,211 10,450 10,692 11,184 11,434 11,686 11,942 12,199 12,460 12,723(5) Penstock 1,333 1,371 1,408 1,447 1,484 1,521 1,558 1,596 1,633 1,669(6) Power House 12,015 12,246 12,476 12,706 12,924 13,142 13,356 13,567 13,775 13,979(7) Tailrace Tunnel 2,265 2,358 2,404 2,452 2,499 2,596 2,644 2,694 2,743 2,793(8) Tailrace 545 569 588 607 626 650 669 689 708 727(9)P/S Access Tunnel 6,900 6,900 6,900 6,900 6,900 6,900 6,900 6,900 6,900 6,900(10) Surge Tank 10,450 10,815 11,182 11,656 12,027 12,398 12,771 13,151 13,527 13,903(11) Others 10,105 9,617 9,649 9,694 9,726 9,761 9,793 9,825 9,857 9,8894. Hydro-Mechanical Works 21,054 21,313 21,575 21,840 22,099 22,360 22,620 22,883 23,144 23,4045. Electro-Mechanical Works 45,339 46,485 47,607 48,900 50,007 51,090 52,162 53,236 54,461 55,5006. Transmission Line 10,170 10,170 10,170 10,170 10,170 10,170 10,170 10,170 10,170 10,170
Direct Cost 354,323 356,295 358,724 361,704 364,114 366,562 368,942 371,335 373,868 376,2157. Administration Fee 53,148 53,444 53,809 54,256 54,617 54,984 55,341 55,700 56,080 56,4328. Contingency 35,432 35,629 35,872 36,170 36,411 36,656 36,894 37,134 37,387 37,6219. Interest During Construction 88,581 89,074 89,681 90,426 91,028 91,641 92,236 92,834 93,467 94,054
Total 531,485 534,442 538,085 542,556 546,170 549,844 553,413 557,003 560,802 564,322
Item FSL=435
Note: The numbers 1 to 10 correspond to case No. of maximum discharge (Qmax) of each FSL in Table 10.2.1-11
Table 10.2.2-30 Project Cost (Option IV FSL=405m)
Project Cost Summary 1,000USD
1 2 3 4 5 6 7 8 9 101. Preparation & Compensation 2,972 2,994 3,008 3,030 3,045 3,067 3,089 3,104 3,118 3,140(1) Access Road(2) Conpensation(3) Others2. Environmental Mitigation 26,280 26,280 26,280 26,280 26,280 26,280 26,280 26,280 26,280 26,2803. Civil Works(1) River Treatment 6,053 6,053 6,053 6,053 6,053 6,053 6,053 6,053 6,053 6,053(2) Dam 103,360 103,360 103,360 103,360 103,360 103,360 103,360 103,360 103,360 103,360(3) Intake 796 823 852 876 902 923 943 967 989 1,006(4) Power Tunnel 4,843 5,146 5,301 5,618 5,779 6,110 6,449 6,622 6,797 7,155(5) Penstock 724 759 794 827 861 894 926 959 991 1,023(6) Power House 7,710 7,988 8,254 8,514 8,766 9,003 9,242 9,475 9,702 9,921(7) Tailrace Tunnel 7,310 7,687 7,878 8,267 8,464 8,865 9,274 9,481 9,690 10,114(8) Tailrace 300 322 339 361 378 400 422 440 458 481(9)P/S Access Tunnel 10,430 10,430 10,430 10,430 10,430 10,430 10,430 10,430 10,430 10,430(10) Others 7,076 7,128 7,163 7,215 7,250 7,302 7,355 7,389 7,424 7,4774. Hydro-Mechanical Works 16,941 17,129 17,318 17,505 17,693 17,874 18,060 18,247 18,434 18,6165. Electro-Mechanical Works 26,106 27,295 28,469 29,892 31,006 32,112 33,189 34,249 35,551 36,5896. Transmission Line 10,170 10,170 10,170 10,170 10,170 10,170 10,170 10,170 10,170 10,170
Direct Cost 231,070 233,563 235,667 238,396 240,438 242,842 245,241 247,224 249,447 251,8157. Administration Fee 34,661 35,034 35,350 35,759 36,066 36,426 36,786 37,084 37,417 37,7728. Contingency 23,107 23,356 23,567 23,840 24,044 24,284 24,524 24,722 24,945 25,1819. Interest During Construction 57,768 58,391 58,917 59,599 60,109 60,710 61,310 61,806 62,362 62,954
Total 346,605 350,344 353,501 357,595 360,657 364,262 367,862 370,837 374,171 377,722
Item FSL=405
Note: The numbers 1 to 10 correspond to case No. of maximum discharge (Qmax) of each FSL in Table 10.2.1-12.
Final Report 10 - 82

Upgrading Feasibility Study on the Upper Seti Storage Hydroelectric Project in Nepal
Table 10.2.2-31 Project Cost (Option IV FSL=410m)
Project Cost Summary 1,000USD
1 2 3 4 5 6 7 8 9 101. Preparation & Compensation 3,154 3,168 3,190 3,205 3,227 3,241 3,263 3,277 3,292 3,314(1) Access Road(2) Conpensation(3) Others2. Environmental Mitigation 28,230 28,230 28,230 28,230 28,230 28,230 28,230 28,230 28,230 28,2303. Civil Works(1) River Treatment 6,053 6,053 6,053 6,053 6,053 6,053 6,053 6,053 6,053 6,053(2) Dam 110,062 110,062 110,062 110,062 110,062 110,062 110,062 110,062 110,062 110,062(3) Intake 1,030 1,063 1,093 1,124 1,151 1,181 1,205 1,233 1,260 1,281(4) Power Tunnel 5,301 5,458 5,779 5,943 6,278 6,449 6,797 6,975 7,155 7,521(5) Penstock 784 816 848 880 911 942 973 1,003 1,034 1,064(6) Power House 8,320 8,567 8,816 9,052 9,285 9,509 9,733 9,945 10,159 10,365(7) Tailrace Tunnel 7,878 8,072 8,464 8,664 9,068 9,274 9,690 9,901 10,114 10,547(8) Tailrace 335 352 373 390 412 429 451 468 485 508(9)P/S Access Tunnel 10,430 10,430 10,430 10,430 10,430 10,430 10,430 10,430 10,430 10,430(10) Others 7,510 7,544 7,596 7,630 7,683 7,716 7,770 7,803 7,838 7,8924. Hydro-Mechanical Works 17,387 17,570 17,758 17,942 18,127 18,311 18,497 18,678 18,865 19,0455. Electro-Mechanical Works 28,840 29,955 31,042 32,110 33,171 34,462 35,477 36,490 37,479 38,4546. Transmission Line 10,170 10,170 10,170 10,170 10,170 10,170 10,170 10,170 10,170 10,170
Direct Cost 245,483 247,511 249,905 251,884 254,258 256,458 258,802 260,719 262,626 264,9357. Administration Fee 36,822 37,127 37,486 37,783 38,139 38,469 38,820 39,108 39,394 39,7408. Contingency 24,548 24,751 24,990 25,188 25,426 25,646 25,880 26,072 26,263 26,4949. Interest During Construction 61,371 61,878 62,476 62,971 63,564 64,114 64,700 65,180 65,656 66,234
Total 368,224 371,267 374,857 377,826 381,386 384,687 388,203 391,079 393,938 397,403
Item FSL=410
Note: The numbers 1 to 10 correspond to case No. of maximum discharge (Qmax) of each FSL in Table 10.2.1-12.
Table 10.2.2-32 Project Cost (Option IV FSL=415m)
Project Cost Summary 1,000USD
1 2 3 4 5 6 7 8 9 101. Preparation & Compensation 3,345 3,360 3,383 3,397 3,420 3,435 3,458 3,473 3,487 3,511(1) Access Road(2) Conpensation(3) Others2. Environmental Mitigation 30,180 30,180 30,180 30,180 30,180 30,180 30,180 30,180 30,180 30,1803. Civil Works(1) River Treatment 6,053 6,053 6,053 6,053 6,053 6,053 6,053 6,053 6,053 6,053(2) Dam 117,131 117,131 117,131 117,131 117,131 117,131 117,131 117,131 117,131 117,131(3) Intake 1,271 1,310 1,346 1,383 1,415 1,450 1,481 1,514 1,547 1,574(4) Power Tunnel 5,779 5,943 6,278 6,449 6,797 6,975 7,337 7,521 7,708 8,087(5) Penstock 847 880 913 945 977 1,009 1,041 1,072 1,103 1,134(6) Power House 8,944 9,195 9,441 9,679 9,916 10,140 10,366 10,583 10,800 11,005(7) Tailrace Tunnel 8,464 8,664 9,068 9,274 9,690 9,901 10,329 10,547 10,766 11,210(8) Tailrace 373 390 412 430 452 470 493 511 529 552(9)P/S Access Tunnel 10,430 10,430 10,430 10,430 10,430 10,430 10,430 10,430 10,430 10,430(10) Others 7,965 8,000 8,054 8,089 8,143 8,178 8,233 8,268 8,303 8,3594. Hydro-Mechanical Works 17,867 18,067 18,268 18,467 18,668 18,865 19,066 19,264 19,465 19,6595. Electro-Mechanical Works 31,350 32,645 33,926 34,926 36,156 37,137 38,331 39,508 40,436 41,5956. Transmission Line 10,170 10,170 10,170 10,170 10,170 10,170 10,170 10,170 10,170 10,170
Direct Cost 260,169 262,417 265,052 267,001 269,600 271,523 274,099 276,223 278,109 280,6507. Administration Fee 39,025 39,363 39,758 40,050 40,440 40,728 41,115 41,433 41,716 42,0988. Contingency 26,017 26,242 26,505 26,700 26,960 27,152 27,410 27,622 27,811 28,0659. Interest During Construction 65,042 65,604 66,263 66,750 67,400 67,881 68,525 69,056 69,527 70,163
Total 390,253 393,626 397,578 400,501 404,400 407,285 411,148 414,335 417,163 420,975
Item FSL=415
Note: The numbers 1 to 10 correspond to case No. of maximum discharge (Qmax) of each FSL in Table 10.2.1-12.
Final Report 10 - 83
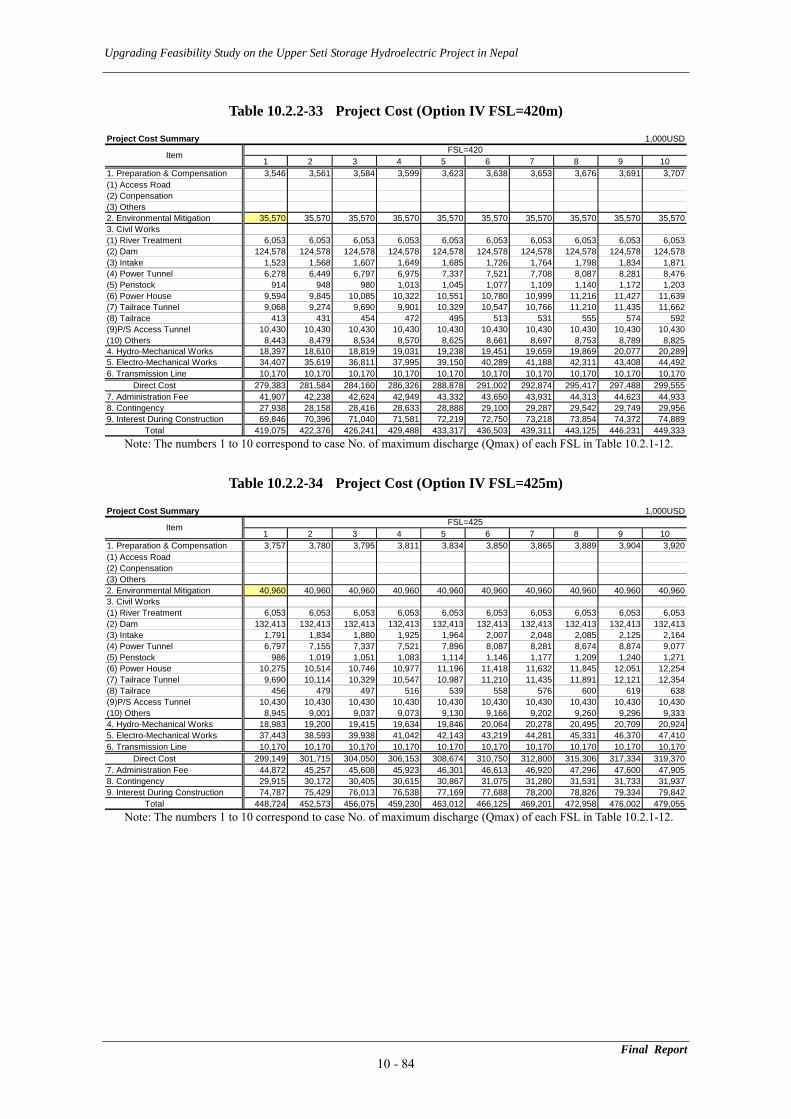
Upgrading Feasibility Study on the Upper Seti Storage Hydroelectric Project in Nepal
Table 10.2.2-33 Project Cost (Option IV FSL=420m)
Project Cost Summary 1,000USD
1 2 3 4 5 6 7 8 9 101. Preparation & Compensation 3,546 3,561 3,584 3,599 3,623 3,638 3,653 3,676 3,691 3,707(1) Access Road(2) Conpensation(3) Others2. Environmental Mitigation 35,570 35,570 35,570 35,570 35,570 35,570 35,570 35,570 35,570 35,5703. Civil Works(1) River Treatment 6,053 6,053 6,053 6,053 6,053 6,053 6,053 6,053 6,053 6,053(2) Dam 124,578 124,578 124,578 124,578 124,578 124,578 124,578 124,578 124,578 124,578(3) Intake 1,523 1,568 1,607 1,649 1,685 1,726 1,764 1,798 1,834 1,871(4) Power Tunnel 6,278 6,449 6,797 6,975 7,337 7,521 7,708 8,087 8,281 8,476(5) Penstock 914 948 980 1,013 1,045 1,077 1,109 1,140 1,172 1,203(6) Power House 9,594 9,845 10,085 10,322 10,551 10,780 10,999 11,216 11,427 11,639(7) Tailrace Tunnel 9,068 9,274 9,690 9,901 10,329 10,547 10,766 11,210 11,435 11,662(8) Tailrace 413 431 454 472 495 513 531 555 574 592(9)P/S Access Tunnel 10,430 10,430 10,430 10,430 10,430 10,430 10,430 10,430 10,430 10,430(10) Others 8,443 8,479 8,534 8,570 8,625 8,661 8,697 8,753 8,789 8,8254. Hydro-Mechanical Works 18,397 18,610 18,819 19,031 19,238 19,451 19,659 19,869 20,077 20,2895. Electro-Mechanical Works 34,407 35,619 36,811 37,995 39,150 40,289 41,188 42,311 43,408 44,4926. Transmission Line 10,170 10,170 10,170 10,170 10,170 10,170 10,170 10,170 10,170 10,170
Direct Cost 279,383 281,584 284,160 286,326 288,878 291,002 292,874 295,417 297,488 299,5557. Administration Fee 41,907 42,238 42,624 42,949 43,332 43,650 43,931 44,313 44,623 44,9338. Contingency 27,938 28,158 28,416 28,633 28,888 29,100 29,287 29,542 29,749 29,9569. Interest During Construction 69,846 70,396 71,040 71,581 72,219 72,750 73,218 73,854 74,372 74,889
Total 419,075 422,376 426,241 429,488 433,317 436,503 439,311 443,125 446,231 449,333
Item FSL=420
Note: The numbers 1 to 10 correspond to case No. of maximum discharge (Qmax) of each FSL in Table 10.2.1-12.
Table 10.2.2-34 Project Cost (Option IV FSL=425m)
Project Cost Summary 1,000USD
1 2 3 4 5 6 7 8 9 101. Preparation & Compensation 3,757 3,780 3,795 3,811 3,834 3,850 3,865 3,889 3,904 3,920(1) Access Road(2) Conpensation(3) Others2. Environmental Mitigation 40,960 40,960 40,960 40,960 40,960 40,960 40,960 40,960 40,960 40,9603. Civil Works(1) River Treatment 6,053 6,053 6,053 6,053 6,053 6,053 6,053 6,053 6,053 6,053(2) Dam 132,413 132,413 132,413 132,413 132,413 132,413 132,413 132,413 132,413 132,413(3) Intake 1,791 1,834 1,880 1,925 1,964 2,007 2,048 2,085 2,125 2,164(4) Power Tunnel 6,797 7,155 7,337 7,521 7,896 8,087 8,281 8,674 8,874 9,077(5) Penstock 986 1,019 1,051 1,083 1,114 1,146 1,177 1,209 1,240 1,271(6) Power House 10,275 10,514 10,746 10,977 11,196 11,418 11,632 11,845 12,051 12,254(7) Tailrace Tunnel 9,690 10,114 10,329 10,547 10,987 11,210 11,435 11,891 12,121 12,354(8) Tailrace 456 479 497 516 539 558 576 600 619 638(9)P/S Access Tunnel 10,430 10,430 10,430 10,430 10,430 10,430 10,430 10,430 10,430 10,430(10) Others 8,945 9,001 9,037 9,073 9,130 9,166 9,202 9,260 9,296 9,3334. Hydro-Mechanical Works 18,983 19,200 19,415 19,634 19,846 20,064 20,278 20,495 20,709 20,9245. Electro-Mechanical Works 37,443 38,593 39,938 41,042 42,143 43,219 44,281 45,331 46,370 47,4106. Transmission Line 10,170 10,170 10,170 10,170 10,170 10,170 10,170 10,170 10,170 10,170
Direct Cost 299,149 301,715 304,050 306,153 308,674 310,750 312,800 315,306 317,334 319,3707. Administration Fee 44,872 45,257 45,608 45,923 46,301 46,613 46,920 47,296 47,600 47,9058. Contingency 29,915 30,172 30,405 30,615 30,867 31,075 31,280 31,531 31,733 31,9379. Interest During Construction 74,787 75,429 76,013 76,538 77,169 77,688 78,200 78,826 79,334 79,842
Total 448,724 452,573 456,075 459,230 463,012 466,125 469,201 472,958 476,002 479,055
Item FSL=425
Note: The numbers 1 to 10 correspond to case No. of maximum discharge (Qmax) of each FSL in Table 10.2.1-12.
Final Report 10 - 84
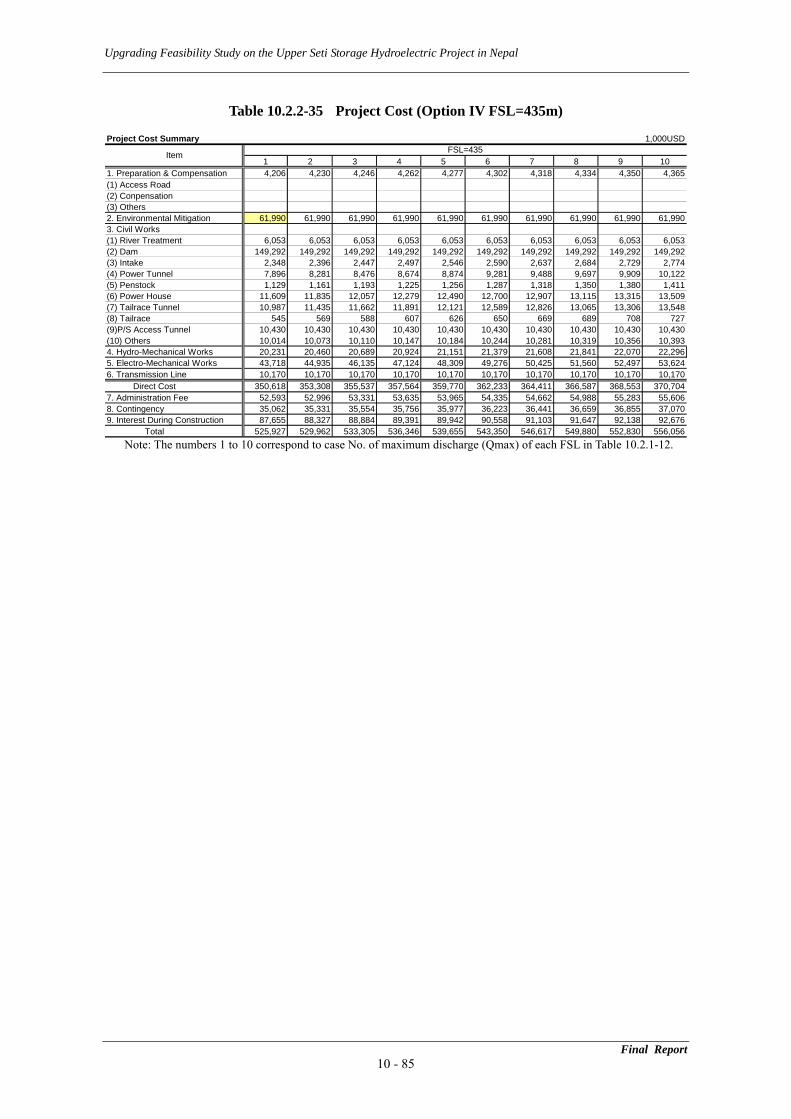
Upgrading Feasibility Study on the Upper Seti Storage Hydroelectric Project in Nepal
Table 10.2.2-35 Project Cost (Option IV FSL=435m)
Project Cost Summary 1,000USD
1 2 3 4 5 6 7 8 9 101. Preparation & Compensation 4,206 4,230 4,246 4,262 4,277 4,302 4,318 4,334 4,350 4,365(1) Access Road(2) Conpensation(3) Others2. Environmental Mitigation 61,990 61,990 61,990 61,990 61,990 61,990 61,990 61,990 61,990 61,9903. Civil Works(1) River Treatment 6,053 6,053 6,053 6,053 6,053 6,053 6,053 6,053 6,053 6,053(2) Dam 149,292 149,292 149,292 149,292 149,292 149,292 149,292 149,292 149,292 149,292(3) Intake 2,348 2,396 2,447 2,497 2,546 2,590 2,637 2,684 2,729 2,774(4) Power Tunnel 7,896 8,281 8,476 8,674 8,874 9,281 9,488 9,697 9,909 10,122(5) Penstock 1,129 1,161 1,193 1,225 1,256 1,287 1,318 1,350 1,380 1,411(6) Power House 11,609 11,835 12,057 12,279 12,490 12,700 12,907 13,115 13,315 13,509(7) Tailrace Tunnel 10,987 11,435 11,662 11,891 12,121 12,589 12,826 13,065 13,306 13,548(8) Tailrace 545 569 588 607 626 650 669 689 708 727(9)P/S Access Tunnel 10,430 10,430 10,430 10,430 10,430 10,430 10,430 10,430 10,430 10,430(10) Others 10,014 10,073 10,110 10,147 10,184 10,244 10,281 10,319 10,356 10,3934. Hydro-Mechanical Works 20,231 20,460 20,689 20,924 21,151 21,379 21,608 21,841 22,070 22,2965. Electro-Mechanical Works 43,718 44,935 46,135 47,124 48,309 49,276 50,425 51,560 52,497 53,6246. Transmission Line 10,170 10,170 10,170 10,170 10,170 10,170 10,170 10,170 10,170 10,170
Direct Cost 350,618 353,308 355,537 357,564 359,770 362,233 364,411 366,587 368,553 370,7047. Administration Fee 52,593 52,996 53,331 53,635 53,965 54,335 54,662 54,988 55,283 55,6068. Contingency 35,062 35,331 35,554 35,756 35,977 36,223 36,441 36,659 36,855 37,0709. Interest During Construction 87,655 88,327 88,884 89,391 89,942 90,558 91,103 91,647 92,138 92,676
Total 525,927 529,962 533,305 536,346 539,655 543,350 546,617 549,880 552,830 556,056
Item FSL=435
Note: The numbers 1 to 10 correspond to case No. of maximum discharge (Qmax) of each FSL in Table 10.2.1-12.
Final Report 10 - 85
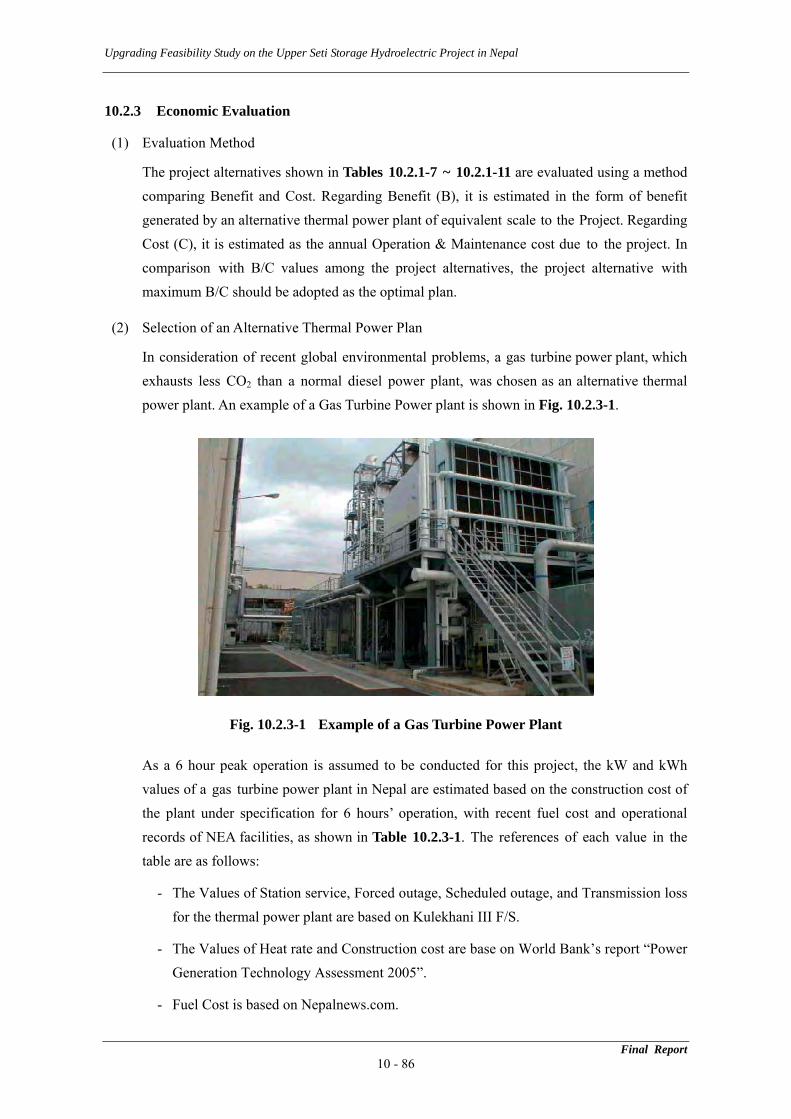
Upgrading Feasibility Study on the Upper Seti Storage Hydroelectric Project in Nepal
10.2.3 Economic Evaluation
(1) Evaluation Method
The project alternatives shown in Tables 10.2.1-7 ~ 10.2.1-11 are evaluated using a method comparing Benefit and Cost. Regarding Benefit (B), it is estimated in the form of benefit generated by an alternative thermal power plant of equivalent scale to the Project. Regarding Cost (C), it is estimated as the annual Operation & Maintenance cost due to the project. In comparison with B/C values among the project alternatives, the project alternative with maximum B/C should be adopted as the optimal plan.
(2) Selection of an Alternative Thermal Power Plan
In consideration of recent global environmental problems, a gas turbine power plant, which exhausts less CO2 than a normal diesel power plant, was chosen as an alternative thermal power plant. An example of a Gas Turbine Power plant is shown in Fig. 10.2.3-1.
Fig. 10.2.3-1 Example of a Gas Turbine Power Plant
As a 6 hour peak operation is assumed to be conducted for this project, the kW and kWh values of a gas turbine power plant in Nepal are estimated based on the construction cost of the plant under specification for 6 hours’ operation, with recent fuel cost and operational records of NEA facilities, as shown in Table 10.2.3-1. The references of each value in the table are as follows:
- The Values of Station service, Forced outage, Scheduled outage, and Transmission loss for the thermal power plant are based on Kulekhani III F/S.
- The Values of Heat rate and Construction cost are base on World Bank’s report “Power Generation Technology Assessment 2005”.
- Fuel Cost is based on Nepalnews.com.
Final Report 10 - 86
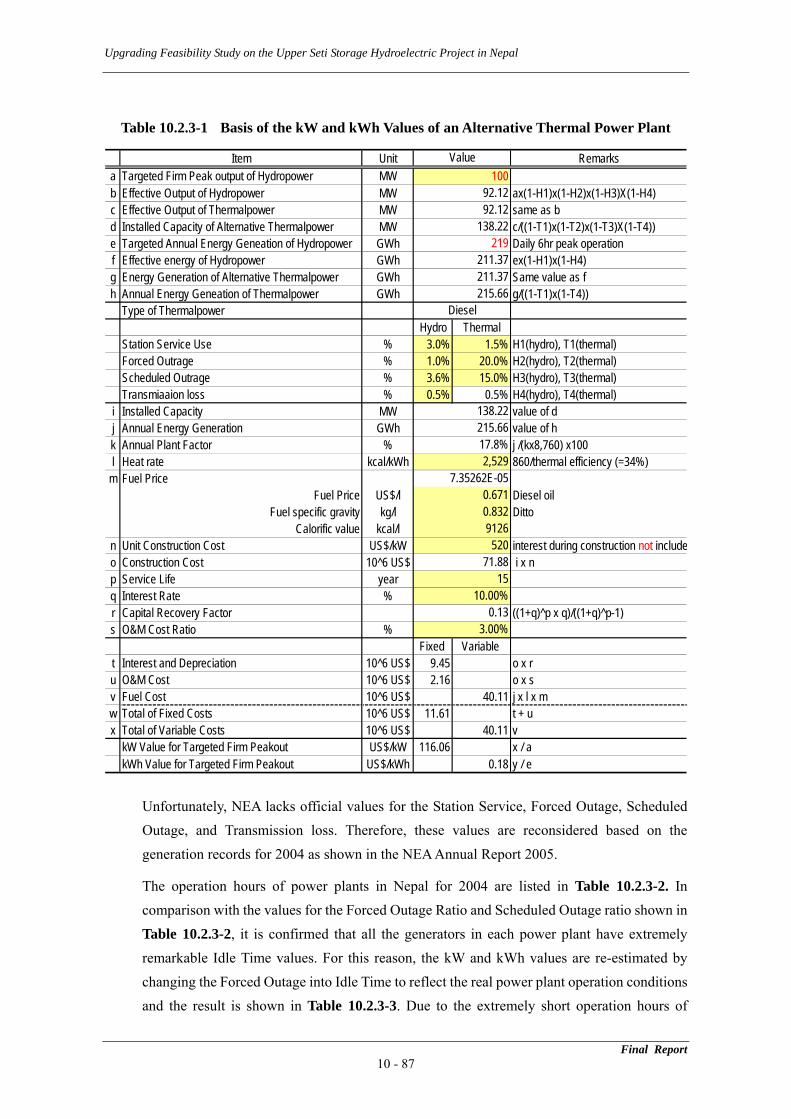
Upgrading Feasibility Study on the Upper Seti Storage Hydroelectric Project in Nepal
Final Report 10 - 87
Table 10.2.3-1 Basis of the kW and kWh Values of an Alternative Thermal Power Plant
Item Unit Remarksa Targeted Firm Peak output of Hydropower MWb Effective Output of Hydropower MW ax(1-H1)x(1-H2)x(1-H3)X(1-H4)c Effective Output of Thermalpower MW same as bd Installed Capacity of Alternative Thermalpower MW c/((1-T1)x(1-T2)x(1-T3)X(1-T4))e Targeted Annual Energy Geneation of Hydropower GWh Daily 6hr peak operationf Effective energy of Hydropower GWh ex(1-H1)x(1-H4)g Energy Generation of Alternative Thermalpower GWh Same value as fh Annual Energy Geneation of Thermalpower GWh g/((1-T1)x(1-T4))
Type of ThermalpowerHydro Thermal
Station Service Use % 3.0% 1.5% H1(hydro), T1(thermal)Forced Outrage % 1.0% 20.0% H2(hydro), T2(thermal)Scheduled Outrage % 3.6% 15.0% H3(hydro), T3(thermal)Transmiaaion loss % 0.5% 0.5% H4(hydro), T4(thermal)
i Installed Capacity MW value of dj Annual Energy Generation GWh value of hk Annual Plant Factor % j /(kx8,760) x100l Heat rate kcal/kWh 860/thermal efficiency (=34%)
m Fuel PriceFuel Price US$/l Diesel oil
Fuel specific gravity kg/l DittoCalorific value kcal/l
n Unit Construction Cost US$/kW interest during construction not includeo Construction Cost 10^6 US$ i x np Service Life yearq Interest Rate %r Capital Recovery Factor ((1+q)^p x q)/((1+q)^p-1)s O&M Cost Ratio %
Fixed Variable t Interest and Depreciation 10^6 US$ 9.45 o x ru O&M Cost 10^6 US$ 2.16 o x sv Fuel Cost 10^6 US$ 40.11 j x l x mw Total of Fixed Costs 10^6 US$ 11.61 t + ux Total of Variable Costs 10^6 US$ 40.11 v
kW Value for Targeted Firm Peakout US$/kW 116.06 x / akWh Value for Targeted Firm Peakout US$/kWh 0.18 y / e
215.66Diesel
Value
211.37211.37
92.1292.12
138.22
138.22215.6617.8%2,529
7.35262E-05
52071.88
1510.00%
0.133.00%
0.6710.8329126
219
100
Unfortunately, NEA lacks official values for the Station Service, Forced Outage, Scheduled Outage, and Transmission loss. Therefore, these values are reconsidered based on the generation records for 2004 as shown in the NEA Annual Report 2005.
The operation hours of power plants in Nepal for 2004 are listed in Table 10.2.3-2. In comparison with the values for the Forced Outage Ratio and Scheduled Outage ratio shown in Table 10.2.3-2, it is confirmed that all the generators in each power plant have extremely remarkable Idle Time values. For this reason, the kW and kWh values are re-estimated by changing the Forced Outage into Idle Time to reflect the real power plant operation conditions and the result is shown in Table 10.2.3-3. Due to the extremely short operation hours of
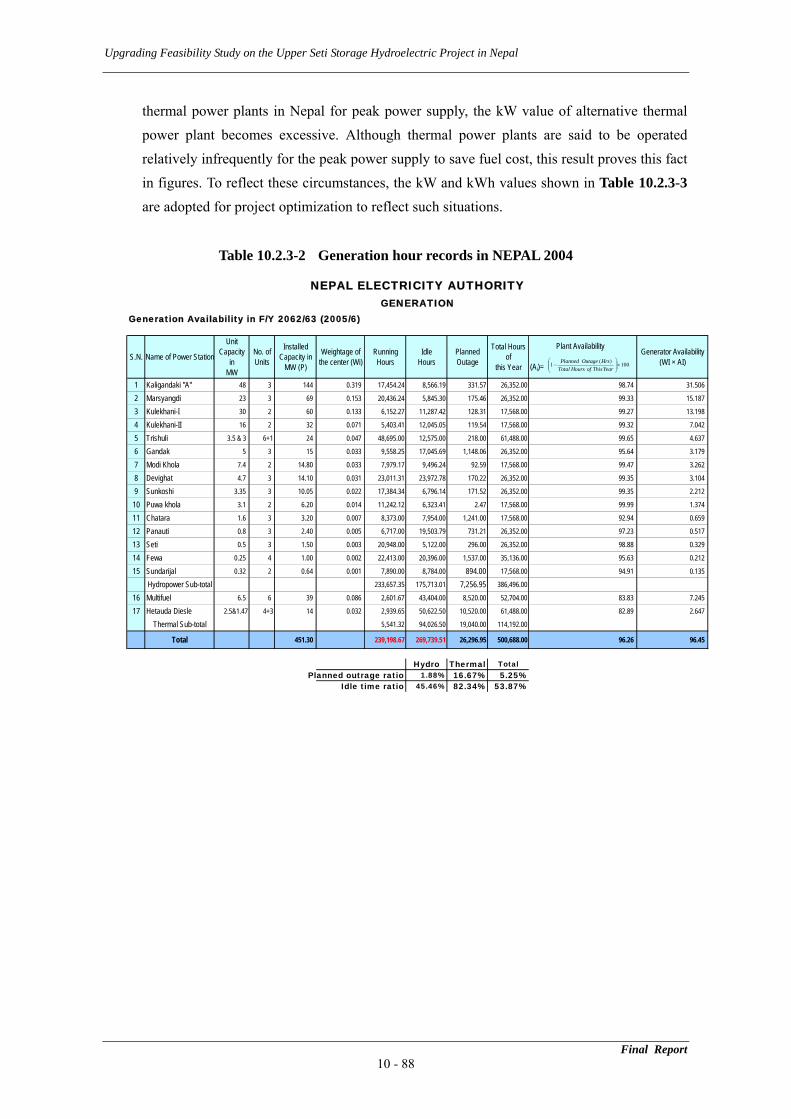
Upgrading Feasibility Study on the Upper Seti Storage Hydroelectric Project in Nepal
Final Report 10 - 88
thermal power plants in Nepal for peak power supply, the kW value of alternative thermal power plant becomes excessive. Although thermal power plants are said to be operated relatively infrequently for the peak power supply to save fuel cost, this result proves this fact in figures. To reflect these circumstances, the kW and kWh values shown in Table 10.2.3-3 are adopted for project optimization to reflect such situations.
Table 10.2.3-2 Generation hour records in NEPAL 2004
S.N. Name of Power Station
UnitCapacity
inMW
No. ofUnits
InstalledCapacity in
MW (P)
Weightage ofthe center (Wi)
RunningHours
IdleHours
PlannedOutage
Total Hoursof
this Year
Plant Availability
(Ai)=
Generator Availability(WI × AI)
1 Kaligandaki "A" 48 3 144 0.319 17,454.24 8,566.19 331.57 26,352.00 98.74 31.506
2 Marsyangdi 23 3 69 0.153 20,436.24 5,845.30 175.46 26,352.00 99.33 15.187
3 Kulekhani-I 30 2 60 0.133 6,152.27 11,287.42 128.31 17,568.00 99.27 13.198
4 Kulekhani-II 16 2 32 0.071 5,403.41 12,045.05 119.54 17,568.00 99.32 7.042
5 Trishuli 3.5 & 3 6+1 24 0.047 48,695.00 12,575.00 218.00 61,488.00 99.65 4.637
6 Gandak 5 3 15 0.033 9,558.25 17,045.69 1,148.06 26,352.00 95.64 3.179
7 Modi Khola 7.4 2 14.80 0.033 7,979.17 9,496.24 92.59 17,568.00 99.47 3.262
8 Devighat 4.7 3 14.10 0.031 23,011.31 23,972.78 170.22 26,352.00 99.35 3.104
9 Sunkoshi 3.35 3 10.05 0.022 17,384.34 6,796.14 171.52 26,352.00 99.35 2.212
10 Puwa khola 3.1 2 6.20 0.014 11,242.12 6,323.41 2.47 17,568.00 99.99 1.374
11 Chatara 1.6 3 3.20 0.007 8,373.00 7,954.00 1,241.00 17,568.00 92.94 0.659
12 Panauti 0.8 3 2.40 0.005 6,717.00 19,503.79 731.21 26,352.00 97.23 0.517
13 Seti 0.5 3 1.50 0.003 20,948.00 5,122.00 296.00 26,352.00 98.88 0.329
14 Fewa 0.25 4 1.00 0.002 22,413.00 20,396.00 1,537.00 35,136.00 95.63 0.212
15 Sundarijal 0.32 2 0.64 0.001 7,890.00 8,784.00 894.00 17,568.00 94.91 0.135
Hydropower Sub-total 233,657.35 175,713.01 7,256.95 386,496.00
16 Multifuel 6.5 6 39 0.086 2,601.67 43,404.00 8,520.00 52,704.00 83.83 7.245
17 Hetauda Diesle 2.5&1.47 4+3 14 0.032 2,939.65 50,622.50 10,520.00 61,488.00 82.89 2.647
Thermal Sub-total 5,541.32 94,026.50 19,040.00 114,192.00
Total 451.30 239,198.67 269,739.51 26,296.95 500,688.00 96.26 96.45
Hydro Thermal TotalPlanned outrage ratio 1.88% 16.67% 5.25%
Idle time ratio 45.46% 82.34% 53.87%
NEPAL ELECTRICITY AUTHORITYGENERATION
Generation Availability in F/Y 2062/63 (2005/6)
100)(1 ×⎟⎟⎠
⎞⎜⎜⎝
⎛−
YearThisofHoursTotalHrsOutagePlanned
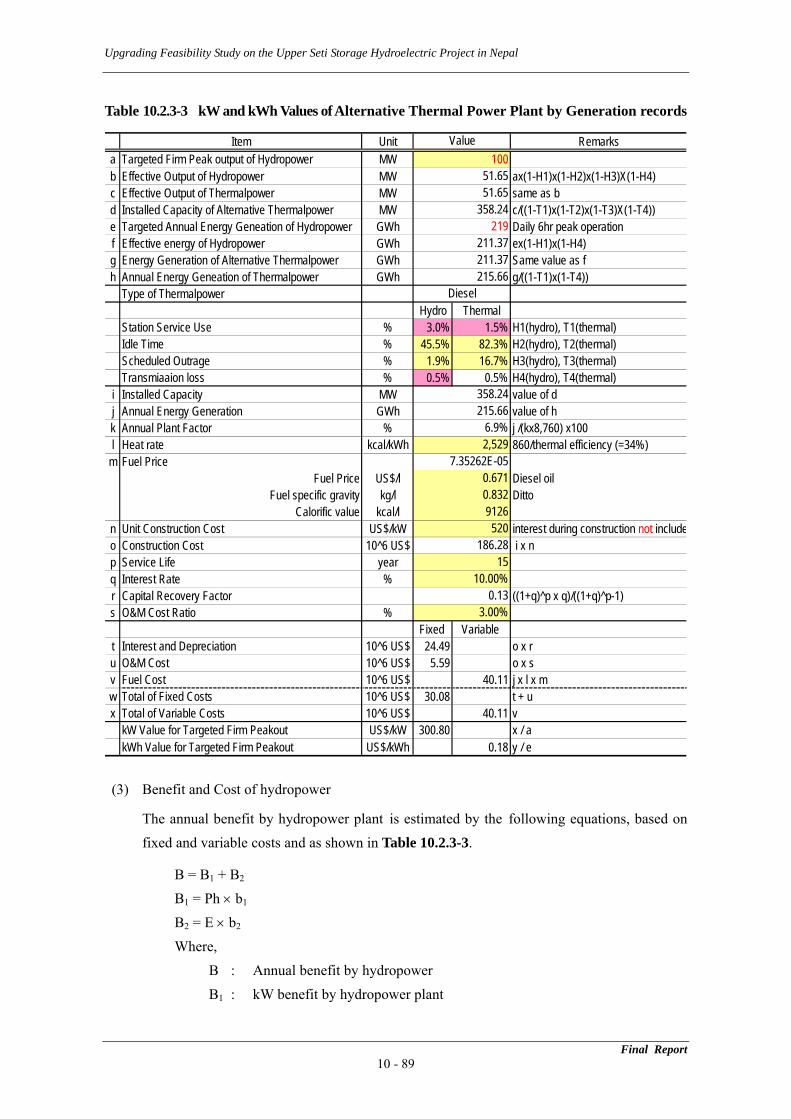
Upgrading Feasibility Study on the Upper Seti Storage Hydroelectric Project in Nepal
Final Report 10 - 89
Table 10.2.3-3 kW and kWh Values of Alternative Thermal Power Plant by Generation records
Item Unit Remarksa Targeted Firm Peak output of Hydropower MWb Effective Output of Hydropower MW ax(1-H1)x(1-H2)x(1-H3)X(1-H4)c Effective Output of Thermalpower MW same as bd Installed Capacity of Alternative Thermalpower MW c/((1-T1)x(1-T2)x(1-T3)X(1-T4))e Targeted Annual Energy Geneation of Hydropower GWh Daily 6hr peak operationf Effective energy of Hydropower GWh ex(1-H1)x(1-H4)g Energy Generation of Alternative Thermalpower GWh Same value as fh Annual Energy Geneation of Thermalpower GWh g/((1-T1)x(1-T4))
Type of ThermalpowerHydro Thermal
Station Service Use % 3.0% 1.5% H1(hydro), T1(thermal)Idle Time % 45.5% 82.3% H2(hydro), T2(thermal)Scheduled Outrage % 1.9% 16.7% H3(hydro), T3(thermal)Transmiaaion loss % 0.5% 0.5% H4(hydro), T4(thermal)
i Installed Capacity MW value of dj Annual Energy Generation GWh value of hk Annual Plant Factor % j /(kx8,760) x100l Heat rate kcal/kWh 860/thermal efficiency (=34%)
m Fuel PriceFuel Price US$/l Diesel oil
Fuel specific gravity kg/l DittoCalorific value kcal/l
n Unit Construction Cost US$/kW interest during construction not includeo Construction Cost 10^6 US$ i x np Service Life yearq Interest Rate %r Capital Recovery Factor ((1+q)^p x q)/((1+q)^p-1)s O&M Cost Ratio %
Fixed Variable t Interest and Depreciation 10^6 US$ 24.49 o x ru O&M Cost 10^6 US$ 5.59 o x sv Fuel Cost 10^6 US$ 40.11 j x l x mw Total of Fixed Costs 10^6 US$ 30.08 t + ux Total of Variable Costs 10^6 US$ 40.11 v
kW Value for Targeted Firm Peakout US$/kW 300.80 x / akWh Value for Targeted Firm Peakout US$/kWh 0.18 y / e
10.00%0.13
3.00%
0.6710.8329126
7.35262E-05
520186.28
15
358.24215.66
6.9%2,529
215.66Diesel
Value
211.37211.37
51.6551.65
358.24219
100
(3) Benefit and Cost of hydropower
The annual benefit by hydropower plant is estimated by the following equations, based on fixed and variable costs and as shown in Table 10.2.3-3.
B = B1 + B2 B1 = Ph × b1 B2 = E × b2 Where,
B : Annual benefit by hydropower B1 : kW benefit by hydropower plant
Upgrading Feasibility Study on the Upper Seti Storage Hydroelectric Project in Nepal
B2 : kWh benefit by hydropower plant Ph : Peak firm capacity of project alternative b1 : kW value of alternative thermal power plant b2 : kWh value of alternative thermal power plant
The annual cost of hydropower plant (C) is estimated by the following equation.
C = Ch × α Where,
C : Annual cost of hydropower plant Ch : Project cost of hydropower plant Α : Annual cost ratio
The annual cost ratio is calculated by the following equation.
α = Coefficient for investment recovery + ratio of Operation & Maintenance Cost Coefficient for investment recovery = i × (1 + i)t/{(1 + i)t-1} Where,
i : interest rate t : Project life of hydropower = 50 years
Where i = 10%, ratio of O&M cost =1%, α = 0.1009 + 0.01 = 0.11
10.3 Result of Layout Alternative Comparison Study
The result of a layout alternative comparison study by the method shown in 10.2 is as shown in Table 10.3-1 to 10.3-31. The relation between the B/C value and the installed capacity (Pmax) of each layout alternative is as shown in figures as follows:
Consequently, the project alternative whose FSL = 425 m, maximum discharge = 127.2 m3/sec, installed capacity = 151 MW of layout Option IIIb has the highest B/C among a total of 310 project alternatives.
The main features of this project are as follows:
Reservoir FSL 425 EL. m Reservoir MOL 400 EL. m Effective volume 176.5 MCM Peak operation time 6 hours
m3/s Maximum discharge 127.2 Intake Water level 425 m Tailrace Water Level 289.1 m Effective head 132.9 m
Final Report 10 - 90
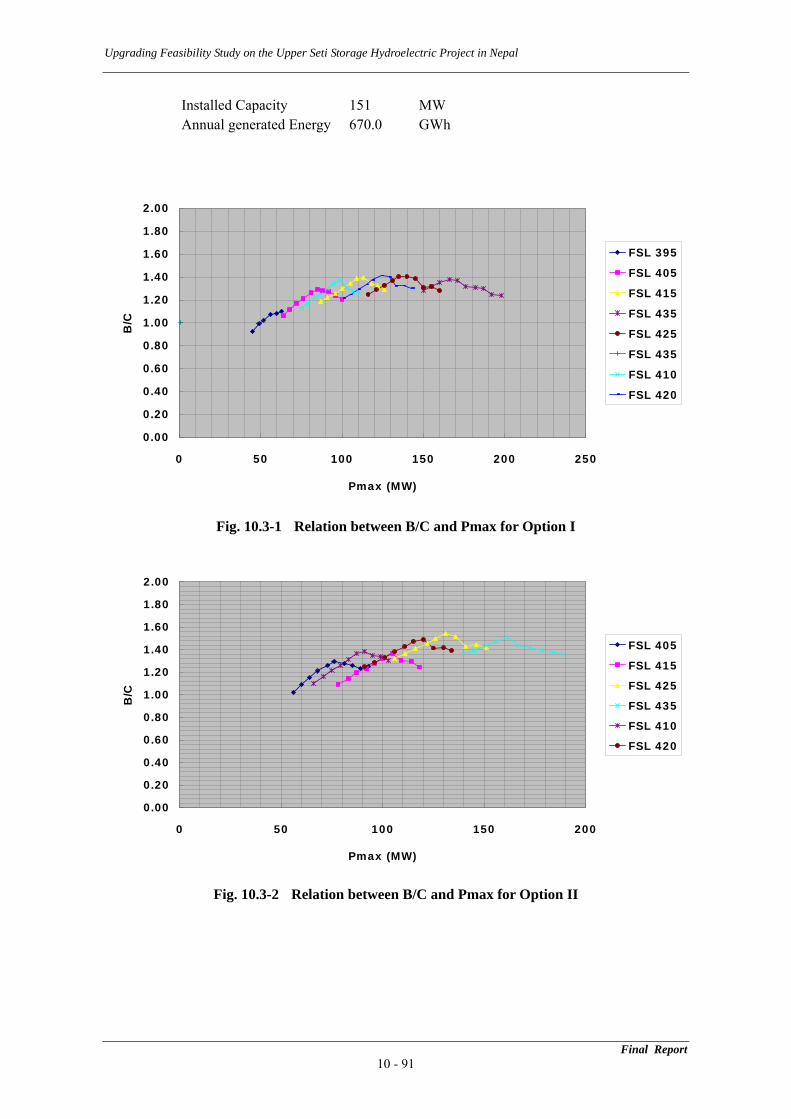
Upgrading Feasibility Study on the Upper Seti Storage Hydroelectric Project in Nepal
Installed Capacity 151 MW Annual generated Energy 670.0 GWh
0.00
0.20
0.40
0.60
0.80
1.00
1.20
1.40
1.60
1.80
2.00
0 50 100 150 200 250
Pmax (MW)
B/C
FSL 395
FSL 405
FSL 415
FSL 435
FSL 425
FSL 435
FSL 410
FSL 420
Fig. 10.3-1 Relation between B/C and Pmax for Option I
0.00
0.20
0.40
0.60
0.80
1.00
1.20
1.40
1.60
1.80
2.00
0 50 100 150 200
Pmax (MW)
B/C
FSL 405
FSL 415
FSL 425
FSL 435
FSL 410
FSL 420
Fig. 10.3-2 Relation between B/C and Pmax for Option II
Final Report 10 - 91
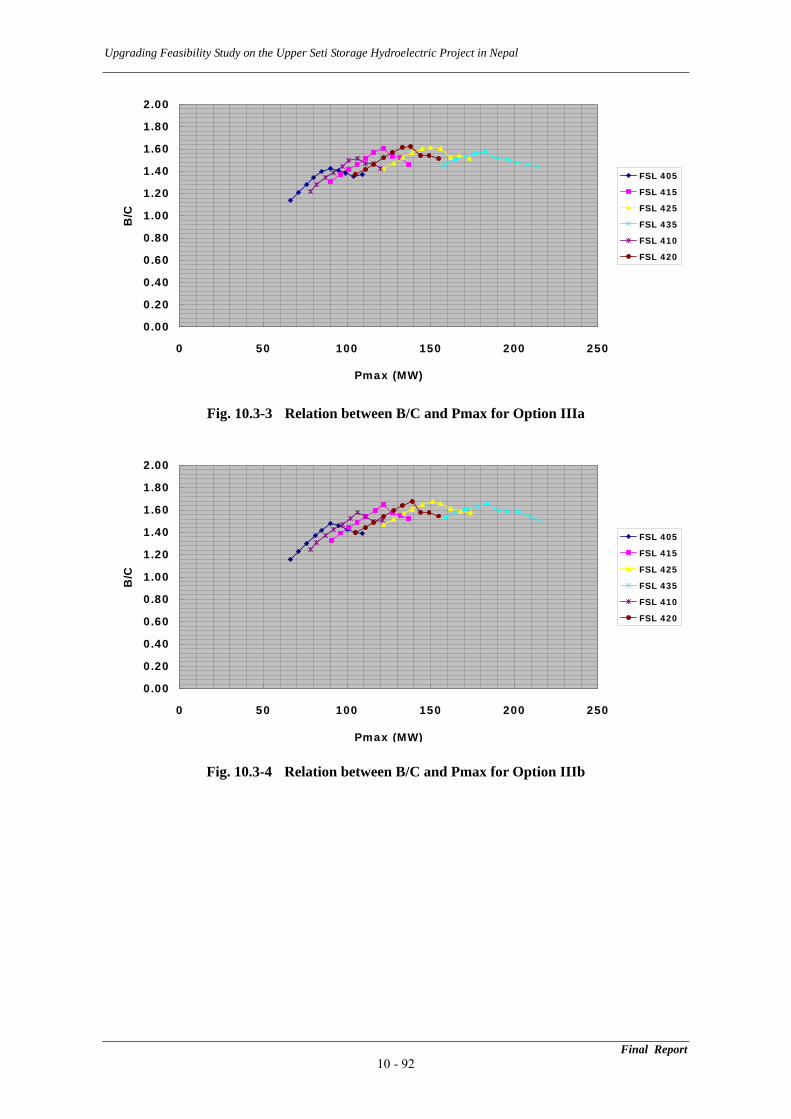
Upgrading Feasibility Study on the Upper Seti Storage Hydroelectric Project in Nepal
0.00
0.20
0.40
0.60
0.80
1.00
1.20
1.40
1.60
1.80
2.00
0 50 100 150 200 250
Pmax (MW)
B/C
FSL 405
FSL 415
FSL 425
FSL 435
FSL 410
FSL 420
Fig. 10.3-3 Relation between B/C and Pmax for Option IIIa
0.00
0.20
0.40
0.60
0.80
1.00
1.20
1.40
1.60
1.80
2.00
0 50 100 150 200 250
Pmax (MW)
B/C
FSL 405
FSL 415
FSL 425
FSL 435
FSL 410
FSL 420
Fig. 10.3-4 Relation between B/C and Pmax for Option IIIb
Final Report 10 - 92
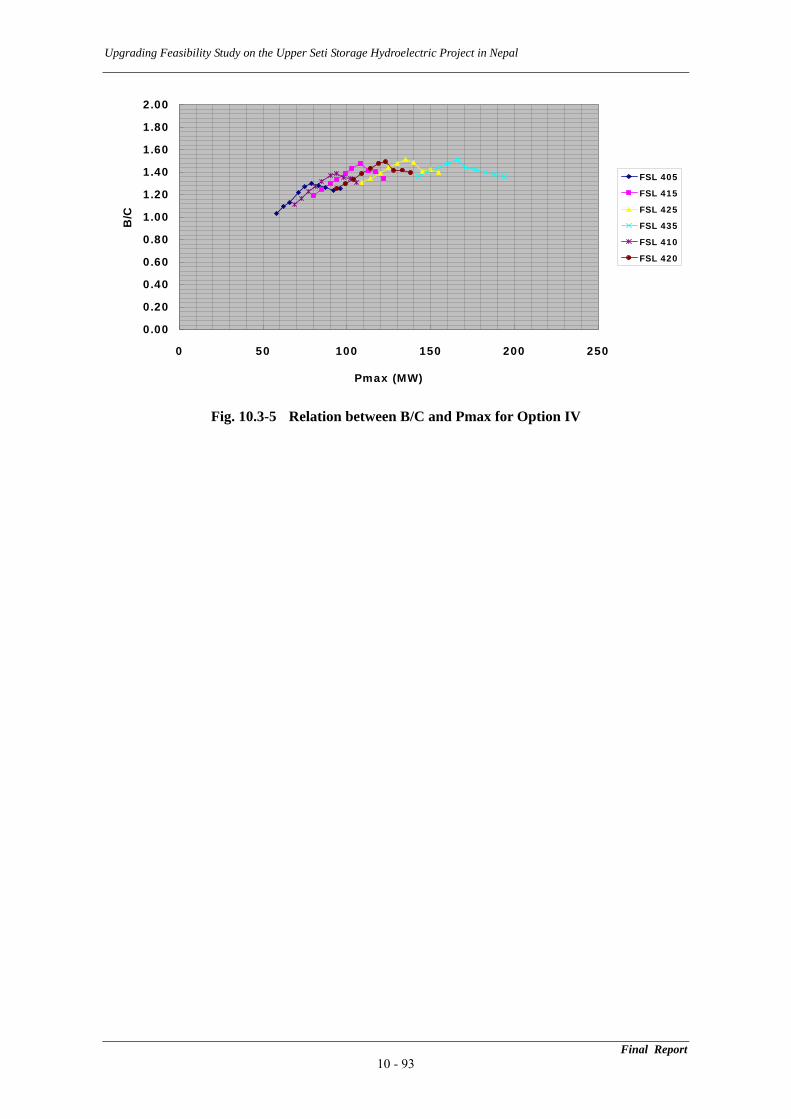
Upgrading Feasibility Study on the Upper Seti Storage Hydroelectric Project in Nepal
0.00
0.20
0.40
0.60
0.80
1.00
1.20
1.40
1.60
1.80
2.00
0 50 100 150 200 250
Pmax (MW)
B/C
FSL 405
FSL 415
FSL 425
FSL 435
FSL 410
FSL 420
Fig. 10.3-5 Relation between B/C and Pmax for Option IV
Final Report 10 - 93
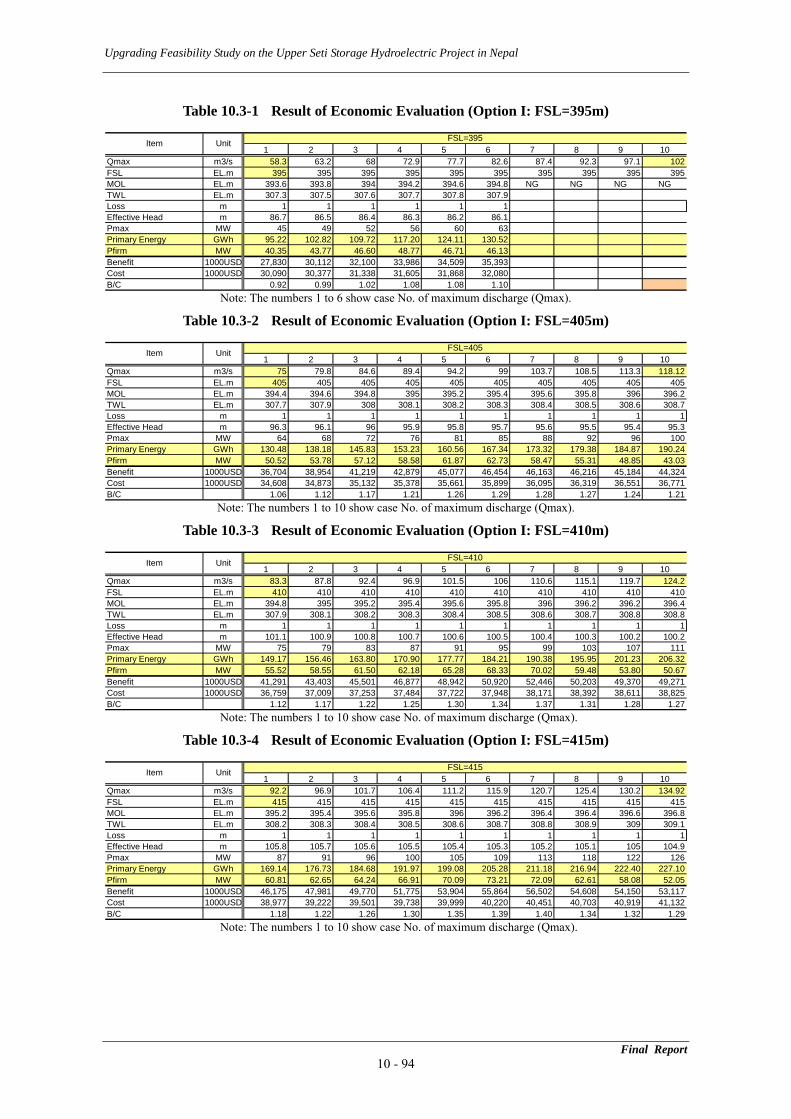
Upgrading Feasibility Study on the Upper Seti Storage Hydroelectric Project in Nepal
Table 10.3-1 Result of Economic Evaluation (Option I: FSL=395m)
1 2 3 4 5 6 7 8 9 10Qmax m3/s 58.3 63.2 68 72.9 77.7 82.6 87.4 92.3 97.1 102FSL EL.m 395 395 395 395 395 395 395 395 395 395MOL EL.m 393.6 393.8 394 394.2 394.6 394.8 NG NG NG NGTWL EL.m 307.3 307.5 307.6 307.7 307.8 307.9Loss m 1 1 1 1 1 1Effective Head m 86.7 86.5 86.4 86.3 86.2 86.1Pmax MW 45 49 52 56 60 63Primary Energy GWh 95.22 102.82 109.72 117.20 124.11 130.52Pfirm MW 40.35 43.77 46.60 48.77 46.71 46.13Benefit 1000USD 27,830 30,112 32,100 33,986 34,509 35,393Cost 1000USD 30,090 30,377 31,338 31,605 31,868 32,080B/C 0.92 0.99 1.02 1.08 1.08 1.10
Item Unit FSL=395
Note: The numbers 1 to 6 show case No. of maximum discharge (Qmax).
Table 10.3-2 Result of Economic Evaluation (Option I: FSL=405m)
1 2 3 4 5 6 7 8 9 10Qmax m3/s 75 79.8 84.6 89.4 94.2 99 103.7 108.5 113.3 118.12FSL EL.m 405 405 405 405 405 405 405 405 405 405MOL EL.m 394.4 394.6 394.8 395 395.2 395.4 395.6 395.8 396 396.2TWL EL.m 307.7 307.9 308 308.1 308.2 308.3 308.4 308.5 308.6 308.7Loss m 1 1 1 1 1 1 1 1 1 1Effective Head m 96.3 96.1 96 95.9 95.8 95.7 95.6 95.5 95.4 95.3Pmax MW 64 68 72 76 81 85 88 92 96 100Primary Energy GWh 130.48 138.18 145.83 153.23 160.56 167.34 173.32 179.38 184.87 190.24Pfirm MW 50.52 53.78 57.12 58.58 61.87 62.73 58.47 55.31 48.85 43.03Benefit 1000USD 36,704 38,954 41,219 42,879 45,077 46,454 46,163 46,216 45,184 44,324Cost 1000USD 34,608 34,873 35,132 35,378 35,661 35,899 36,095 36,319 36,551 36,771B/C 1.06 1.12 1.17 1.21 1.26 1.29 1.28 1.27 1.24 1.21
Item Unit FSL=405
Note: The numbers 1 to 10 show case No. of maximum discharge (Qmax).
Table 10.3-3 Result of Economic Evaluation (Option I: FSL=410m)
1 2 3 4 5 6 7 8 9 10Qmax m3/s 83.3 87.8 92.4 96.9 101.5 106 110.6 115.1 119.7 124.2FSL EL.m 410 410 410 410 410 410 410 410 410 410MOL EL.m 394.8 395 395.2 395.4 395.6 395.8 396 396.2 396.2 396.4TWL EL.m 307.9 308.1 308.2 308.3 308.4 308.5 308.6 308.7 308.8 308.8Loss m 1 1 1 1 1 1 1 1 1 1Effective Head m 101.1 100.9 100.8 100.7 100.6 100.5 100.4 100.3 100.2 100.2Pmax MW 75 79 83 87 91 95 99 103 107 111Primary Energy GWh 149.17 156.46 163.80 170.90 177.77 184.21 190.38 195.95 201.23 206.32Pfirm MW 55.52 58.55 61.50 62.18 65.28 68.33 70.02 59.48 53.80 50.67Benefit 1000USD 41,291 43,403 45,501 46,877 48,942 50,920 52,446 50,203 49,370 49,271Cost 1000USD 36,759 37,009 37,253 37,484 37,722 37,948 38,171 38,392 38,611 38,825B/C 1.12 1.17 1.22 1.25 1.30 1.34 1.37 1.31 1.28 1.27
Item Unit FSL=410
Note: The numbers 1 to 10 show case No. of maximum discharge (Qmax).
Table 10.3-4 Result of Economic Evaluation (Option I: FSL=415m)
1 2 3 4 5 6 7 8 9 10Qmax m3/s 92.2 96.9 101.7 106.4 111.2 115.9 120.7 125.4 130.2 134.92FSL EL.m 415 415 415 415 415 415 415 415 415 415MOL EL.m 395.2 395.4 395.6 395.8 396 396.2 396.4 396.4 396.6 396.8TWL EL.m 308.2 308.3 308.4 308.5 308.6 308.7 308.8 308.9 309 309.1Loss m 1 1 1 1 1 1 1 1 1 1Effective Head m 105.8 105.7 105.6 105.5 105.4 105.3 105.2 105.1 105 104.9Pmax MW 87 91 96 100 105 109 113 118 122 126Primary Energy GWh 169.14 176.73 184.68 191.97 199.08 205.28 211.18 216.94 222.40 227.10Pfirm MW 60.81 62.65 64.24 66.91 70.09 73.21 72.09 62.61 58.08 52.05Benefit 1000USD 46,175 47,981 49,770 51,775 53,904 55,864 56,502 54,608 54,150 53,117Cost 1000USD 38,977 39,222 39,501 39,738 39,999 40,220 40,451 40,703 40,919 41,132B/C 1.18 1.22 1.26 1.30 1.35 1.39 1.40 1.34 1.32 1.29
Item Unit FSL=415
Note: The numbers 1 to 10 show case No. of maximum discharge (Qmax).
Final Report 10 - 94
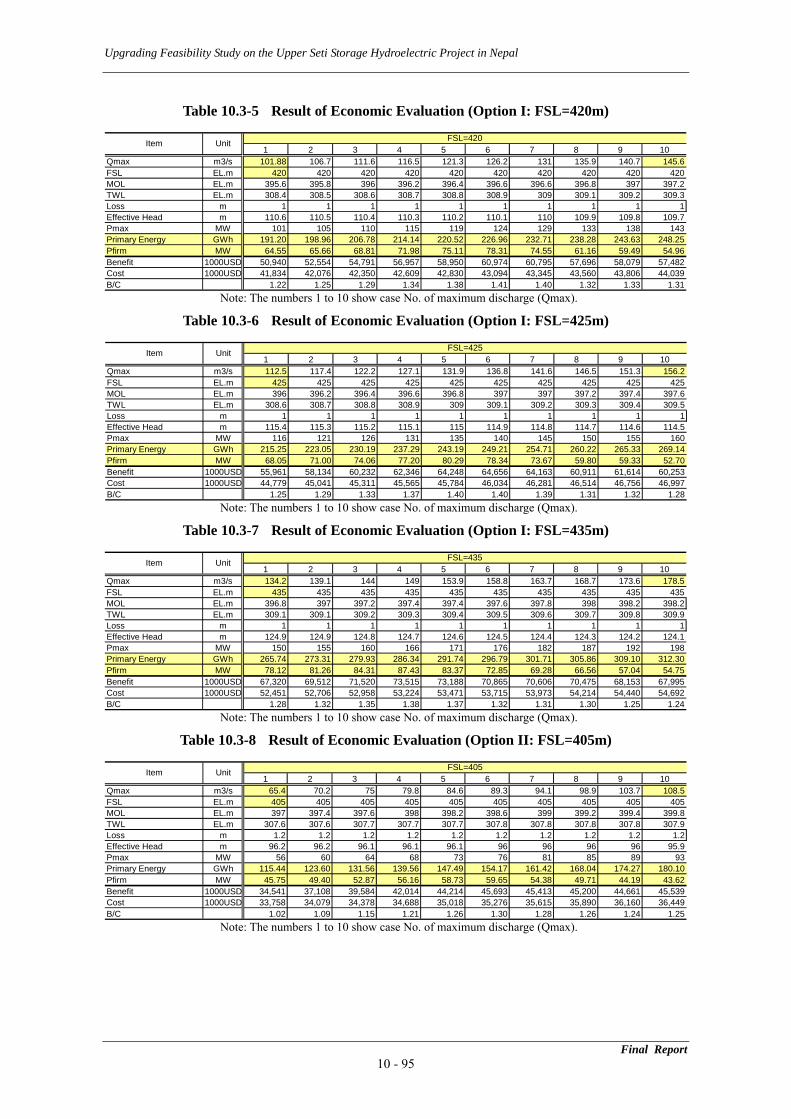
Upgrading Feasibility Study on the Upper Seti Storage Hydroelectric Project in Nepal
Table 10.3-5 Result of Economic Evaluation (Option I: FSL=420m)
1 2 3 4 5 6 7 8 9 10Qmax m3/s 101.88 106.7 111.6 116.5 121.3 126.2 131 135.9 140.7 145.6FSL EL.m 420 420 420 420 420 420 420 420 420 420MOL EL.m 395.6 395.8 396 396.2 396.4 396.6 396.6 396.8 397 397.2TWL EL.m 308.4 308.5 308.6 308.7 308.8 308.9 309 309.1 309.2 309.3Loss m 1 1 1 1 1 1 1 1 1 1Effective Head m 110.6 110.5 110.4 110.3 110.2 110.1 110 109.9 109.8 109.7Pmax MW 101 105 110 115 119 124 129 133 138 143Primary Energy GWh 191.20 198.96 206.78 214.14 220.52 226.96 232.71 238.28 243.63 248.25Pfirm MW 64.55 65.66 68.81 71.98 75.11 78.31 74.55 61.16 59.49 54.96Benefit 1000USD 50,940 52,554 54,791 56,957 58,950 60,974 60,795 57,696 58,079 57,482Cost 1000USD 41,834 42,076 42,350 42,609 42,830 43,094 43,345 43,560 43,806 44,039B/C 1.22 1.25 1.29 1.34 1.38 1.41 1.40 1.32 1.33 1.31
Item Unit FSL=420
Note: The numbers 1 to 10 show case No. of maximum discharge (Qmax).
Table 10.3-6 Result of Economic Evaluation (Option I: FSL=425m)
1 2 3 4 5 6 7 8 9 10Qmax m3/s 112.5 117.4 122.2 127.1 131.9 136.8 141.6 146.5 151.3 156.2FSL EL.m 425 425 425 425 425 425 425 425 425 425MOL EL.m 396 396.2 396.4 396.6 396.8 397 397 397.2 397.4 397.6TWL EL.m 308.6 308.7 308.8 308.9 309 309.1 309.2 309.3 309.4 309.5Loss m 1 1 1 1 1 1 1 1 1 1Effective Head m 115.4 115.3 115.2 115.1 115 114.9 114.8 114.7 114.6 114.5Pmax MW 116 121 126 131 135 140 145 150 155 160Primary Energy GWh 215.25 223.05 230.19 237.29 243.19 249.21 254.71 260.22 265.33 269.14Pfirm MW 68.05 71.00 74.06 77.20 80.29 78.34 73.67 59.80 59.33 52.70Benefit 1000USD 55,961 58,134 60,232 62,346 64,248 64,656 64,163 60,911 61,614 60,253Cost 1000USD 44,779 45,041 45,311 45,565 45,784 46,034 46,281 46,514 46,756 46,997B/C 1.25 1.29 1.33 1.37 1.40 1.40 1.39 1.31 1.32 1.28
Item Unit FSL=425
Note: The numbers 1 to 10 show case No. of maximum discharge (Qmax).
Table 10.3-7 Result of Economic Evaluation (Option I: FSL=435m)
1 2 3 4 5 6 7 8 9 10Qmax m3/s 134.2 139.1 144 149 153.9 158.8 163.7 168.7 173.6 178.5FSL EL.m 435 435 435 435 435 435 435 435 435 435MOL EL.m 396.8 397 397.2 397.4 397.4 397.6 397.8 398 398.2 398.2TWL EL.m 309.1 309.1 309.2 309.3 309.4 309.5 309.6 309.7 309.8 309.9Loss m 1 1 1 1 1 1 1 1 1 1Effective Head m 124.9 124.9 124.8 124.7 124.6 124.5 124.4 124.3 124.2 124.1Pmax MW 150 155 160 166 171 176 182 187 192 198Primary Energy GWh 265.74 273.31 279.93 286.34 291.74 296.79 301.71 305.86 309.10 312.30Pfirm MW 78.12 81.26 84.31 87.43 83.37 72.85 69.28 66.56 57.04 54.75Benefit 1000USD 67,320 69,512 71,520 73,515 73,188 70,865 70,606 70,475 68,153 67,995Cost 1000USD 52,451 52,706 52,958 53,224 53,471 53,715 53,973 54,214 54,440 54,692B/C 1.28 1.32 1.35 1.38 1.37 1.32 1.31 1.30 1.25 1.24
Item Unit FSL=435
Note: The numbers 1 to 10 show case No. of maximum discharge (Qmax).
Table 10.3-8 Result of Economic Evaluation (Option II: FSL=405m)
1 2 3 4 5 6 7 8 9 10Qmax m3/s 65.4 70.2 75 79.8 84.6 89.3 94.1 98.9 103.7 108.5FSL EL.m 405 405 405 405 405 405 405 405 405 405MOL EL.m 397 397.4 397.6 398 398.2 398.6 399 399.2 399.4 399.8TWL EL.m 307.6 307.6 307.7 307.7 307.7 307.8 307.8 307.8 307.8 307.9Loss m 1.2 1.2 1.2 1.2 1.2 1.2 1.2 1.2 1.2 1.2Effective Head m 96.2 96.2 96.1 96.1 96.1 96 96 96 96 95.9Pmax MW 56 60 64 68 73 76 81 85 89 93Primary Energy GWh 115.44 123.60 131.56 139.56 147.49 154.17 161.42 168.04 174.27 180.10Pfirm MW 45.75 49.40 52.87 56.16 58.73 59.65 54.38 49.71 44.19 43.62Benefit 1000USD 34,541 37,108 39,584 42,014 44,214 45,693 45,413 45,200 44,661 45,539Cost 1000USD 33,758 34,079 34,378 34,688 35,018 35,276 35,615 35,890 36,160 36,449B/C 1.02 1.09 1.15 1.21 1.26 1.30 1.28 1.26 1.24 1.25
Item Unit FSL=405
Note: The numbers 1 to 10 show case No. of maximum discharge (Qmax).
Final Report 10 - 95
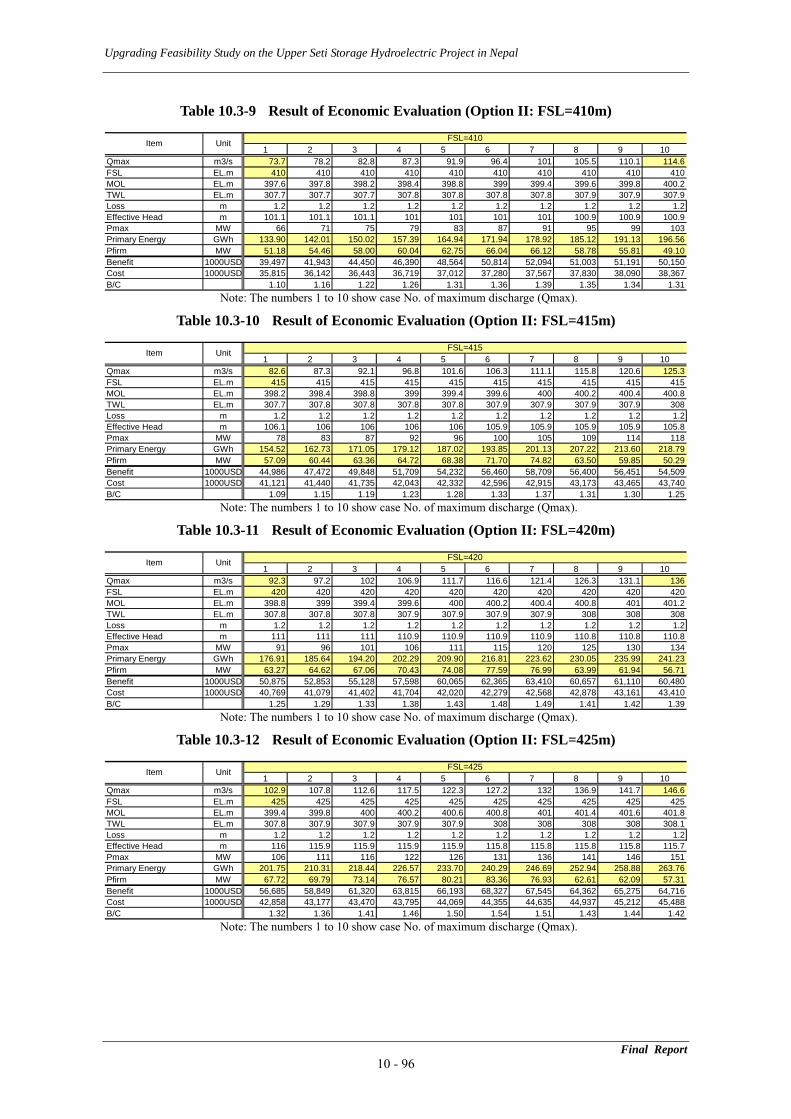
Upgrading Feasibility Study on the Upper Seti Storage Hydroelectric Project in Nepal
Table 10.3-9 Result of Economic Evaluation (Option II: FSL=410m)
1 2 3 4 5 6 7 8 9 10Qmax m3/s 73.7 78.2 82.8 87.3 91.9 96.4 101 105.5 110.1 114.6FSL EL.m 410 410 410 410 410 410 410 410 410 410MOL EL.m 397.6 397.8 398.2 398.4 398.8 399 399.4 399.6 399.8 400.2TWL EL.m 307.7 307.7 307.7 307.8 307.8 307.8 307.8 307.9 307.9 307.9Loss m 1.2 1.2 1.2 1.2 1.2 1.2 1.2 1.2 1.2 1.2Effective Head m 101.1 101.1 101.1 101 101 101 101 100.9 100.9 100.9Pmax MW 66 71 75 79 83 87 91 95 99 103Primary Energy GWh 133.90 142.01 150.02 157.39 164.94 171.94 178.92 185.12 191.13 196.56Pfirm MW 51.18 54.46 58.00 60.04 62.75 66.04 66.12 58.78 55.81 49.10Benefit 1000USD 39,497 41,943 44,450 46,390 48,564 50,814 52,094 51,003 51,191 50,150Cost 1000USD 35,815 36,142 36,443 36,719 37,012 37,280 37,567 37,830 38,090 38,367B/C 1.10 1.16 1.22 1.26 1.31 1.36 1.39 1.35 1.34 1.31
Item Unit FSL=410
Note: The numbers 1 to 10 show case No. of maximum discharge (Qmax).
Table 10.3-10 Result of Economic Evaluation (Option II: FSL=415m)
1 2 3 4 5 6 7 8 9 10Qmax m3/s 82.6 87.3 92.1 96.8 101.6 106.3 111.1 115.8 120.6 125.3FSL EL.m 415 415 415 415 415 415 415 415 415 415MOL EL.m 398.2 398.4 398.8 399 399.4 399.6 400 400.2 400.4 400.8TWL EL.m 307.7 307.8 307.8 307.8 307.8 307.9 307.9 307.9 307.9 308Loss m 1.2 1.2 1.2 1.2 1.2 1.2 1.2 1.2 1.2 1.2Effective Head m 106.1 106 106 106 106 105.9 105.9 105.9 105.9 105.8Pmax MW 78 83 87 92 96 100 105 109 114 118Primary Energy GWh 154.52 162.73 171.05 179.12 187.02 193.85 201.13 207.22 213.60 218.79Pfirm MW 57.09 60.44 63.36 64.72 68.38 71.70 74.82 63.50 59.85 50.29Benefit 1000USD 44,986 47,472 49,848 51,709 54,232 56,460 58,709 56,400 56,451 54,509Cost 1000USD 41,121 41,440 41,735 42,043 42,332 42,596 42,915 43,173 43,465 43,740B/C 1.09 1.15 1.19 1.23 1.28 1.33 1.37 1.31 1.30 1.25
Item Unit FSL=415
Note: The numbers 1 to 10 show case No. of maximum discharge (Qmax).
Table 10.3-11 Result of Economic Evaluation (Option II: FSL=420m)
1 2 3 4 5 6 7 8 9 10Qmax m3/s 92.3 97.2 102 106.9 111.7 116.6 121.4 126.3 131.1 136FSL EL.m 420 420 420 420 420 420 420 420 420 420MOL EL.m 398.8 399 399.4 399.6 400 400.2 400.4 400.8 401 401.2TWL EL.m 307.8 307.8 307.8 307.9 307.9 307.9 307.9 308 308 308Loss m 1.2 1.2 1.2 1.2 1.2 1.2 1.2 1.2 1.2 1.2Effective Head m 111 111 111 110.9 110.9 110.9 110.9 110.8 110.8 110.8Pmax MW 91 96 101 106 111 115 120 125 130 134Primary Energy GWh 176.91 185.64 194.20 202.29 209.90 216.81 223.62 230.05 235.99 241.23Pfirm MW 63.27 64.62 67.06 70.43 74.08 77.59 76.99 63.99 61.94 56.71Benefit 1000USD 50,875 52,853 55,128 57,598 60,065 62,365 63,410 60,657 61,110 60,480Cost 1000USD 40,769 41,079 41,402 41,704 42,020 42,279 42,568 42,878 43,161 43,410B/C 1.25 1.29 1.33 1.38 1.43 1.48 1.49 1.41 1.42 1.39
Item Unit FSL=420
Note: The numbers 1 to 10 show case No. of maximum discharge (Qmax).
Table 10.3-12 Result of Economic Evaluation (Option II: FSL=425m)
1 2 3 4 5 6 7 8 9 10Qmax m3/s 102.9 107.8 112.6 117.5 122.3 127.2 132 136.9 141.7 146.6FSL EL.m 425 425 425 425 425 425 425 425 425 425MOL EL.m 399.4 399.8 400 400.2 400.6 400.8 401 401.4 401.6 401.8TWL EL.m 307.8 307.9 307.9 307.9 307.9 308 308 308 308 308.1Loss m 1.2 1.2 1.2 1.2 1.2 1.2 1.2 1.2 1.2 1.2Effective Head m 116 115.9 115.9 115.9 115.9 115.8 115.8 115.8 115.8 115.7Pmax MW 106 111 116 122 126 131 136 141 146 151Primary Energy GWh 201.75 210.31 218.44 226.57 233.70 240.29 246.69 252.94 258.88 263.76Pfirm MW 67.72 69.79 73.14 76.57 80.21 83.36 76.93 62.61 62.09 57.31Benefit 1000USD 56,685 58,849 61,320 63,815 66,193 68,327 67,545 64,362 65,275 64,716Cost 1000USD 42,858 43,177 43,470 43,795 44,069 44,355 44,635 44,937 45,212 45,488B/C 1.32 1.36 1.41 1.46 1.50 1.54 1.51 1.43 1.44 1.42
Item Unit FSL=425
Note: The numbers 1 to 10 show case No. of maximum discharge (Qmax).
Final Report 10 - 96

Upgrading Feasibility Study on the Upper Seti Storage Hydroelectric Project in Nepal
Table 10.3-13 Result of Economic Evaluation (Option II: FSL=435m)
1 2 3 4 5 6 7 8 9 10Qmax m3/s 124.6 129.5 134.4 139.4 144.3 149.2 154.1 159.1 164 168.9FSL EL.m 435 435 435 435 435 435 435 435 435 435MOL EL.m 400.6 401 401.2 401.4 401.6 402 402.2 402.4 402.6 402.8TWL EL.m 308 308 308 308 308 308.1 308.1 308.1 308.1 308.1Loss m 1.2 1.2 1.2 1.2 1.2 1.2 1.2 1.2 1.2 1.2Effective Head m 125.8 125.8 125.8 125.8 125.8 125.7 125.7 125.7 125.7 125.7Pmax MW 140 145 151 156 162 167 173 178 184 189Primary Energy GWh 254.59 262.84 270.84 277.99 284.96 290.87 296.81 302.14 306.49 310.72Pfirm MW 78.36 81.99 85.37 88.84 92.19 78.42 73.05 65.48 61.97 57.30Benefit 1000USD 69,397 71,974 74,430 76,761 79,024 75,945 75,399 74,082 73,809 73,165Cost 1000USD 51,238 51,539 51,847 52,123 52,425 52,719 53,015 53,282 53,574 53,835B/C 1.35 1.40 1.44 1.47 1.51 1.44 1.42 1.39 1.38 1.36
Item Unit FSL=435
Note: The numbers 1 to 10 show case No. of maximum discharge (Qmax).
Table 10.3-14 Result of Economic Evaluation (Option IIIa: FSL=405m)
1 2 3 4 5 6 7 8 9 10Qmax m3/s 65.4 70.2 75 79.8 84.6 89.3 94.1 98.9 103.7 108.5FSL EL.m 405 405 405 405 405 405 405 405 405 405MOL EL.m 397 397.4 397.6 398 398.2 398.6 399 399.2 399.4 399.8TWL EL.m 288.6 288.7 288.7 288.8 288.8 288.9 288.9 288.9 289 289Loss m 3.4 3.4 3.4 3.4 3.4 3.4 3.4 3.4 3.4 3.4Effective Head m 113 112.9 112.9 112.8 112.8 112.7 112.7 112.7 112.6 112.6Pmax MW 66 71 76 80 85 90 95 99 104 109Primary Energy GWh 136.43 146.02 155.63 164.75 173.87 182.24 190.45 197.98 205.33 212.51Pfirm MW 54.76 59.02 63.21 67.04 70.18 70.87 64.87 59.47 52.92 52.28Benefit 1000USD 41,029 44,037 47,027 49,821 52,407 54,121 53,794 53,525 52,878 53,978Cost 1000USD 35,964 36,399 36,766 37,154 37,511 37,929 38,345 38,655 38,998 39,408B/C 1.14 1.21 1.28 1.34 1.40 1.43 1.40 1.38 1.36 1.37
Item Unit FSL=405
Note: The numbers 1 to 10 show case No. of maximum discharge (Qmax).
Table 10.3-15 Result of Economic Evaluation (Option IIIa: FSL=410m)
1 2 3 4 5 6 7 8 9 10Qmax m3/s 73.7 78.2 82.8 87.3 91.9 96.4 101 105.5 110.1 114.6FSL EL.m 410 410 410 410 410 410 410 410 410 410MOL EL.m 397.6 397.8 398.2 398.4 398.8 399 399.4 399.6 399.8 400.2TWL EL.m 288.7 288.8 288.8 288.8 288.9 288.9 289 289 289 289.1Loss m 3.4 3.4 3.4 3.4 3.4 3.4 3.4 3.4 3.4 3.4Effective Head m 117.9 117.8 117.8 117.8 117.7 117.7 117.6 117.6 117.6 117.5Pmax MW 78 82 87 92 97 101 106 111 116 120Primary Energy GWh 157.72 166.57 176.06 185.03 193.70 201.83 210.03 217.58 224.75 230.87Pfirm MW 61.35 65.19 69.35 71.82 75.20 79.10 78.48 70.00 66.72 58.68Benefit 1000USD 46,844 49,592 52,551 54,909 57,486 60,123 61,412 60,220 60,524 59,208Cost 1000USD 38,345 38,662 39,080 39,426 39,838 40,141 40,549 40,883 41,215 41,582B/C 1.22 1.28 1.34 1.39 1.44 1.50 1.51 1.47 1.47 1.42
Item Unit FSL=410
Note: The numbers 1 to 10 show case No. of maximum discharge (Qmax).
Table 10.3-16 Result of Economic Evaluation (Option IIIa: FSL=415m)
1 2 3 4 5 6 7 8 9 10Qmax m3/s 82.6 87.3 92.1 96.8 101.6 106.3 111.1 115.8 120.6 125.3FSL EL.m 415 415 415 415 415 415 415 415 415 415MOL EL.m 398.2 398.4 398.8 399 399.4 399.6 400 400.2 400.4 400.8TWL EL.m 288.8 288.8 288.9 288.9 289 289 289 289.1 289.1 289.1Loss m 3.4 3.4 3.4 3.4 3.4 3.4 3.4 3.4 3.4 3.4Effective Head m 122.8 122.8 122.7 122.7 122.6 122.6 122.6 122.5 122.5 122.5Pmax MW 90 96 101 106 111 116 122 127 132 137Primary Energy GWh 180.47 190.44 200.13 209.50 218.57 226.99 235.45 242.70 249.94 256.44Pfirm MW 68.44 72.50 75.68 77.85 82.08 86.11 88.67 75.71 71.44 60.16Benefit 1000USD 53,071 56,087 58,788 61,127 64,032 66,760 69,053 66,460 66,478 64,255Cost 1000USD 40,621 41,005 41,420 41,761 42,170 42,505 42,944 43,274 43,603 44,002B/C 1.31 1.37 1.42 1.46 1.52 1.57 1.61 1.54 1.52 1.46
Item Unit FSL=415
Note: The numbers 1 to 10 show case No. of maximum discharge (Qmax).
Final Report 10 - 97
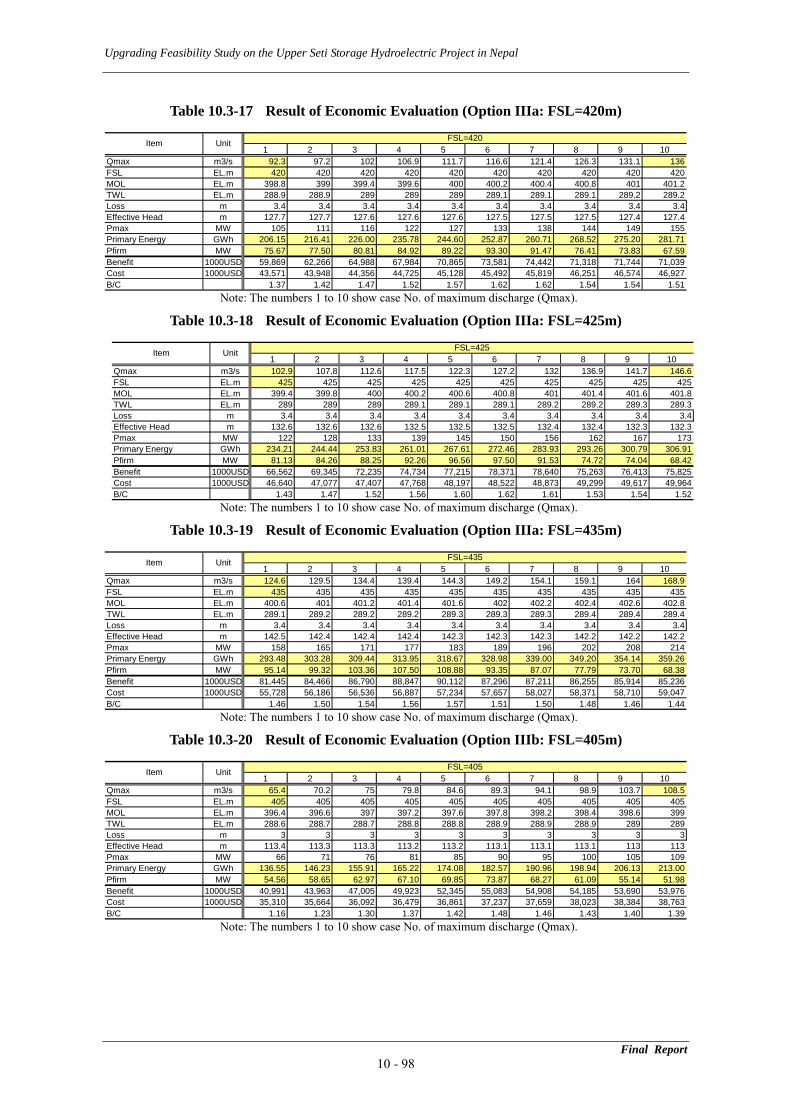
Upgrading Feasibility Study on the Upper Seti Storage Hydroelectric Project in Nepal
Table 10.3-17 Result of Economic Evaluation (Option IIIa: FSL=420m)
1 2 3 4 5 6 7 8 9 10Qmax m3/s 92.3 97.2 102 106.9 111.7 116.6 121.4 126.3 131.1 136FSL EL.m 420 420 420 420 420 420 420 420 420 420MOL EL.m 398.8 399 399.4 399.6 400 400.2 400.4 400.8 401 401.2TWL EL.m 288.9 288.9 289 289 289 289.1 289.1 289.1 289.2 289.2Loss m 3.4 3.4 3.4 3.4 3.4 3.4 3.4 3.4 3.4 3.4Effective Head m 127.7 127.7 127.6 127.6 127.6 127.5 127.5 127.5 127.4 127.4Pmax MW 105 111 116 122 127 133 138 144 149 155Primary Energy GWh 206.15 216.41 226.00 235.78 244.60 252.87 260.71 268.52 275.20 281.71Pfirm MW 75.67 77.50 80.81 84.92 89.22 93.30 91.47 76.41 73.83 67.59Benefit 1000USD 59,869 62,266 64,988 67,984 70,865 73,581 74,442 71,318 71,744 71,039Cost 1000USD 43,571 43,948 44,356 44,725 45,128 45,492 45,819 46,251 46,574 46,927B/C 1.37 1.42 1.47 1.52 1.57 1.62 1.62 1.54 1.54 1.51
Item Unit FSL=420
Note: The numbers 1 to 10 show case No. of maximum discharge (Qmax).
Table 10.3-18 Result of Economic Evaluation (Option IIIa: FSL=425m)
1 2 3 4 5 6 7 8 9 10Qmax m3/s 102.9 107.8 112.6 117.5 122.3 127.2 132 136.9 141.7 146.6FSL EL.m 425 425 425 425 425 425 425 425 425 425MOL EL.m 399.4 399.8 400 400.2 400.6 400.8 401 401.4 401.6 401.8TWL EL.m 289 289 289 289.1 289.1 289.1 289.2 289.2 289.3 289.3Loss m 3.4 3.4 3.4 3.4 3.4 3.4 3.4 3.4 3.4 3.4Effective Head m 132.6 132.6 132.6 132.5 132.5 132.5 132.4 132.4 132.3 132.3Pmax MW 122 128 133 139 145 150 156 162 167 173Primary Energy GWh 234.21 244.44 253.83 261.01 267.61 272.46 283.93 293.26 300.79 306.91Pfirm MW 81.13 84.26 88.25 92.26 96.56 97.50 91.53 74.72 74.04 68.42Benefit 1000USD 66,562 69,345 72,235 74,734 77,215 78,371 78,640 75,263 76,413 75,825Cost 1000USD 46,640 47,077 47,407 47,768 48,197 48,522 48,873 49,299 49,617 49,964B/C 1.43 1.47 1.52 1.56 1.60 1.62 1.61 1.53 1.54 1.52
Item Unit FSL=425
Note: The numbers 1 to 10 show case No. of maximum discharge (Qmax).
Table 10.3-19 Result of Economic Evaluation (Option IIIa: FSL=435m)
1 2 3 4 5 6 7 8 9 10Qmax m3/s 124.6 129.5 134.4 139.4 144.3 149.2 154.1 159.1 164 168.9FSL EL.m 435 435 435 435 435 435 435 435 435 435MOL EL.m 400.6 401 401.2 401.4 401.6 402 402.2 402.4 402.6 402.8TWL EL.m 289.1 289.2 289.2 289.2 289.3 289.3 289.3 289.4 289.4 289.4Loss m 3.4 3.4 3.4 3.4 3.4 3.4 3.4 3.4 3.4 3.4Effective Head m 142.5 142.4 142.4 142.4 142.3 142.3 142.3 142.2 142.2 142.2Pmax MW 158 165 171 177 183 189 196 202 208 214Primary Energy GWh 293.48 303.28 309.44 313.95 318.67 328.98 339.00 349.20 354.14 359.26Pfirm MW 95.14 99.32 103.36 107.50 108.88 93.35 87.07 77.79 73.70 68.38Benefit 1000USD 81,445 84,466 86,790 88,847 90,112 87,296 87,211 86,255 85,914 85,236Cost 1000USD 55,728 56,186 56,536 56,887 57,234 57,657 58,027 58,371 58,710 59,047B/C 1.46 1.50 1.54 1.56 1.57 1.51 1.50 1.48 1.46 1.44
Item Unit FSL=435
Note: The numbers 1 to 10 show case No. of maximum discharge (Qmax).
Table 10.3-20 Result of Economic Evaluation (Option IIIb: FSL=405m)
1 2 3 4 5 6 7 8 9 10Qmax m3/s 65.4 70.2 75 79.8 84.6 89.3 94.1 98.9 103.7 108.5FSL EL.m 405 405 405 405 405 405 405 405 405 405MOL EL.m 396.4 396.6 397 397.2 397.6 397.8 398.2 398.4 398.6 399TWL EL.m 288.6 288.7 288.7 288.8 288.8 288.9 288.9 288.9 289 289Loss m 3 3 3 3 3 3 3 3 3 3Effective Head m 113.4 113.3 113.3 113.2 113.2 113.1 113.1 113.1 113 113Pmax MW 66 71 76 81 85 90 95 100 105 109Primary Energy GWh 136.55 146.23 155.91 165.22 174.08 182.57 190.96 198.94 206.13 213.00Pfirm MW 54.56 58.65 62.97 67.10 69.85 73.87 68.27 61.09 55.14 51.98Benefit 1000USD 40,991 43,963 47,005 49,923 52,345 55,083 54,908 54,185 53,690 53,976Cost 1000USD 35,310 35,664 36,092 36,479 36,861 37,237 37,659 38,023 38,384 38,763B/C 1.16 1.23 1.30 1.37 1.42 1.48 1.46 1.43 1.40 1.39
Item Unit FSL=405
Note: The numbers 1 to 10 show case No. of maximum discharge (Qmax).
Final Report 10 - 98

Upgrading Feasibility Study on the Upper Seti Storage Hydroelectric Project in Nepal
Final Report 10 - 99
Table 10.3-21 Result of Economic Evaluation (Option IIIb: FSL=410m)
1 2 3 4 5 6 7 8 9 10Qmax m3/s 73.7 78.2 82.8 87.3 91.9 96.4 101 105.5 110.1 114.6FSL EL.m 410 410 410 410 410 410 410 410 410 410MOL EL.m 396.8 397.2 397.4 397.8 398 398.2 398.6 398.8 399 399.2TWL EL.m 288.7 288.8 288.8 288.8 288.9 288.9 289 289 289 289.1Loss m 3 3 3 3 3 3 3 3 3Effective Head m 118.3 118.2 118.2 118.2 118.1 118.1 118 118 118 117.9Pmax MW 78 82 87 92 97 102 106 111 116 121Primary Energy GWh 157.85 166.65 176.07 185.27 194.02 202.38 210.26 218.00 225.33 231.64Pfirm MW 60.98 64.95 68.94 72.05 74.64 78.51 82.63 75.67 66.37 65.09Benefit 1000USD 46,756 49,534 52,430 55,021 57,375 60,044 62,702 62,002 60,523 61,274Cost 1000USD 37,515 37,843 38,219 38,627 38,997 39,352 39,728 40,078 40,428 40,781B/C 1.25 1.31 1.37 1.42 1.47 1.53 1.58 1.55 1.50 1.50
Item Unit FSL=410
3
Note: The numbers 1 to 10 show case No. of maximum discharge (Qmax).
Table 10.3-22 Result of Economic Evaluation (Option IIIb: FSL=415m)
1 2 3 4 5 6 7 8 9 10Qmax m3/s 82.6 87.3 92.1 96.8 101.6 106.3 111.1 115.8 120.6 125.3FSL EL.m 415 415 415 415 415 415 415 415 415 415MOL EL.m 397.4 397.8 398 398.4 398.6 398.8 399 399.4 399.6 399.8TWL EL.m 288.8 288.8 288.9 288.9 289 289 289 289.1 289.1 289.1Loss m 3 3 3 3 3 3 3 3 3Effective Head m 123.2 123.2 123.1 123.1 123 123 123 122.9 122.9 122.9Pmax MW 91 96 101 106 111 117 122 127 132 137Primary Energy GWh 180.95 190.74 200.20 209.64 218.69 227.53 235.73 243.08 250.35 256.85Pfirm MW 68.03 72.24 75.21 77.68 81.46 85.46 89.57 76.85 71.05 64.99Benefit 1000USD 53,034 56,063 58,659 61,101 63,867 66,662 69,374 66,871 66,435 65,782Cost 1000USD 39,845 40,203 40,576 40,982 41,349 41,735 42,096 42,494 42,842 43,194B/C 1.33 1.39 1.45 1.49 1.54 1.60 1.65 1.57 1.55 1.52
Item Unit FSL=415
3
Note: The numbers 1 to 10 show case No. of maximum discharge (Qmax).
Table 10.3-23 Result of Economic Evaluation (Option IIIb: FSL=420m)
1 2 3 4 5 6 7 8 9 10Qmax m3/s 92.3 97.2 102 106.9 111.7 116.6 121.4 126.3 131.1 136FSL EL.m 420 420 420 420 420 420 420 420 420 420MOL EL.m 398 398.4 398.6 398.8 399.2 399.4 399.6 399.8 400.2 400.4TWL EL.m 288.9 288.9 289 289 289 289.1 289.1 289.1 289.2 289.2Loss m 3 3 3 3 3 3 3 3 3Effective Head m 128.1 128.1 128 128 128 127.9 127.9 127.9 127.8 127.8Pmax MW 105 111 116 122 128 133 139 144 149 155Primary Energy GWh 206.15 216.64 225.98 235.90 245.03 253.17 261.22 268.66 275.52 282.22Pfirm MW 75.19 77.18 80.19 84.28 88.55 92.60 95.04 78.17 75.13 68.82Benefit 1000USD 59,724 62,211 64,798 67,813 70,741 73,425 75,608 71,872 72,193 71,501Cost 1000USD 42,785 43,168 43,533 43,922 44,362 44,714 45,091 45,445 45,841 46,214B/C 1.40 1.44 1.49 1.54 1.59 1.64 1.68 1.58 1.57 1.55
Item Unit FSL=420
3
Note: The numbers 1 to 10 show case No. of maximum discharge (Qmax).
Table 10.3-24 Result of Economic Evaluation (Option IIIb: FSL=425m)
1 2 3 4 5 6 7 8 9 10Qmax m3/s 102.9 107.8 112.6 117.5 122.3 127.2 132 136.9 141.7 146.6FSL EL.m 425 425 425 425 425 425 425 425 425 425MOL EL.m 398.6 399 399.2 399.4 399.6 400 400.2 400.4 400.6 400.8TWL EL.m 289 289 289 289.1 289.1 289.1 289.2 289.2 289.3 289.3Loss m 3 3 3 3 3 3 3 3 3 3Effective Head m 133 133 133 132.9 132.9 132.9 132.8 132.8 132.7 132.7Pmax MW 122 128 134 139 145 151 156 162 168 174Primary Energy GWh 234.30 244.63 254.17 261.03 268.83 273.01 284.11 293.44 301.38 307.48Pfirm MW 80.61 83.65 87.60 91.57 95.56 99.93 91.10 81.01 73.48 71.27Benefit 1000USD 66,421 69,195 72,101 74,530 77,134 79,201 78,543 77,187 76,351 76,784Cost 1000USD 45,208 45,582 45,959 46,306 46,686 47,110 47,448 47,824 48,188 48,551B/C 1.47 1.52 1.57 1.61 1.65 1.68 1.66 1.61 1.58 1.58
Item Unit FSL=425
Note: The numbers 1 to 10 show case No. of maximum discharge (Qmax).
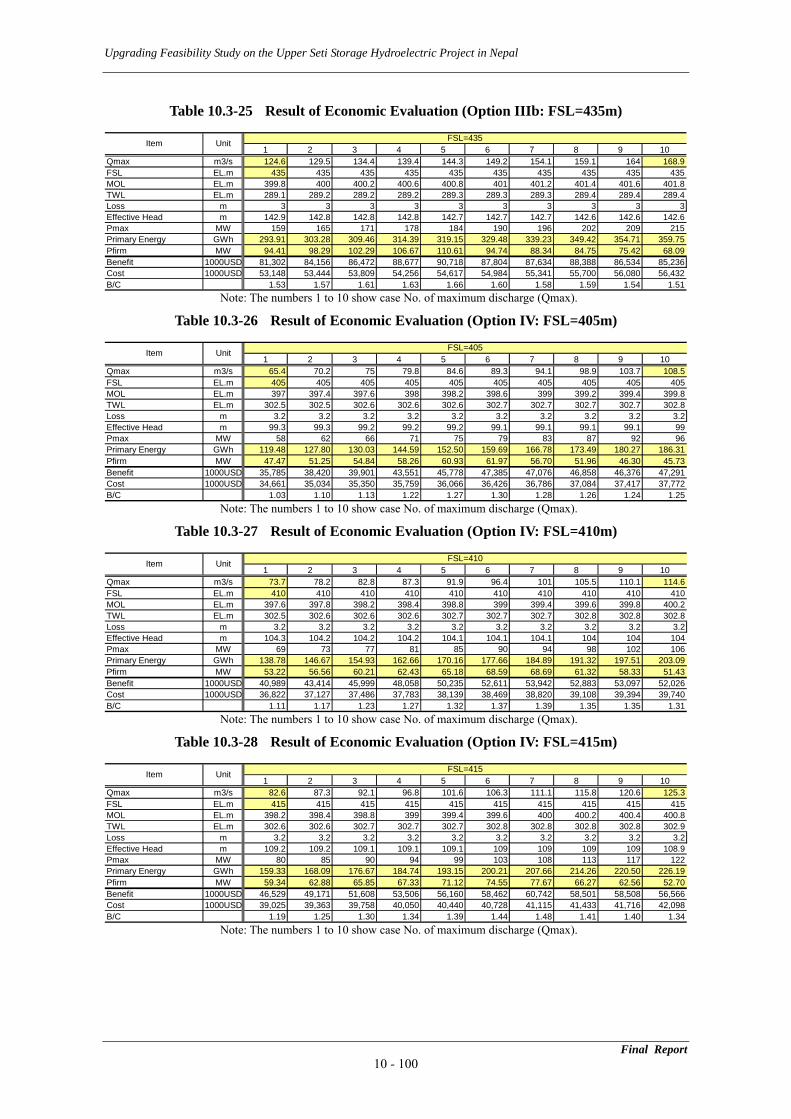
Upgrading Feasibility Study on the Upper Seti Storage Hydroelectric Project in Nepal
Table 10.3-25 Result of Economic Evaluation (Option IIIb: FSL=435m)
1 2 3 4 5 6 7 8 9 10Qmax m3/s 124.6 129.5 134.4 139.4 144.3 149.2 154.1 159.1 164 168.9FSL EL.m 435 435 435 435 435 435 435 435 435 435MOL EL.m 399.8 400 400.2 400.6 400.8 401 401.2 401.4 401.6 401.8TWL EL.m 289.1 289.2 289.2 289.2 289.3 289.3 289.3 289.4 289.4 289.4Loss m 3 3 3 3 3 3 3 3 3 3Effective Head m 142.9 142.8 142.8 142.8 142.7 142.7 142.7 142.6 142.6 142.6Pmax MW 159 165 171 178 184 190 196 202 209 215Primary Energy GWh 293.91 303.28 309.46 314.39 319.15 329.48 339.23 349.42 354.71 359.75Pfirm MW 94.41 98.29 102.29 106.67 110.61 94.74 88.34 84.75 75.42 68.09Benefit 1000USD 81,302 84,156 86,472 88,677 90,718 87,804 87,634 88,388 86,534 85,236Cost 1000USD 53,148 53,444 53,809 54,256 54,617 54,984 55,341 55,700 56,080 56,432B/C 1.53 1.57 1.61 1.63 1.66 1.60 1.58 1.59 1.54 1.51
Item Unit FSL=435
Note: The numbers 1 to 10 show case No. of maximum discharge (Qmax).
Table 10.3-26 Result of Economic Evaluation (Option IV: FSL=405m)
1 2 3 4 5 6 7 8 9 10Qmax m3/s 65.4 70.2 75 79.8 84.6 89.3 94.1 98.9 103.7 108.5FSL EL.m 405 405 405 405 405 405 405 405 405 405MOL EL.m 397 397.4 397.6 398 398.2 398.6 399 399.2 399.4 399.8TWL EL.m 302.5 302.5 302.6 302.6 302.6 302.7 302.7 302.7 302.7 302.8Loss m 3.2 3.2 3.2 3.2 3.2 3.2 3.2 3.2 3.2 3.2Effective Head m 99.3 99.3 99.2 99.2 99.2 99.1 99.1 99.1 99.1 99Pmax MW 58 62 66 71 75 79 83 87 92 96Primary Energy GWh 119.48 127.80 130.03 144.59 152.50 159.69 166.78 173.49 180.27 186.31Pfirm MW 47.47 51.25 54.84 58.26 60.93 61.97 56.70 51.96 46.30 45.73Benefit 1000USD 35,785 38,420 39,901 43,551 45,778 47,385 47,076 46,858 46,376 47,291Cost 1000USD 34,661 35,034 35,350 35,759 36,066 36,426 36,786 37,084 37,417 37,772B/C 1.03 1.10 1.13 1.22 1.27 1.30 1.28 1.26 1.24 1.25
Item Unit FSL=405
Note: The numbers 1 to 10 show case No. of maximum discharge (Qmax).
Table 10.3-27 Result of Economic Evaluation (Option IV: FSL=410m)
1 2 3 4 5 6 7 8 9 10Qmax m3/s 73.7 78.2 82.8 87.3 91.9 96.4 101 105.5 110.1 114.6FSL EL.m 410 410 410 410 410 410 410 410 410 410MOL EL.m 397.6 397.8 398.2 398.4 398.8 399 399.4 399.6 399.8 400.2TWL EL.m 302.5 302.6 302.6 302.6 302.7 302.7 302.7 302.8 302.8 302.8Loss m 3.2 3.2 3.2 3.2 3.2 3.2 3.2 3.2 3.2 3.2Effective Head m 104.3 104.2 104.2 104.2 104.1 104.1 104.1 104 104 104Pmax MW 69 73 77 81 85 90 94 98 102 106Primary Energy GWh 138.78 146.67 154.93 162.66 170.16 177.66 184.89 191.32 197.51 203.09Pfirm MW 53.22 56.56 60.21 62.43 65.18 68.59 68.69 61.32 58.33 51.43Benefit 1000USD 40,989 43,414 45,999 48,058 50,235 52,611 53,942 52,883 53,097 52,026Cost 1000USD 36,822 37,127 37,486 37,783 38,139 38,469 38,820 39,108 39,394 39,740B/C 1.11 1.17 1.23 1.27 1.32 1.37 1.39 1.35 1.35 1.31
Item Unit FSL=410
Note: The numbers 1 to 10 show case No. of maximum discharge (Qmax).
Table 10.3-28 Result of Economic Evaluation (Option IV: FSL=415m)
1 2 3 4 5 6 7 8 9 10Qmax m3/s 82.6 87.3 92.1 96.8 101.6 106.3 111.1 115.8 120.6 125.3FSL EL.m 415 415 415 415 415 415 415 415 415 415MOL EL.m 398.2 398.4 398.8 399 399.4 399.6 400 400.2 400.4 400.8TWL EL.m 302.6 302.6 302.7 302.7 302.7 302.8 302.8 302.8 302.8 302.9Loss m 3.2 3.2 3.2 3.2 3.2 3.2 3.2 3.2 3.2 3.2Effective Head m 109.2 109.2 109.1 109.1 109.1 109 109 109 109 108.9Pmax MW 80 85 90 94 99 103 108 113 117 122Primary Energy GWh 159.33 168.09 176.67 184.74 193.15 200.21 207.66 214.26 220.50 226.19Pfirm MW 59.34 62.88 65.85 67.33 71.12 74.55 77.67 66.27 62.56 52.70Benefit 1000USD 46,529 49,171 51,608 53,506 56,160 58,462 60,742 58,501 58,508 56,566Cost 1000USD 39,025 39,363 39,758 40,050 40,440 40,728 41,115 41,433 41,716 42,098B/C 1.19 1.25 1.30 1.34 1.39 1.44 1.48 1.41 1.40 1.34
Item Unit FSL=415
Note: The numbers 1 to 10 show case No. of maximum discharge (Qmax).
Final Report 10 - 100
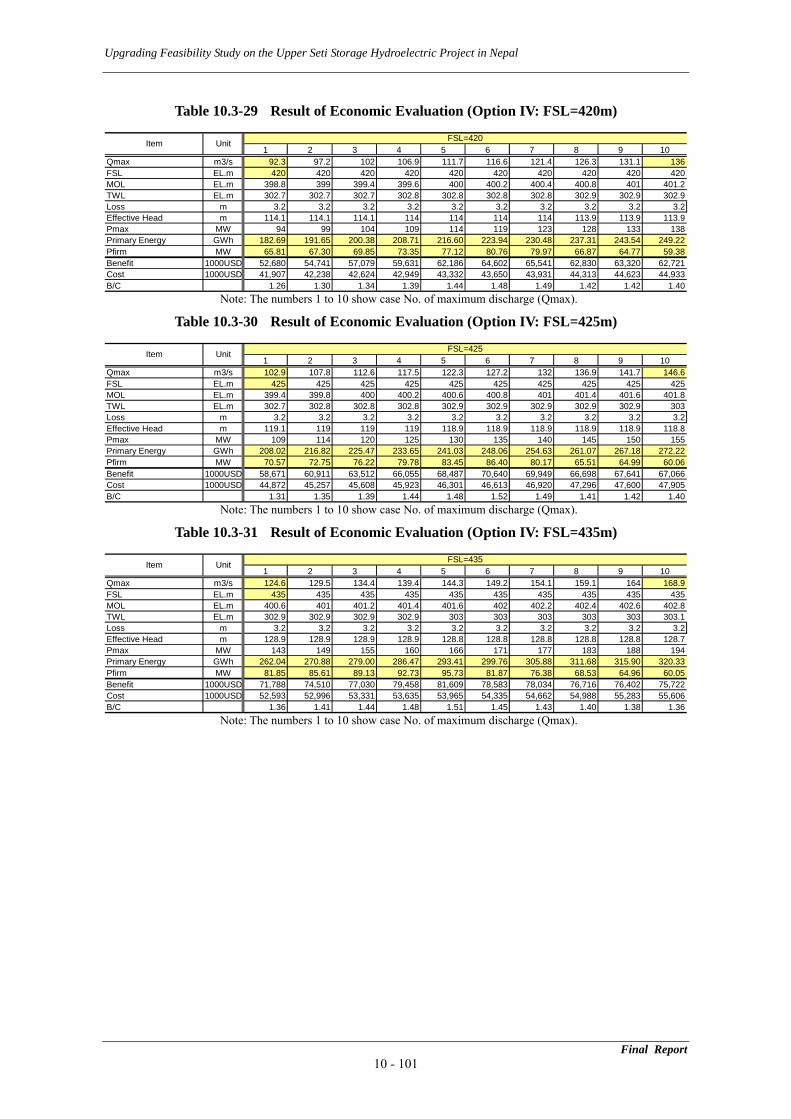
Upgrading Feasibility Study on the Upper Seti Storage Hydroelectric Project in Nepal
Table 10.3-29 Result of Economic Evaluation (Option IV: FSL=420m)
1 2 3 4 5 6 7 8 9 10Qmax m3/s 92.3 97.2 102 106.9 111.7 116.6 121.4 126.3 131.1 136FSL EL.m 420 420 420 420 420 420 420 420 420 420MOL EL.m 398.8 399 399.4 399.6 400 400.2 400.4 400.8 401 401.2TWL EL.m 302.7 302.7 302.7 302.8 302.8 302.8 302.8 302.9 302.9 302.9Loss m 3.2 3.2 3.2 3.2 3.2 3.2 3.2 3.2 3.2 3.2Effective Head m 114.1 114.1 114.1 114 114 114 114 113.9 113.9 113.9Pmax MW 94 99 104 109 114 119 123 128 133 138Primary Energy GWh 182.69 191.65 200.38 208.71 216.60 223.94 230.48 237.31 243.54 249.22Pfirm MW 65.81 67.30 69.85 73.35 77.12 80.76 79.97 66.87 64.77 59.38Benefit 1000USD 52,680 54,741 57,079 59,631 62,186 64,602 65,541 62,830 63,320 62,721Cost 1000USD 41,907 42,238 42,624 42,949 43,332 43,650 43,931 44,313 44,623 44,933B/C 1.26 1.30 1.34 1.39 1.44 1.48 1.49 1.42 1.42 1.40
Item Unit FSL=420
Note: The numbers 1 to 10 show case No. of maximum discharge (Qmax).
Table 10.3-30 Result of Economic Evaluation (Option IV: FSL=425m)
1 2 3 4 5 6 7 8 9 10Qmax m3/s 102.9 107.8 112.6 117.5 122.3 127.2 132 136.9 141.7 146.6FSL EL.m 425 425 425 425 425 425 425 425 425 425MOL EL.m 399.4 399.8 400 400.2 400.6 400.8 401 401.4 401.6 401.8TWL EL.m 302.7 302.8 302.8 302.8 302.9 302.9 302.9 302.9 302.9 303Loss m 3.2 3.2 3.2 3.2 3.2 3.2 3.2 3.2 3.2 3.2Effective Head m 119.1 119 119 119 118.9 118.9 118.9 118.9 118.9 118.8Pmax MW 109 114 120 125 130 135 140 145 150 155Primary Energy GWh 208.02 216.82 225.47 233.65 241.03 248.06 254.63 261.07 267.18 272.22Pfirm MW 70.57 72.75 76.22 79.78 83.45 86.40 80.17 65.51 64.99 60.06Benefit 1000USD 58,671 60,911 63,512 66,055 68,487 70,640 69,949 66,698 67,641 67,066Cost 1000USD 44,872 45,257 45,608 45,923 46,301 46,613 46,920 47,296 47,600 47,905B/C 1.31 1.35 1.39 1.44 1.48 1.52 1.49 1.41 1.42 1.40
Item Unit FSL=425
Note: The numbers 1 to 10 show case No. of maximum discharge (Qmax).
Table 10.3-31 Result of Economic Evaluation (Option IV: FSL=435m)
1 2 3 4 5 6 7 8 9 10Qmax m3/s 124.6 129.5 134.4 139.4 144.3 149.2 154.1 159.1 164 168.9FSL EL.m 435 435 435 435 435 435 435 435 435 435MOL EL.m 400.6 401 401.2 401.4 401.6 402 402.2 402.4 402.6 402.8TWL EL.m 302.9 302.9 302.9 302.9 303 303 303 303 303 303.1Loss m 3.2 3.2 3.2 3.2 3.2 3.2 3.2 3.2 3.2 3.2Effective Head m 128.9 128.9 128.9 128.9 128.8 128.8 128.8 128.8 128.8 128.7Pmax MW 143 149 155 160 166 171 177 183 188 194Primary Energy GWh 262.04 270.88 279.00 286.47 293.41 299.76 305.88 311.68 315.90 320.33Pfirm MW 81.85 85.61 89.13 92.73 95.73 81.87 76.38 68.53 64.96 60.05Benefit 1000USD 71,788 74,510 77,030 79,458 81,609 78,583 78,034 76,716 76,402 75,722Cost 1000USD 52,593 52,996 53,331 53,635 53,965 54,335 54,662 54,988 55,283 55,606B/C 1.36 1.41 1.44 1.48 1.51 1.45 1.43 1.40 1.38 1.36
Item Unit FSL=435
Note: The numbers 1 to 10 show case No. of maximum discharge (Qmax).
Final Report 10 - 101
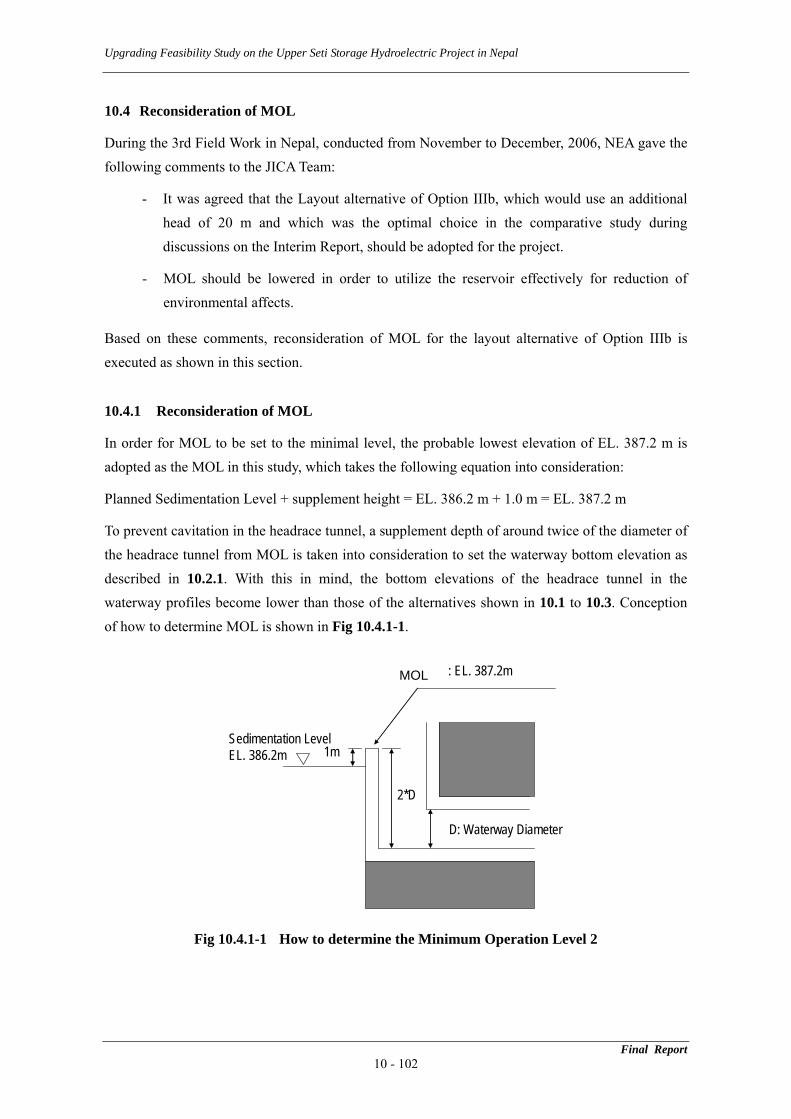
Upgrading Feasibility Study on the Upper Seti Storage Hydroelectric Project in Nepal
Final Report 10 - 102
10.4 Reconsideration of MOL
During the 3rd Field Work in Nepal, conducted from November to December, 2006, NEA gave the following comments to the JICA Team:
- It was agreed that the Layout alternative of Option IIIb, which would use an additional head of 20 m and which was the optimal choice in the comparative study during discussions on the Interim Report, should be adopted for the project.
- MOL should be lowered in order to utilize the reservoir effectively for reduction of environmental affects.
Based on these comments, reconsideration of MOL for the layout alternative of Option IIIb is executed as shown in this section.
10.4.1 Reconsideration of MOL
In order for MOL to be set to the minimal level, the probable lowest elevation of EL. 387.2 m is adopted as the MOL in this study, which takes the following equation into consideration:
Planned Sedimentation Level + supplement height = EL. 386.2 m + 1.0 m = EL. 387.2 m
To prevent cavitation in the headrace tunnel, a supplement depth of around twice of the diameter of the headrace tunnel from MOL is taken into consideration to set the waterway bottom elevation as described in 10.2.1. With this in mind, the bottom elevations of the headrace tunnel in the waterway profiles become lower than those of the alternatives shown in 10.1 to 10.3. Conception of how to determine MOL is shown in Fig 10.4.1-1.
Sedimentation LevelEL. 386.2m
D: Waterway Diameter
2*D
1m
LWL : EL. 387.2m
Fig 10.4.1-1 How to determine the Minimum Operation Level 2
MOL
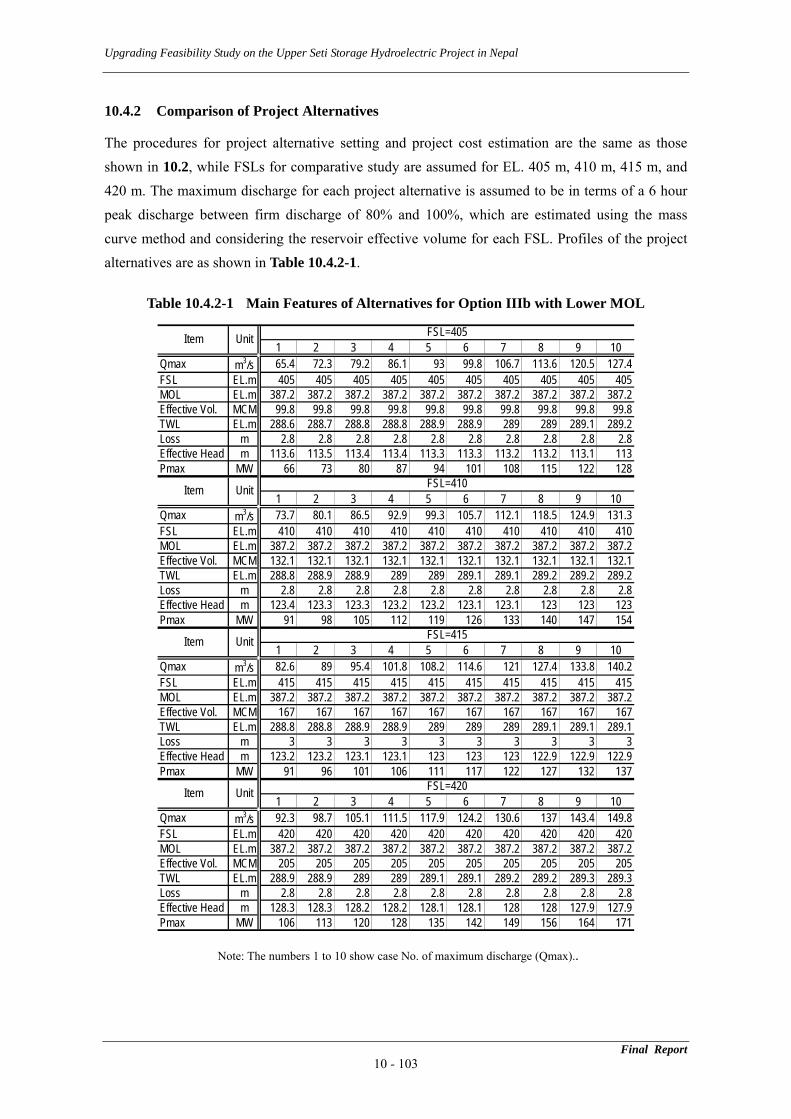
Upgrading Feasibility Study on the Upper Seti Storage Hydroelectric Project in Nepal
10.4.2 Comparison of Project Alternatives
The procedures for project alternative setting and project cost estimation are the same as those shown in 10.2, while FSLs for comparative study are assumed for EL. 405 m, 410 m, 415 m, and 420 m. The maximum discharge for each project alternative is assumed to be in terms of a 6 hour peak discharge between firm discharge of 80% and 100%, which are estimated using the mass curve method and considering the reservoir effective volume for each FSL. Profiles of the project alternatives are as shown in Table 10.4.2-1.
Table 10.4.2-1 Main Features of Alternatives for Option IIIb with Lower MOL
1 2 3 4 5 6 7 8 9 10Qmax m3/s 65.4 72.3 79.2 86.1 93 99.8 106.7 113.6 120.5 127.4FSL EL.m 405 405 405 405 405 405 405 405 405 405MOL EL.m 387.2 387.2 387.2 387.2 387.2 387.2 387.2 387.2 387.2 387.2Effective Vol. MCM 99.8 99.8 99.8 99.8 99.8 99.8 99.8 99.8 99.8 99.8TWL EL.m 288.6 288.7 288.8 288.8 288.9 288.9 289 289 289.1 289.2Loss m 2.8 2.8 2.8 2.8 2.8 2.8 2.8 2.8 2.8 2.8Effective Head m 113.6 113.5 113.4 113.4 113.3 113.3 113.2 113.2 113.1 113Pmax MW 66 73 80 87 94 101 108 115 122 128
1 2 3 4 5 6 7 8 9 10Qmax m3/s 73.7 80.1 86.5 92.9 99.3 105.7 112.1 118.5 124.9 131.3FSL EL.m 410 410 410 410 410 410 410 410 410 410MOL EL.m 387.2 387.2 387.2 387.2 387.2 387.2 387.2 387.2 387.2 387.2Effective Vol. MCM 132.1 132.1 132.1 132.1 132.1 132.1 132.1 132.1 132.1 132.1TWL EL.m 288.8 288.9 288.9 289 289 289.1 289.1 289.2 289.2 289.2Loss m 2.8 2.8 2.8 2.8 2.8 2.8 2.8 2.8 2.8 2.8Effective Head m 123.4 123.3 123.3 123.2 123.2 123.1 123.1 123 123 123Pmax MW 91 98 105 112 119 126 133 140 147 154
1 2 3 4 5 6 7 8 9 10Qmax m3/s 82.6 89 95.4 101.8 108.2 114.6 121 127.4 133.8 140.2FSL EL.m 415 415 415 415 415 415 415 415 415 415MOL EL.m 387.2 387.2 387.2 387.2 387.2 387.2 387.2 387.2 387.2 387.2Effective Vol. MCM 167 167 167 167 167 167 167 167 167 167TWL EL.m 288.8 288.8 288.9 288.9 289 289 289 289.1 289.1 289.1Loss m 3 3 3 3 3 3 3 3 3 3Effective Head m 123.2 123.2 123.1 123.1 123 123 123 122.9 122.9 122.9Pmax MW 91 96 101 106 111 117 122 127 132 137
1 2 3 4 5 6 7 8 9 10Qmax m3/s 92.3 98.7 105.1 111.5 117.9 124.2 130.6 137 143.4 149.8FSL EL.m 420 420 420 420 420 420 420 420 420 420MOL EL.m 387.2 387.2 387.2 387.2 387.2 387.2 387.2 387.2 387.2 387.2Effective Vol. MCM 205 205 205 205 205 205 205 205 205 205TWL EL.m 288.9 288.9 289 289 289.1 289.1 289.2 289.2 289.3 289.3Loss m 2.8 2.8 2.8 2.8 2.8 2.8 2.8 2.8 2.8 2.8Effective Head m 128.3 128.3 128.2 128.2 128.1 128.1 128 128 127.9 127.9Pmax MW 106 113 120 128 135 142 149 156 164 171
Unit FSL=410
Item Unit FSL=420
Item Unit FSL=405
Item Unit FSL=415
Item
Note: The numbers 1 to 10 show case No. of maximum discharge (Qmax)..
Final Report 10 - 103

Upgrading Feasibility Study on the Upper Seti Storage Hydroelectric Project in Nepal
The project cost of each alternative was estimated as mentioned in 10.2.2. In this case, if the maximum discharge increases, the diameter of the headrace tunnel expands, meaning the bottom elevation level of the headrace tunnel is reduced and the headrace tunnel length is extended. However, the length of penstock becomes shorter, which decreases the penstock weight. The project cost estimation results are shown in Tables 10.4.2-2 to 5.
Table 10.4.2-2 Project Cost (FSL 405)
Project Cost Summary 1,000USD
1 2 3 4 5 6 7 8 9 101. Preparation & Compensation 2,957 2,984 3,018 3,051 3,084 3,117 3,150 3,184 3,217 3,250(1) Access Road(2) Conpensation(3) Others2. Environmental Mitigation 26,280 26,280 26,280 26,280 26,280 26,280 26,280 26,280 26,280 26,2803. Civil Works(1) River Treatment 6,053 6,053 6,053 6,053 6,053 6,053 6,053 6,053 6,053 6,053(2) Dam 103,360 103,360 103,360 103,360 103,360 103,360 103,360 103,360 103,360 103,360(3) Intake 1,108 1,183 1,256 1,327 1,397 1,465 1,533 1,600 1,666 1,731(4) Power Tunnel 6,674 7,074 7,486 7,909 8,341 8,786 9,240 9,705 10,183 10,669(5) Penstock 721 769 816 861 906 949 993 1,036 1,077 1,119(6) Power House 8,064 8,476 8,869 9,247 9,607 9,952 10,288 10,615 10,930 11,235(7) Tailrace Tunnel 1,507 1,585 1,704 1,786 1,870 1,955 2,041 2,130 2,220 2,311(8) Tailrace 300 327 359 387 415 443 471 500 529 558(9)P/S Access Tunnel 6,900 6,900 6,900 6,900 6,900 6,900 6,900 6,900 6,900 6,900(10) Surge Tank 5,736 6,265 6,799 7,337 7,881 8,425 8,979 9,539 10,103 10,673(11) Others 7,041 6,808 6,863 6,916 6,968 7,020 7,073 7,126 7,178 7,2314. Hydro-Mechanical Works 17,196 17,497 17,794 18,091 18,389 18,680 18,977 19,275 19,567 19,8625. Electro-Mechanical Works 27,209 29,112 30,957 32,741 34,488 36,183 37,850 39,472 41,073 42,4246. Transmission Line 10,170 10,170 10,170 10,170 10,170 10,170 10,170 10,170 10,170 10,170
Direct Cost 231,275 234,842 238,682 242,415 246,110 249,738 253,359 256,943 260,504 263,8277. Administration Fee 34,691 35,226 35,802 36,362 36,917 37,461 38,004 38,542 39,076 39,5748. Contingency 23,127 23,484 23,868 24,242 24,611 24,974 25,336 25,694 26,050 26,3839. Interest During Construction 57,819 58,711 59,671 60,604 61,528 62,434 63,340 64,236 65,126 65,957
Total 346,912 352,264 358,024 363,623 369,165 374,607 380,038 385,415 390,757 395,740
Item FSL=405
Note: The numbers 1 to 10 correspond to case No. of maximum discharge at each FSL in Table 10.4.2-1.
Table 10.4.2-3 Project Cost (FSL 410)
Project Cost Summary 1,000USD
1 2 3 4 5 6 7 8 9 101. Preparation & Compensation 3,142 3,168 3,200 3,231 3,263 3,296 3,328 3,353 3,385 3,417(1) Access Road(2) Conpensation(3) Others2. Environmental Mitigation 28,230 28,230 28,230 28,230 28,230 28,230 28,230 28,230 28,230 28,2303. Civil Works(1) River Treatment 6,053 6,053 6,053 6,053 6,053 6,053 6,053 6,053 6,053 6,053(2) Dam 110,062 110,062 110,062 110,062 110,062 110,062 110,062 110,062 110,062 110,062(3) Intake 1,349 1,424 1,498 1,570 1,641 1,711 1,780 1,844 1,911 1,977(4) Power Tunnel 7,076 7,488 7,910 8,344 8,788 9,244 9,709 9,948 10,431 10,924(5) Penstock 776 819 862 902 942 981 1,022 1,058 1,095 1,133(6) Power House 8,682 9,048 9,403 9,741 10,071 10,388 10,698 10,996 11,289 11,571(7) Tailrace Tunnel 1,624 1,704 1,786 1,870 1,955 2,041 2,130 2,220 2,265 2,358(8) Tailrace 335 362 388 415 441 469 496 523 546 574(9)P/S Access Tunnel 6,900 6,900 6,900 6,900 6,900 6,900 6,900 6,900 6,900 6,900(10) Surge Tank 6,346 6,853 7,365 7,882 8,404 8,931 9,464 9,907 10,447 10,993(11) Others 7,481 7,216 7,267 7,319 7,370 7,421 7,473 7,512 7,561 7,6134. Hydro-Mechanical Works 17,649 17,932 18,217 18,498 18,779 19,057 19,343 19,617 19,894 20,1745. Electro-Mechanical Works 29,994 31,775 33,256 34,954 36,602 37,997 39,581 41,146 42,671 43,9696. Transmission Line 10,170 10,170 10,170 10,170 10,170 10,170 10,170 10,170 10,170 10,170
Direct Cost 245,870 249,202 252,565 256,139 259,672 262,951 266,438 269,538 272,910 276,1187. Administration Fee 36,880 37,380 37,885 38,421 38,951 39,443 39,966 40,431 40,936 41,4188. Contingency 24,587 24,920 25,257 25,614 25,967 26,295 26,644 26,954 27,291 27,6129. Interest During Construction 61,467 62,301 63,141 64,035 64,918 65,738 66,609 67,384 68,227 69,029
Total 368,805 373,803 378,848 384,209 389,507 394,426 399,657 404,307 409,365 414,177
Item FSL=410
Note: The numbers 1 to 10 correspond to case No. of maximum discharge at each FSL in Table 10.4.2-1.
Final Report 10 - 104
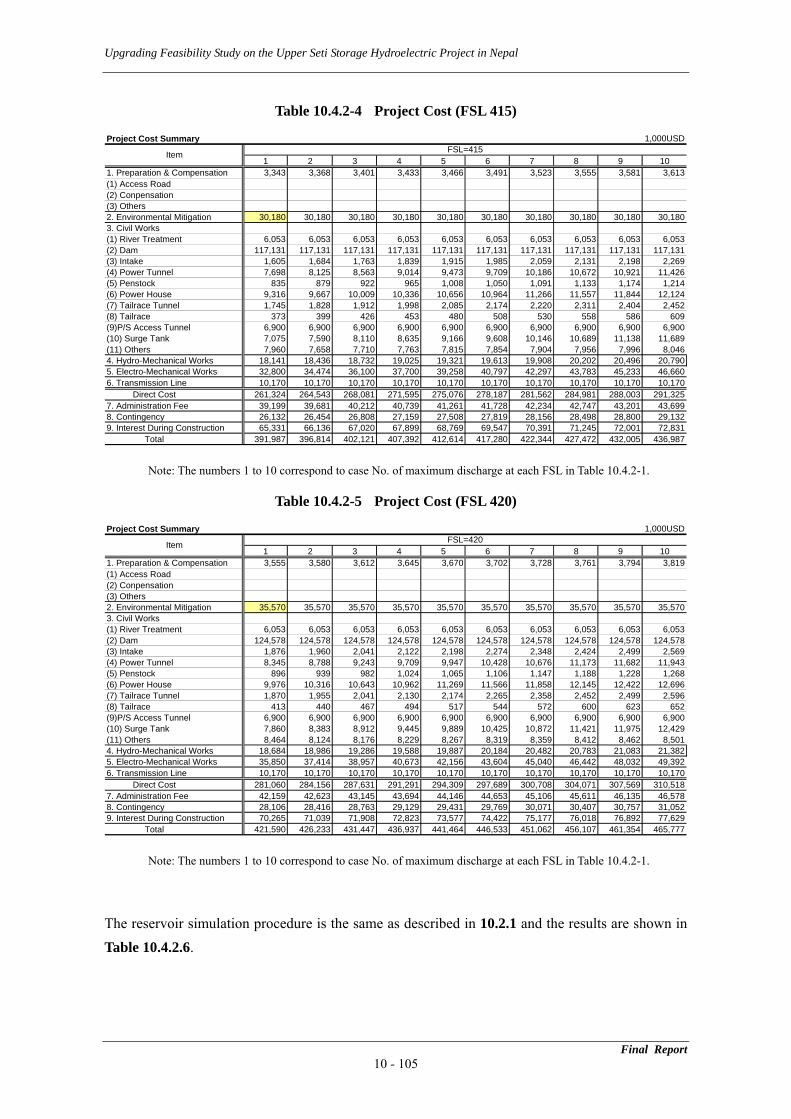
Upgrading Feasibility Study on the Upper Seti Storage Hydroelectric Project in Nepal
Table 10.4.2-4 Project Cost (FSL 415)
Project Cost Summary 1,000USD
1 2 3 4 5 6 7 8 9 101. Preparation & Compensation 3,343 3,368 3,401 3,433 3,466 3,491 3,523 3,555 3,581 3,613(1) Access Road(2) Conpensation(3) Others2. Environmental Mitigation 30,180 30,180 30,180 30,180 30,180 30,180 30,180 30,180 30,180 30,1803. Civil Works(1) River Treatment 6,053 6,053 6,053 6,053 6,053 6,053 6,053 6,053 6,053 6,053(2) Dam 117,131 117,131 117,131 117,131 117,131 117,131 117,131 117,131 117,131 117,131(3) Intake 1,605 1,684 1,763 1,839 1,915 1,985 2,059 2,131 2,198 2,269(4) Power Tunnel 7,698 8,125 8,563 9,014 9,473 9,709 10,186 10,672 10,921 11,426(5) Penstock 835 879 922 965 1,008 1,050 1,091 1,133 1,174 1,214(6) Power House 9,316 9,667 10,009 10,336 10,656 10,964 11,266 11,557 11,844 12,124(7) Tailrace Tunnel 1,745 1,828 1,912 1,998 2,085 2,174 2,220 2,311 2,404 2,452(8) Tailrace 373 399 426 453 480 508 530 558 586 609(9)P/S Access Tunnel 6,900 6,900 6,900 6,900 6,900 6,900 6,900 6,900 6,900 6,900(10) Surge Tank 7,075 7,590 8,110 8,635 9,166 9,608 10,146 10,689 11,138 11,689(11) Others 7,960 7,658 7,710 7,763 7,815 7,854 7,904 7,956 7,996 8,0464. Hydro-Mechanical Works 18,141 18,436 18,732 19,025 19,321 19,613 19,908 20,202 20,496 20,7905. Electro-Mechanical Works 32,800 34,474 36,100 37,700 39,258 40,797 42,297 43,783 45,233 46,6606. Transmission Line 10,170 10,170 10,170 10,170 10,170 10,170 10,170 10,170 10,170 10,170
Direct Cost 261,324 264,543 268,081 271,595 275,076 278,187 281,562 284,981 288,003 291,3257. Administration Fee 39,199 39,681 40,212 40,739 41,261 41,728 42,234 42,747 43,201 43,6998. Contingency 26,132 26,454 26,808 27,159 27,508 27,819 28,156 28,498 28,800 29,1329. Interest During Construction 65,331 66,136 67,020 67,899 68,769 69,547 70,391 71,245 72,001 72,831
Total 391,987 396,814 402,121 407,392 412,614 417,280 422,344 427,472 432,005 436,987
Item FSL=415
Note: The numbers 1 to 10 correspond to case No. of maximum discharge at each FSL in Table 10.4.2-1.
Table 10.4.2-5 Project Cost (FSL 420)
Project Cost Summary 1,000USD
1 2 3 4 5 6 7 8 9 101. Preparation & Compensation 3,555 3,580 3,612 3,645 3,670 3,702 3,728 3,761 3,794 3,819(1) Access Road(2) Conpensation(3) Others2. Environmental Mitigation 35,570 35,570 35,570 35,570 35,570 35,570 35,570 35,570 35,570 35,5703. Civil Works(1) River Treatment 6,053 6,053 6,053 6,053 6,053 6,053 6,053 6,053 6,053 6,053(2) Dam 124,578 124,578 124,578 124,578 124,578 124,578 124,578 124,578 124,578 124,578(3) Intake 1,876 1,960 2,041 2,122 2,198 2,274 2,348 2,424 2,499 2,569(4) Power Tunnel 8,345 8,788 9,243 9,709 9,947 10,428 10,676 11,173 11,682 11,943(5) Penstock 896 939 982 1,024 1,065 1,106 1,147 1,188 1,228 1,268(6) Power House 9,976 10,316 10,643 10,962 11,269 11,566 11,858 12,145 12,422 12,696(7) Tailrace Tunnel 1,870 1,955 2,041 2,130 2,174 2,265 2,358 2,452 2,499 2,596(8) Tailrace 413 440 467 494 517 544 572 600 623 652(9)P/S Access Tunnel 6,900 6,900 6,900 6,900 6,900 6,900 6,900 6,900 6,900 6,900(10) Surge Tank 7,860 8,383 8,912 9,445 9,889 10,425 10,872 11,421 11,975 12,429(11) Others 8,464 8,124 8,176 8,229 8,267 8,319 8,359 8,412 8,462 8,5014. Hydro-Mechanical Works 18,684 18,986 19,286 19,588 19,887 20,184 20,482 20,783 21,083 21,3825. Electro-Mechanical Works 35,850 37,414 38,957 40,673 42,156 43,604 45,040 46,442 48,032 49,3926. Transmission Line 10,170 10,170 10,170 10,170 10,170 10,170 10,170 10,170 10,170 10,170
Direct Cost 281,060 284,156 287,631 291,291 294,309 297,689 300,708 304,071 307,569 310,5187. Administration Fee 42,159 42,623 43,145 43,694 44,146 44,653 45,106 45,611 46,135 46,5788. Contingency 28,106 28,416 28,763 29,129 29,431 29,769 30,071 30,407 30,757 31,0529. Interest During Construction 70,265 71,039 71,908 72,823 73,577 74,422 75,177 76,018 76,892 77,629
Total 421,590 426,233 431,447 436,937 441,464 446,533 451,062 456,107 461,354 465,777
Item FSL=420
Note: The numbers 1 to 10 correspond to case No. of maximum discharge at each FSL in Table 10.4.2-1.
The reservoir simulation procedure is the same as described in 10.2.1 and the results are shown in Table 10.4.2.6.
Final Report 10 - 105
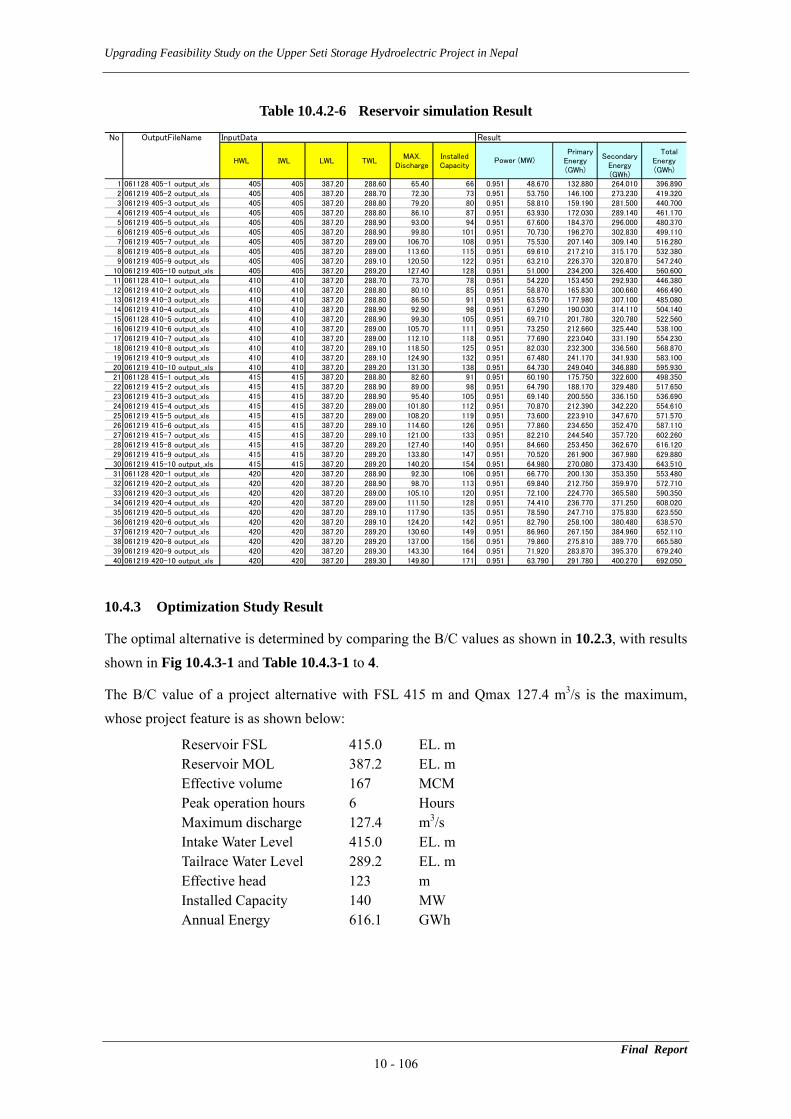
Upgrading Feasibility Study on the Upper Seti Storage Hydroelectric Project in Nepal
Table 10.4.2-6 Reservoir simulation Result
No OutputFileName InputData Result
HWL IWL LWL TWLMAX.
DischargeInstalledCapacity
PrimaryEnergy(GWh)
Secondary
Energy(GWh)
TotalEnergy(GWh)
1 061128 405-1 output_.xls 405 405 387.20 288.60 65.40 66 0.951 48.670 132.880 264.010 396.8902 061219 405-2 output_.xls 405 405 387.20 288.70 72.30 73 0.951 53.750 146.100 273.230 419.3203 061219 405-3 output_.xls 405 405 387.20 288.80 79.20 80 0.951 58.810 159.190 281.500 440.7004 061219 405-4 output_.xls 405 405 387.20 288.80 86.10 87 0.951 63.930 172.030 289.140 461.1705 061219 405-5 output_.xls 405 405 387.20 288.90 93.00 94 0.951 67.600 184.370 296.000 480.3706 061219 405-6 output_.xls 405 405 387.20 288.90 99.80 101 0.951 70.730 196.270 302.830 499.1107 061219 405-7 output_.xls 405 405 387.20 289.00 106.70 108 0.951 75.530 207.140 309.140 516.2808 061219 405-8 output_.xls 405 405 387.20 289.00 113.60 115 0.951 69.610 217.210 315.170 532.3809 061219 405-9 output_.xls 405 405 387.20 289.10 120.50 122 0.951 63.210 226.370 320.870 547.240
10 061219 405-10 output_.xls 405 405 387.20 289.20 127.40 128 0.951 51.000 234.200 326.400 560.60011 061128 410-1 output_.xls 410 410 387.20 288.70 73.70 78 0.951 54.220 153.450 292.930 446.38012 061219 410-2 output_.xls 410 410 387.20 288.80 80.10 85 0.951 58.870 165.830 300.660 466.49013 061219 410-3 output_.xls 410 410 387.20 288.80 86.50 91 0.951 63.570 177.980 307.100 485.08014 061219 410-4 output_.xls 410 410 387.20 288.90 92.90 98 0.951 67.290 190.030 314.110 504.14015 061128 410-5 output_.xls 410 410 387.20 288.90 99.30 105 0.951 69.710 201.780 320.780 522.56016 061219 410-6 output_.xls 410 410 387.20 289.00 105.70 111 0.951 73.250 212.660 325.440 538.10017 061219 410-7 output_.xls 410 410 387.20 289.00 112.10 118 0.951 77.690 223.040 331.190 554.23018 061219 410-8 output_.xls 410 410 387.20 289.10 118.50 125 0.951 82.030 232.300 336.560 568.87019 061219 410-9 output_.xls 410 410 387.20 289.10 124.90 132 0.951 67.480 241.170 341.930 583.10020 061219 410-10 output_.xls 410 410 387.20 289.20 131.30 138 0.951 64.730 249.040 346.880 595.93021 061128 415-1 output_.xls 415 415 387.20 288.80 82.60 91 0.951 60.190 175.750 322.600 498.35022 061219 415-2 output_.xls 415 415 387.20 288.90 89.00 98 0.951 64.790 188.170 329.480 517.65023 061219 415-3 output_.xls 415 415 387.20 288.90 95.40 105 0.951 69.140 200.550 336.150 536.69024 061219 415-4 output_.xls 415 415 387.20 289.00 101.80 112 0.951 70.870 212.390 342.220 554.61025 061219 415-5 output_.xls 415 415 387.20 289.00 108.20 119 0.951 73.600 223.910 347.670 571.57026 061219 415-6 output_.xls 415 415 387.20 289.10 114.60 126 0.951 77.860 234.650 352.470 587.11027 061219 415-7 output_.xls 415 415 387.20 289.10 121.00 133 0.951 82.210 244.540 357.720 602.26028 061219 415-8 output_.xls 415 415 387.20 289.20 127.40 140 0.951 84.660 253.450 362.670 616.12029 061219 415-9 output_.xls 415 415 387.20 289.20 133.80 147 0.951 70.520 261.900 367.980 629.88030 061219 415-10 output_.xls 415 415 387.20 289.20 140.20 154 0.951 64.980 270.080 373.430 643.51031 061128 420-1 output_.xls 420 420 387.20 288.90 92.30 106 0.951 66.770 200.130 353.350 553.48032 061219 420-2 output_.xls 420 420 387.20 288.90 98.70 113 0.951 69.840 212.750 359.970 572.71033 061219 420-3 output_.xls 420 420 387.20 289.00 105.10 120 0.951 72.100 224.770 365.580 590.35034 061219 420-4 output_.xls 420 420 387.20 289.00 111.50 128 0.951 74.410 236.770 371.250 608.02035 061219 420-5 output_.xls 420 420 387.20 289.10 117.90 135 0.951 78.590 247.710 375.830 623.55036 061219 420-6 output_.xls 420 420 387.20 289.10 124.20 142 0.951 82.790 258.100 380.480 638.57037 061219 420-7 output_.xls 420 420 387.20 289.20 130.60 149 0.951 86.960 267.150 384.960 652.11038 061219 420-8 output_.xls 420 420 387.20 289.20 137.00 156 0.951 79.860 275.810 389.770 665.58039 061219 420-9 output_.xls 420 420 387.20 289.30 143.30 164 0.951 71.920 283.870 395.370 679.24040 061219 420-10 output_.xls 420 420 387.20 289.30 149.80 171 0.951 63.790 291.780 400.270 692.050
Power (MW)
10.4.3 Optimization Study Result
The optimal alternative is determined by comparing the B/C values as shown in 10.2.3, with results shown in Fig 10.4.3-1 and Table 10.4.3-1 to 4.
The B/C value of a project alternative with FSL 415 m and Qmax 127.4 m3/s is the maximum, whose project feature is as shown below:
Reservoir FSL 415.0 EL. m Reservoir MOL 387.2 EL. m Effective volume 167 MCM Peak operation hours 6 Hours
m3/s Maximum discharge 127.4 Intake Water Level 415.0 EL. m Tailrace Water Level 289.2 EL. m Effective head 123 m Installed Capacity 140 MW Annual Energy 616.1 GWh
Final Report 10 - 106
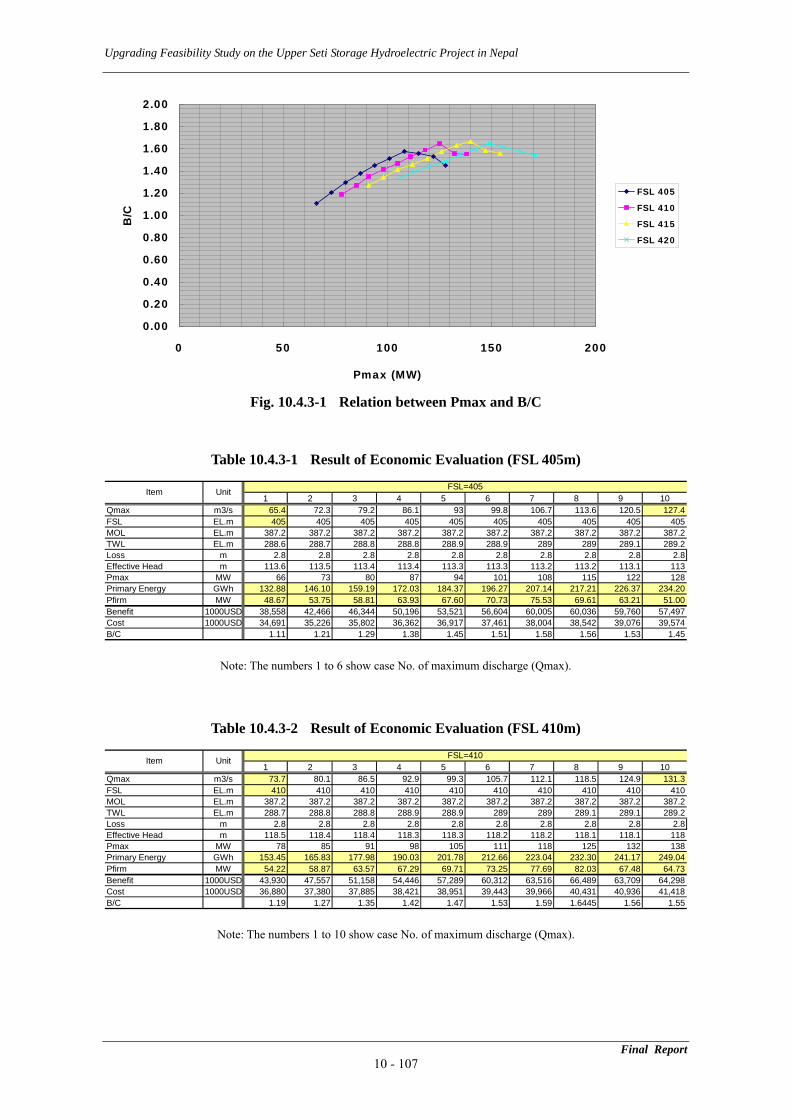
Upgrading Feasibility Study on the Upper Seti Storage Hydroelectric Project in Nepal
0.00
0.20
0.40
0.60
0.80
1.00
1.20
1.40
1.60
1.80
2.00
0 50 100 150 200
Pmax (MW)
B/C
FSL 405
FSL 410
FSL 415
FSL 420
Fig. 10.4.3-1 Relation between Pmax and B/C
Table 10.4.3-1 Result of Economic Evaluation (FSL 405m)
1 2 3 4 5 6 7 8 9 10Qmax m3/s 65.4 72.3 79.2 86.1 93 99.8 106.7 113.6 120.5 127.4FSL EL.m 405 405 405 405 405 405 405 405 405 405MOL EL.m 387.2 387.2 387.2 387.2 387.2 387.2 387.2 387.2 387.2 387.2TWL EL.m 288.6 288.7 288.8 288.8 288.9 288.9 289 289 289.1 289.2Loss m 2.8 2.8 2.8 2.8 2.8 2.8 2.8 2.8 2.8 2.8Effective Head m 113.6 113.5 113.4 113.4 113.3 113.3 113.2 113.2 113.1 113Pmax MW 66 73 80 87 94 101 108 115 122 128Primary Energy GWh 132.88 146.10 159.19 172.03 184.37 196.27 207.14 217.21 226.37 234.20Pfirm MW 48.67 53.75 58.81 63.93 67.60 70.73 75.53 69.61 63.21 51.00Benefit 1000USD 38,558 42,466 46,344 50,196 53,521 56,604 60,005 60,036 59,760 57,497Cost 1000USD 34,691 35,226 35,802 36,362 36,917 37,461 38,004 38,542 39,076 39,574B/C 1.11 1.21 1.29 1.38 1.45 1.51 1.58 1.56 1.53 1.45
Item Unit FSL=405
Note: The numbers 1 to 6 show case No. of maximum discharge (Qmax).
Table 10.4.3-2 Result of Economic Evaluation (FSL 410m)
1 2 3 4 5 6 7 8 9 10Qmax m3/s 73.7 80.1 86.5 92.9 99.3 105.7 112.1 118.5 124.9 131.3FSL EL.m 410 410 410 410 410 410 410 410 410 410MOL EL.m 387.2 387.2 387.2 387.2 387.2 387.2 387.2 387.2 387.2 387.2TWL EL.m 288.7 288.8 288.8 288.9 288.9 289 289 289.1 289.1 289.2Loss m 2.8 2.8 2.8 2.8 2.8 2.8 2.8 2.8 2.8 2.8Effective Head m 118.5 118.4 118.4 118.3 118.3 118.2 118.2 118.1 118.1 118Pmax MW 78 85 91 98 105 111 118 125 132 138Primary Energy GWh 153.45 165.83 177.98 190.03 201.78 212.66 223.04 232.30 241.17 249.04Pfirm MW 54.22 58.87 63.57 67.29 69.71 73.25 77.69 82.03 67.48 64.73Benefit 1000USD 43,930 47,557 51,158 54,446 57,289 60,312 63,516 66,489 63,709 64,298Cost 1000USD 36,880 37,380 37,885 38,421 38,951 39,443 39,966 40,431 40,936 41,418B/C 1.19 1.27 1.35 1.42 1.47 1.53 1.59 1.6445 1.56 1.55
Item Unit FSL=410
Note: The numbers 1 to 10 show case No. of maximum discharge (Qmax).
Final Report 10 - 107
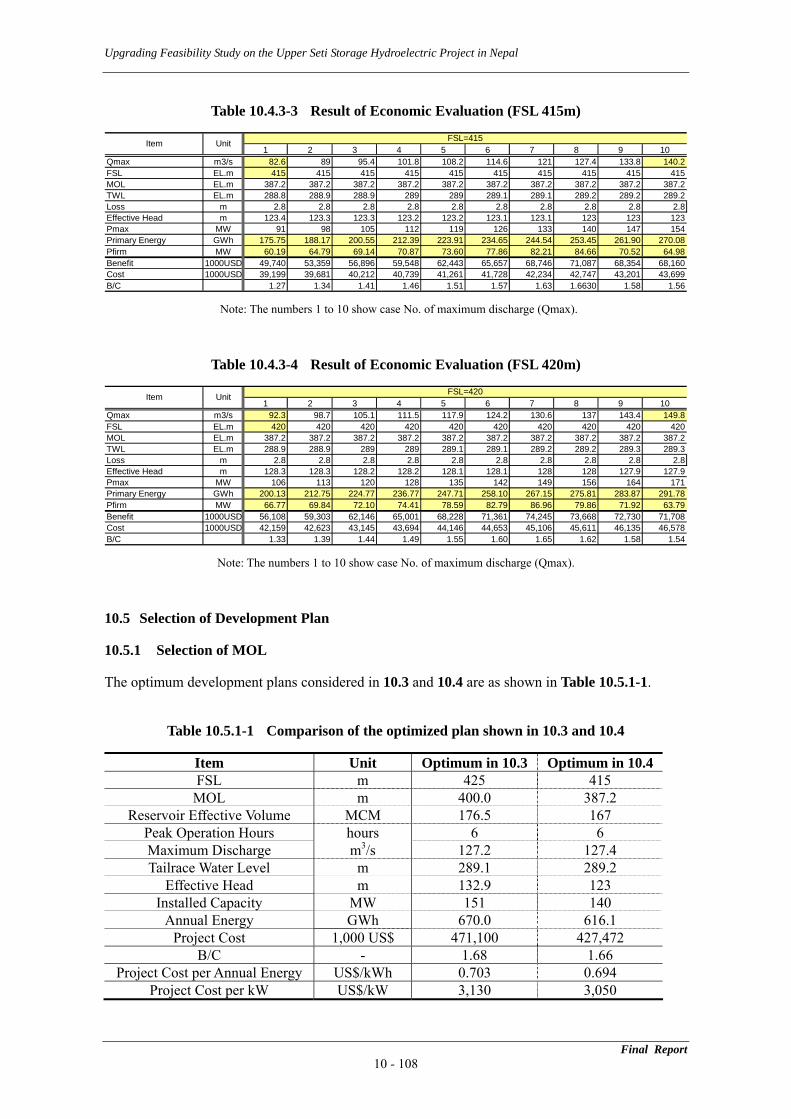
Upgrading Feasibility Study on the Upper Seti Storage Hydroelectric Project in Nepal
Table 10.4.3-3 Result of Economic Evaluation (FSL 415m)
1 2 3 4 5 6 7 8 9 10Qmax m3/s 82.6 89 95.4 101.8 108.2 114.6 121 127.4 133.8 140.2FSL EL.m 415 415 415 415 415 415 415 415 415 415MOL EL.m 387.2 387.2 387.2 387.2 387.2 387.2 387.2 387.2 387.2 387.2TWL EL.m 288.8 288.9 288.9 289 289 289.1 289.1 289.2 289.2 289.2Loss m 2.8 2.8 2.8 2.8 2.8 2.8 2.8 2.8 2.8 2.8Effective Head m 123.4 123.3 123.3 123.2 123.2 123.1 123.1 123 123 123Pmax MW 91 98 105 112 119 126 133 140 147 154Primary Energy GWh 175.75 188.17 200.55 212.39 223.91 234.65 244.54 253.45 261.90 270.08Pfirm MW 60.19 64.79 69.14 70.87 73.60 77.86 82.21 84.66 70.52 64.98Benefit 1000USD 49,740 53,359 56,896 59,548 62,443 65,657 68,746 71,087 68,354 68,160Cost 1000USD 39,199 39,681 40,212 40,739 41,261 41,728 42,234 42,747 43,201 43,699B/C 1.27 1.34 1.41 1.46 1.51 1.57 1.63 1.6630 1.58 1.56
Item Unit FSL=415
Note: The numbers 1 to 10 show case No. of maximum discharge (Qmax).
Table 10.4.3-4 Result of Economic Evaluation (FSL 420m)
1 2 3 4 5 6 7 8 9 10Qmax m3/s 92.3 98.7 105.1 111.5 117.9 124.2 130.6 137 143.4 149.8FSL EL.m 420 420 420 420 420 420 420 420 420 420MOL EL.m 387.2 387.2 387.2 387.2 387.2 387.2 387.2 387.2 387.2 387.2TWL EL.m 288.9 288.9 289 289 289.1 289.1 289.2 289.2 289.3 289.3Loss m 2.8 2.8 2.8 2.8 2.8 2.8 2.8 2.8 2.8 2.8Effective Head m 128.3 128.3 128.2 128.2 128.1 128.1 128 128 127.9 127.9Pmax MW 106 113 120 128 135 142 149 156 164 171Primary Energy GWh 200.13 212.75 224.77 236.77 247.71 258.10 267.15 275.81 283.87 291.78Pfirm MW 66.77 69.84 72.10 74.41 78.59 82.79 86.96 79.86 71.92 63.79Benefit 1000USD 56,108 59,303 62,146 65,001 68,228 71,361 74,245 73,668 72,730 71,708Cost 1000USD 42,159 42,623 43,145 43,694 44,146 44,653 45,106 45,611 46,135 46,578B/C 1.33 1.39 1.44 1.49 1.55 1.60 1.65 1.62 1.58 1.54
Item Unit FSL=420
Note: The numbers 1 to 10 show case No. of maximum discharge (Qmax).
10.5 Selection of Development Plan
10.5.1 Selection of MOL
The optimum development plans considered in 10.3 and 10.4 are as shown in Table 10.5.1-1.
Table 10.5.1-1 Comparison of the optimized plan shown in 10.3 and 10.4
Item Unit Optimum in 10.3 Optimum in 10.4 FSL m 425 415 MOL m 400.0 387.2
Reservoir Effective Volume MCM 176.5 167 Peak Operation Hours hours 6 6
m3/s Maximum Discharge 127.2 127.4 Tailrace Water Level m 289.1 289.2
Effective Head m 132.9 123 Installed Capacity MW 151 140
Annual Energy GWh 670.0 616.1 Project Cost 1,000 US$ 471,100 427,472
B/C - 1.68 1.66 Project Cost per Annual Energy US$/kWh 0.703 0.694
Project Cost per kW US$/kW 3,130 3,050
Final Report 10 - 108
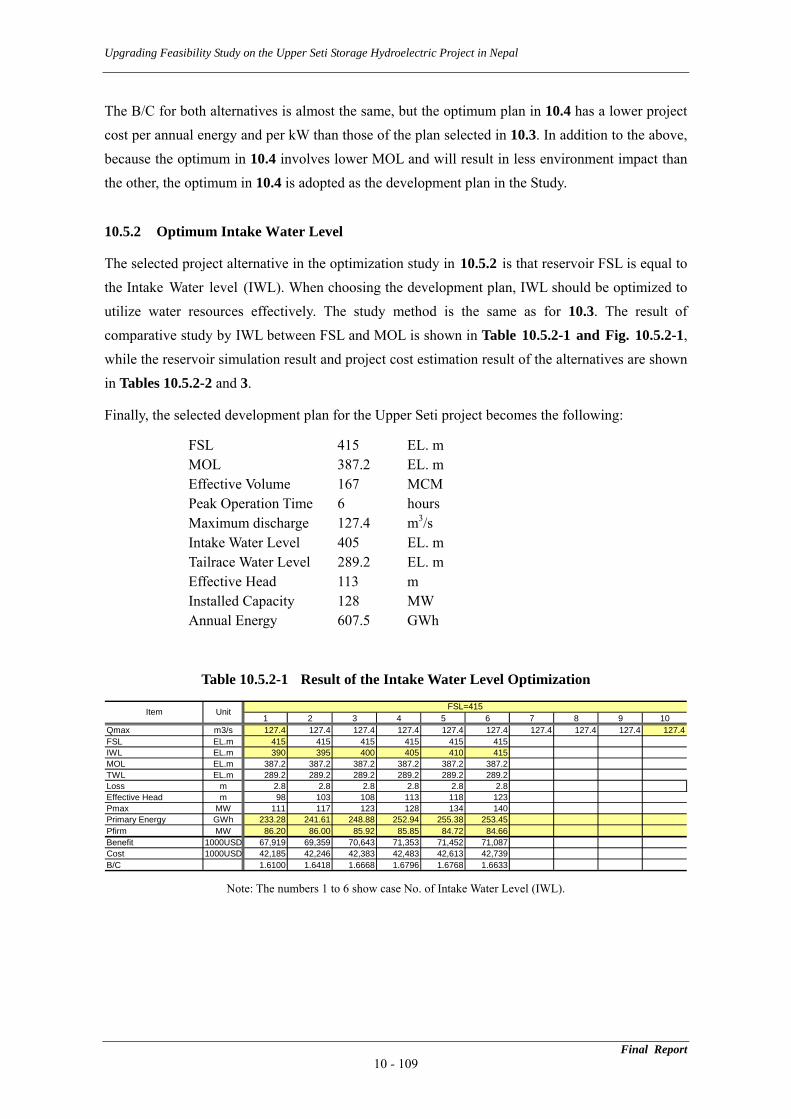
Upgrading Feasibility Study on the Upper Seti Storage Hydroelectric Project in Nepal
The B/C for both alternatives is almost the same, but the optimum plan in 10.4 has a lower project cost per annual energy and per kW than those of the plan selected in 10.3. In addition to the above, because the optimum in 10.4 involves lower MOL and will result in less environment impact than the other, the optimum in 10.4 is adopted as the development plan in the Study.
10.5.2 Optimum Intake Water Level
The selected project alternative in the optimization study in 10.5.2 is that reservoir FSL is equal to the Intake Water level (IWL). When choosing the development plan, IWL should be optimized to utilize water resources effectively. The study method is the same as for 10.3. The result of comparative study by IWL between FSL and MOL is shown in Table 10.5.2-1 and Fig. 10.5.2-1, while the reservoir simulation result and project cost estimation result of the alternatives are shown in Tables 10.5.2-2 and 3.
Finally, the selected development plan for the Upper Seti project becomes the following:
FSL 415 EL. m MOL 387.2 EL. m Effective Volume 167 MCM Peak Operation Time 6 hours
m3/s Maximum discharge 127.4 Intake Water Level 405 EL. m Tailrace Water Level 289.2 EL. m Effective Head 113 m Installed Capacity 128 MW Annual Energy 607.5 GWh
Table 10.5.2-1 Result of the Intake Water Level Optimization
1 2 3 4 5 6 7 8 9 10Qmax m3/s 127.4 127.4 127.4 127.4 127.4 127.4 127.4 127.4 127.4 127.4FSL EL.m 415 415 415 415 415 415IWL EL.m 390 395 400 405 410 415MOL EL.m 387.2 387.2 387.2 387.2 387.2 387.2TWL EL.m 289.2 289.2 289.2 289.2 289.2 289.2Loss m 2.8 2.8 2.8 2.8 2.8 2.8Effective Head m 98 103 108 113 118 123Pmax MW 111 117 123 128 134 140Primary Energy GWh 233.28 241.61 248.88 252.94 255.38 253.45Pfirm MW 86.20 86.00 85.92 85.85 84.72 84.66Benefit 1000USD 67,919 69,359 70,643 71,353 71,452 71,087Cost 1000USD 42,185 42,246 42,383 42,483 42,613 42,739B/C 1.6100 1.6418 1.6668 1.6796 1.6768 1.6633
Item Unit FSL=415
Note: The numbers 1 to 6 show case No. of Intake Water Level (IWL).
Final Report 10 - 109

Upgrading Feasibility Study on the Upper Seti Storage Hydroelectric Project in Nepal
385
390
395
400
405
410
415
420
1.6000 1.6100 1.6200 1.6300 1.6400 1.6500 1.6600 1.6700 1.6800 1.6900
B/C
IWL
(EL.
m)
Fig. 10.5.2-1 Optimization of the Intake Water Level
Table 10.5.2-2 Reservoir Simulation Result
No OutputFileName InputData Result
HWL IWL LWL TWLMAX.
DischargeInstalledCapacity
PrimaryEnergy(GWh)
Secondary
Energy(GWh)
TotalEnergy(GWh)
1 070104 415-8-1 output_.xls 415 390 387.20 289.20 127.40 111 0.951 86.200 233.280 339.980 573.2702 070104 415-8-2 output_.xls 415 395 387.20 289.20 127.40 117 0.951 86.000 241.610 345.870 587.4803 070104 415-8-3 output_.xls 415 400 387.20 289.20 127.40 123 0.951 85.920 248.880 351.570 600.4504 070104 415-8-4 output_.xls 415 405 387.20 289.20 127.40 128 0.951 85.850 252.940 354.590 607.5305 070104 415-8-5 output_.xls 415 410 387.20 289.20 127.40 134 0.951 84.720 255.380 356.650 612.0306 061219 415-8 output_.xls 415 415 387.20 289.20 127.40 140 0.951 84.660 253.450 362.670 616.120
Power (MW)
Table 10.5.2-3 Project Cost (IWL Alternatives for FSL 415m)
Project Cost Summary 1,000USD
1 2 3 4 5 6 7 8 9 101. Preparation & Compensation 3,548 3,541 3,545 3,548 3,552 3,555(1) Access Road(2) Conpensation(3) Others2. Environmental Mitigation 30,180 30,180 30,180 30,180 30,180 30,1803. Civil Works(1) River Treatment 6,053 6,053 6,053 6,053 6,053 6,053(2) Dam 117,131 117,131 117,131 117,131 117,131 117,131(3) Intake 2,131 2,131 2,131 2,131 2,131 2,131(4) Power Tunnel 10,672 10,672 10,672 10,672 10,672 10,672(5) Penstock 1,115 1,115 1,115 1,115 1,115 1,115(6) Power House 10,714 10,893 11,067 11,235 11,398 11,557(7) Tailrace Tunnel 2,311 2,311 2,311 2,311 2,311 2,311(8) Tailrace 558 558 558 558 558 558(9)P/S Access Tunnel 6,900 6,900 6,900 6,900 6,900 6,900(10) Surge Tank 10,689 10,689 10,689 10,689 10,689 10,689(11) Others 8,448 7,922 7,931 7,939 7,948 7,9564. Hydro-Mechanical Works 20,164 20,164 20,164 20,164 20,164 20,1645. Electro-Mechanical Works 40,451 41,208 41,939 42,424 43,114 43,7836. Transmission Line 10,170 10,170 10,170 10,170 10,170 10,170
Direct Cost 281,235 281,639 282,556 283,221 284,086 284,9257. Administration Fee 42,185 42,246 42,383 42,483 42,613 42,7398. Contingency 28,124 28,164 28,256 28,322 28,409 28,4929. Interest During Construction 70,309 70,410 70,639 70,805 71,021 71,231
Total 421,853 422,459 423,833 424,831 426,129 427,387
Item FSL=415
Note: The numbers 1 to 6 correspond to case No. of IWL (Intake Water Level) in Table 10.5.2-2.
Final Report 10 - 110