1010101010101010101010101010 achieving … · aussi disponible en français sous le titre : ......
TRANSCRIPT
10101010101010101010101010101010101010101010
O10101010101010101010101010101010101010101010101010101010
10101010101010101010101010101010101010101010
Energy Management Information Systems
A C H I E V I N G I M P R O V E D E N E R G Y E F F I C I E N C Y
A handbook for managers, engineers and operational staff

i
Published by the Office of Energy Efficiency of Natural Resources Canada
Co-authored by James H. HookeByron J. Landry, P.Eng.David Hart, M.A., C.Eng.
Funded by Natural Resources Canada, Union Gas Limited, Enbridge Gas Distribution
CEATI – End-Use Technologies Interest Group(BC Hydro, Manitoba Hydro, Hydro-Québec, Pulp and Paper Research Institute of Canada, New York State Electric & Gas Corporation)
2003
DisclaimerThe views and ideas expressed in this handbook are those of the authors and do not necessarily reflect the views and policies of the funding organizations. The generic opportunities presented herein do not represent recommendations for implementing them at a specific site. Before modifying any equipment or operating procedures, consult qualified professionals and conduct a detailed site evaluation.
Library and Archives Canada Cataloguing in PublicationMain entry under title:
Energy management information systems: achieving improved energy efficiency: a handbook for managers, engineers and operational staff
Aussi disponible en français sous le titre : Systèmes d’information sur la gestion de l’énergie.
ISBN 0-662-38024-X Cat. no. M144-54/2004E
1. Information storage and retrieval systems – Power resources.2. Energy conservation – Handbooks, manuals, etc.3. Energy auditing – Handbooks, manuals, etc.I. Canada. Office of Energy Efficiency.
TJ163.3E53 2004 025.06'33379 C2004-980297-6
© Her Majesty the Queen in Right of Canada, 2004
Recycled paper

010101010101010101010101
Energy Management Information Systemsii
10101010101010101010010101010101010101010101
Contents iii
10101010101010101010010101010101010101010101Contents
1 Preface 1
2 What Is an Energy Management Information System? 5
Overview 5
2.1 What Is an EMIS? 7
2.2 Energy Management Programs and the EMIS 7
2.3 What Does an EMIS Deliver? 92.3.1 Early Detection of Poor Performance 92.3.2 Support for Decision Making 132.3.3 Effective Performance Reporting 152.3.4 Auditing of Historical Operations 172.3.5 Identification and Justification of Energy Projects 182.3.6 Evidence of Success 192.3.7 Support for Energy Budgeting and Management Accounting 192.3.8 Energy Data to Other Systems 20
2.4 What Are the Elements of an EMIS? 20
2.5 Solutions for Different Circumstances 21
3 What Makes an EMIS Successful? 23
Overview 23
3.1 Elements of Success 243.1.1 Management’s Understanding and Commitment 243.1.2 Company Policies, Directives and Organization 243.1.3 Program Responsibilities 253.1.4 Procedures and Systems 253.1.5 Project Selection and Focus 253.1.6 Approved Budget 263.1.7 Approved Investment Criteria 263.1.8 Training 263.1.9 Integrated Information Systems 263.1.10 Reports on Savings Achieved 263.1.11 Motivation 273.1.12 Marketing 27
01
Energy Management Information Systemsiv
3.2 Evaluation 27
4. Real-Time Data Is Required 29
5. How Can Action Ensure Improvements? 31
Overview 31
5.1 Who Should Take Action? 31
5.2 What Is Needed to Take Action? 325.2.1 Energy Data 325.2.2 Targets 325.2.3 Reports 335.2.4 Training 335.2.5 Decision Support 345.2.6 Audited Success 345.2.7 Motivation and Recognition 345.2.8 Benchmarking and Best Practices 34
6 How Is an Effective EMIS Designed and Justified? 37
Overview 37
6.1 Creating a Vision of an Effective EMIS 376.1.1 Address Site Needs 376.1.2 Usefulness of the System 37
6.2 Beginning Design: Consider Measurement Issues 38
6.3 The Next Step: Consider Integration Into Existing Systems 39
6.4 Prepare a Supporting Case: Cost/Benefit 40
6.5 Obtaining Support From Decision-Makers 41
6.6 Designing and Implementing an EMIS: A Checklist 42
7 Effective Energy Reporting 45
Overview 45
7.1 What Is an Effective Report? 47
7.2 Who Requires Energy Reports? 48 7.2.1 Executives 487.2.2 Operations Management 497.2.3 Operations Personnel 497.2.4 Engineering 517.2.5 Accounts 517.2.6 Energy and Environmental Managers 517.2.7 External Advisors 52
7.3 A Staged Approach 52
101010101010101010100101010101010101
Contents v
8 Energy Data Analysis 53
Overview 53
8.1 What Is Energy Data? 55
8.2 Objectives of Energy Data Analysis 56
8.3 Breakdown of Energy Use and Costs 56
8.4 Calculation of Performance Indicators 59
8.5 Understanding Performance Variability: Simpler Techniques 59
8.6 Understanding Performance Variability: Data Mining 62
8.7 Calculating Targets 68
8.8 Data Modelling and “What If” Analysis 71
9 Metering and Measurement 73
Overview 73
9.1 Introduction 74
9.2 The Need for Metering 74
9.3 Deciding Where to Locate Meters and Sensors 759.3.1 Step 1: Review Existing Site Plans 769.3.2 Step 2: Develop a Meter List 769.3.3 Step 3: Assign Energy Accountability Centres 769.3.4 Step 4: Decide on Additional Metering or Measurement 77
9.4 Deciding on What Types of Metering to Use and Practical Considerations 789.4.1 Electrical Metering 789.4.2 Natural Gas Metering 799.4.3 Steam Metering 809.4.4 Water and Condensate Metering 829.4.5 Compressed-Air Metering 829.4.6 Data Loggers 83
9.5 Linking Meters to Monitoring Systems 83
9.6 Cost Considerations 84
9.7 Concluding Remarks 85
10 Do You Have an Effective EMIS? A Checklist 87
Appendix A: Abbreviations 91
Appendix B: Figures and Tables 92
10101010101010101010010101010101010101010101010101010101

010101010101010101010101
Energy Management Information Systemsvi
1010101010101010100101010101

Preface 1
1010101010101010101001010101010101010101010101Preface
The Kyoto Protocol requires Canada to reduce its greenhouse gas emissions by 6 percentbelow 1990 levels by 2008–2012. This, in addition to rising energy costs and deregulationin the electricity and gas industry, has once again provided new impetus for companiesto improve their energy use efficiency in order to reduce operating costs, increase profitsand reduce greenhouse gas emissions that contribute to climate change.
This handbook, written for all levels of management and operational staff, aims to give a structured and practical understanding of an Energy Management InformationSystem (EMIS) and to serve as an instruction guide for its implementation. Because it covers all aspects of an EMIS – including metering, data collection, data analysis,reporting and cost/benefit analyses – this handbook is an integral part of a company’sEnergy Management Program (EMP). The authors present state-of-the-art techniquescoupled with their own experience and technical input from this handbook’s sponsoringorganizations: Natural Resources Canada, Union Gas Limited, Enbridge Gas Distribution andCEATI – End-Use Technologies Interest Group (BC Hydro, Manitoba Hydro, Hydro-Québec,the Pulp and Paper Research Institute of Canada and New York State Electric & GasCorporation).
There are vast opportunities to improve energy use efficiency by eliminating wastethrough process optimization. Applying today’s computing and control equipment andtechniques is one of the most cost-effective and significant opportunities for largerenergy users to reduce their energy costs and improve profits.
In his widely acclaimed book Megatrends (1982),John Naisbitt states, “Computer technology is to the information age what mechanization was to theindustrial revolution.” This insight has proven to beextremely accurate. Modern computing and controltechniques, particularly in larger companies, areamong the most cost-effective and significant toolswith which industrial and commercial facilities canimprove energy use efficiency.
Today it is normal for companies, particularly in process sectors, to collect hugeamounts of real-time data from automated control systems, including ProgrammableLogic Controllers (PLCs), Supervisory Control and Data Acquisition (SCADA), etc. In addition, a host of other computerized systems and associated databases are maintained at the corporate and/or managerial level. Integrated computer systemsare commonly used to enhance performance in most facets of business, including
“Computer technology is to the information age what
mechanization was to the industrial revolution.”
– JOHN NAISBITT

Energy Management Information Systems2
finance and accounts, personnel, stock control, sales and marketing, production andscheduling, resource planning, asset management, maintenance planning, process control and monitoring, design, training and other areas.
However, unless this captured data is shared and analysed in an orderly and precise way that identifies problem areas and provides solutions, this mass of data is merely informationoverload.
Data is not knowledge! Knowledge is information learned from patterns in data, and it follows that there must be the capacity and ability to convert information intoknowledge in order to make sound energy-related business decisions. This is key in any management function. In many businesses it is often difficult to comprehensivelyanalyse total energy use. Patterns of energy use are very complex, particularly inprocess industries where it is difficult to understand what causes energy use to rise and fall, especially when production rates are highly variable, when the product mixvaries, or when there are several interacting processes at a single site. It is vital, however, for managers to be able to decipher this information in order to make goodenergy and business decisions.
Advances in information technology (IT), defined here as the use of computers to collect, analyse, control and distribute data, have developed rapidly. It is now commonfor managers and operators to have access to powerful computers and software. Todaythere are a number of techniques to analyse the factors that affect efficiency, andmodels are automatically generated based on “what if” scenarios in order to improvedecisions to be taken.
In the 1980s, the Canadian Industry Program for Energy Conservation (CIPEC) developedtwo versions of an energy accounting manual (basic and advanced) to help Canadianorganizations in the industrial, commercial and institutional sectors design and imple-ment energy-accounting systems that were capable of monitoring energy productivityand performance. A 1989 revision of these manuals, still available from the Office ofEnergy Efficiency of Natural Resources Canada, discusses the fundamentals of energyaccounting and provides a standard format that can be applied to single- and multi-unitorganizations. The manual has been referred to as a first-generation energy managementtool for businesses and other organizations.
In the 1990s, the UK Office of Energy Efficiency developed the first recognized energymanagement system, called Monitoring and Targeting (M&T). Based on the same funda-mentals as CIPEC’s energy accounting manual, it took full advantage of the increaseduse of computers and was the first automated energy management system. In the fieldof energy management, it was known as the second-generation energy management tool.
Both approaches, however, tend to focus exclusively on energy, with varying degrees of success. Most of the initiatives relate to low- or no-cost projects and seldom lookbeyond HVAC systems (set-points), compressors (air leaks) and similar actions for
10101010101010010101010101010101010101
Unanalysed data is information overload.

Preface 3
potential savings. Many businesses are unaware of opportunities for increasing energyuse efficiency because there has been no in-depth analysis of credible and shared datathat will identify profitable energy use efficiency improvements. As a general yardstick,most companies must sell $10 worth of product to realize a profit of $1. Conversely,every $1,000 saved by eliminating waste and improving energy use efficiency is theequivalent of an additional $10,000 in sales.
Recognizing the proliferation of computerized systems and the potential that databasesoffer, the consortium members (see inside cover) supported the development of thishandbook. Its goal is to identify what a company needs in order to develop an EMISand what it should do to get there.
This handbook is structured to allow each level of staff within an organization to referto sections that are specifically pertinent to them, but the authors recommend that alllevels of management read the entire handbook.
The authors have been part of the groups thatdeveloped and implemented the EMIS examplesdescribed in this handbook, and their practicalapplication of proven information reflects theauthors’ underlying theme that energy is a variableoperating cost, not a fixed overhead charge.
101010101010101010100101010101010101010101010101
Energy is a variable operating cost, not a fixed
overhead charge.

010101010101010101010101
Energy Management Information Systems4
10101010101010101010010101010101010101010101
What Is an Energy Management Information System? 5
10101010101010101010010101010101010101010101What Is an Energy Management Information System?
Overview
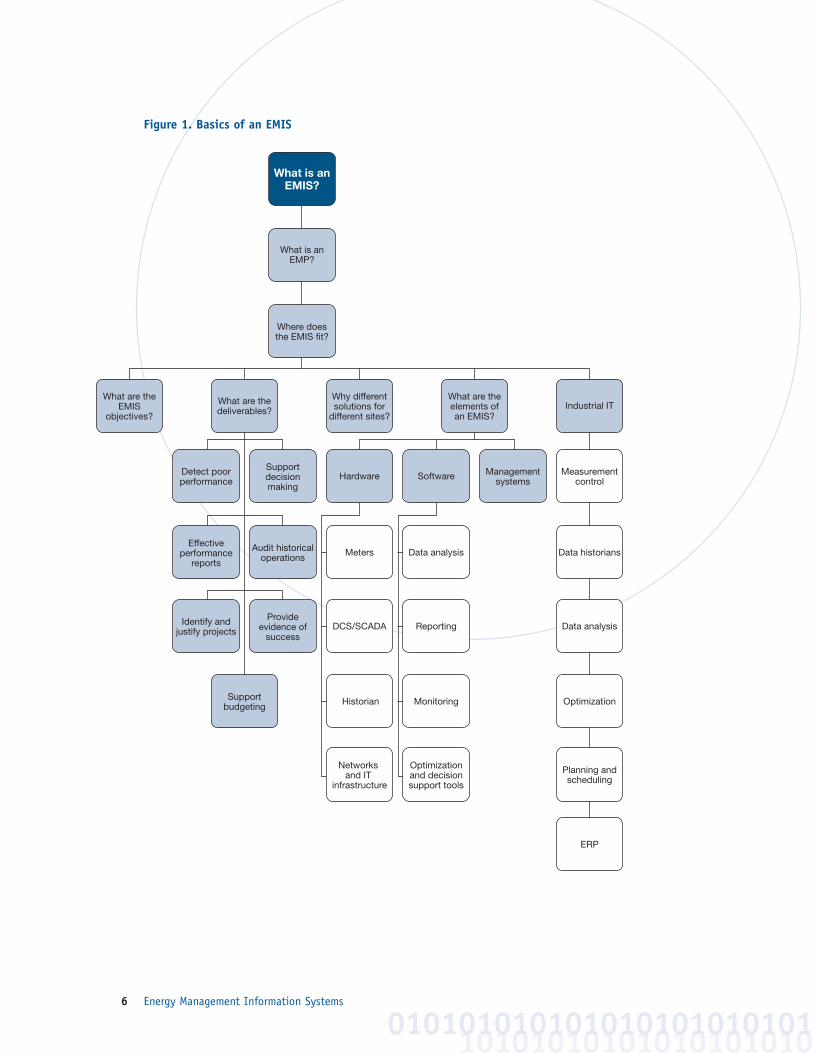
An Energy Management Information System (EMIS) is an important element of a comprehensive energy management program. It provides relevant information to keyindividuals and departments that enables them to improve energy performance.
An EMIS can be characterized by its deliverables, features, elements and support.Deliverables include the early detection of poor performance, support for decision making and effective energy reporting. Features of an EMIS include the storage of datain a usable format, the calculation of effective targets for energy use, and comparisonof actual consumption with these targets. Elements include sensors, energy meters,hardware and software (these may already exist as process and business performancemonitoring systems). Essential support includes management commitment, the allocationof responsibility, procedures, training, resources and regular audits.
This section outlines what constitutes an effective EMIS. The checklist in Section 10will help determine whether a proposed or existing EMIS will succeed. Questionsaddressed in this section are summarized in Figure 1.
02
Energy Management Information Systems6
Figure 1. Basics of an EMIS
10101010101010101010010101010101010101010101
What are the deliverables?
Detect poor performance
Effective performance
reports
Audit historical operations Meters Data analysis Data historians
Identify and justify projects
Provide evidence of
successDCS/SCADA Reporting Data analysis
Support budgeting Historian Monitoring Optimization
Networks and IT
infrastructure
Optimization and decision support tools
Planning and scheduling
ERP
Support decision making
Where does the EMIS fit?
What is an EMP?
What is an EMIS?
Hardware Software Management systems
Measurement control
Why different solutions for
different sites?
What are the elements of an EMIS?
Industrial ITWhat are the
EMIS objectives?
What Is an Energy Management Information System? 7
2.1 What Is an EMIS?
An EMIS provides information to appropriate personnel within an organization to help them manage energy use and costs. The exact nature of the EMIS will depend on
• the particular site• the processes and plant involved• the cost of energy (in relation to other costs) • existing meters and instruments• monitoring and control systems• the data historian • data analysis and reporting systems• existing management systems
In this handbook, an EMIS is defined principally in terms of what it delivers to theorganization; how the deliverables are achieved is secondary.
Over the years, EMISs have been implemented with varying levels of success and sustainability. The checklist in Section 10 outlines what constitutes an effective EMIS,i.e., one that will reduce energy costs by at least 5 percent and sustain that improvedperformance. Readers should ensure that their proposed or existing EMIS meets theserequirements (examine each of the items in the checklist).
This handbook discusses the components in the checklist in some detail, and we stronglysuggest that readers revisit the checklist once they have studied this handbook.
2.2 Energy Management Programs and the EMIS
An Energy Management Information System (EMIS) is only one element of a compre-hensive energy management program (EMP), albeit an important one without which full benefits will not be achieved and sustained. A good EMIS should reduce energy use (and cost) by at least 5 percent.
Actions that generally need to be taken in order to address energy use in an EMP mayinclude one or more of the following:
• developing and approving an energy policy and strategy• training and actions to raise knowledge and awareness• energy audits to identify and evaluate opportunities• developing and implementing improvement opportunities• implementing performance management systems, including the EMIS
101010101010101010100101010101010101010101010101
Energy Management Information Systems8
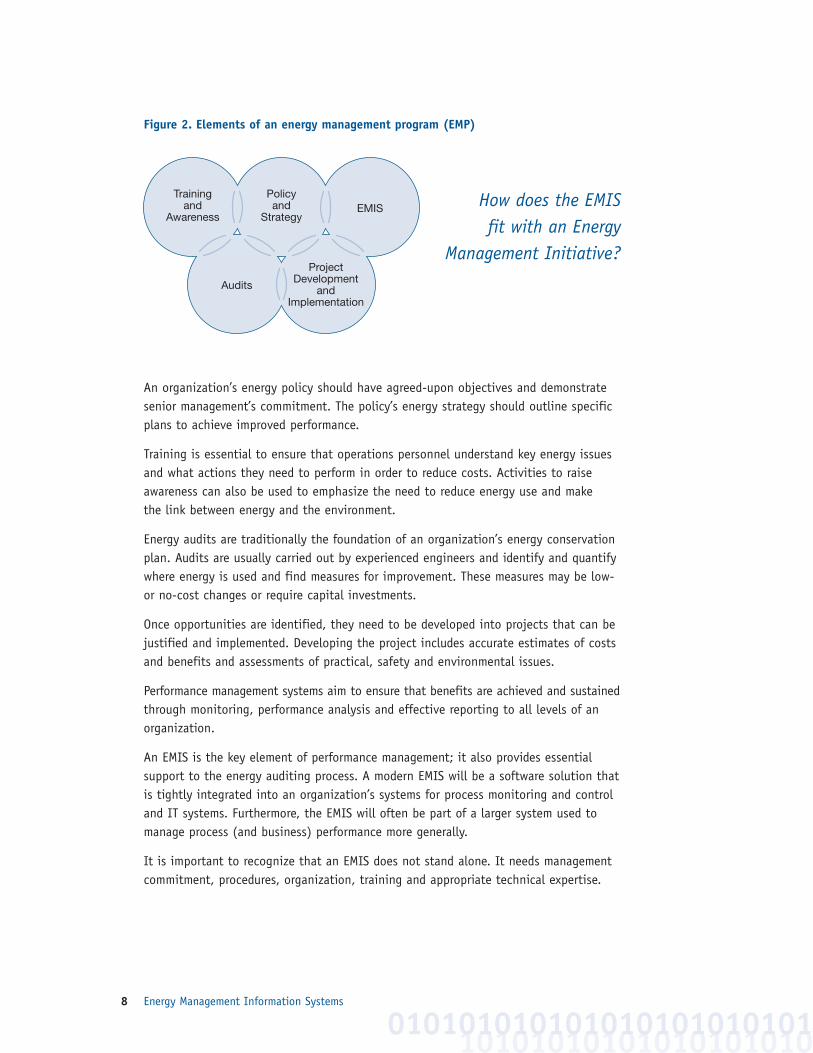
Figure 2. Elements of an energy management program (EMP)
An organization’s energy policy should have agreed-upon objectives and demonstratesenior management’s commitment. The policy’s energy strategy should outline specificplans to achieve improved performance.
Training is essential to ensure that operations personnel understand key energy issuesand what actions they need to perform in order to reduce costs. Activities to raiseawareness can also be used to emphasize the need to reduce energy use and make the link between energy and the environment.
Energy audits are traditionally the foundation of an organization’s energy conservationplan. Audits are usually carried out by experienced engineers and identify and quantifywhere energy is used and find measures for improvement. These measures may be low-or no-cost changes or require capital investments.
Once opportunities are identified, they need to be developed into projects that can bejustified and implemented. Developing the project includes accurate estimates of costsand benefits and assessments of practical, safety and environmental issues.
Performance management systems aim to ensure that benefits are achieved and sustainedthrough monitoring, performance analysis and effective reporting to all levels of anorganization.
An EMIS is the key element of performance management; it also provides essential support to the energy auditing process. A modern EMIS will be a software solution thatis tightly integrated into an organization’s systems for process monitoring and controland IT systems. Furthermore, the EMIS will often be part of a larger system used tomanage process (and business) performance more generally.
It is important to recognize that an EMIS does not stand alone. It needs managementcommitment, procedures, organization, training and appropriate technical expertise.
10101010101010101010010101010101010101010101
Training and
AwarenessEMIS
Policy and
Strategy
Audits
Project Development
and Implementation
How does the EMIS fit with an Energy
Management Initiative?
What Is an Energy Management Information System? 9
2.3 What Does an EMIS Deliver?
The principal objective of an EMIS is to support an organization’s energy managementprogram. Its specific deliverables are as follows:
2.3.1 Early detection of poor performance 2.3.2 Support for decision making2.3.3 Effective performance reporting2.3.4 Auditing of historical operations2.3.5 Identification and justification of energy projects2.3.6 Evidence of success2.3.7 Support for energy budgeting and management accounting2.3.8 Energy data to other systems
Understanding what an EMIS can deliver is vital if an effective systemis to be designed and implemented. Based on the following discussion,readers should be able to specify the requirements of an EMIS fortheir particular site.
2.3.1 Early Detection of Poor Performance
A key deliverable of an EMIS is that it will identify poor operations quickly and effectively. Examples are:
• incorrect control set-points• equipment left operating unnecessarily• faults with equipment, for example, heat exchanger fouling, air in refrigeration
condensers, etc.
Such faults should be identified as quickly as possible and corrected with practical andcost-effective solutions. It is not sufficient to detect a problem that has occurred inthe past (for example, last week) that cannot now be rectified because too much timehas elapsed and operations have moved on to a new “mode.”
Comparing actual performance with targets generally identifies poor performance. A deviation from the target causes an alert. Performance indicators include energy consumption, but can also include measures of efficiency and indirect indicators of performance (for example, the oxygen level in a boiler’s exhaust).
Targets can be defined in a number of ways, all of which can be usefully applied. Examples are:
• the performance typically achieved by the process in the past – current and future performance can be measured against this todemonstrate progress (benchmark)
• the best performance that the process could achieve or has achieved in the past (best practice)
• a desired level of performance, for example, 5 percent below the benchmark (reduction)• budget performance (budget)
10101010101010101010101010101001010101010101010101010101
Specify what theEMIS will deliver.
Comparing actual performance with targets identifies
poor performance.
Energy Management Information Systems10
Key to success is that targets are sound, taking full account of relevant influencing factors. This is discussed in detail in Section 8.
The frequency of performance monitoring will vary depending on the application. In a complex process that uses a lot of energy, reporting every 15 minutes may beappropriate, especially where the operator can make process changes in response to performance alerts. On the other hand, an EMIS associated with a central refrigerationunit, for example, may report only daily or weekly because faults are likely to be slowto develop and be rectified only through maintenance actions (for example, condensercleaning, refrigerant charging, etc.).
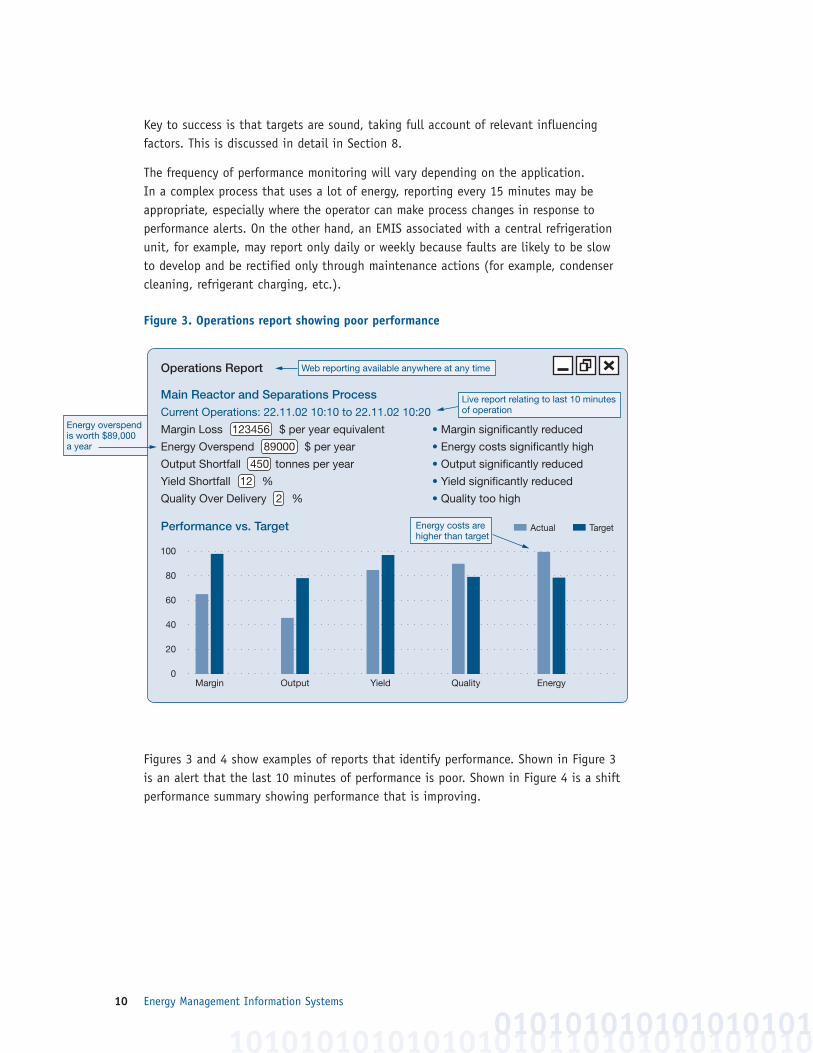
Figure 3. Operations report showing poor performance
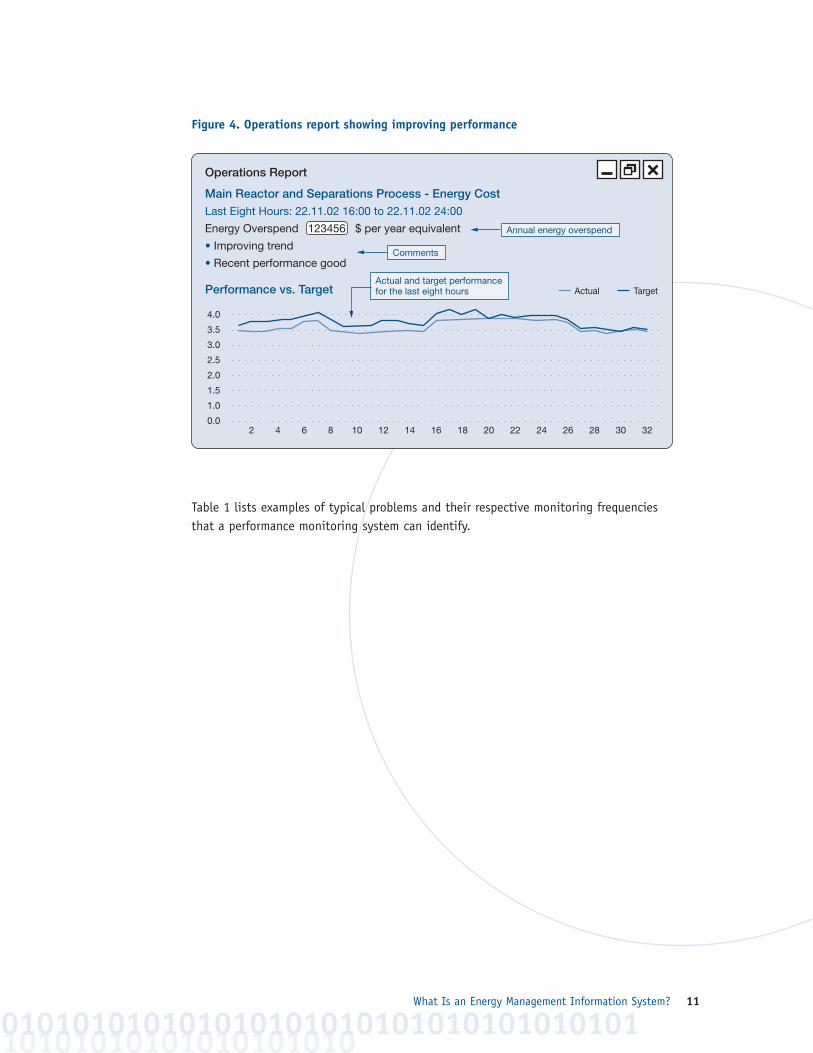
Figures 3 and 4 show examples of reports that identify performance. Shown in Figure 3is an alert that the last 10 minutes of performance is poor. Shown in Figure 4 is a shiftperformance summary showing performance that is improving.
101010101010101010110101010101010010101010101010101
Operations Report
Main Reactor and Separations ProcessCurrent Operations: 22.11.02 10:10 to 22.11.02 10:20
Margin Loss 123456 $ per year equivalent • Margin significantly reduced
Energy Overspend 89000 $ per year • Energy costs significantly high
Output Shortfall 450 tonnes per year • Output significantly reduced
Yield Shortfall 12 % • Yield significantly reduced
Quality Over Delivery 2 % • Quality too high
Performance vs. Target
0
20
40
60
80
100
Margin Output Yield Quality Energy
Actual Target
Live report relating to last 10 minutes of operation
Energy costs are higher than target
Energy overspend is worth $89,000 a year
Web reporting available anywhere at any time
What Is an Energy Management Information System? 11
Figure 4. Operations report showing improving performance
Table 1 lists examples of typical problems and their respective monitoring frequenciesthat a performance monitoring system can identify.
10101010101010101010010101010101010101010101010101010101
Operations Report
Main Reactor and Separations Process - Energy CostLast Eight Hours: 22.11.02 16:00 to 22.11.02 24:00
Energy Overspend 123456 $ per year equivalent
• Improving trend
• Recent performance good
Performance vs. Target
0.0
4.0
3.5
3.0
2.5
2.0
1.5
1.0
Actual Target
2 4 6 8 10 12 14 16 18 20 22 24 26 28 30 32
Actual and target performance for the last eight hours
Annual energy overspend
Comments

Energy Management Information Systems12
Table 1. Examples of typical problems that cause higher energy costs
Typical Problems Monitoring Frequency*
. . . . . . . . . . . . . . . . . . . . . . . . . . . . . . . . . . . . . . . . . . . . . . . . . . . . . . . . . . . . . . . . . . . . . . . . . .
Process Operations
• incorrect set-points hourly• fouled heat exchangers daily• advanced controls switched off hourly• poor control timing hourly
. . . . . . . . . . . . . . . . . . . . . . . . . . . . . . . . . . . . . . . . . . . . . . . . . . . . . . . . . . . . . . . . . . . . . . . . . .
Boilers
• poor air-fuel ratio hourly• fouled exchangers daily• excessive blow-down hourly• incorrect boiler selection hourly
. . . . . . . . . . . . . . . . . . . . . . . . . . . . . . . . . . . . . . . . . . . . . . . . . . . . . . . . . . . . . . . . . . . . . . . . . .
Refrigeration
• fouled condenser daily• air in condenser daily• incorrect superheat settings daily• high head pressure settings daily• incorrect compressor selection hourly
. . . . . . . . . . . . . . . . . . . . . . . . . . . . . . . . . . . . . . . . . . . . . . . . . . . . . . . . . . . . . . . . . . . . . . . . . .
Compressed Air
• leaks daily• poor compressor control daily/hourly• incorrect pressure hourly
. . . . . . . . . . . . . . . . . . . . . . . . . . . . . . . . . . . . . . . . . . . . . . . . . . . . . . . . . . . . . . . . . . . . . . . . . .
Steam
• leaks hourly• failed traps hourly• poor isolation hourly• incorrect set-points hourly• low condensate return hourly
. . . . . . . . . . . . . . . . . . . . . . . . . . . . . . . . . . . . . . . . . . . . . . . . . . . . . . . . . . . . . . . . . . . . . . . . . .
Space Heating/Cooling
• excessive space temperature hourly• excessive fan power use hourly• overcooling hourly• heating and cooling hourly• high chilled water temperature hourly
. . . . . . . . . . . . . . . . . . . . . . . . . . . . . . . . . . . . . . . . . . . . . . . . . . . . . . . . . . . . . . . . . . . . . . . . . .
Power Generation
• poor engine performance hourly• incorrect control settings hourly• poor cooling tower operation hourly• fouled heat exchangers hourly
. . . . . . . . . . . . . . . . . . . . . . . . . . . . . . . . . . . . . . . . . . . . . . . . . . . . . . . . . . . . . . . . . . . . . . . . . .
* Appropriate monitoring frequency depends on the application.
101010101010101010010101010101010101010101
What Is an Energy Management Information System? 13
2.3.2 Support for Decision Making
Often, alerting operational personnel and management to poor performance is enoughto solve a problem. Such personnel may be experienced enough to understand the reasons for higher energy use and take appropriate remedial action. On the other hand,they may not have the needed experience or sufficient time to conduct an analysis.
Where there is a difficulty in deciding how to act on a problem, decision support systems should be considered as part of an EMIS. Such systems provide supportinginformation and can take several forms, from guides and charts to sophisticated computer systems.
The “knowledge” within these decision systems can be either• from experts (expert systems, or knowledge-based systems); or • learned from operating data (data mining).
The more complex and energy intensive the process, the more likely a decision supportsystem can be justified.
101010101010101010100101010101010101010101010101010101
Energy Management Information Systems14
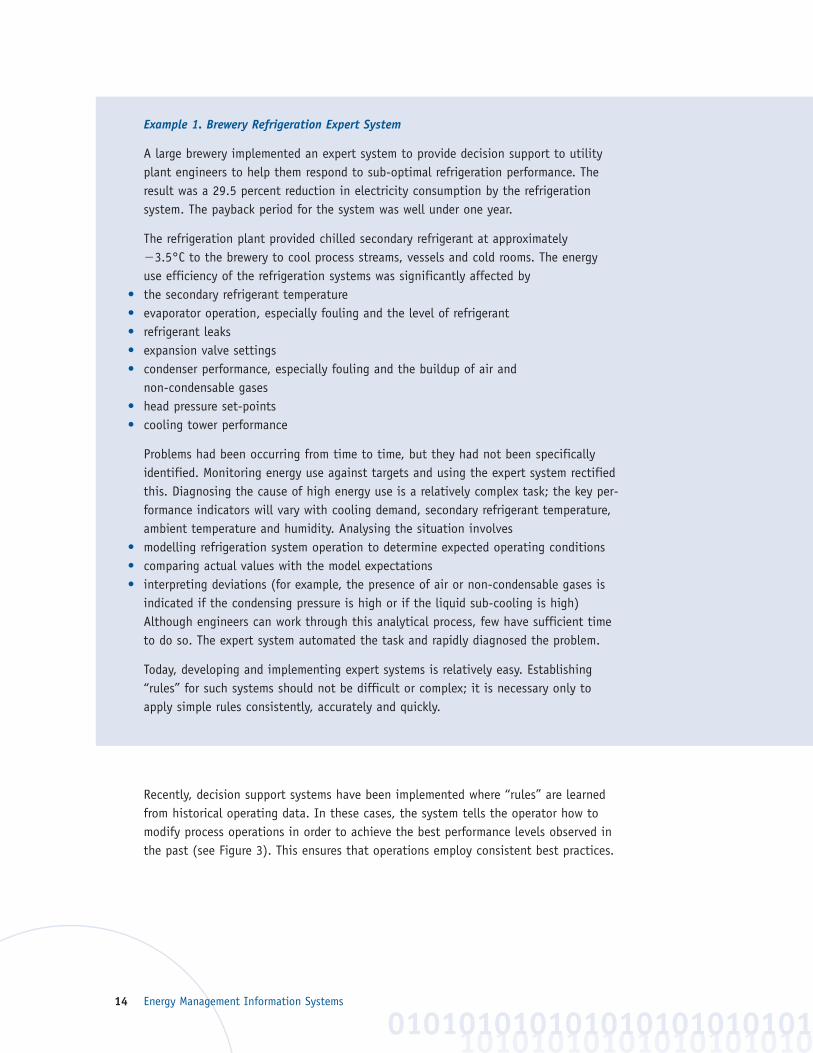
Example 1. Brewery Refrigeration Expert System
A large brewery implemented an expert system to provide decision support to utilityplant engineers to help them respond to sub-optimal refrigeration performance. Theresult was a 29.5 percent reduction in electricity consumption by the refrigeration system. The payback period for the system was well under one year.
The refrigeration plant provided chilled secondary refrigerant at approximately 23.5°C to the brewery to cool process streams, vessels and cold rooms. The energy use efficiency of the refrigeration systems was significantly affected by
• the secondary refrigerant temperature• evaporator operation, especially fouling and the level of refrigerant• refrigerant leaks• expansion valve settings• condenser performance, especially fouling and the buildup of air and
non-condensable gases• head pressure set-points• cooling tower performance
Problems had been occurring from time to time, but they had not been specificallyidentified. Monitoring energy use against targets and using the expert system rectifiedthis. Diagnosing the cause of high energy use is a relatively complex task; the key per-formance indicators will vary with cooling demand, secondary refrigerant temperature,ambient temperature and humidity. Analysing the situation involves
• modelling refrigeration system operation to determine expected operating conditions• comparing actual values with the model expectations• interpreting deviations (for example, the presence of air or non-condensable gases is
indicated if the condensing pressure is high or if the liquid sub-cooling is high)Although engineers can work through this analytical process, few have sufficient timeto do so. The expert system automated the task and rapidly diagnosed the problem.
Today, developing and implementing expert systems is relatively easy. Establishing“rules” for such systems should not be difficult or complex; it is necessary only toapply simple rules consistently, accurately and quickly.
Recently, decision support systems have been implemented where “rules” are learnedfrom historical operating data. In these cases, the system tells the operator how tomodify process operations in order to achieve the best performance levels observed inthe past (see Figure 3). This ensures that operations employ consistent best practices.
10101010101010101010010101010101010101010101
What Is an Energy Management Information System? 15
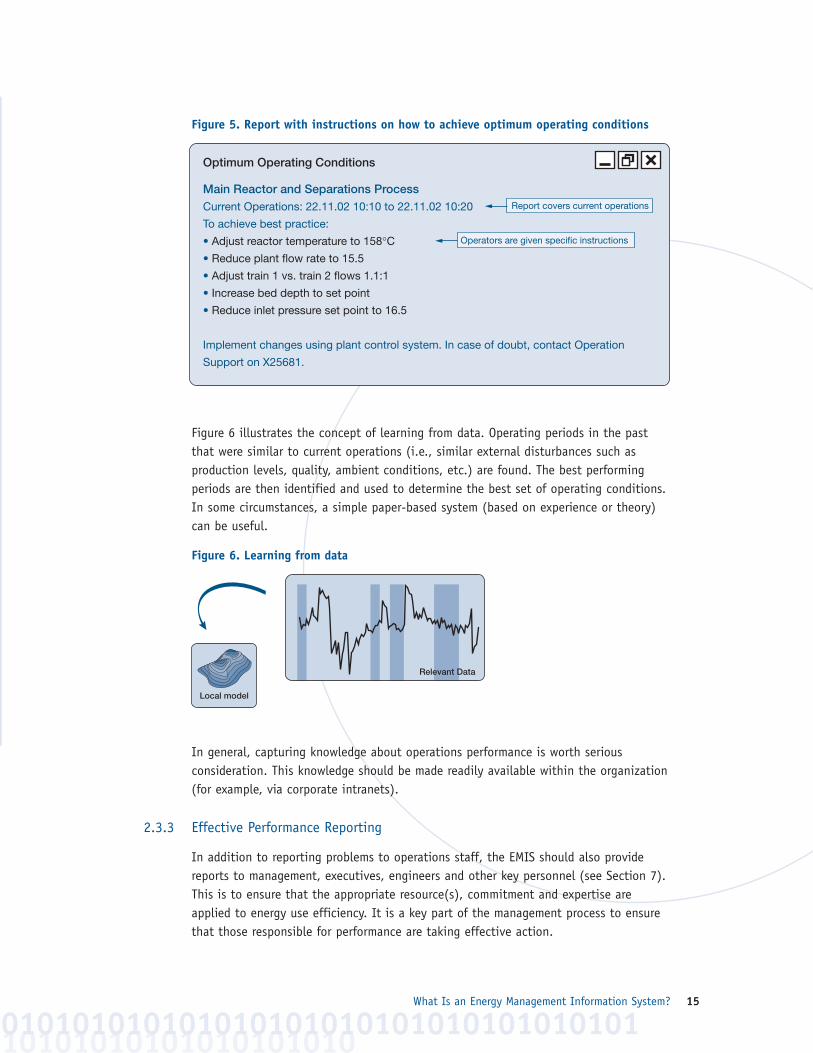
Figure 5. Report with instructions on how to achieve optimum operating conditions
Figure 6 illustrates the concept of learning from data. Operating periods in the pastthat were similar to current operations (i.e., similar external disturbances such as production levels, quality, ambient conditions, etc.) are found. The best performingperiods are then identified and used to determine the best set of operating conditions.In some circumstances, a simple paper-based system (based on experience or theory)can be useful.
Figure 6. Learning from data
In general, capturing knowledge about operations performance is worth serious consideration. This knowledge should be made readily available within the organization(for example, via corporate intranets).
2.3.3 Effective Performance Reporting
In addition to reporting problems to operations staff, the EMIS should also providereports to management, executives, engineers and other key personnel (see Section 7).This is to ensure that the appropriate resource(s), commitment and expertise areapplied to energy use efficiency. It is a key part of the management process to ensurethat those responsible for performance are taking effective action.
10101010101010101010010101010101010101010101010101010101
Local model
Relevant Data
Optimum Operating Conditions
Main Reactor and Separations ProcessCurrent Operations: 22.11.02 10:10 to 22.11.02 10:20
To achieve best practice:
• Adjust reactor temperature to 158°C• Reduce plant flow rate to 15.5
• Adjust train 1 vs. train 2 flows 1.1:1
• Increase bed depth to set point
• Reduce inlet pressure set point to 16.5
Implement changes using plant control system. In case of doubt, contact Operation
Support on X25681.
Report covers current operations
Operators are given specific instructions

Energy Management Information Systems16
Figure 7. Example of management report, showing weekly progress
Figure 8. Example of executive report, showing monthly progress
10101001010101
Management Report
Main Reactor and Separations ProcessWeekly Margin: Weeks 1 to 12
Margin Loss 123456 $ per year equivalent
• Recent performance good
• Performance improving over the period
• Actual performance now on target
• Best practice performance 2% below actual
• Weeks 1 and 7 worst performance
Performance vs. Target
0
20
40
60
80
100
1 2 3 4 5 6 7 8 9 10 11 12
Actual Target Best Practice
Weekly and monthly comparisons of actual, target (benchmark) and best practice energy costs
Executive Report
Entire Manufacturing FacilityMonthly: January to December 2002
Margin Loss 123456 $ per year equivalent
• Significant margin loss
• Improving trend
• Recent performance good
• Worst performance January and July
• Best performance November and December
Performance vs. Target
0
20
40
60
80
100
Jan Feb Mar Apr May Jun Jul Aug Sep Oct Nov Dec
Actual Target Best Practice
The benchmark is a typical performance level achieved in the past; best practice is what could be achieved
What Is an Energy Management Information System? 17
2.3.4 Auditing of Historical Operations
As well as providing ongoing information about the current energy performance ofprocesses and equipment, an EMIS can be used to analyse historical performance. To dothis, the EMIS needs a database of historical energy information and influencing factors.With modern data analysis techniques (see Section 8) this data can provide
• an audit of historical operations (what has happened)• an explanation or variations in energy performance (why energy use varied)• an audit of energy use and costs (what operations cost)
From this analysis, engineers and managers can improve their understanding of energyuse efficiency, leading to better decisions.
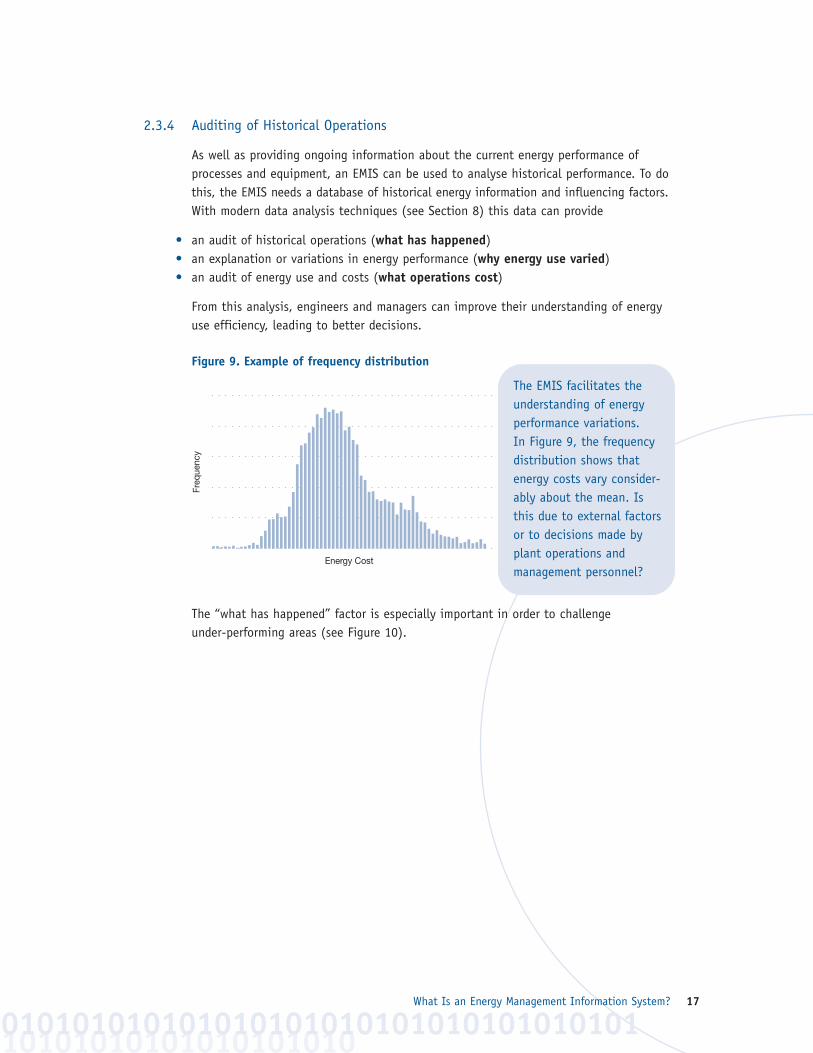
Figure 9. Example of frequency distribution
The “what has happened” factor is especially important in order to challenge under-performing areas (see Figure 10).
10101010101010101010010101010101010101010101010101010101
Energy Cost
Freq
uenc
y
The EMIS facilitates theunderstanding of energyperformance variations. In Figure 9, the frequencydistribution shows thatenergy costs vary consider-ably about the mean. Is this due to external factorsor to decisions made byplant operations and management personnel?
Energy Management Information Systems18
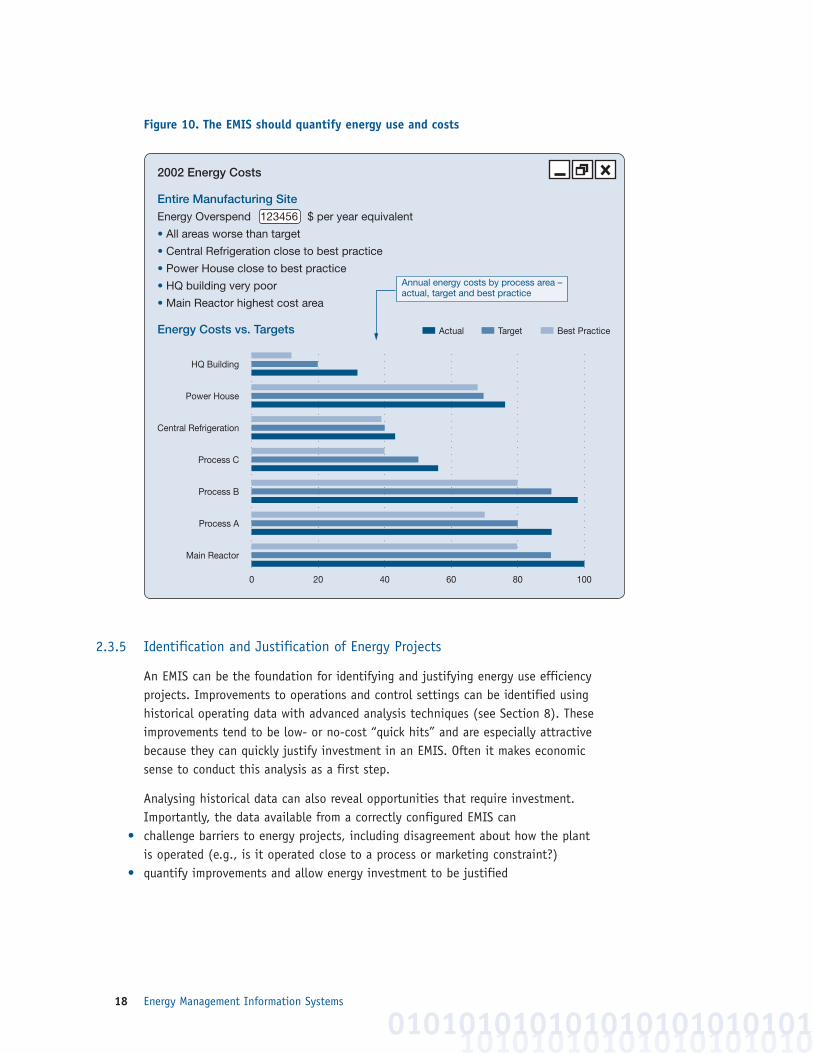
Figure 10. The EMIS should quantify energy use and costs
2.3.5 Identification and Justification of Energy Projects
An EMIS can be the foundation for identifying and justifying energy use efficiency projects. Improvements to operations and control settings can be identified using historical operating data with advanced analysis techniques (see Section 8). Theseimprovements tend to be low- or no-cost “quick hits” and are especially attractivebecause they can quickly justify investment in an EMIS. Often it makes economic sense to conduct this analysis as a first step.
Analysing historical data can also reveal opportunities that require investment.Importantly, the data available from a correctly configured EMIS can
• challenge barriers to energy projects, including disagreement about how the plant is operated (e.g., is it operated close to a process or marketing constraint?)
• quantify improvements and allow energy investment to be justified
10101010101010101010010101010101010101010101
2002 Energy Costs
Entire Manufacturing SiteEnergy Overspend 123456 $ per year equivalent
• All areas worse than target
• Central Refrigeration close to best practice
• Power House close to best practice
• HQ building very poor
• Main Reactor highest cost area
Energy Costs vs. Targets
Main Reactor
Process B
Process A
Process C
Central Refrigeration
Power House
HQ Building
0 20 40 60 80 100
Actual Target Best Practice
Annual energy costs by process area –actual, target and best practice
What Is an Energy Management Information System? 19
2.3.6 Evidence of Success
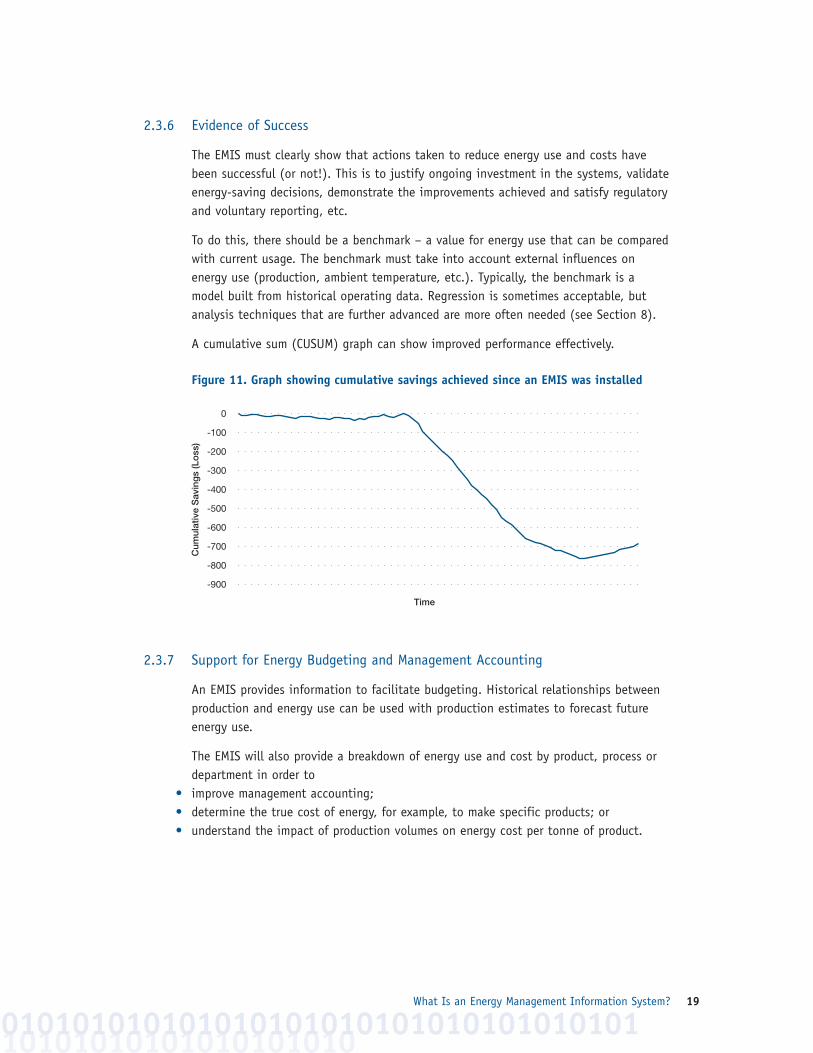
The EMIS must clearly show that actions taken to reduce energy use and costs havebeen successful (or not!). This is to justify ongoing investment in the systems, validateenergy-saving decisions, demonstrate the improvements achieved and satisfy regulatoryand voluntary reporting, etc.
To do this, there should be a benchmark – a value for energy use that can be comparedwith current usage. The benchmark must take into account external influences onenergy use (production, ambient temperature, etc.). Typically, the benchmark is amodel built from historical operating data. Regression is sometimes acceptable, butanalysis techniques that are further advanced are more often needed (see Section 8).
A cumulative sum (CUSUM) graph can show improved performance effectively.
Figure 11. Graph showing cumulative savings achieved since an EMIS was installed
2.3.7 Support for Energy Budgeting and Management Accounting
An EMIS provides information to facilitate budgeting. Historical relationships betweenproduction and energy use can be used with production estimates to forecast futureenergy use.
The EMIS will also provide a breakdown of energy use and cost by product, process ordepartment in order to
• improve management accounting;• determine the true cost of energy, for example, to make specific products; or• understand the impact of production volumes on energy cost per tonne of product.
10101010101010101010010101010101010101010101010101010101
-900
-200
-300
-100
0
-400
-500
-600
-700
-800
Time
Cum
ulat
ive
Sav
ing
s (L
oss
)
Energy Management Information Systems20
2.3.8 Energy Data to Other Systems
An EMIS may also provide energy data and models to other systems. Examples are production planning and scheduling systems, energy, resource planning systems, management information systems, corporate systems and environmental reporting, etc.
2.4 What Are the Elements of an EMIS?
An EMIS comprises a number of elements that are integrated to form a complete solution.These elements include sensors and instruments, data infrastructure and software tools.Typically, separate suppliers will provide individual modules of the system.
As far as possible, EMIS components will be the same as those used to operate and manage the plant and process performance more generally, i.e., the performancemanagement information system. There is a danger in developing an independent system for energy alone, and this approach has resulted in failures in the past. Energyuse efficiency is only one aspect of process (and business) performance and should beconsidered in conjunction with other business objectives such as output, yield, quality,reliability, environment and profit.
In addition to hardware, the EMIS includes management systems to ensure that performance improvements are achieved.
It may well be that the elements of an EMIS already exist within an organization butare not employed to manage energy use.
Sensors and instruments include energy meters (electricity, gas, oil, steam), other utility meters directly associated with energy use (heat flow, cooling flow, compressed-air flow) and temperature, pressure, flow, composition and similar devices used tomeasure factors that influence energy use.
The sensors and instruments will usually be connected to a monitoring system, whichshould always be the monitoring and control system used for the process generally.This may be a distributed control system (DCS) in larger installations or a SCADA/PLCinstallation. In commercial installations, building management systems are used thatare similar to SCADA/PLC.
Data collection should be automated. A data historian that is designed for time-seriesdata storage is typically used. Manual data collection is considered all but obsolete.
Software tools that form an EMIS typically integrate directly with the control/monitoring system and data historian. These include:
• data analysis tools• reporting tools• monitoring software• optimization and decision support software
1010101010101010101001010101010101010101
What Is an Energy Management Information System? 21
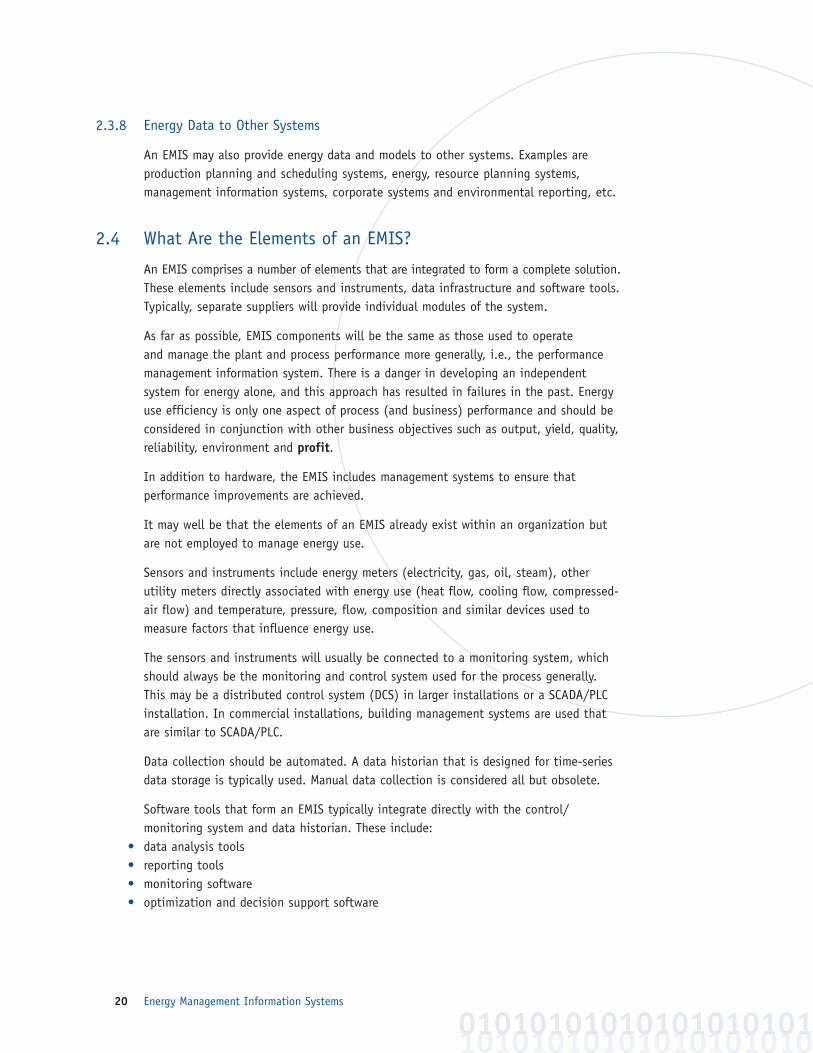
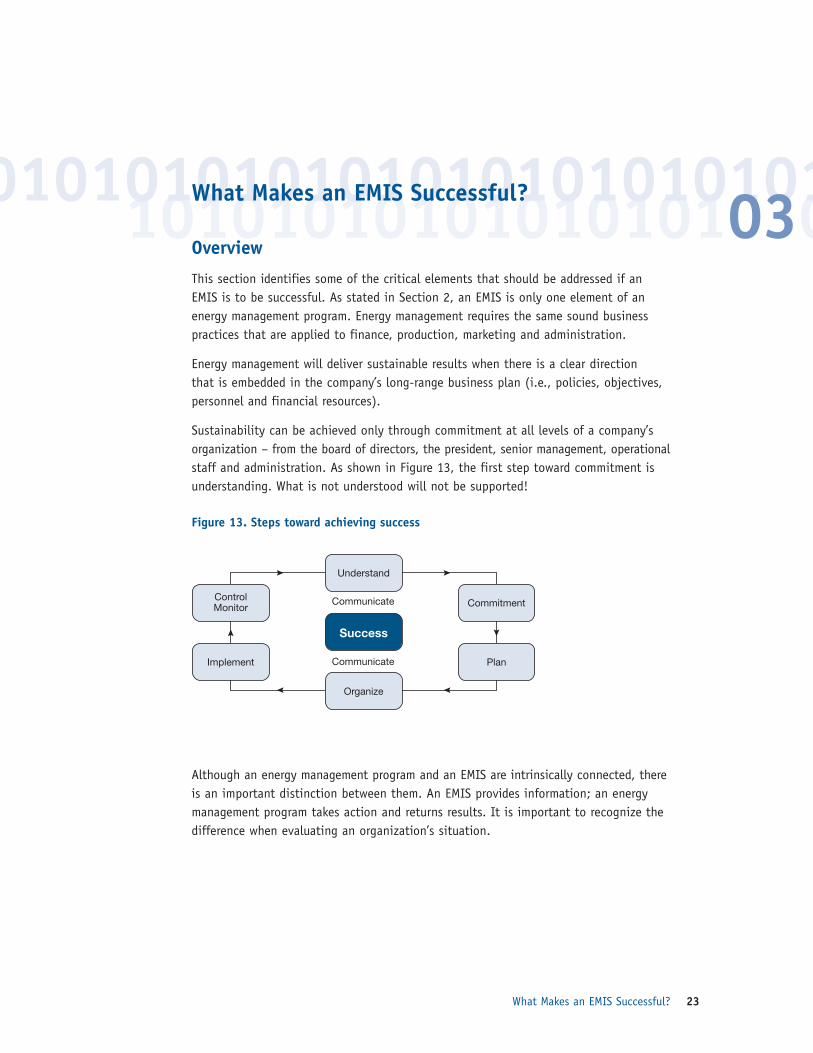
Interfaces between these tools and the control/monitoring and data historian systemsare standard and generally simple to implement. Typically, the EMIS and process moni-toring and management infrastructure will be networked with the corporate IT systems.Figure 12 illustrates the elements of a typical EMIS.
Figure 12. Elements of a typical EMIS
2.5 Solutions for Different Circumstances
The features, benefits and elements of the EMIS should be appropriate to the specificsite. At a larger, energy-intensive site where there is a modern monitoring and controlinfrastructure, all the capabilities described in this handbook will be needed. At asmaller site, however, there may be a case for less comprehensive instrumentation, less frequent monitoring and reporting, and less sophisticated analysis of data. Thishandbook allows readers to choose system elements that are appropriate for their situations. The optimum solution depends on
• the importance and level of energy cost savings achievable• the rate at which faults can develop and the time required to act on them• the existing infrastructure that the EMIS can utilize• the capital available for investment in the EMIS
10101010101010101010010101010101010101010101010101010101
Data Analysisand DecisionSupport Tools
ReportingTools
Managers,Operators,Engineers
Managers,Operators,Engineers
IT Network
Managers,Operators,Engineers
Monitoring andControl System(DCS, SCADA)
Process (Sensorsand Instruments)
Data Historian

Energy Management Information Systems22
Many companies that have developed a vision for an EMIS are obliged to move aheadin stages, earning the capital for the next step from savings realized. In terms of systemrequirements, there is little difference between an EMIS that is used in the industrialsector or the commercial sector, although its implementation may differ. For example,monitoring in the commercial sector will typically involve the building managementsystem, and more responsibility will rest with facility operating personnel to reduceenergy use, although feedback from building occupants should be factored into consideration.
Multi-site organizations may want to introduce a corporate EMIS to report centrally and analyse the organization’s energy performance as a whole. To achieve this, datahistorians at each site should be linked, and the analysis and reporting tools should be able to access the combined data. There may be an additional central database ofselected information. In addition to providing corporate energy reports (total companyenergy use vs. targets, for example), it may be possible to analyse corporate data toreveal higher-level patterns in energy use. For example, where several sites operateprocesses that are similar, it may be possible to find best-practice operating systemsand conditions, optimum maintenance, best contractors, best equipment types and suppliers, etc. Advanced data analysis is discussed in Section 8.
10101010101010101010010101010101010101010101
010101010101010101010101
What Makes an EMIS Successful? 23
10101010101010101010010101010101010101010101What Makes an EMIS Successful?
Overview
This section identifies some of the critical elements that should be addressed if anEMIS is to be successful. As stated in Section 2, an EMIS is only one element of anenergy management program. Energy management requires the same sound businesspractices that are applied to finance, production, marketing and administration.
Energy management will deliver sustainable results when there is a clear direction that is embedded in the company’s long-range business plan (i.e., policies, objectives,personnel and financial resources).
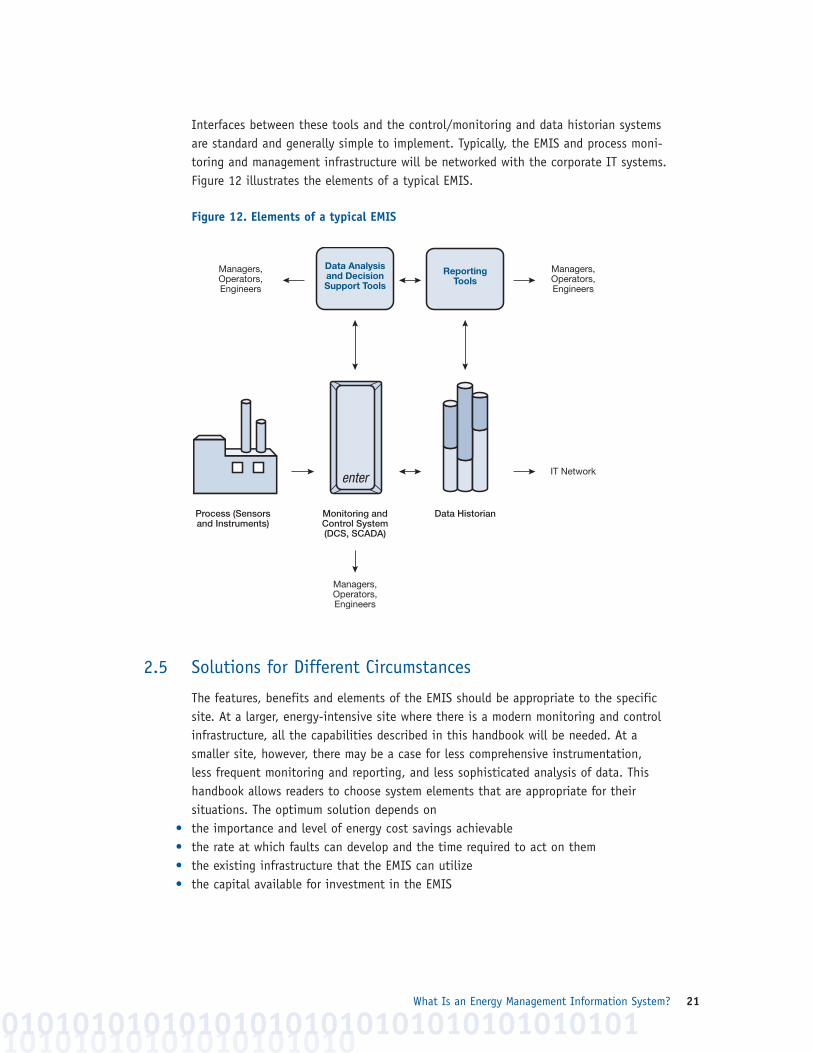
Sustainability can be achieved only through commitment at all levels of a company’sorganization – from the board of directors, the president, senior management, operationalstaff and administration. As shown in Figure 13, the first step toward commitment isunderstanding. What is not understood will not be supported!
Figure 13. Steps toward achieving success
Although an energy management program and an EMIS are intrinsically connected, thereis an important distinction between them. An EMIS provides information; an energymanagement program takes action and returns results. It is important to recognize thedifference when evaluating an organization’s situation.
03
Understand
ControlMonitor Commitment
Implement
Organize
PlanCommunicate
Communicate
Success
Energy Management Information Systems24
3.1 Elements of Success
The following elements directly influence how successful an EMIS will be:
3.1.1 Management’s understanding and commitment 3.1.2 Company policies, directives and organization3.1.3 Program responsibilities3.1.4 Procedures and systems3.1.5 Project selection and focus3.1.6 Approved budget 3.1.7 Approved investment criteria 3.1.8 Training 3.1.9 Integrated information systems3.1.10 Reports on savings achieved 3.1.11 Motivation 3.1.12 Marketing
3.1.1 Management’s Understanding and Commitment
To achieve any sustainable energy initiative, it is essential to have senior management’svisible and active support. This may seem obvious, but it is routinely identified as amajor barrier in establishing and maintaining a serious energy management program.Among the reasons for lack of support are:
• The CEO, president and/or board of directors are unaware of the financial benefits thata corporate-approved energy management initiative will have on the balance sheet.
• Senior managers may not be convinced that new initiatives that are part of the company’s strategic business plan will be of benefit.
• Previous initiatives have failed to deliver the targeted improvements.
The company’s energy manager should consider the following: • Is senior management being provided with factual and justifiable information upon
which they can base their commitment?• Does senior management receive reports on time and in the required format?• Are the reports part of the company’s Executive Information System (EIS)?
Remember, it is senior management that establishes policies, objectives and associatedbudgets, not middle management or a designated energy manager (see Sections 5 and6, especially Section 6.5, “Obtaining Support From Decision-Makers”).
3.1.2 Company Policies, Directives and Organization
To ensure that energy use efficiency becomes an integral part of a company’s businessplan and not just a side issue or ad hoc initiative, a clear set of policies, directives and organizational structure must be developed and approved at the most senior level.Specifically, there should be
• a clear energy use efficiency corporate or company policy statement that specifiesenergy goals and objectives
10101010101010101010010101010101010101010101
What Makes an EMIS Successful? 25
• an approved organizational structure and commitment to improving energy use efficiency• a strategic action plan and time frame• a strategy and plan to involve all employees by seeking their input and involvement
Energy management is first and foremost a management and organizational effort.Without proper attention, the program will have only marginal success or fail altogether.
3.1.3 Program Responsibilities
Because successful energy management is people-oriented (the more people involved,the more effective the program), the efforts of everyone involved must be structuredand planned. The following can be considered a management equation for improvingenergy use efficiency:
Responsibility = Accountability + Authority
An assigned responsibility implies accountability. If these two parts of the equation arevalid, then the person must have the authority (including an approved budget) toachieve company-approved objectives, goals and targets.
In smaller organizations, it may be that management is responsible for reducing energyconsumption as part of its regular management duties.
In larger companies, an energy manager or coordinator must be assigned to be fullyresponsible for any initiative and be accountable to senior management for its success.Ideally, the individual should be an experienced line manager with some project man-agement background and be people-oriented.
Although fully responsible for an organization’s energy initiative, an energy managerobviously cannot work in isolation. The next step is to establish an energy managementcommittee that should include staff from each major energy-using department, includingrepresentatives from operational staff, plant maintenance, engineering and finance. Inmost cases, the energy manager or plant energy coordinator chairs the committee.
3.1.4 Procedures and Systems
Procedures and systems are very important areas that must be challenged and reviewed. Often there can be significant initial low- or no-cost savings.
A well-structured EMIS will identify what areas should be reviewed,inspected and audited. It will also help managers and operational staff understand howanswers to these questions will improve energy use efficiency. Challenge operationalstaff by asking, “If there were no financial or physical restrictions, what changes –operationally and financially justified – would you recommend?”
3.1.5 Project Selection and Focus
An efficiency initiative in one area or process will inevitably affect another.
1010101010101010101010101010101010101010101010101010101010101010101010101010101
Who? What?Where? When?
How? Why?
Energy Management Information Systems26
3.1.6 Approved Budget
In today’s business environment, there is significant internal competition for financialand human resources. An energy management program will be effective only to thedegree that funds and personnel are available to develop and maintain it. It is there-fore essential that the energy manager and the energy management committee developa cost-effective business plan for senior management’s approval.
3.1.7 Approved Investment Criteria
It is of little value to pursue initiatives or projects that require capital expenditures if the company’s position is not clearly identified and understood.
• First cost: It may be company policy to obtain the best price for new or replacementcapital equipment instead of also considering the long-term energy cost.
• Life-cycle cost: The company should consider the operating efficiency (cost) of theequipment during its life cycle.
• Payback period: If it is company policy to have an 18-month period for repayment ofinitial investment, it is unrealistic to prepare a proposal that has a payback period of,for example, three years.
3.1.8 Training
Training is often forgotten, under-emphasized and under-funded. Unless operationalmanagers and plant staff receive adequate training on new techniques and equipment,many of the projected savings will not be realized.
For example, even though computers are now commonplace in today’s working environment, not everyone is computer literate. Because equipment and controlsinvolve computers, training in this area is important and will return value quickly. New techniques in other areas also require training.
3.1.9 Integrated Information Systems
Company information systems must be integrated so that data can be shared amongdepartments. A company may maintain a number of databases, some of which may contain duplicate data. Managers and staff must not feel that if they share data it will somehow infringe upon their area of responsibility. The data belongs to the company, not to individual managers or departments.
3.1.10 Reports on Savings Achieved
Make certain that every saving achieved is recorded and reported to senior management.One of the major barriers to maintaining senior management support is irregular report-ing. Relevant information should be forwarded to all company personnel relative totheir area of responsibility or involvement. They contributed to the savings and shouldbe apprised of what their efforts have accomplished.
10101010101010101010010101010101010101010101
What Makes an EMIS Successful? 27
3.1.11 Motivation
Motivation is a key factor in everyone’s workday. Regular formal or informal communi-cations of the objectives, goals, targets and achievements is a considerable factor inthe success of an energy management program. Remember that energy managementdepends on people. Their participation and motivation to contribute to its success areessential – don’t forget them!
3.1.12 Marketing
A company’s image regarding energy and environmental issues is becoming increasinglyimportant. Some companies are already reporting to governmental agencies what energyand CO2 emissions reductions they have achieved, and they’re also telling their customersand clients. They rightly take pride in documenting and publishing their success stories.Companies want the public to know that they are good corporate citizens – that theyare improving their energy use efficiency and reducing greenhouse gas emissions thatcontribute to climate change.
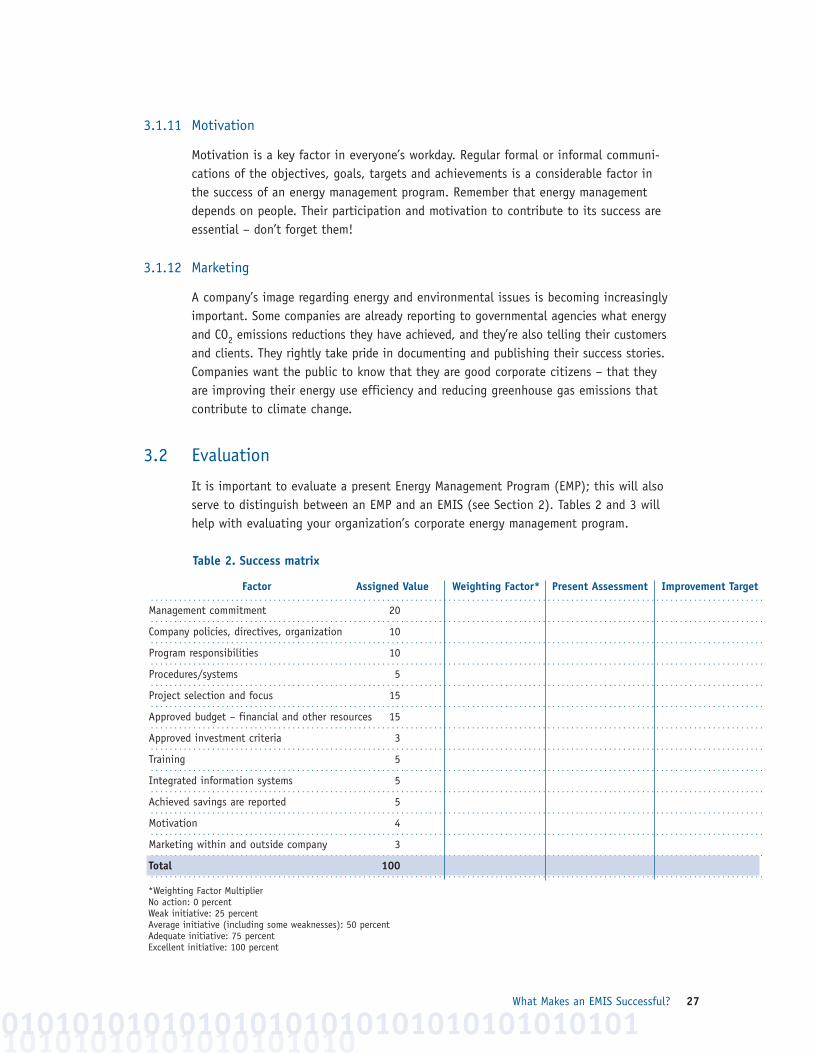
3.2 Evaluation
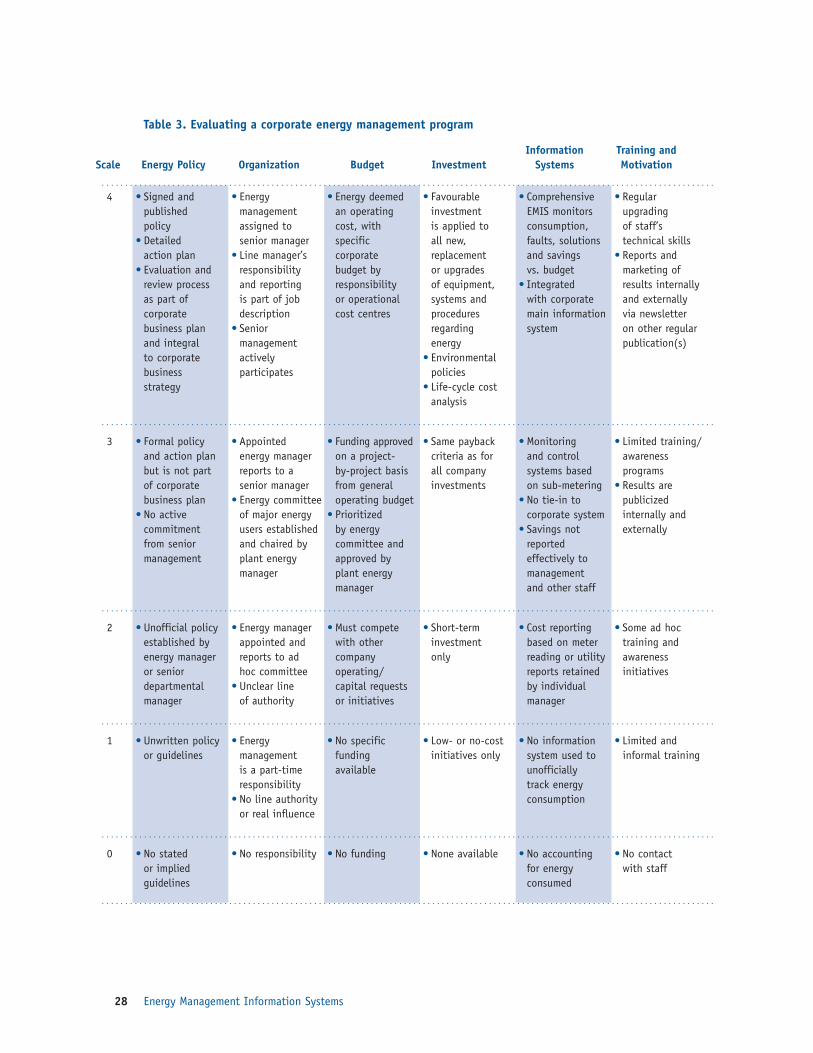
It is important to evaluate a present Energy Management Program (EMP); this will alsoserve to distinguish between an EMP and an EMIS (see Section 2). Tables 2 and 3 willhelp with evaluating your organization’s corporate energy management program.
10101010101010101010010101010101010101010101010101010101
Table 2. Success matrix
Factor Assigned Value Weighting Factor* Present Assessment Improvement Target . . . . . . . . . . . . . . . . . . . . . . . . . . . . . . . . . . . . . . . . . . . . . . . . . . . . . . . . . . . . . . . . . . . . . . . . . . . . . . . . . . . . . . . . . . . . . . . . . . . . . . . . . . . . . . . . . . . . . . . . . . . . . . . . . .
Management commitment 20 . . . . . . . . . . . . . . . . . . . . . . . . . . . . . . . . . . . . . . . . . . . . . . . . . . . . . . . . . . . . . . . . . . . . . . . . . . . . . . . . . . . . . . . . . . . . . . . . . . . . . . . . . . . . . . . . . . . . . . . . . . . . . . . . . .
Company policies, directives, organization 10 . . . . . . . . . . . . . . . . . . . . . . . . . . . . . . . . . . . . . . . . . . . . . . . . . . . . . . . . . . . . . . . . . . . . . . . . . . . . . . . . . . . . . . . . . . . . . . . . . . . . . . . . . . . . . . . . . . . . . . . . . . . . . . . . . .
Program responsibilities 10 . . . . . . . . . . . . . . . . . . . . . . . . . . . . . . . . . . . . . . . . . . . . . . . . . . . . . . . . . . . . . . . . . . . . . . . . . . . . . . . . . . . . . . . . . . . . . . . . . . . . . . . . . . . . . . . . . . . . . . . . . . . . . . . . . .
Procedures/systems 5 . . . . . . . . . . . . . . . . . . . . . . . . . . . . . . . . . . . . . . . . . . . . . . . . . . . . . . . . . . . . . . . . . . . . . . . . . . . . . . . . . . . . . . . . . . . . . . . . . . . . . . . . . . . . . . . . . . . . . . . . . . . . . . . . . .
Project selection and focus 15 . . . . . . . . . . . . . . . . . . . . . . . . . . . . . . . . . . . . . . . . . . . . . . . . . . . . . . . . . . . . . . . . . . . . . . . . . . . . . . . . . . . . . . . . . . . . . . . . . . . . . . . . . . . . . . . . . . . . . . . . . . . . . . . . . .
Approved budget – financial and other resources 15 . . . . . . . . . . . . . . . . . . . . . . . . . . . . . . . . . . . . . . . . . . . . . . . . . . . . . . . . . . . . . . . . . . . . . . . . . . . . . . . . . . . . . . . . . . . . . . . . . . . . . . . . . . . . . . . . . . . . . . . . . . . . . . . . . .
Approved investment criteria 3 . . . . . . . . . . . . . . . . . . . . . . . . . . . . . . . . . . . . . . . . . . . . . . . . . . . . . . . . . . . . . . . . . . . . . . . . . . . . . . . . . . . . . . . . . . . . . . . . . . . . . . . . . . . . . . . . . . . . . . . . . . . . . . . . . .
Training 5 . . . . . . . . . . . . . . . . . . . . . . . . . . . . . . . . . . . . . . . . . . . . . . . . . . . . . . . . . . . . . . . . . . . . . . . . . . . . . . . . . . . . . . . . . . . . . . . . . . . . . . . . . . . . . . . . . . . . . . . . . . . . . . . . . .
Integrated information systems 5 . . . . . . . . . . . . . . . . . . . . . . . . . . . . . . . . . . . . . . . . . . . . . . . . . . . . . . . . . . . . . . . . . . . . . . . . . . . . . . . . . . . . . . . . . . . . . . . . . . . . . . . . . . . . . . . . . . . . . . . . . . . . . . . . . .
Achieved savings are reported 5 . . . . . . . . . . . . . . . . . . . . . . . . . . . . . . . . . . . . . . . . . . . . . . . . . . . . . . . . . . . . . . . . . . . . . . . . . . . . . . . . . . . . . . . . . . . . . . . . . . . . . . . . . . . . . . . . . . . . . . . . . . . . . . . . . .
Motivation 4 . . . . . . . . . . . . . . . . . . . . . . . . . . . . . . . . . . . . . . . . . . . . . . . . . . . . . . . . . . . . . . . . . . . . . . . . . . . . . . . . . . . . . . . . . . . . . . . . . . . . . . . . . . . . . . . . . . . . . . . . . . . . . . . . . .
Marketing within and outside company 3 . . . . . . . . . . . . . . . . . . . . . . . . . . . . . . . . . . . . . . . . . . . . . . . . . . . . . . . . . . . . . . . . . . . . . . . . . . . . . . . . . . . . . . . . . . . . . . . . . . . . . . . . . . . . . . . . . . . . . . . . . . . . . . . . . .
Total 100 . . . . . . . . . . . . . . . . . . . . . . . . . . . . . . . . . . . . . . . . . . . . . . . . . . . . . . . . . . . . . . . . . . . . . . . . . . . . . . . . . . . . . . . . . . . . . . . . . . . . . . . . . . . . . . . . . . . . . . . . . . . . . . . . . .
*Weighting Factor MultiplierNo action: 0 percentWeak initiative: 25 percentAverage initiative (including some weaknesses): 50 percentAdequate initiative: 75 percentExcellent initiative: 100 percent
010101010101010101010101
Energy Management Information Systems28
Table 3. Evaluating a corporate energy management program
Information Training andScale Energy Policy Organization Budget Investment Systems Motivation . . . . . . . . . . . . . . . . . . . . . . . . . . . . . . . . . . . . . . . . . . . . . . . . . . . . . . . . . . . . . . . . . . . . . . . . . . . . . . . . . . . . . . . . . . . . . . . . . . . . . . . . . . . . . . . . . . . . . . . . . . . . . . . . . .
4 • Signed and • Energy • Energy deemed • Favourable • Comprehensive • Regular published management an operating investment EMIS monitors upgrading policy assigned to cost, with is applied to consumption, of staff’s
• Detailed senior manager specific all new, faults, solutions technical skillsaction plan • Line manager’s corporate replacement and savings • Reports and
• Evaluation and responsibility budget by or upgrades vs. budget marketing of review process and reporting responsibility of equipment, • Integrated results internally as part of is part of job or operational systems and with corporate and externally corporate description cost centres procedures main information via newsletter business plan • Senior regarding system on other regular and integral management energy publication(s)to corporate actively • Environmental business participates policiesstrategy • Life-cycle cost
analysis
. . . . . . . . . . . . . . . . . . . . . . . . . . . . . . . . . . . . . . . . . . . . . . . . . . . . . . . . . . . . . . . . . . . . . . . . . . . . . . . . . . . . . . . . . . . . . . . . . . . . . . . . . . . . . . . . . . . . . . . . . . . . . . . . . .
3 • Formal policy • Appointed • Funding approved • Same payback • Monitoring • Limited training/and action plan energy manager on a project- criteria as for and control awarenessbut is not part reports to a by-project basis all company systems based programsof corporate senior manager from general investments on sub-metering • Results arebusiness plan • Energy committee operating budget • No tie-in to publicized
• No active of major energy • Prioritized corporate system internally andcommitment users established by energy • Savings not externallyfrom senior and chaired by committee and reported management plant energy approved by effectively to
manager plant energy management manager and other staff
. . . . . . . . . . . . . . . . . . . . . . . . . . . . . . . . . . . . . . . . . . . . . . . . . . . . . . . . . . . . . . . . . . . . . . . . . . . . . . . . . . . . . . . . . . . . . . . . . . . . . . . . . . . . . . . . . . . . . . . . . . . . . . . . . .
2 • Unofficial policy • Energy manager • Must compete • Short-term • Cost reporting • Some ad hocestablished by appointed and with other investment based on meter training andenergy manager reports to ad company only reading or utility awareness or senior hoc committee operating/ reports retained initiativesdepartmental • Unclear line capital requests by individual manager of authority or initiatives manager
. . . . . . . . . . . . . . . . . . . . . . . . . . . . . . . . . . . . . . . . . . . . . . . . . . . . . . . . . . . . . . . . . . . . . . . . . . . . . . . . . . . . . . . . . . . . . . . . . . . . . . . . . . . . . . . . . . . . . . . . . . . . . . . . . .
1 • Unwritten policy • Energy • No specific • Low- or no-cost • No information • Limited andor guidelines management funding initiatives only system used to informal training
is a part-time available unofficially responsibility track energy
• No line authority consumptionor real influence
. . . . . . . . . . . . . . . . . . . . . . . . . . . . . . . . . . . . . . . . . . . . . . . . . . . . . . . . . . . . . . . . . . . . . . . . . . . . . . . . . . . . . . . . . . . . . . . . . . . . . . . . . . . . . . . . . . . . . . . . . . . . . . . . . .
0 • No stated • No responsibility • No funding • None available • No accounting • No contact or implied for energy with staffguidelines consumed
. . . . . . . . . . . . . . . . . . . . . . . . . . . . . . . . . . . . . . . . . . . . . . . . . . . . . . . . . . . . . . . . . . . . . . . . . . . . . . . . . . . . . . . . . . . . . . . . . . . . . . . . . . . . . . . . . . . . . . . . . . . . . . . . . .
10101010101010101010010101010101010101010101
Real-Time Data Is Required 29
04Real-Time Data Is Required
What Is Real-Time Data?
Real-time data is collected automatically at predetermined intervals. For a similar cost,measurements can be recorded every day or every second. To be useful, however, thefrequency of data collection should
• be sufficient to allow problems and remedies to be identified in time to save energy(i.e., before the problem is over and the process has moved to another operatingmode)
• be more frequent than the fluctuations in energy use that need to be understood (at least twice the frequency)
• should not be so frequent that changes are due to control system variations ratherthan true variations in energy performance
Low-frequency data produce crude targets and have caused some systems to fail. If amanager cannot see the effect of his or her actions on performance, system credibilitywill be lost. No savings will be achieved other than those that tend to follow theimplementation of any EMIS and/or M&T system because of its sole focus on energysavings. These savings, however, are well below what is possible and typically will not be sustained. An EMIS should operate in real time for the following reasons:
• A real-time system will identify poor performance (i.e., a problem) sufficiently quicklyfor action to be taken.
• Real-time data can provide a better understanding of historical operations.• Real-time data can produce better targets (models).• Real-time information is better for activity-based costing.• Real-time energy data is consistent with data collection to manage general process
performance (energy, yield, etc.), and integration with these systems is key.
Identifying poor performance quickly allows staff to correct the problem and achieveenergy savings. Contrast this with a system that simply tells the user that a problemoccurred yesterday or last week; the operator is left knowing that an opportunity hasbeen missed and is faced with the problem of making sure that the next problem isidentified through real-time monitoring.
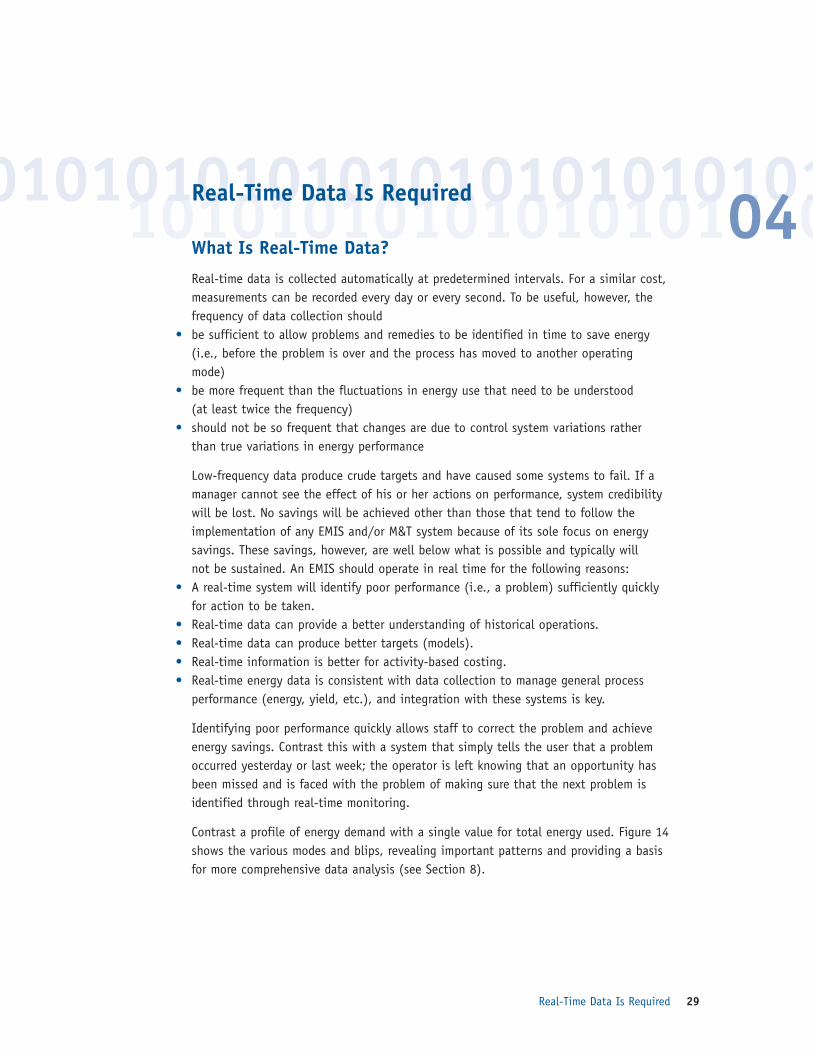
Contrast a profile of energy demand with a single value for total energy used. Figure 14shows the various modes and blips, revealing important patterns and providing a basisfor more comprehensive data analysis (see Section 8).
010101010101010101010101
Energy Management Information Systems30
Figure 14. A profile showing blips in energy use
Arguments against using real-time systems include the following:• Cost – Meters can be read manually, but what is the cost (i.e., personnel time) of
manually collecting data? Readings must be taken at the same time each recordingperiod (day/time) to be credible (this includes statutory holidays at premium overtimehourly rates).
• Less complexity – Systems that do not operate in real time are less complex, but whatis their price in sacrificed energy savings?
101010101010101010101010101010010101010101010101010101
1 3 5 7 9 11 13 15 17 19 21 23
Time
25 27 29 31 33 35 37 39 41 43
9000
8000
7000
6000
5000
4000
3000
2000
1000
0
Ene
rgy
Use
How Can Action Ensure Improvements? 31
1010101010101010101001010101010101010101010105How Can Action Ensure Improvements?
Overview
There is little value in initiating an EMIS if action is not taken on data analysis results.This section focuses on how to ensure that the EMIS is acted upon so that savings areachieved. Also outlined are who should take action, how and when they should act,and what they need to ensure that they take action.
5.1 Who Should Take Action?
Action to achieve improvements is best ensured by an organizational culture thatencourages, rewards and sustains initiatives that reduce utility costs. Although an EMIS supplies useful information about a site’s consumption patterns, “people skills”are needed in order to effectively communicate, encourage and involve personnel ineffectively achieving results.
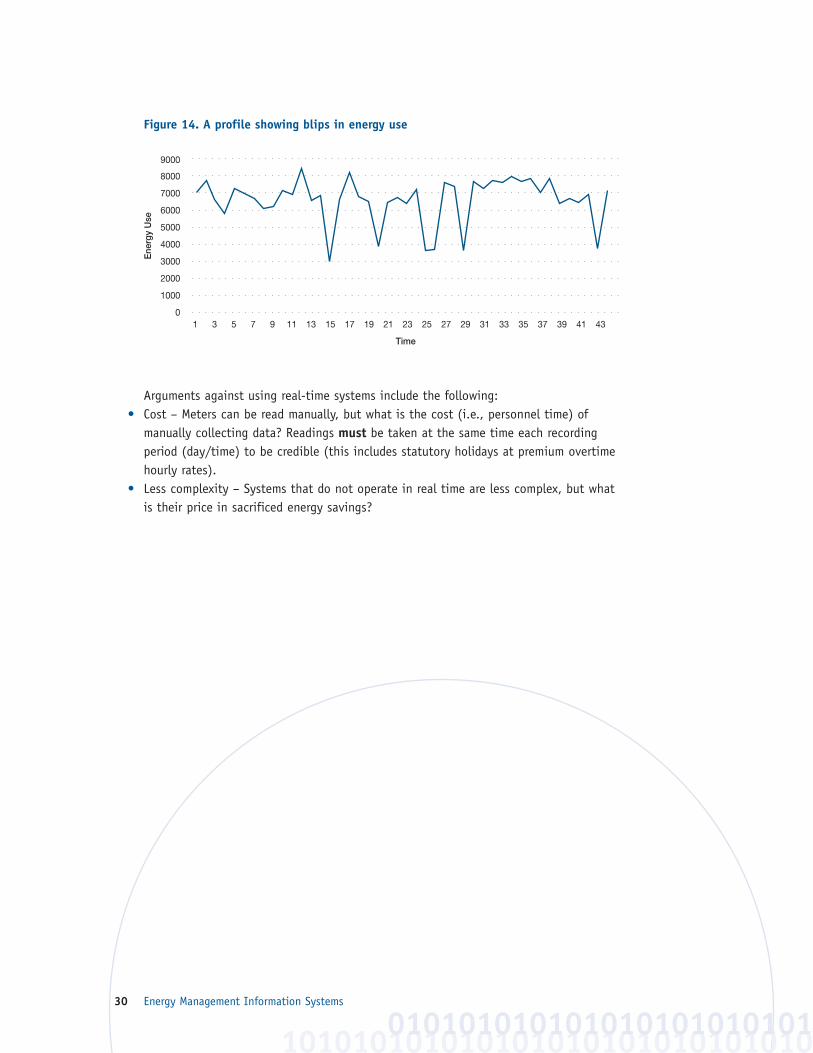
Figure 15. EMIS impact on organizational structure
As illustrated in Figure 15, using an EMIS as a support tool to encourage action affectsa site’s organizational structure. Depending on the company’s type of business, manage-ment and personnel will each fulfil a different role when taking action. The downwardand upward exchange of information and data between senior management and operationscomprises an open structure that is crucial in order to ensure action and success.
Who Hasa Role
to Play?
Engineering
Planners andSchedulers
Executive and Senior
Management
Accounting
OperationsManagementand Personnel
EnergyManagers
Energy Management Information Systems32
Top management can ensure action by• clearly stating its energy policy (i.e., define the organization’s initiatives in energy
use efficiency)• informing the organization’s employees and the general public of its commitment to
energy use efficiency and associated cost reduction• appointing a responsible authority (usually the energy manager) to ensure action
Operations management can best ensure action by involving those who have the mostimpact on energy consumption. Ultimately, it is operational personnel who take actionsto meet energy use efficiency targets and who are accountable for the effectiveness oftheir efforts. An EMIS is based on transferring responsibility for performance efficiencyfrom those who have limited influence on energy consumption (utilities and physicalplant managers) to those who have the greatest influence on performance (the end-userwho operates the process).
Actions taken to achieve energy savings will indirectly involve the planning and scheduling, accounting and engineering departments. Any proposed energy use efficiencyinitiative should be communicated to these groups as early as possible.
5.2 What Is Needed to Take Action?
Reliable and useful information is needed in order to take appropriate action. Key aspects include
5.2.1 Energy data5.2.2 Targets5.2.3 Reports5.3.4 Training5.2.5 Decision support5.2.6 Audited success5.2.7 Motivation and recognition5.2.8 Benchmarking and best practices
5.2.1 Energy Data
Good monitoring information provides a firm foundation to intelligently select measuresto be implemented. Additional sub-metering may be needed to provide sufficient dataand a basis for action. Data should not be “thrown at” an EMIS with immediate resultsexpected; regard the EMIS as a tool to be engineered into a solution. The capabilitiesand limitations of an EMIS should be well understood before applying its findings.
5.2.2 Targets
Comparing current energy performance with targets prompts action to improve energyuse efficiency. Simply monitoring energy use will only incur capital costs and will notresult in cost avoidance.
10101010101010101010010101010101010101010101
How Can Action Ensure Improvements? 33
Targets are calculated from an equation that represents the linkbetween monitored energy consumption and its influencingfactors (outdoor temperature, operating hours, production rate,hours of occupancy, etc.). The target equation is derived fromstatistical analysis or from measured data. To be meaningfuland reliable, targets must be
• regularly reviewed (at least quarterly)• established in line with a definite action plan• established only after the desired level of monitoring is in
place and meaningful data has been confidently obtained• realistic but not too easy to achieve
Consistently setting appropriate targets will ensure continuous improvement in resultsand help motivate personnel who influence energy use. Poor target setting can destroyconfidence and lead to eventual failure of the EMIS. Several factors affect the target-setting process and the ability to translate information into action. These include thefollowing:
• Identify and agree to desired targets. Keep in mind the justification for the application,and limit the effort to match the desired goals. Do not attempt to monitor the entiresite if a preliminary evaluation anticipates that the major benefits will probably comefrom only one or two areas. Try to keep targets as simple as possible, but no simpler.
• Management personnel cannot support or commit themselves to something that theyare not aware of and/or do not understand. Targets should be explained and be agreedto by senior management.
5.2.3 Reports
Reports should be circulated to advise when targets have been met or exceeded andwhen they have been improved upon. These can serve as motivation tools and shouldbe clear, credible, timely, appropriate and informative. Don’t overwhelm the intendedaudience with too many facts and figures.
The level of detail in reports must be tailored to the intended audience. Executives typically need only a performance overview. Senior management requires similar infor-mation that has slightly more detail and compares energy use with targets. Operationalmanagers and their personnel need detailed information. Reports to them shouldinclude energy profiles and key influencing factors, which will offer more specific information and help them diagnose faults.
5.2.4 Training
In order for appropriate actions to follow the implementation of an EMIS, personnel must understand the reports that are being generated and what actions they should take. This requires staff training and team building. Training must:
1010101010101010101001010101010101010101010101010101
Good target setting motivates; bad targets
destroy confidence.
The importance of training anddocumentation support
Energy Management Information Systems34
• impart a clear understanding to site personnel of the impact that utilities have on aplant’s operation and that utilities represent a controllable cost
• use simple graphs, visuals and handouts to illustrate an overview of the site’s utilitieshistory and provide a reference to set future goals and targets
• help staff work together as a team and recognize opportunities to reduce energy coststhroughout the site
• motivate staff to encourage their fellow employees to become actively involved inefforts to reduce energy use
• emphasize that when a problem occurs, it is regarded as a team problem that needsteam support – individuals will not be left to sort out problems by themselves
5.2.5 Decision Support
As already stated in Section 3, effective implementation of energy use efficiency measures must involve various units within an organization. Creating a decision supportcommittee for the responsible authority (i.e., the energy manager) can provide a frame-work for obtaining agreement on actions that may affect more than one operating unit.This committee could also foster communications between various departments andoffer a stronger voice when approaching senior management for project approval.
5.2.6 Audited Success
Motivation will be sustained when a team has early successes with proven results, asvalidated by the EMIS. Credibility will also enhance motivation and obtain buy-in fromall personnel.
5.2.7 Motivation and Recognition
Ways to reward good performance can be developed by an organization’s humanresources group. This may involve giving recognition through publicity (e.g., testimonialposters, newsletters, non-monetary awards at company events, etc.) or a modest cashaward. Motivation will also be enhanced when staff is assured that help is availablefrom the team to correct poor performance.
5.2.8 Benchmarking and Best Practices
Comparisons derived from a benchmarking exercise can provide a catalyst for takingaction to improve energy performance and reduce costs.
Although the target review process will help a facility gain insight into its operationsand utility cost performance, many organizations want to understand how their performance relates to other sites within the company or with their competitors.Benchmarking offers a tool for managers to measure their organization’s performance inrelation to others. It also provides an excellent learning opportunity. Improvements in
10101010101010101010010101010101010101010101
How Can Action Ensure Improvements? 35
10101010101010101010010101010101010101010101010101010101
utility consumption derived from EMIS knowledge can instigate a set of best practices.There are significant benefits from having all areas of an organization use best practicesdetermined from another area of the organization or another industry player.
An organization that is interested in benchmarking must• first decide which methodology it wants to use as a basis of comparison (e.g., energy
consumption per total raw feedstock processed or energy consumption per total refined product)
• determine whose operations it intends to use as a benchmark• do its homework and arrive well prepared (this is a prerequisite to getting other
organizations to partner with you in a benchmarking effort)
Candidates for benchmarking can be determined throughtrade associations, journals and contact with colleagues.Most companies that are approached to share data are receptive to benchmarking, although some may be reluctantfor competitive reasons.
Companies that understand that they are being approachedbecause they are recognized as being best in their class will often agree to share information. Most companies, however, will not agree to an exchange of informationwith another company that has not looked at itself first.
Understand the data youneed and the results you want – compareapples with apples.

010101010101010101010101
Energy Management Information Systems36
10101010101010101010010101
How Is an Effective EMIS Designed and Justified? 37
1010101010101010101001010101010101010101010106How Is an Effective EMIS Designed and Justified?
Overview
This section outlines how to take a structured approach when designing an effectiveEMIS. Discussed are creating a vision, developing a case and gaining support to implement that vision. Key points are summarized at the end of this section.
6.1 Creating a Vision of an Effective EMIS
A company needs a clear vision if it is to invest in an EMIS. Factors that influence the decision to begin an EMIS project include
• a need to reduce greenhouse gas emissions • the realization that utility costs are controllable and not fixed overhead expenses• effective negotiation of utility contracts based on a sound understanding of a facility’s
or plant’s energy use profile• the need for real-time fault diagnosis, product quality control and the ability to
challenge plant performance
The following points should be considered before designing an EMIS.
6.1.1 Address Site Needs
Implementation must address the needs of the site; otherwisethe site is buying into a “system,” not a management tool. This involves clearly identifying performance measurements that are relevant to the operating strategy of the site.
6.1.2 Usefulness of the System
It is necessary to clearly understand how the EMIS will be used and how it will directlyor indirectly result in utility cost avoidance. The EMIS must be useful if it is expectedto remain in service for several years. This means that it must gather the collective and accumulated experience of a site’s operations without having to relearn it. Thisinvolves
• gathering and storing a considerable amount of information, organizing it logically and making it accessible with limited effort within reasonable response times
An EMIS must suit thesite, involve processpersonnel and offer
real-time data.
Energy Management Information Systems38
• being flexible enough to accommodate the requirements of a main site in a multi-siteorganization but also address a unique requirement of a remote site if the load is sizable and represents a constraint on the overall operation
• encouraging collaborative activity and assisting analysis and decision making
6.2 Beginning Design: Consider Measurement Issues
Once a clear vision of how the EMIS will be used is established, details on energy usemeasurement need to be worked out. To ensure that an effective system is implemented,an EMIS design should be based on two key facets:
• prominent involvement of the person who is in charge of the process • the presentation of performance measurements in real time
There is little value in designing a sophisticated energy monitoring system that measuresconsumption too coarsely. Similarly, measurements will be of no help if they are sodetailed that it is difficult to determine what historical energy consumption was for a specific area and why it differed from previous values. In practical terms, the personwho is in charge of the process best answers this. An effective system also providestools to the people who are actually processing the product so that they can receiveperformance indicators during the process and respond appropriately.
The essence of an EMIS is to compare real-time utility consumption with historicalrecords and set targets (e.g., the energy consumption of the present process batch vs.the previous one). Until these two attributes are designed into an EMIS, the site willultimately be left with a “rearview mirror” syndrome that offers information that noone will have time to go back and review.
It makes sense for the person who is responsible for the process to be assigned thetasks of collecting energy and process data and explaining the performance in realtime. Alternate personnel are not likely to have the required knowledge, and theywould have to consult closely with the process person in any case.
The degree to which energy use is measured must be factored into the design of theEMIS, and this is subject to the usual trade-off of cost vs. need. If, as a result of insufficient measurement, energy use is not broken down into the same size “pieces”on which the process is managed, the plant will have difficulty introducing theaccountability required to effectively manage energy use.
To counter any concerns that an EMIS means needless micro-managing, experiencedprocess operators generally recognize the difficulty of managing a process simply bylooking at the total feed-in and comparing it with the total product out every month.It is not unusual for a process vessel to be instrumented with equipment, valued at arange of $100,000 to $200,000 and dedicated to micro-managing that part of theprocess. This is inherent in process control; yet, this approach is rarely applied toenergy control with the same regard. If the plant is serious about developing metrics,
10101010101010101010010101010101010101010101
How Is an Effective EMIS Designed and Justified? 39
challenging current practices and reviewing energy consumption as part of the regularcost review process toward energy management, it should know its energy consumptionper unit of product for every process area, at least on a daily basis.
6.3 The Next Step: Consider Integration Into Existing Systems
Careful consideration of how the EMIS will fit into existingmanagement systems on-site must be part of the overalldesign process. The continuing reduction in the cost ofdata processing, the increase in available communicationbandwidth, and the ongoing improvements in search-engine software encourage theintegration of an EMIS within existing IT systems. Many sites already employ a varietyof DCS and SCADA systems, enabling a large portion of existing hardware and infra-structure to be used in the design of a new EMIS.
Since the requirements of an EMIS are likely to be broader than an existing IT system,implementation will probably require additional input or output variables. This could be accomplished with relative ease by adding supplementary field (end) devices such as sensors, tying the signals to spare input cards and applying some reprogramming.
Beyond data acquisition and monitoring and control issues, the design must evaluatewhich attributes of the management systems, ISO requirements, procedures, etc. thatare presently in use can be linked to a new EMIS. The purpose of this evaluation is togain insight into how the existing systems are used within an architecture that typicallyintegrates data, functions (e.g., analysis, document management, simulation tools,search engine, etc.) and presentation. An understanding must also be gained of theoperation of the corporate networks that support this architecture, including intranets,extranets for utility and supplier connections and links to the Internet.
Since all plants have cost accounting systems, the EMIS must effectively mesh withwhat is currently in place to ensure that energy management is integrated within thecore of the business and not relegated as a sideline issue.
It is important to realize that barriers to implementationusually have more to do with cultural and organizationalissues than technical issues. Creating a knowledge-basedteam will require more than supplying software, largedatabases of information and hardware. Issues that should be addressed when considering the interaction of people and technology include the following:
• Existing data that is inconsistent throughout the company should be reconciled beforedesigning an EMIS. Uniform data is a key requirement in a data-sharing environment.
• It will be difficult to encourage people to share information when an organization’sculture ranks their employees strictly on individual performance. Foresight will beneeded in order to deal with common perceptions that capturing and disseminatingknowledge will reduce one’s future value to the organization (“Why will I be needed?”
10101010101010101010010101010101010101010101010101010101
Use existing infrastructure as much as possible.
Consider the interaction oftechnology and people.
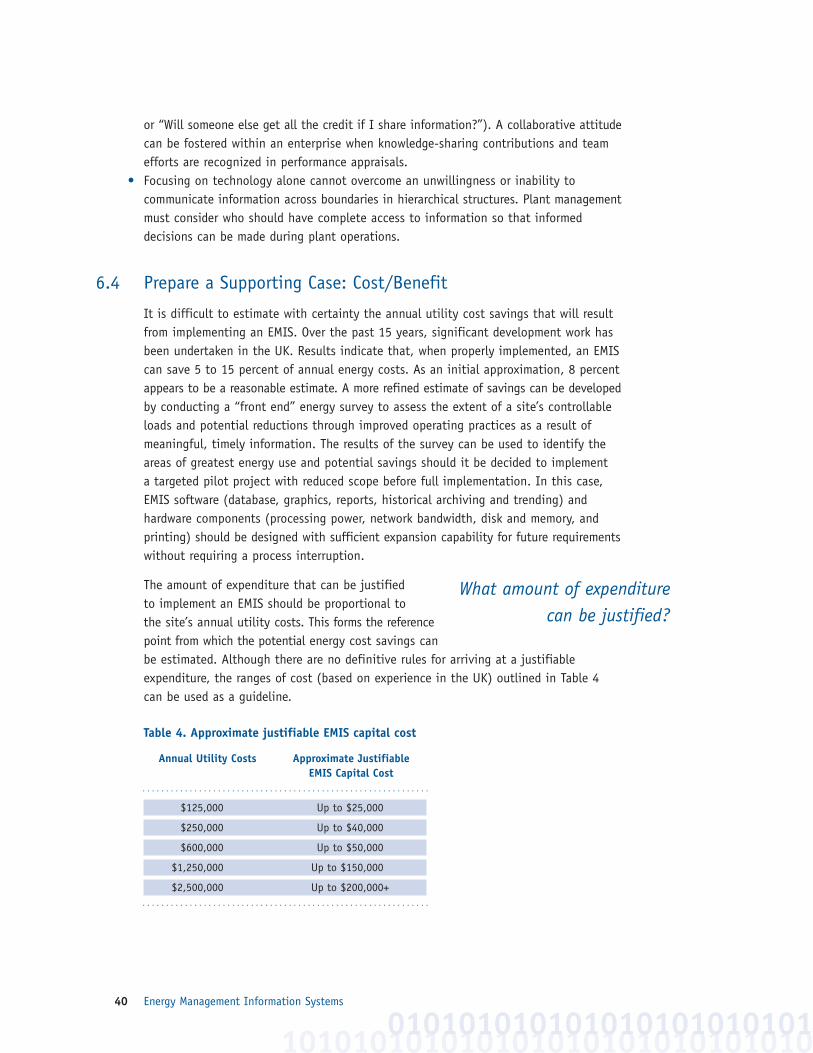
Energy Management Information Systems40
or “Will someone else get all the credit if I share information?”). A collaborative attitudecan be fostered within an enterprise when knowledge-sharing contributions and teamefforts are recognized in performance appraisals.
• Focusing on technology alone cannot overcome an unwillingness or inability to communicate information across boundaries in hierarchical structures. Plant managementmust consider who should have complete access to information so that informed decisions can be made during plant operations.
6.4 Prepare a Supporting Case: Cost/Benefit
It is difficult to estimate with certainty the annual utility cost savings that will resultfrom implementing an EMIS. Over the past 15 years, significant development work hasbeen undertaken in the UK. Results indicate that, when properly implemented, an EMIScan save 5 to 15 percent of annual energy costs. As an initial approximation, 8 percentappears to be a reasonable estimate. A more refined estimate of savings can be developedby conducting a “front end” energy survey to assess the extent of a site’s controllableloads and potential reductions through improved operating practices as a result ofmeaningful, timely information. The results of the survey can be used to identify theareas of greatest energy use and potential savings should it be decided to implement a targeted pilot project with reduced scope before full implementation. In this case,EMIS software (database, graphics, reports, historical archiving and trending) and hardware components (processing power, network bandwidth, disk and memory, andprinting) should be designed with sufficient expansion capability for future requirementswithout requiring a process interruption.
The amount of expenditure that can be justified to implement an EMIS should be proportional to the site’s annual utility costs. This forms the referencepoint from which the potential energy cost savings canbe estimated. Although there are no definitive rules for arriving at a justifiable expenditure, the ranges of cost (based on experience in the UK) outlined in Table 4 can be used as a guideline.
Table 4. Approximate justifiable EMIS capital cost
Annual Utility Costs Approximate JustifiableEMIS Capital Cost
. . . . . . . . . . . . . . . . . . . . . . . . . . . . . . . . . . . . . . . . . . . . . . . . . . . . . . . . . . . . .
$125,000 Up to $25,000
$250,000 Up to $40,000
$600,000 Up to $50,000
$1,250,000 Up to $150,000
$2,500,000 Up to $200,000+. . . . . . . . . . . . . . . . . . . . . . . . . . . . . . . . . . . . . . . . . . . . . . . . . . . . . . . . . . . . .
101010101010101010101010101010010101010101010101010101
What amount of expenditurecan be justified?
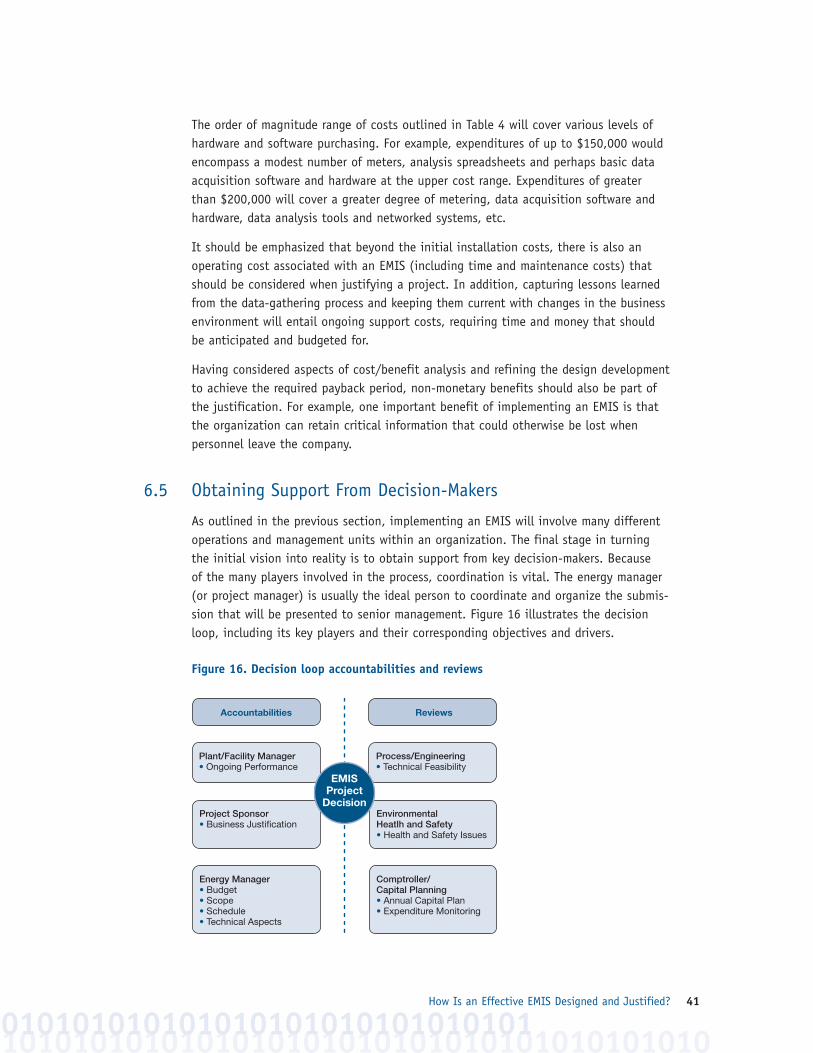
How Is an Effective EMIS Designed and Justified? 41
The order of magnitude range of costs outlined in Table 4 will cover various levels ofhardware and software purchasing. For example, expenditures of up to $150,000 wouldencompass a modest number of meters, analysis spreadsheets and perhaps basic dataacquisition software and hardware at the upper cost range. Expenditures of greaterthan $200,000 will cover a greater degree of metering, data acquisition software andhardware, data analysis tools and networked systems, etc.
It should be emphasized that beyond the initial installation costs, there is also anoperating cost associated with an EMIS (including time and maintenance costs) thatshould be considered when justifying a project. In addition, capturing lessons learnedfrom the data-gathering process and keeping them current with changes in the businessenvironment will entail ongoing support costs, requiring time and money that shouldbe anticipated and budgeted for.
Having considered aspects of cost/benefit analysis and refining the design developmentto achieve the required payback period, non-monetary benefits should also be part ofthe justification. For example, one important benefit of implementing an EMIS is thatthe organization can retain critical information that could otherwise be lost when personnel leave the company.
6.5 Obtaining Support From Decision-Makers
As outlined in the previous section, implementing an EMIS will involve many differentoperations and management units within an organization. The final stage in turningthe initial vision into reality is to obtain support from key decision-makers. Because of the many players involved in the process, coordination is vital. The energy manager(or project manager) is usually the ideal person to coordinate and organize the submis-sion that will be presented to senior management. Figure 16 illustrates the decisionloop, including its key players and their corresponding objectives and drivers.
Figure 16. Decision loop accountabilities and reviews
1010101010101010101010101010101010101010010101010101010101010101010101
Accountabilities
Project Sponsor• Business Justification
Energy Manager• Budget• Scope• Schedule• Technical Aspects
Plant/Facility Manager• Ongoing Performance
Environmental Heatlh and Safety• Health and Safety Issues
Comptroller/ Capital Planning• Annual Capital Plan• Expenditure Monitoring
Process/Engineering• Technical Feasibility
Reviews
EMISProject
Decision
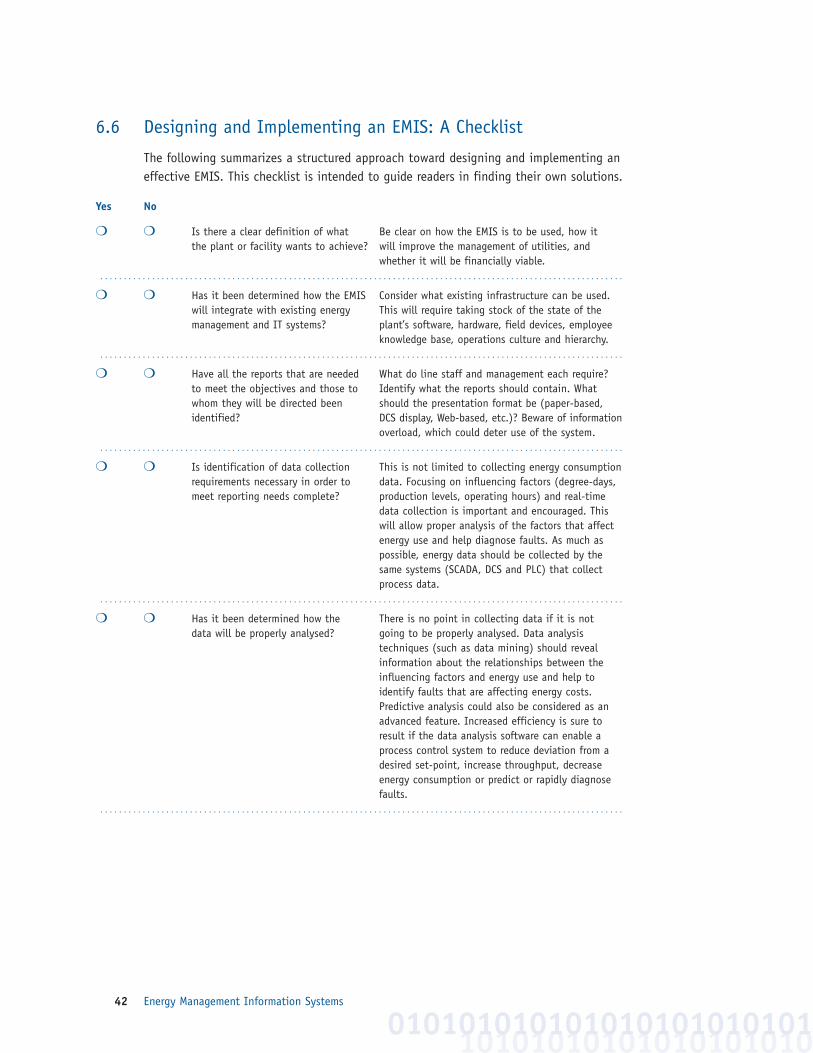
Energy Management Information Systems42
6.6 Designing and Implementing an EMIS: A Checklist
The following summarizes a structured approach toward designing and implementing aneffective EMIS. This checklist is intended to guide readers in finding their own solutions.
Yes No
❍ ❍ Is there a clear definition of what Be clear on how the EMIS is to be used, how it the plant or facility wants to achieve? will improve the management of utilities, and
whether it will be financially viable. . . . . . . . . . . . . . . . . . . . . . . . . . . . . . . . . . . . . . . . . . . . . . . . . . . . . . . . . . . . . . . . . . . . . . . . . . . . . . . . . . . . . . . . . . . . . . . . . . . . . . . . . . . . . . . .
❍ ❍ Has it been determined how the EMIS Consider what existing infrastructure can be used. will integrate with existing energy This will require taking stock of the state of the management and IT systems? plant’s software, hardware, field devices, employee
knowledge base, operations culture and hierarchy. . . . . . . . . . . . . . . . . . . . . . . . . . . . . . . . . . . . . . . . . . . . . . . . . . . . . . . . . . . . . . . . . . . . . . . . . . . . . . . . . . . . . . . . . . . . . . . . . . . . . . . . . . . . . . . .
❍ ❍ Have all the reports that are needed What do line staff and management each require? to meet the objectives and those to Identify what the reports should contain. What whom they will be directed been should the presentation format be (paper-based, identified? DCS display, Web-based, etc.)? Beware of information
overload, which could deter use of the system. . . . . . . . . . . . . . . . . . . . . . . . . . . . . . . . . . . . . . . . . . . . . . . . . . . . . . . . . . . . . . . . . . . . . . . . . . . . . . . . . . . . . . . . . . . . . . . . . . . . . . . . . . . . . . . .
❍ ❍ Is identification of data collection This is not limited to collecting energy consumption requirements necessary in order to data. Focusing on influencing factors (degree-days, meet reporting needs complete? production levels, operating hours) and real-time
data collection is important and encouraged. This will allow proper analysis of the factors that affect energy use and help diagnose faults. As much as possible, energy data should be collected by the same systems (SCADA, DCS and PLC) that collect process data.
. . . . . . . . . . . . . . . . . . . . . . . . . . . . . . . . . . . . . . . . . . . . . . . . . . . . . . . . . . . . . . . . . . . . . . . . . . . . . . . . . . . . . . . . . . . . . . . . . . . . . . . . . . . . . . .
❍ ❍ Has it been determined how the There is no point in collecting data if it is not data will be properly analysed? going to be properly analysed. Data analysis
techniques (such as data mining) should reveal information about the relationships between the influencing factors and energy use and help to identify faults that are affecting energy costs. Predictive analysis could also be considered as an advanced feature. Increased efficiency is sure to result if the data analysis software can enable a process control system to reduce deviation from a desired set-point, increase throughput, decrease energy consumption or predict or rapidly diagnose faults.
. . . . . . . . . . . . . . . . . . . . . . . . . . . . . . . . . . . . . . . . . . . . . . . . . . . . . . . . . . . . . . . . . . . . . . . . . . . . . . . . . . . . . . . . . . . . . . . . . . . . . . . . . . . . . . .
10101010101010101010010101010101010101010101
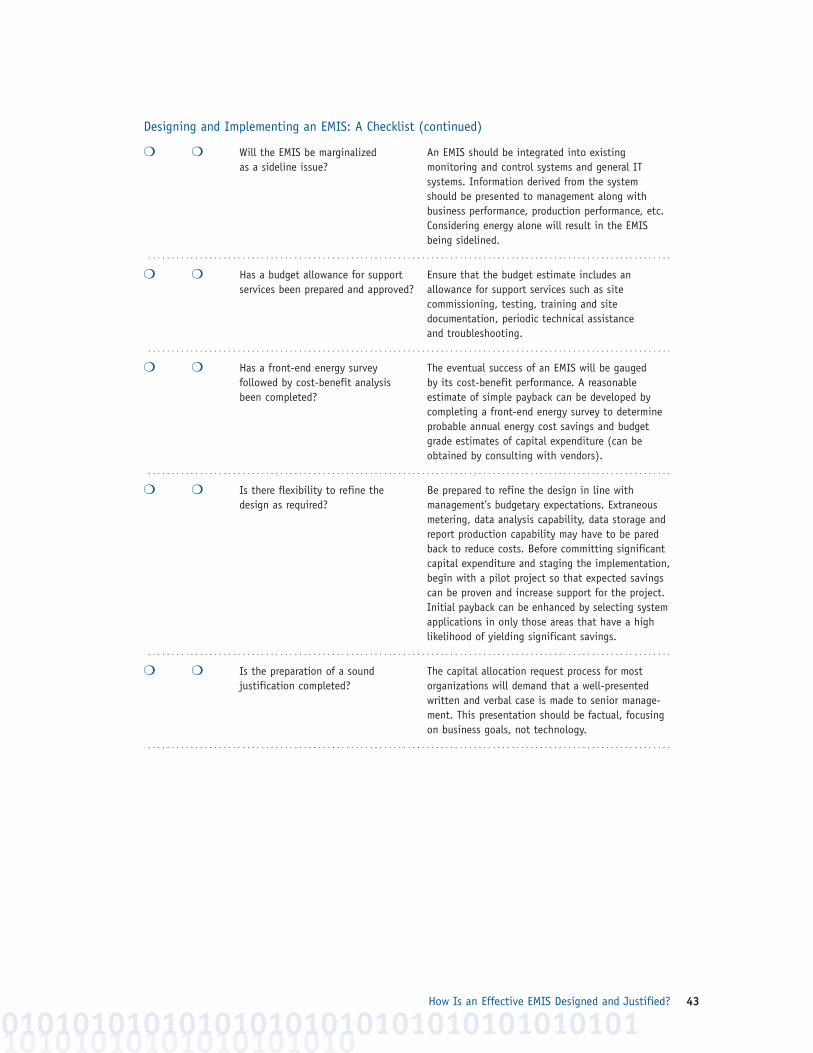
How Is an Effective EMIS Designed and Justified? 43
Designing and Implementing an EMIS: A Checklist (continued)
❍ ❍ Will the EMIS be marginalized An EMIS should be integrated into existing as a sideline issue? monitoring and control systems and general IT
systems. Information derived from the system should be presented to management along with business performance, production performance, etc. Considering energy alone will result in the EMIS being sidelined.
. . . . . . . . . . . . . . . . . . . . . . . . . . . . . . . . . . . . . . . . . . . . . . . . . . . . . . . . . . . . . . . . . . . . . . . . . . . . . . . . . . . . . . . . . . . . . . . . . . . . . . . . . . . . . . .
❍ ❍ Has a budget allowance for support Ensure that the budget estimate includes an services been prepared and approved? allowance for support services such as site
commissioning, testing, training and site documentation, periodic technical assistance and troubleshooting.
. . . . . . . . . . . . . . . . . . . . . . . . . . . . . . . . . . . . . . . . . . . . . . . . . . . . . . . . . . . . . . . . . . . . . . . . . . . . . . . . . . . . . . . . . . . . . . . . . . . . . . . . . . . . . . .
❍ ❍ Has a front-end energy survey The eventual success of an EMIS will be gauged followed by cost-benefit analysis by its cost-benefit performance. A reasonable been completed? estimate of simple payback can be developed by
completing a front-end energy survey to determine probable annual energy cost savings and budget grade estimates of capital expenditure (can be obtained by consulting with vendors).
. . . . . . . . . . . . . . . . . . . . . . . . . . . . . . . . . . . . . . . . . . . . . . . . . . . . . . . . . . . . . . . . . . . . . . . . . . . . . . . . . . . . . . . . . . . . . . . . . . . . . . . . . . . . . . .
❍ ❍ Is there flexibility to refine the Be prepared to refine the design in line with design as required? management’s budgetary expectations. Extraneous
metering, data analysis capability, data storage and report production capability may have to be pared back to reduce costs. Before committing significant capital expenditure and staging the implementation, begin with a pilot project so that expected savings can be proven and increase support for the project. Initial payback can be enhanced by selecting systemapplications in only those areas that have a high likelihood of yielding significant savings.
. . . . . . . . . . . . . . . . . . . . . . . . . . . . . . . . . . . . . . . . . . . . . . . . . . . . . . . . . . . . . . . . . . . . . . . . . . . . . . . . . . . . . . . . . . . . . . . . . . . . . . . . . . . . . . .
❍ ❍ Is the preparation of a sound The capital allocation request process for most justification completed? organizations will demand that a well-presented
written and verbal case is made to senior manage-ment. This presentation should be factual, focusing on business goals, not technology.
. . . . . . . . . . . . . . . . . . . . . . . . . . . . . . . . . . . . . . . . . . . . . . . . . . . . . . . . . . . . . . . . . . . . . . . . . . . . . . . . . . . . . . . . . . . . . . . . . . . . . . . . . . . . . . .
10101010101010101010010101010101010101010101010101010101

010101010101010101010101
Energy Management Information Systems44
10101010101010101010010101010101010101010101

Effective Energy Reporting 45
1010101010101010101001010101010101010101010107Effective Energy Reporting
Overview
Effective energy reporting is an essential element of a successful EMIS. Reports arerequired for a range of individuals and departments in an organization, from operationspersonnel to the CEO. Each report must include relevant information in an easily understood format, and all data should be consistent.
The reports must provide information to enable the user to act. Operational staff needsto know when a problem has occurred as quickly as possible and know what they shoulddo about it. Senior management, on the other hand, needs summary information toknow that procedures and systems are working well. In order to design reports, it isimportant to understand who needs reports and why.
Existing reporting infrastructure should be used where possible. Graphical techniquescan be used with company intranets and the Internet, and the Web can facilitate access to reports anywhere, anytime. Figure 17 summarizes the topics addressed in this section.
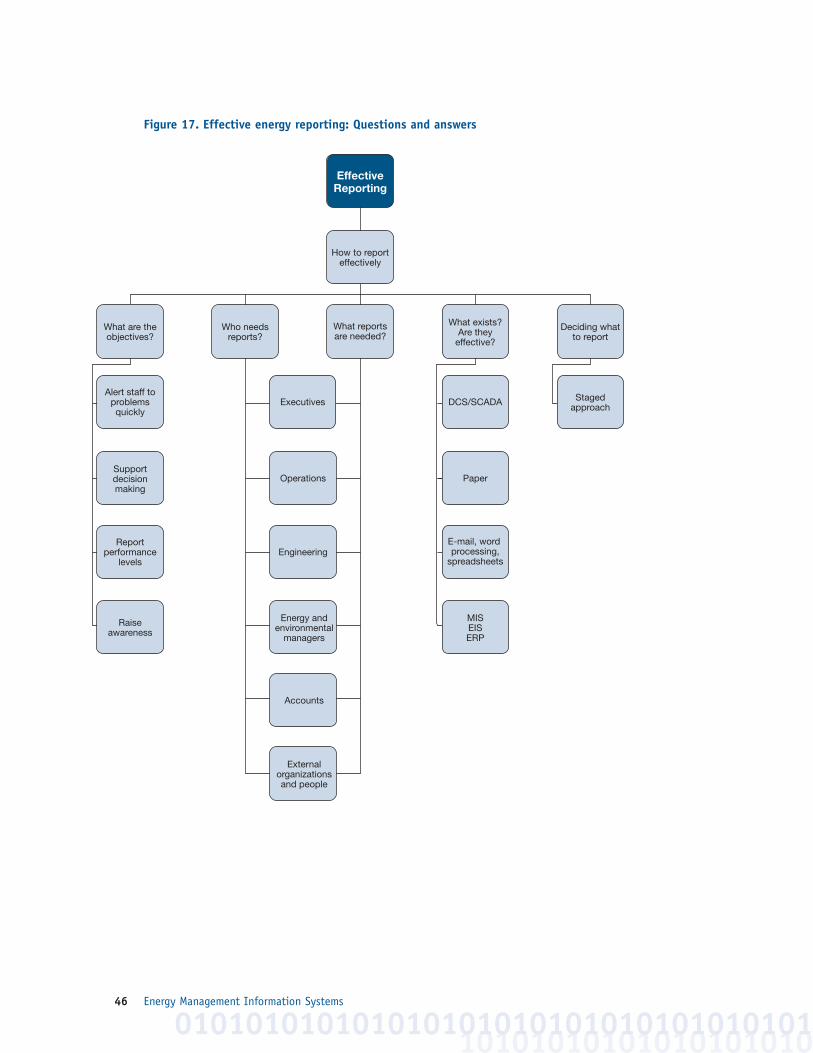
Energy Management Information Systems46
Figure 17. Effective energy reporting: Questions and answers
10101010101010101010010101010101010101010101010101010101
Who needs reports?
Alert staff toproblemsquickly
Supportdecision making
Operations Paper
Reportperformance
levelsEngineering
E-mail, word processing,
spreadsheets
Raiseawareness
Energy andenvironmental
managers
Accounts
Externalorganizationsand people
MISEISERP
How to report effectively
Effective Reporting
Executives DCS/SCADA Stagedapproach
What reports are needed?
What exists? Are they
effective?
Deciding what to report
What are the objectives?
Effective Energy Reporting 47
7.1 What Is an Effective Report?
The EMIS should include effective performance reporting to relevant personnel. This is to
• ensure that staff are alerted to problems in a timely manner• support effective decision making• report performance levels internally and externally• raise awareness and win support for energy management initiatives
A comprehensive EMIS will be targeted to a range of individuals and groups. These might include
• executives• operations management • operations personnel• engineering• accounting• energy and environmental management• external advisors• planners and schedulers• ad hoc users
Reports will differ for each user, but all should be founded on sound data regardingactual process performance, a robust analysis and performance targets.
Data presented must be consistent, and often it makes good sense for all reports to beavailable to all staff (unless there are significant issues with confidentiality). However,the reports designed for each user should be limited to what he or she needs in orderto effectively act. Avoid information overload; staff can consult reports that are moredetailed if they choose.
Ideally, reports should be readily available where and when they are needed. A Webinterface made available on the corporate/company intranet/network can be highlyeffective.
As a rule, reports should be tightly integrated into existing performance monitoringand management systems. For example, if operations staff relies on DCS or SCADA systems for information, display the results using these systems. If executives have an Executive Information System (EIS) that is used effectively, use it to communicateresults. Similarly, use the corporate energy Web site if one exists.
Moreover, energy reports should be subsets of general performance reports. Energy isseldom, if ever, the sole improvement objective and should be considered with otherfactors such as output, quality and reliability. Companies exist to make profit, not tosave energy, but the two are usually consistent with each other.
101010101010101010100101010101010101010101010101
Energy Management Information Systems48
Before designing reports and selecting reporting methods,it is important to
• understand who needs reports and why• understand what existing reporting systems are used
and where energy reports could be integrated• understand that needs will differ from one organization
to another
7.2 Who Requires Energy Reports?
Some of the individuals and groups that may require energy reports are discussed inthe following, along with possible reasons and the use the reports will be put to.
7.2.1 Executives
Senior executives will have overall responsibility for energy performance and may wellneed to report on and explain performance levels to the board or to senior management.They will have delegated the task of managing energy performance and will want tomeasure the effectiveness of the performance of the responsible individuals.
The availability of sound data that is well presented and, ideally, that demonstrates asuccessful energy improvement initiative will keep energy high on the executive andmanagement agenda and facilitate approval for expenditure and initiatives.
The executive will typically have little time to spend on energy issues and will requiredata presented clearly and simply that can be immediately understood. Detail will notgenerally be necessary. A standard format is a good idea – the chair of the executiveboard will become used to the information and will understand and expect it. Theinformation might include
• a summary of last year’s costs, broken down into key areas• a summary of the current year’s performance on a monthly basis
– against budget– against the previous year– against targets
• a note of the savings (or losses) achieved to date and how they were achieved• a note of additional savings opportunities and what actions are ongoing to address
them
A new report should be issued each month and be available in time for board meetings(with time for the executive to include figures in his or her own reports and ask anyquestions).
101010101010101010101010101010010101010101010101010101
Understand who needsreports and what existing
systems are in use.
Effective Energy Reporting 49
The reporting method will vary from paper-based reports or electronic documents thatcan be easily incorporated into board reports, to computer-based systems. The execu-tive may be using an EIS, be familiar with Web browsers or be familiar with a spread-sheet program or similar software.
7.2.2 Operations Management
Operations management will be responsible for operating processes and plant efficiency.They will need to know on a shift, daily, weekly or monthly basis (depending on thenature of the process and the level of energy use) what energy has been used and how this compares with various targets. The information will be used to
• measure and manage the effectiveness of operations personnel and process plant andsystems
• identify problem areas quickly• provide a basis for performance reporting (to executives)
The operations manager will typically require simple reports either via a Web interface,a word-processed document, a spreadsheet program or through an existing managementreporting system. The information may need to be incorporated into existing processand plant performance reports.
7.2.3 Operations Personnel
Operations personnel need to know when a problem has occurred and what needs to be done to rectify it. This information needs to be
• provided in a timely manner, which might mean within a few minutes of the event for a major energy-using process, or within a day or a week
• reported using a system that is easy to use and readily accessible (typically the DSC,SCADA or a Web browser interface)
Figure 18a illustrates an alert that energy performance has been poor over the last 10 minutes.
10101010101010101010010101010101010101010101010101010101
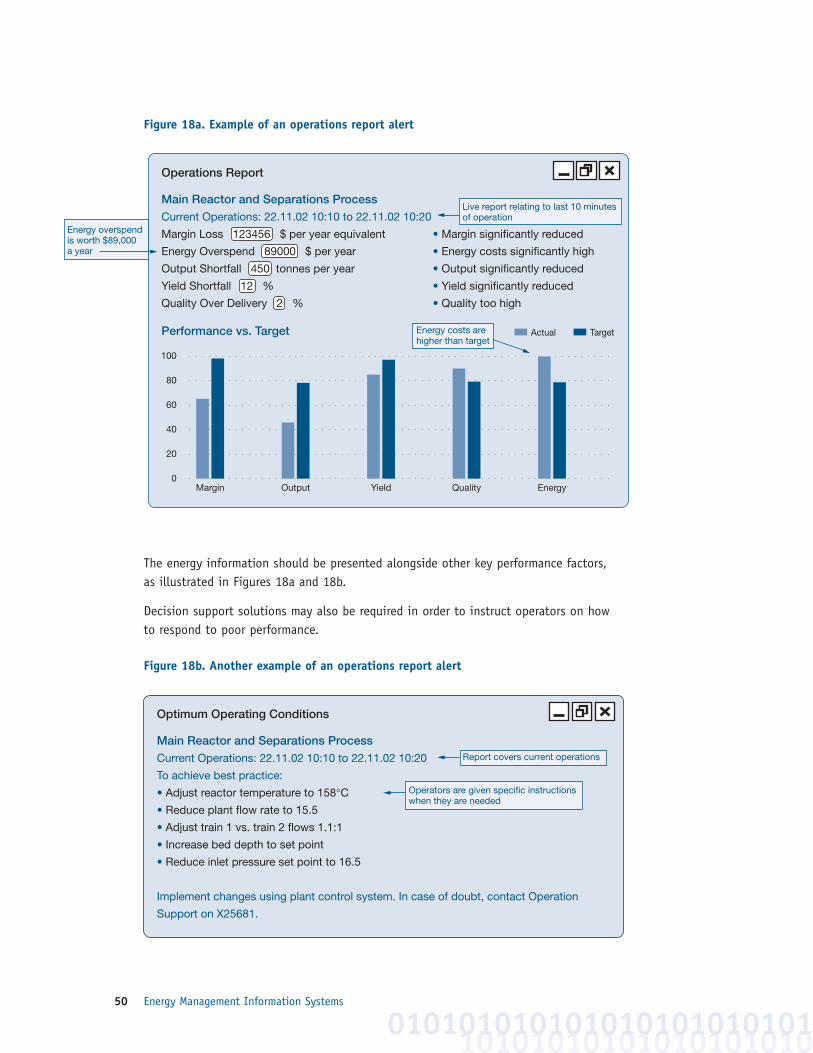
Energy Management Information Systems50
Figure 18a. Example of an operations report alert
The energy information should be presented alongside other key performance factors, as illustrated in Figures 18a and 18b.
Decision support solutions may also be required in order to instruct operators on howto respond to poor performance.
Figure 18b. Another example of an operations report alert
10101010101010101010010101010101010101010101
Operations Report
Main Reactor and Separations ProcessCurrent Operations: 22.11.02 10:10 to 22.11.02 10:20
Margin Loss 123456 $ per year equivalent • Margin significantly reduced
Energy Overspend 89000 $ per year • Energy costs significantly high
Output Shortfall 450 tonnes per year • Output significantly reduced
Yield Shortfall 12 % • Yield significantly reduced
Quality Over Delivery 2 % • Quality too high
Performance vs. Target
0
20
40
60
80
100
Margin Output Yield Quality Energy
Actual Target
Live report relating to last 10 minutes of operation
Energy costs are higher than target
Energy overspend is worth $89,000 a year
Optimum Operating Conditions
Main Reactor and Separations ProcessCurrent Operations: 22.11.02 10:10 to 22.11.02 10:20
To achieve best practice:
• Adjust reactor temperature to 158°C• Reduce plant flow rate to 15.5
• Adjust train 1 vs. train 2 flows 1.1:1
• Increase bed depth to set point
• Reduce inlet pressure set point to 16.5
Implement changes using plant control system. In case of doubt, contact Operation
Support on X25681.
Report covers current operations
Operators are given specific instructionswhen they are needed
Effective Energy Reporting 51
7.2.4 Engineering
Engineering staff has a number of roles, including operations, support and projects.
Engineers associated with operations will need reports similar to those for operationspersonnel (described in Section 7.2.3). Engineers may typically be involved with problems where there is more time to act (compared with process operators), for example, cleaning heat exchangers, solving a control problem or removing air from a refrigeration condenser.
Engineers who are not directly in operations but who provide support will need moredetailed historical information. Typically, these individuals will be involved in analysinghistorical performance, developing targets and modelling. They will require access tothe plant data historian and will use analysis tools, ranging from commonly availablespreadsheet software to advanced data mining and similar software.
Engineers that are involved in projects will need supporting data, for example, levels of energy use, process operating conditions, etc. They will also need access to the rawdata in the historian and access to analysis tools.
Energy data and associated analysis tools need to be well documented and supported.
7.2.5 Accounts
The accounts department may be interested in actual energy usages and costs to compare with budgets. They will need information that is broken down by departmentso that costs can be allocated to related activities. Accurate costing of operations and the cost of producing goods can improve decisions regarding product pricing, forexample, and the allocation of resources.
7.2.6 Energy and Environmental Managers
Energy and environmental managers will need summary data that identifies the performance achieved and trends, much like what executives and operations managersrequire. Like engineers, they may require more detailed information for specific analysis.
The environmental department may want energy consumption expressed as equivalentCO2 emissions, and the energy reports may need to be integrated into environmentalreports that are more general. Summary information may be required for annual energyand environmental reporting and may be needed more frequently by regulatory bodies.
The energy manager may be involved in energy purchasing as well as efficiency. He orshe may need information about the profile of energy use (using a half-hourly graph, forexample), peak usage, nighttime usage, etc. The energy manager will also need accessto the raw data in order to allow evaluation of purchasing options and to check bills.
101010101010101010100101010101010101
010101010101010101010101
Energy Management Information Systems52
The energy manager may also be responsible for managing tax rebates (e.g., theAccelerated Capital Cost Allowance provision 43.1 has a cogeneration performancerequirement that must be assessed for regulation applicability).
7.2.7 External Advisors
External advisors such as consultants will need access to raw data for detailed analysisand to summary data.
7.3 A Staged Approach
Consider the following approach in order to design effective reports.
Identify the target personnel – these are people whose involvement can help to saveenergy. Determine their specific needs:
• understand the existing performance reporting systems in use• evaluate the effectiveness and suitability of existing systems for energy information• discuss and agree on the format, content and timing of the reports with the users• focus especially on reports to operations personnel, including on-line monitoring and
decision support• implement reporting, making use of existing monitoring and data infrastructure• ensure adequate testing and ongoing support for the reporting systems• continuously revise and refine reports
Defining reporting needs will determine data analysis and monitoring/metering needs.It is an essential early stage task when developing an EMIS and follows the determina-tion of EMIS deliverables (see Section 2.3).
1010101010101010101001010101010101
Energy Data Analysis 53
1010101010101010101001010101010101010101010108Energy Data Analysis
Overview
The following discusses the analysis of energy data and is a key section of this hand-book. Effective data analysis is essential but is often not given appropriate priority. In fact, poor analysis of data can destroy the operation of an EMIS and result in misleading messages.
Energy data includes not only energy usage but key influencing factors as well. Datamust be collected at a higher frequency than any variations that are being studied.
The objectives of data analysis are to better understand energy use and costs, calculateperformance levels, calculate targets and model energy use. A range of techniques canbe utilized, from simple to complex. These should be selected to suit the problemsbeing addressed (rather than selecting an analysis technology and then finding a problem to suit).
The block diagram shown in Figure 19 summarizes the topics covered in this section.

Energy Management Information Systems54
Figure 19. Block diagram showing elements of energy data analysis
101010101010101010100101010101010101
Calculate performance
indicators
Efficiency measurePie charts Frequency
distribution
What is energy data?
Why do I need to
analyse data?
What is energy data
analysis?
Energy Data
Analysis
Specific energy useProfiles Scatter
plots
Average use
Contour plots Regression
Visualization Trend Response plots 3-D plots
Data mining Rule induction Parallel plots
Other statistical methods
Calculate targets Regression Averages Data
miningData
modelling
Modelling (what if? and optimization)
Data mining Neural nets,etc.
Understand variability
Statistical process control
Data preparation
Breakdown use and costs
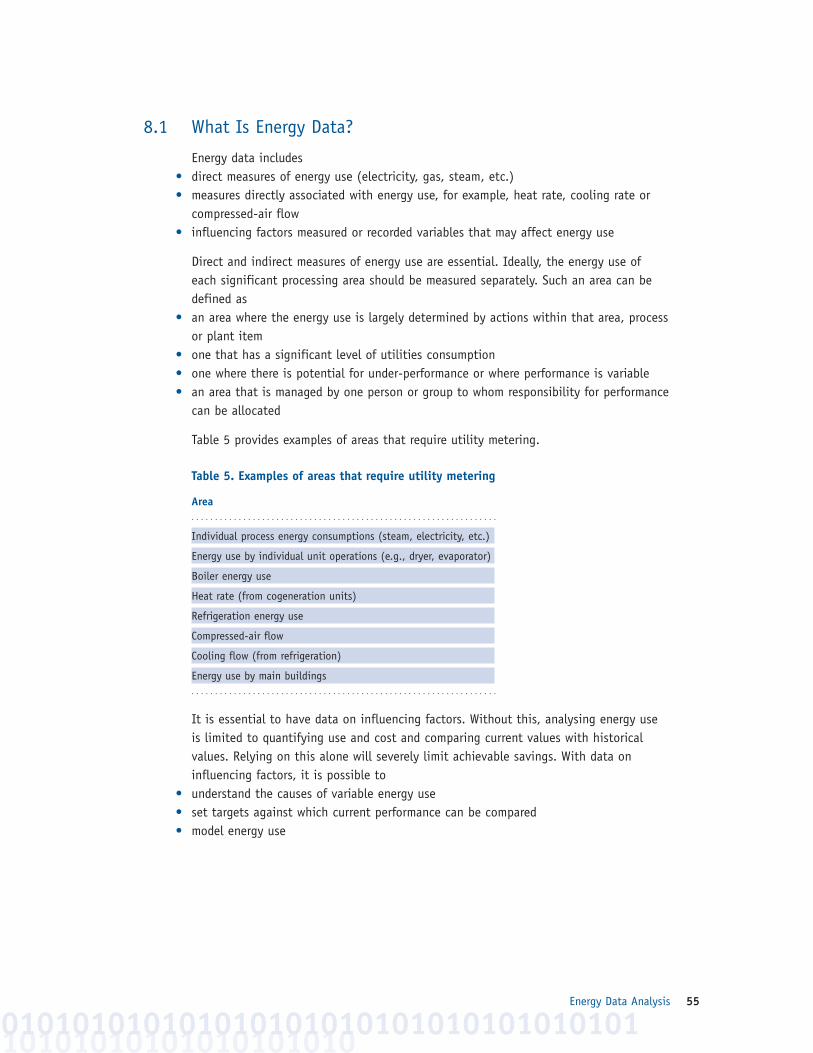
Energy Data Analysis 55
8.1 What Is Energy Data?
Energy data includes• direct measures of energy use (electricity, gas, steam, etc.)• measures directly associated with energy use, for example, heat rate, cooling rate or
compressed-air flow• influencing factors measured or recorded variables that may affect energy use
Direct and indirect measures of energy use are essential. Ideally, the energy use of each significant processing area should be measured separately. Such an area can bedefined as
• an area where the energy use is largely determined by actions within that area, processor plant item
• one that has a significant level of utilities consumption• one where there is potential for under-performance or where performance is variable• an area that is managed by one person or group to whom responsibility for performance
can be allocated
Table 5 provides examples of areas that require utility metering.
Table 5. Examples of areas that require utility metering
Area. . . . . . . . . . . . . . . . . . . . . . . . . . . . . . . . . . . . . . . . . . . . . . . . . . . . . . . . . . . . . . . . .
Individual process energy consumptions (steam, electricity, etc.)
Energy use by individual unit operations (e.g., dryer, evaporator)
Boiler energy use
Heat rate (from cogeneration units)
Refrigeration energy use
Compressed-air flow
Cooling flow (from refrigeration)
Energy use by main buildings . . . . . . . . . . . . . . . . . . . . . . . . . . . . . . . . . . . . . . . . . . . . . . . . . . . . . . . . . . . . . . . . .
It is essential to have data on influencing factors. Without this, analysing energy useis limited to quantifying use and cost and comparing current values with historical values. Relying on this alone will severely limit achievable savings. With data on influencing factors, it is possible to
• understand the causes of variable energy use• set targets against which current performance can be compared• model energy use
10101010101010101010010101010101010101010101010101010101
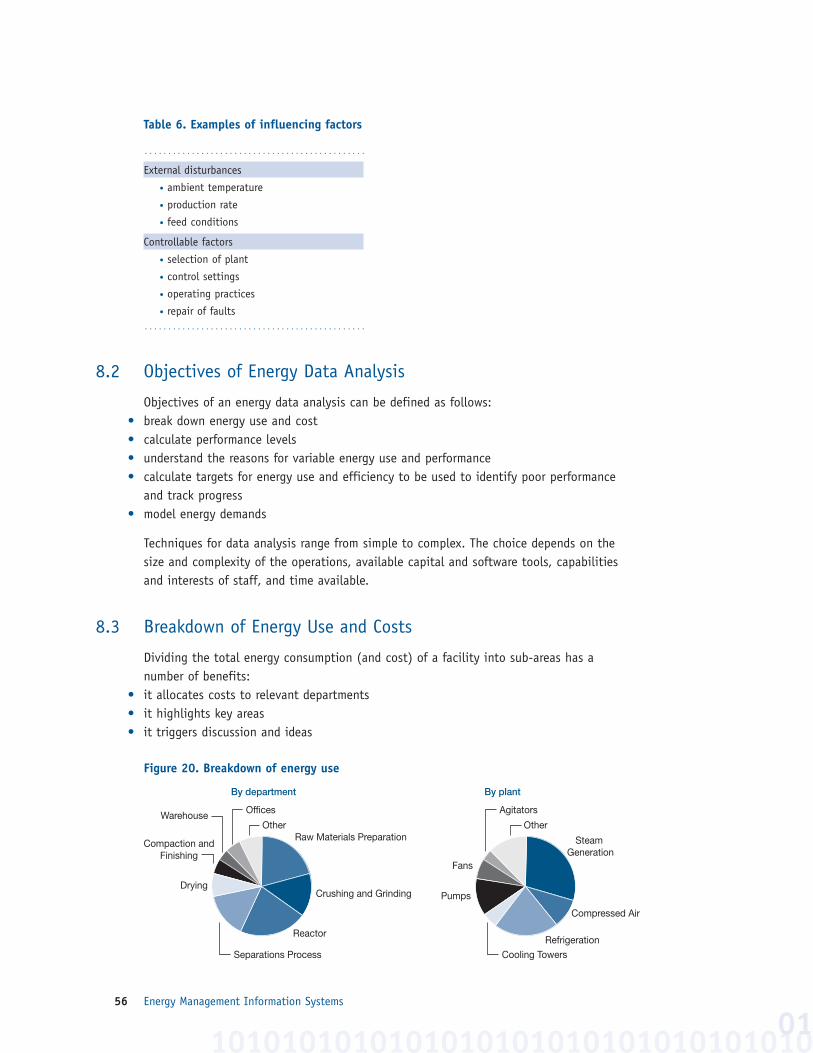
Energy Management Information Systems56
Table 6. Examples of influencing factors
. . . . . . . . . . . . . . . . . . . . . . . . . . . . . . . . . . . . . . . . . . . . . . .
External disturbances
• ambient temperature
• production rate
• feed conditions
Controllable factors
• selection of plant
• control settings
• operating practices
• repair of faults. . . . . . . . . . . . . . . . . . . . . . . . . . . . . . . . . . . . . . . . . . . . . . .
8.2 Objectives of Energy Data Analysis
Objectives of an energy data analysis can be defined as follows: • break down energy use and cost• calculate performance levels• understand the reasons for variable energy use and performance• calculate targets for energy use and efficiency to be used to identify poor performance
and track progress• model energy demands
Techniques for data analysis range from simple to complex. The choice depends on thesize and complexity of the operations, available capital and software tools, capabilitiesand interests of staff, and time available.
8.3 Breakdown of Energy Use and Costs
Dividing the total energy consumption (and cost) of a facility into sub-areas has anumber of benefits:
• it allocates costs to relevant departments• it highlights key areas• it triggers discussion and ideas
Figure 20. Breakdown of energy use
101010101010101010101010101010101001
Raw Materials Preparation
By department By plant
Crushing and Grinding
Reactor
Separations Process
Drying
Compaction and Finishing
Warehouse Offices
Other
Steam Generation
Compressed Air
Refrigeration
Cooling Towers
Pumps
Fans
Agitators
Other
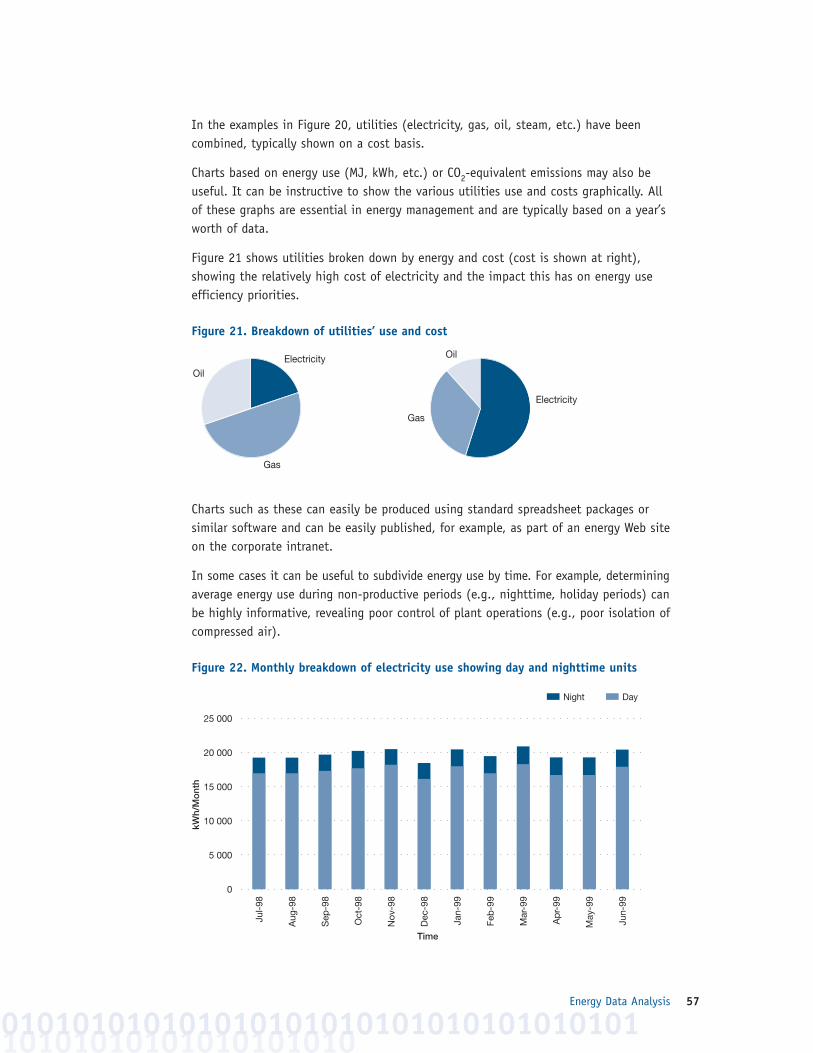
Energy Data Analysis 57
In the examples in Figure 20, utilities (electricity, gas, oil, steam, etc.) have beencombined, typically shown on a cost basis.
Charts based on energy use (MJ, kWh, etc.) or CO2-equivalent emissions may also beuseful. It can be instructive to show the various utilities use and costs graphically. Allof these graphs are essential in energy management and are typically based on a year’sworth of data.
Figure 21 shows utilities broken down by energy and cost (cost is shown at right),showing the relatively high cost of electricity and the impact this has on energy useefficiency priorities.
Figure 21. Breakdown of utilities’ use and cost
Charts such as these can easily be produced using standard spreadsheet packages orsimilar software and can be easily published, for example, as part of an energy Web siteon the corporate intranet.
In some cases it can be useful to subdivide energy use by time. For example, determiningaverage energy use during non-productive periods (e.g., nighttime, holiday periods) canbe highly informative, revealing poor control of plant operations (e.g., poor isolation ofcompressed air).
Figure 22. Monthly breakdown of electricity use showing day and nighttime units
10101010101010101010010101010101010101010101010101010101
Electricity
Gas
Oil
Electricity
Gas
Oil
0
25 000
20 000
15 000
10 000
5 000
Time
kWh/
Mo
nth
Night Day
Jul-
98
Aug
-98
Sep
-98
Oct
-98
Nov
-98
Dec
-98
Jan-
99
Feb
-99
Mar
-99
Ap
r-99
May
-99
Jun-
99
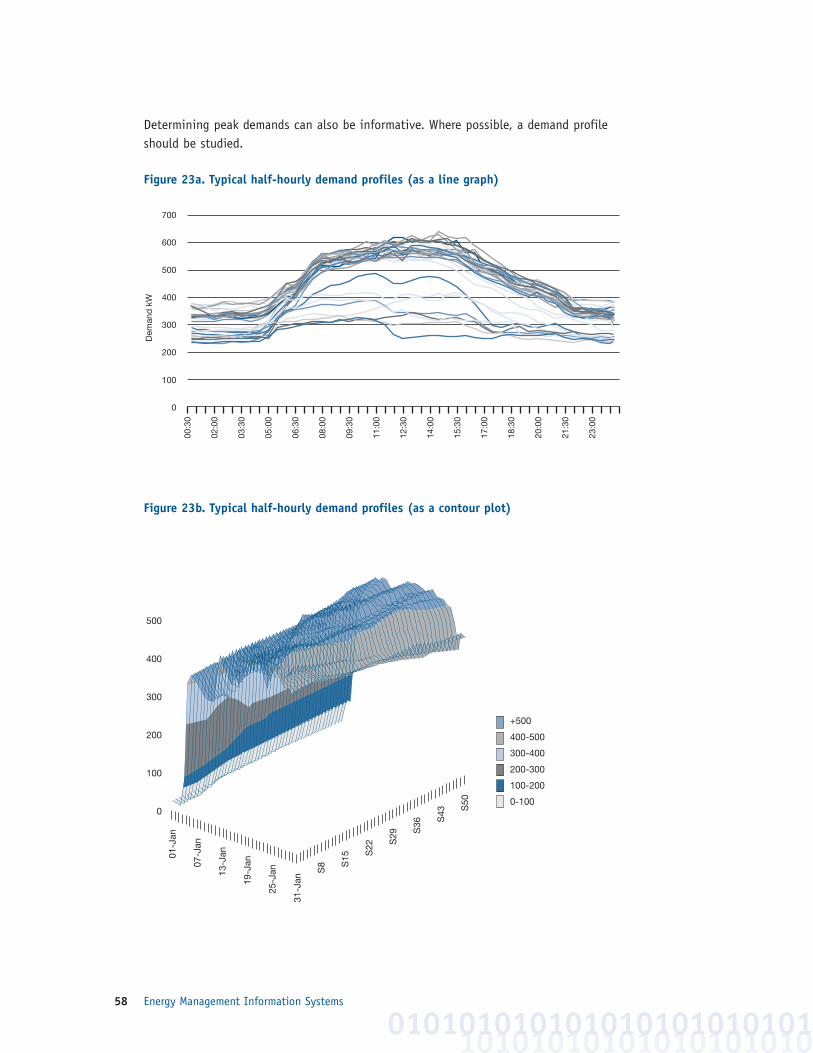
Energy Management Information Systems58
Determining peak demands can also be informative. Where possible, a demand profileshould be studied.
Figure 23a. Typical half-hourly demand profiles (as a line graph)
Figure 23b. Typical half-hourly demand profiles (as a contour plot)
10101010101010101010010101010101010101010101
0
100
200
300
400
500
600
700
00:3
0
02:0
0
03:3
0
05:0
0
06:3
0
08:0
0
09:3
0
11:0
0
12:3
0
14:0
0
15:3
0
17:0
0
18:3
0
20:0
0
21:3
0
23:0
0
Dem
and
kW
01-J
an
07-J
an
13-J
an
19-J
an
25-J
an
31-J
an
S8 S
15 S22 S
29 S36 S
43 S50
500
400
300
200
100
0
+500
400-500
300-400
200-300
100-200
0-100
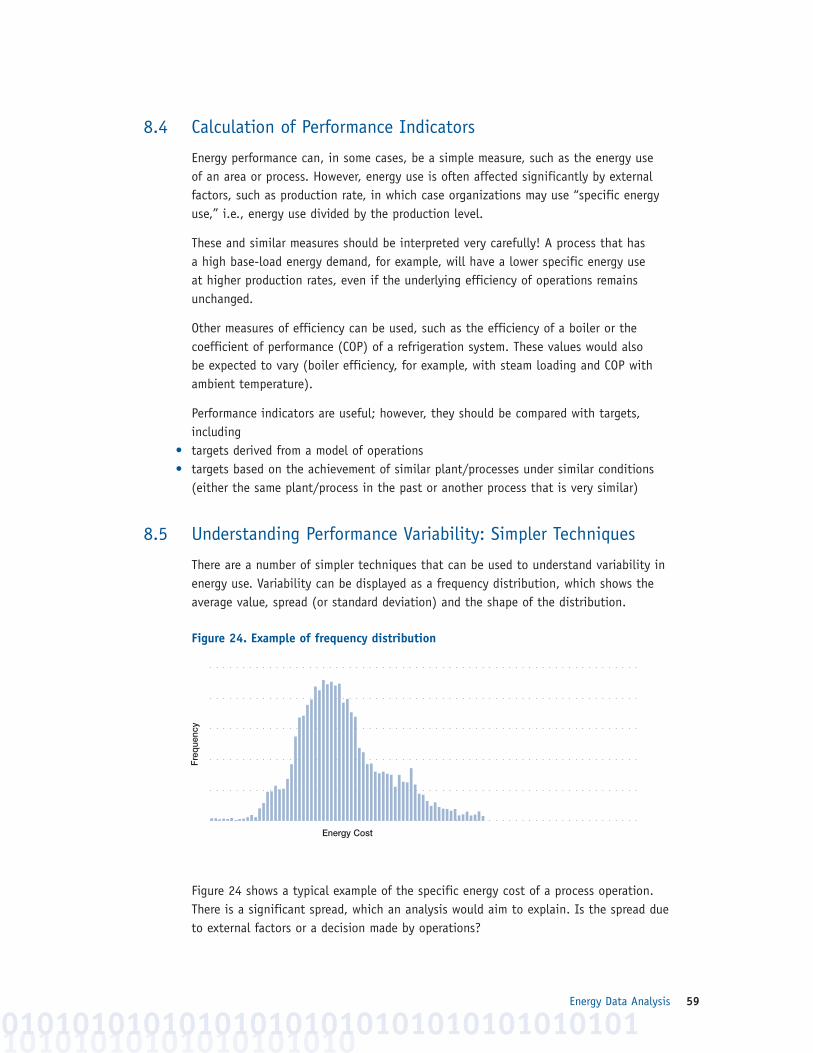
Energy Data Analysis 59
8.4 Calculation of Performance Indicators
Energy performance can, in some cases, be a simple measure, such as the energy use of an area or process. However, energy use is often affected significantly by externalfactors, such as production rate, in which case organizations may use “specific energyuse,” i.e., energy use divided by the production level.
These and similar measures should be interpreted very carefully! A process that has a high base-load energy demand, for example, will have a lower specific energy use at higher production rates, even if the underlying efficiency of operations remainsunchanged.
Other measures of efficiency can be used, such as the efficiency of a boiler or the coefficient of performance (COP) of a refrigeration system. These values would also be expected to vary (boiler efficiency, for example, with steam loading and COP withambient temperature).
Performance indicators are useful; however, they should be compared with targets,including
• targets derived from a model of operations • targets based on the achievement of similar plant/processes under similar conditions
(either the same plant/process in the past or another process that is very similar)
8.5 Understanding Performance Variability: Simpler Techniques
There are a number of simpler techniques that can be used to understand variability inenergy use. Variability can be displayed as a frequency distribution, which shows theaverage value, spread (or standard deviation) and the shape of the distribution.
Figure 24. Example of frequency distribution
Figure 24 shows a typical example of the specific energy cost of a process operation.There is a significant spread, which an analysis would aim to explain. Is the spread dueto external factors or a decision made by operations?
10101010101010101010010101010101010101010101010101010101
Energy Cost
Freq
uenc
y
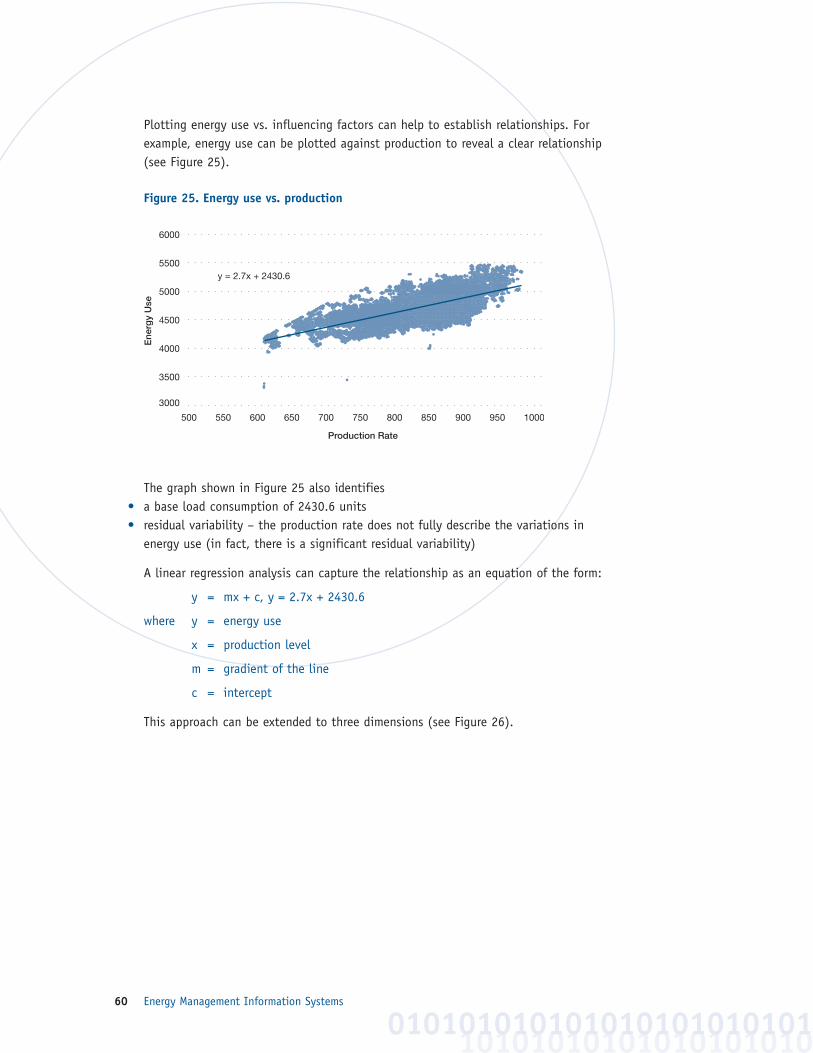
Energy Management Information Systems60
Plotting energy use vs. influencing factors can help to establish relationships. Forexample, energy use can be plotted against production to reveal a clear relationship(see Figure 25).
Figure 25. Energy use vs. production
The graph shown in Figure 25 also identifies• a base load consumption of 2430.6 units• residual variability – the production rate does not fully describe the variations in
energy use (in fact, there is a significant residual variability)
A linear regression analysis can capture the relationship as an equation of the form:
y = mx + c, y = 2.7x + 2430.6
where y = energy use
x = production level
m = gradient of the line
c = intercept
This approach can be extended to three dimensions (see Figure 26).
10101010101010101010010101010101010101010101
500
3000
4000
3500
4500
5000
5500
6000
550 600 650 700 750 800 850 900 950 1000
Ene
rgy
Use
Production Rate
y = 2.7x + 2430.6
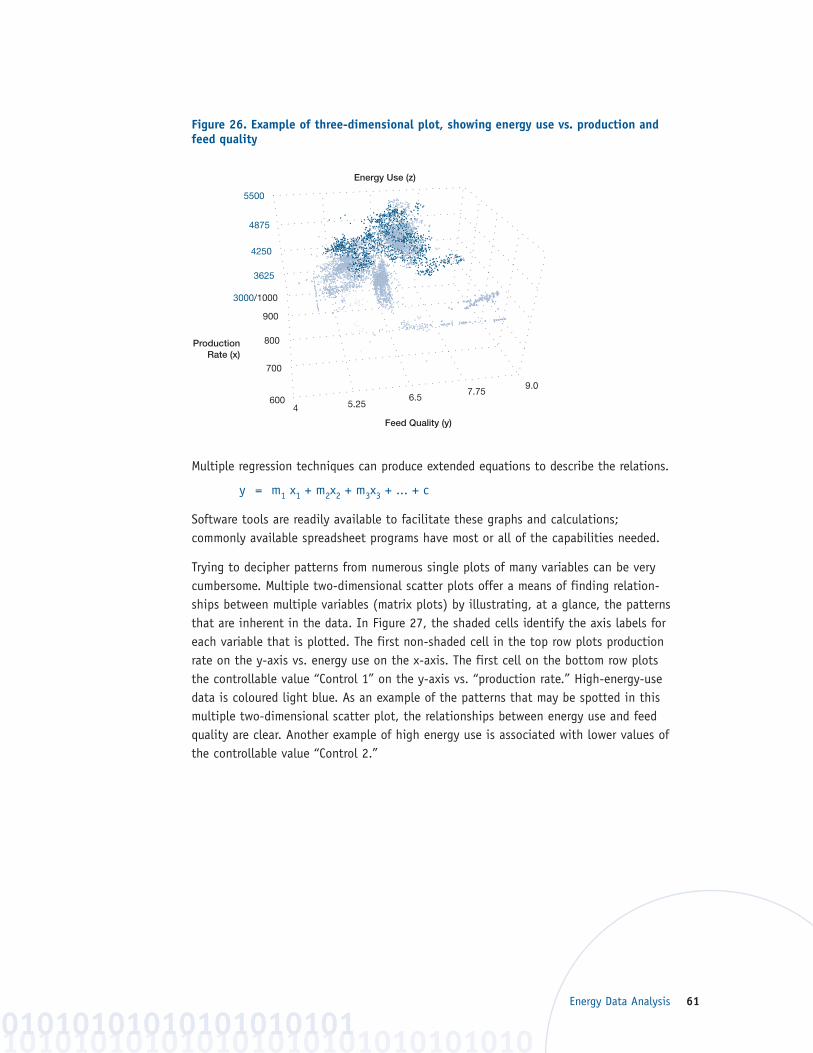
Energy Data Analysis 61
Figure 26. Example of three-dimensional plot, showing energy use vs. production andfeed quality
Multiple regression techniques can produce extended equations to describe the relations.
y = m1 x1 + m2x2 + m3x3 + ... + c
Software tools are readily available to facilitate these graphs and calculations; commonly available spreadsheet programs have most or all of the capabilities needed.
Trying to decipher patterns from numerous single plots of many variables can be verycumbersome. Multiple two-dimensional scatter plots offer a means of finding relation-ships between multiple variables (matrix plots) by illustrating, at a glance, the patternsthat are inherent in the data. In Figure 27, the shaded cells identify the axis labels foreach variable that is plotted. The first non-shaded cell in the top row plots productionrate on the y-axis vs. energy use on the x-axis. The first cell on the bottom row plotsthe controllable value “Control 1” on the y-axis vs. “production rate.” High-energy-usedata is coloured light blue. As an example of the patterns that may be spotted in thismultiple two-dimensional scatter plot, the relationships between energy use and feedquality are clear. Another example of high energy use is associated with lower values ofthe controllable value “Control 2.”
10101010101010101010101010101001010101010101010101
Feed Quality (y)
Energy Use (z)
Production Rate (x)
5500
4875
4250
3625
3000/1000
900
800
700
6004 5.25
6.57.75
9.0
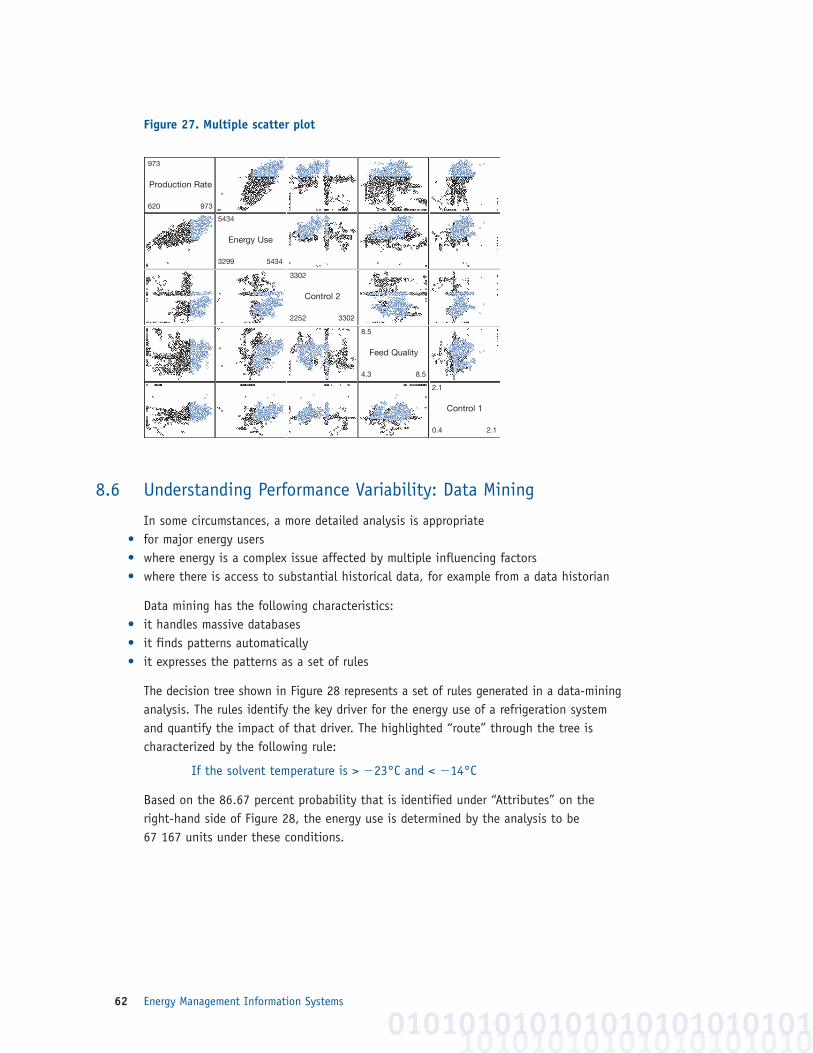
Energy Management Information Systems62
Figure 27. Multiple scatter plot
8.6 Understanding Performance Variability: Data Mining
In some circumstances, a more detailed analysis is appropriate• for major energy users• where energy is a complex issue affected by multiple influencing factors• where there is access to substantial historical data, for example from a data historian
Data mining has the following characteristics:• it handles massive databases• it finds patterns automatically• it expresses the patterns as a set of rules
The decision tree shown in Figure 28 represents a set of rules generated in a data-mininganalysis. The rules identify the key driver for the energy use of a refrigeration systemand quantify the impact of that driver. The highlighted “route” through the tree ischaracterized by the following rule:
If the solvent temperature is > 223°C and < 214°C
Based on the 86.67 percent probability that is identified under “Attributes” on theright-hand side of Figure 28, the energy use is determined by the analysis to be 67 167 units under these conditions.
10101010101010101010010101010101010101010101
973
Production Rate
620 973
5434
Energy Use
3299 5434
3302
Control 2
2252 3302
8.5
Feed Quality
4.3 8.5
2.1
Control 1
0.4 2.1

Energy Data Analysis 63
Rules are generated automatically in such an analysis. The user defines only the objectives and influencing factors. The process essentially subdivides historical opera-tions into modes; where energy use is different, the modes are characterized by rules.
Figure 28. Simple decision tree
A real analysis will create substantially more complex decision trees (there are morecomplex rules), such as the one illustrated in Figure 29. Such a tree will
• identify key drivers• quantify the impact on energy use• identify the best operating modes
Figure 29 identifies a node path for the liquid flow and reagent use that determines a50.59 percent probability that energy consumption will be 193 965 units under theseconditions.
10101010101010101010010101010101010101010101010101010101
All
Solvent Temperature <=-24.4260864257813
Solvent Temperature >-24.4260864257813 a...
Solvent Temperature >-23.1069660186768 a...
Solvent Temperature >-14.0492753982544
Attributes
Value Cases Probability
Totals Histogram
(Node Total) 100.00%41470.3874511719 3.33%56979.9409179688 3.33%63608.8430175782 3.33%67167.8861083985 86.67%missing 3.33%
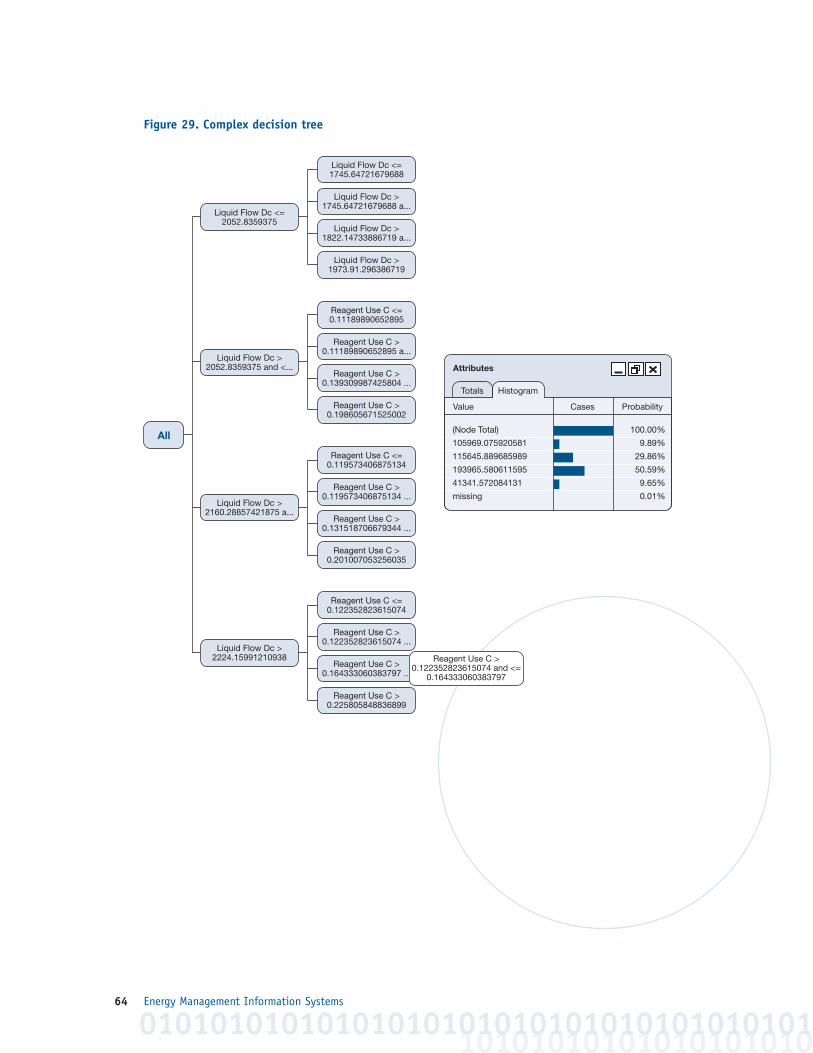
Energy Management Information Systems64
Figure 29. Complex decision tree
1010101010101010101001010101010101010101010101010101010101
All
Reagent Use C >0.11189890652895 a...
Reagent Use C <=0.11189890652895
Reagent Use C >0.198605671525002
Reagent Use C >0.139309987425804 ...
Liquid Flow Dc >2052.8359375 and <...
Reagent Use C >0.119573406875134 ...
Reagent Use C <=0.119573406875134
Reagent Use C >0.201007053256035
Reagent Use C >0.131518706679344 ...
Liquid Flow Dc >2160.28857421875 a...
Reagent Use C >0.122352823615074 ...
Reagent Use C <=0.122352823615074
Reagent Use C >0.225805848836899
Reagent Use C >0.164333060383797 ...
Reagent Use C >0.122352823615074 and <=
0.164333060383797
Liquid Flow Dc >2224.15991210938
Attributes
Value Cases Probability
Totals Histogram
(Node Total) 100.00%
105969.075920581 9.89%
115645.889685989 29.86%
193965.580611595 50.59%
41341.572084131 9.65%
missing 0.01%
Liquid Flow Dc <=2052.8359375
Liquid Flow Dc >1745.64721679688 a...
Liquid Flow Dc <=1745.64721679688
Liquid Flow Dc >1973.91.296386719
Liquid Flow Dc >1822.14733886719 a...
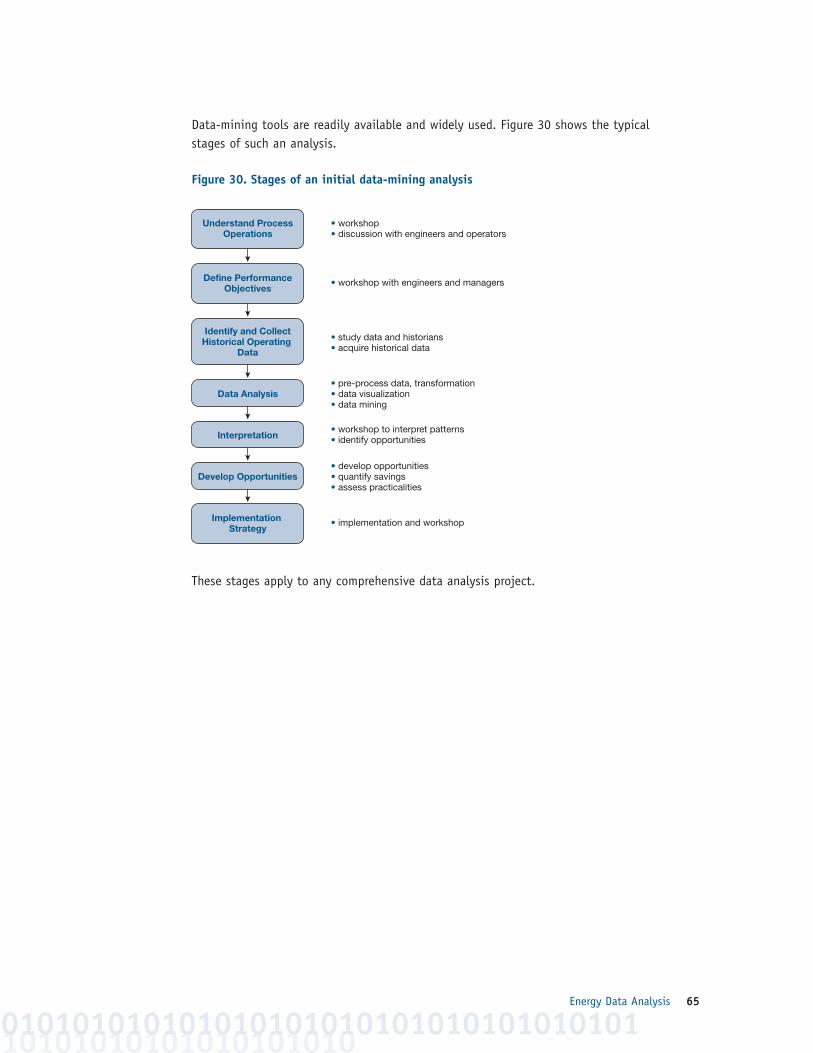
Energy Data Analysis 65
Data-mining tools are readily available and widely used. Figure 30 shows the typicalstages of such an analysis.
Figure 30. Stages of an initial data-mining analysis
These stages apply to any comprehensive data analysis project.
10101010101010101010010101010101010101010101010101010101
Understand Process Operations
Define Performance Objectives
Identify and Collect Historical Operating
Data
Data Analysis
Interpretation
Develop Opportunities
Implementation Strategy
• workshop • discussion with engineers and operators
• workshop with engineers and managers
• study data and historians • acquire historical data
• pre-process data, transformation • data visualization • data mining
• workshop to interpret patterns • identify opportunities
• develop opportunities • quantify savings • assess practicalities
• implementation and workshop
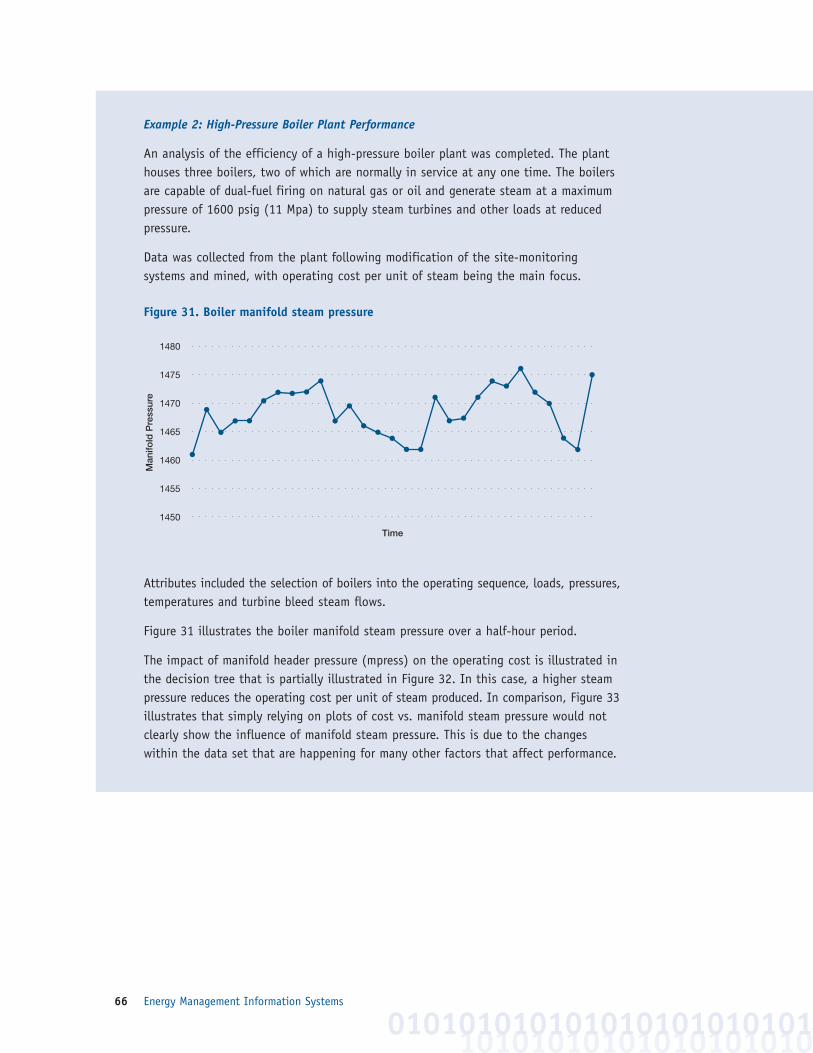
Energy Management Information Systems66
Example 2: High-Pressure Boiler Plant Performance
An analysis of the efficiency of a high-pressure boiler plant was completed. The planthouses three boilers, two of which are normally in service at any one time. The boilersare capable of dual-fuel firing on natural gas or oil and generate steam at a maximumpressure of 1600 psig (11 Mpa) to supply steam turbines and other loads at reducedpressure.
Data was collected from the plant following modification of the site-monitoring systems and mined, with operating cost per unit of steam being the main focus.
Figure 31. Boiler manifold steam pressure
Attributes included the selection of boilers into the operating sequence, loads, pressures,temperatures and turbine bleed steam flows.
Figure 31 illustrates the boiler manifold steam pressure over a half-hour period.
The impact of manifold header pressure (mpress) on the operating cost is illustrated inthe decision tree that is partially illustrated in Figure 32. In this case, a higher steampressure reduces the operating cost per unit of steam produced. In comparison, Figure 33illustrates that simply relying on plots of cost vs. manifold steam pressure would notclearly show the influence of manifold steam pressure. This is due to the changeswithin the data set that are happening for many other factors that affect performance.
10101010101010101010010101010101010101010101
1450
1480
1475
1470
1465
1460
1455
Man
ifold
Pre
ssur
e
Time
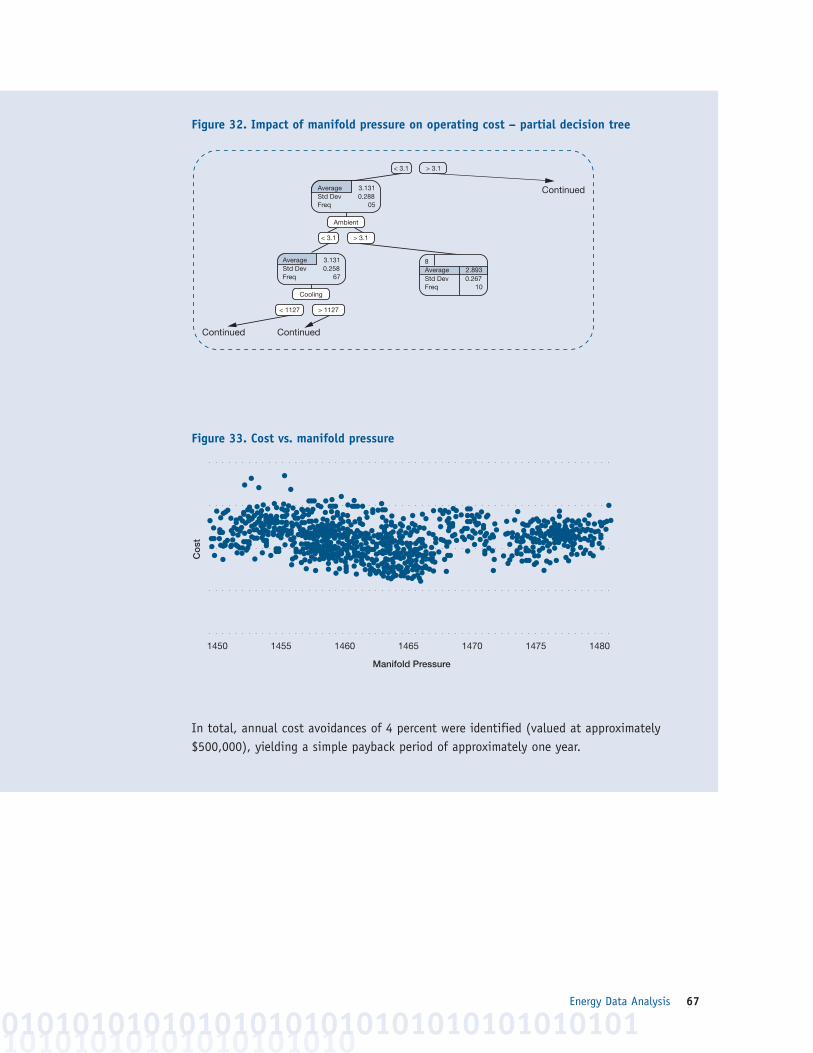
Energy Data Analysis 67
Figure 32. Impact of manifold pressure on operating cost – partial decision tree
Figure 33. Cost vs. manifold pressure
In total, annual cost avoidances of 4 percent were identified (valued at approximately$500,000), yielding a simple payback period of approximately one year.
10101010101010101010010101010101010101010101010101010101
1450 1455 1460 1465 1470 1475 1480
Co
st
Manifold Pressure
Average 3.131
< 3.1 > 3.1
Std Dev 0.288Freq 05
Ambient
Average 3.131
< 1127 > 1127
Std Dev 0.258Freq 67
Cooling
< 3.1 > 3.1
8Average 2.893
Continued
ContinuedContinued
Std Dev 0.267Freq 10
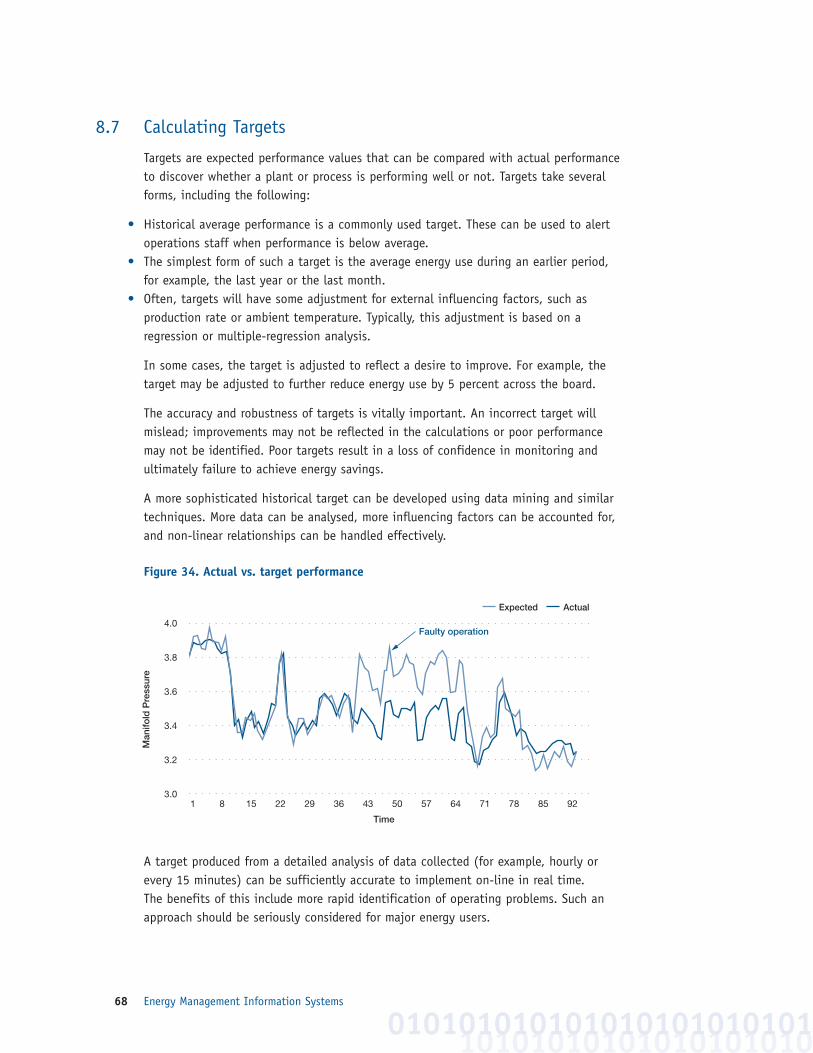
Energy Management Information Systems68
8.7 Calculating Targets
Targets are expected performance values that can be compared with actual performanceto discover whether a plant or process is performing well or not. Targets take severalforms, including the following:
• Historical average performance is a commonly used target. These can be used to alertoperations staff when performance is below average.
• The simplest form of such a target is the average energy use during an earlier period,for example, the last year or the last month.
• Often, targets will have some adjustment for external influencing factors, such as production rate or ambient temperature. Typically, this adjustment is based on a regression or multiple-regression analysis.
In some cases, the target is adjusted to reflect a desire to improve. For example, thetarget may be adjusted to further reduce energy use by 5 percent across the board.
The accuracy and robustness of targets is vitally important. An incorrect target willmislead; improvements may not be reflected in the calculations or poor performancemay not be identified. Poor targets result in a loss of confidence in monitoring andultimately failure to achieve energy savings.
A more sophisticated historical target can be developed using data mining and similartechniques. More data can be analysed, more influencing factors can be accounted for,and non-linear relationships can be handled effectively.
Figure 34. Actual vs. target performance
A target produced from a detailed analysis of data collected (for example, hourly orevery 15 minutes) can be sufficiently accurate to implement on-line in real time. The benefits of this include more rapid identification of operating problems. Such anapproach should be seriously considered for major energy users.
10101010101010101010010101010101010101010101
3.0
4.0
3.8
3.6
3.4
3.2
Man
ifold
Pre
ssur
e
Faulty operation
Expected Actual
1 15 22 29 36 43 50 57 64 71 78 858 92
Time
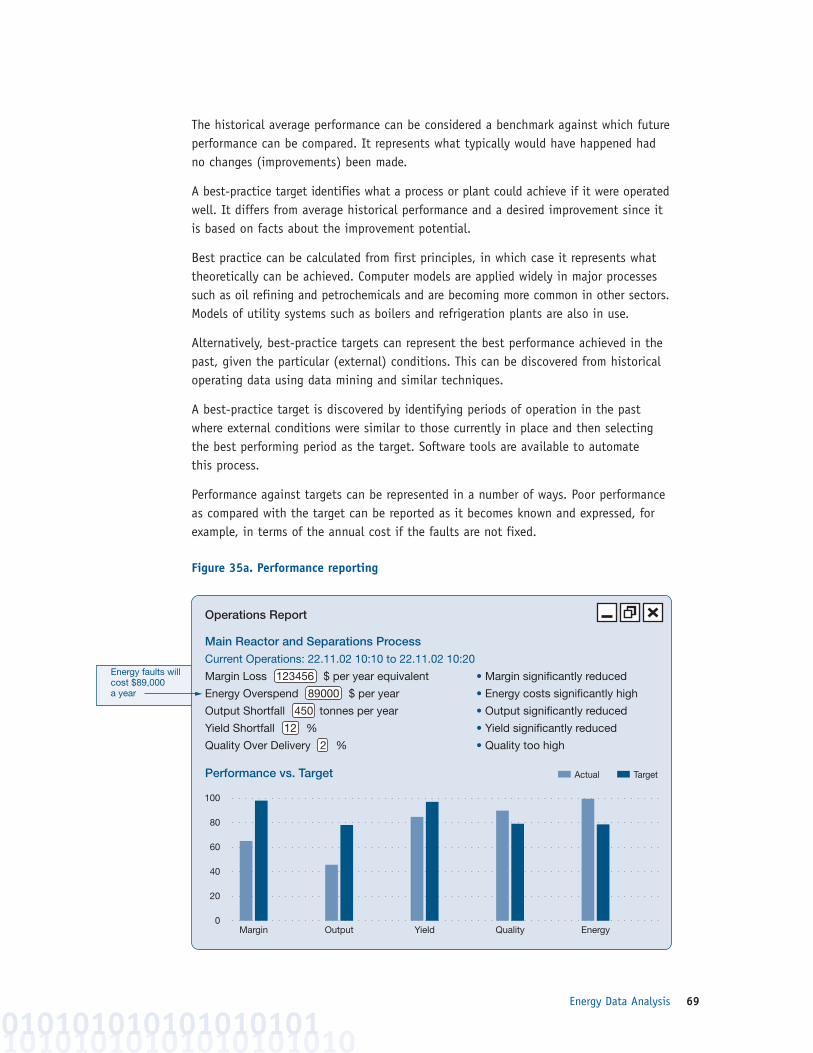
Energy Data Analysis 69
The historical average performance can be considered a benchmark against which futureperformance can be compared. It represents what typically would have happened hadno changes (improvements) been made.
A best-practice target identifies what a process or plant could achieve if it were operatedwell. It differs from average historical performance and a desired improvement since itis based on facts about the improvement potential.
Best practice can be calculated from first principles, in which case it represents whattheoretically can be achieved. Computer models are applied widely in major processessuch as oil refining and petrochemicals and are becoming more common in other sectors.Models of utility systems such as boilers and refrigeration plants are also in use.
Alternatively, best-practice targets can represent the best performance achieved in thepast, given the particular (external) conditions. This can be discovered from historicaloperating data using data mining and similar techniques.
A best-practice target is discovered by identifying periods of operation in the pastwhere external conditions were similar to those currently in place and then selectingthe best performing period as the target. Software tools are available to automate this process.
Performance against targets can be represented in a number of ways. Poor performanceas compared with the target can be reported as it becomes known and expressed, forexample, in terms of the annual cost if the faults are not fixed.
Figure 35a. Performance reporting
10101010101010101010010101010101010101
Operations Report
Main Reactor and Separations ProcessCurrent Operations: 22.11.02 10:10 to 22.11.02 10:20
Margin Loss 123456 $ per year equivalent • Margin significantly reduced
Energy Overspend 89000 $ per year • Energy costs significantly high
Output Shortfall 450 tonnes per year • Output significantly reduced
Yield Shortfall 12 % • Yield significantly reduced
Quality Over Delivery 2 % • Quality too high
Performance vs. Target
0
20
40
60
80
100
Margin Output Yield Quality Energy
Actual Target
Energy faults will cost $89,000 a year

Energy Management Information Systems70
Figure 35b. CUSUM reporting (as a line graph)
Figure 35c. CUSUM reporting (as monthly, weekly or yearly summaries)
10101010101010101010010101010101010101010101
Operations Report
Main Reactor and Separations Process - Energy CostLast Eight Hours: 22.11.02 16:00 to 22.11.02 24:00
Energy Overspend 123456 $ per year equivalent
• Improving trend
• Recent performance good
Performance vs. Target
0.0
4.0
3.5
3.0
2.5
2.0
1.5
1.0
Actual Target
2 4 6 8 10 12 14 16 18 20 22 24 26 28 30 32
Executive Report
Entire Manufacturing FacilityMonthly: January to December 2002
Margin Loss 123456 $ per year equivalent
• Significant margin loss
• Improving trend
• Recent performance good
• Worst performance January and July
• Best performance November and December
Performance vs. Target
0
20
40
60
80
100
Jan Feb Mar Apr May Jun Jul Aug Sep Oct Nov Dec
Actual Target Best Practice
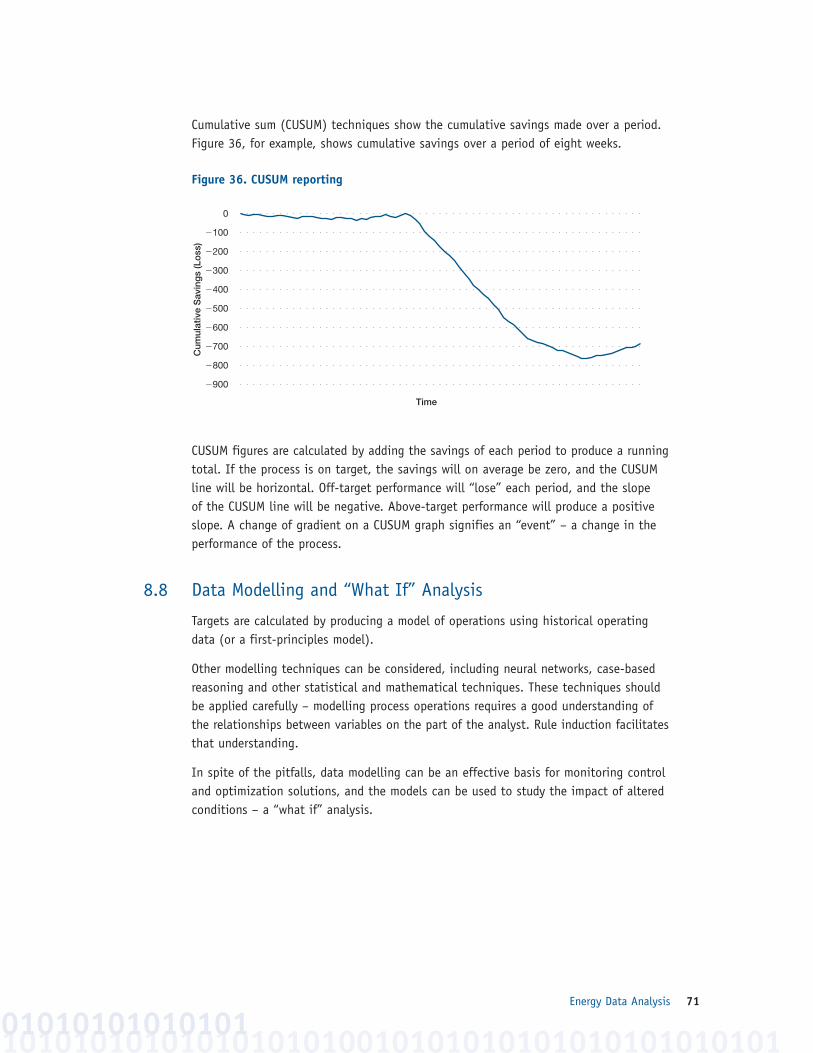
Energy Data Analysis 71
Cumulative sum (CUSUM) techniques show the cumulative savings made over a period.Figure 36, for example, shows cumulative savings over a period of eight weeks.
Figure 36. CUSUM reporting
CUSUM figures are calculated by adding the savings of each period to produce a runningtotal. If the process is on target, the savings will on average be zero, and the CUSUMline will be horizontal. Off-target performance will “lose” each period, and the slope of the CUSUM line will be negative. Above-target performance will produce a positiveslope. A change of gradient on a CUSUM graph signifies an “event” – a change in theperformance of the process.
8.8 Data Modelling and “What If” Analysis
Targets are calculated by producing a model of operations using historical operatingdata (or a first-principles model).
Other modelling techniques can be considered, including neural networks, case-basedreasoning and other statistical and mathematical techniques. These techniques shouldbe applied carefully – modelling process operations requires a good understanding ofthe relationships between variables on the part of the analyst. Rule induction facilitatesthat understanding.
In spite of the pitfalls, data modelling can be an effective basis for monitoring controland optimization solutions, and the models can be used to study the impact of alteredconditions – a “what if” analysis.
1010101010101010101001010101010101010101010101010101010101
2900
2200
2300
2100
0
2400
2500
2600
2700
2800
Time
Cum
ulat
ive
Sav
ing
s (L
oss
)

010101010101010101010101
Energy Management Information Systems72
10101010101010101010010101010101010101010101

Metering and Measurement 73
1010101010101010101001010101010101010101010109Metering and Measurement
Overview
This section discusses the characteristics of available metering and the required infrastructure to collect and store data.
Outlined in the following is an approach to guide the end-user toward implementing a metering and measurement system, bearing in mind the following key questions:
• Do I need any additional meters to manage energy use?• How do I decide where to install meters?• What meters should I use?• How do I link these meters to my monitoring systems?• Can I afford them? If not, what are the priorities?• What are the practical and other issues I need to know about?
A structured approach to developing a measurement plan is illustrated in Figure 37.
Figure 37. Measurement plan – A structured approach
Electricity Natural Gas Steam
Meters
Measurement Plan
Review Existing Site Plans
Develop a Meter List
Assign Energy Accountability
Centres
Decide on Additional Metering or Measurement
Water and Condensate
Compressed Air
Data Loggers
Energy Management Information Systems74
9.1 Introduction
Metering and measurement represent a key component of the overall EMIS. Timely measure-ment of utility consumption, ambient conditionsand process variables allow your plant or facility to
• provide cost-centre accounting• identify problem areas before they become out of control• verify utility billing• assist in energy purchasing• assist in maintenance and troubleshooting• aid in identifying and monitoring energy projects• offer meaningful data toward sizing and design for capital installations and improvements
It must be emphasized that whatever is being measured, the output data will not initself reveal why something happened. At this point, the end-user is encouraged tonote changes and deviations in the data’s patterns and look for possible causes. Onanother cautionary note, the difficulty in measuring everything at once makes it necessary for the end-user to select a few key areas and monitor these with particularattention to the sudden change or unusual event and other warning signals. Havingacquired the data, the end-user may be guided by the following when interpreting themeasured results:
• Since measurements do not “stand alone,” use comparisons to determine if a result isunder or over budget, better or worse than the last similar time period, above or belowthe industry average, or better or worse than one product or another, to name only afew considerations. Perform benchmarking according to internal and external comparisons.
• When making comparisons, words can be too vague to be useful; use numbers (e.g.,“100 kg of product/MWh is an improvement over 85 kg/MWh” is more specific than “we are better than we used to be”).
• Normalize the data in order to ensure realistic comparisons. Account for seasonal difference changes in use and occupancy or process (e.g., m3 natural gas vs. m3 natural gas heating degree-day).
9.2 The Need for Metering
An energy management plan or strategy should be developed before contemplating theexpansion of metering capability and selecting sensors, meters and other monitoringinstruments. This plan will provide a foundation for considering the intended purposeof installing meters beyond the utility’s revenue metering. Reliance on main utilitymeters, except in the cases of small plants or facilities, is inadequate for determiningutility consumption profiles in these areas. The end-user must clearly understandwhether the metering is being installed strictly for savings verification and whether the installation is to be permanent or temporary. Sub-metering allows for energy useaccountability to be introduced at the level of the end-user, who has the greatestinfluence on driving operating costs downward, unlike plant or facility utility personnel.
10101010010101010101010101010101
If something can be measured, it can be managed.
Metering and Measurement 75
Forecasting for utility purchase contracts is another driver for increased metering andmeasurement capability. In some regions, retail power rates have become more time-sensitive, and the average price will change over time and use. Load profile shapes will influence pricing in this situation, with flatter profiles usually resulting in a loweraverage cost.
Energy marketers may offer simplified rates that level out these time-based variations,but this may not necessarily offer the best deal. Variable rates may provide the lowestaverage price when selected in conjunction with strategies that reduce, level or shiftpeak demand. Knowing the shape of your aggregate typical daily load profile and thatof your major sub-metered loads could reveal opportunities to reduce present andfuture price and thus total cost. Increased knowledge of your energy use will help your energy supplier offer the most optimum and secure pricing.
The same rationale in the foregoing may be applied to natural gas fuel forecasting and purchasing. From the point of view of producers, transporters and suppliers, a levelload throughout the day and year is most desirable. As a result, variations in demandtend to increase these costs significantly. Having a detailed knowledge about gas use, enhanced by sub-metering, will allow the purchaser to determine the amount ofbase-load firm and interruptible gas requirements for contracted purchases.
In summary, energy purchase contracts may be sensitive to peak use that exceeds maximum levels specified in the purchase contract, making close monitoring and control of plant or facility loads necessary. Lack of knowledge about an organization’sconsumption or usage peak profiles will be detrimental to negotiating the best availablepurchase contract in an open market.
Be sure to know the following:• when the energy is consumed (time of day and seasonal use) • what loads can be controlled (shifted, levelled and/or reduced)
9.3 Deciding Where to Locate Meters and Sensors
Having established the need for metering and measurement, the next step is to developa measurement plan that outlines a road map for installing monitoring equipment. Thisplan should identify
• all monitoring points• types of sensors and their locations• signal cable routes and wireless communications• necessary documentation
The measurement plan precedes the preparation of a data acquisition plan and subse-quent analysis. The end-user must ultimately define the frequency of measurements(e.g., 15 minutes, hourly, etc.) and whether monitoring will be for a short or long term.
10101010101010101010010101010101010101010101010101010101
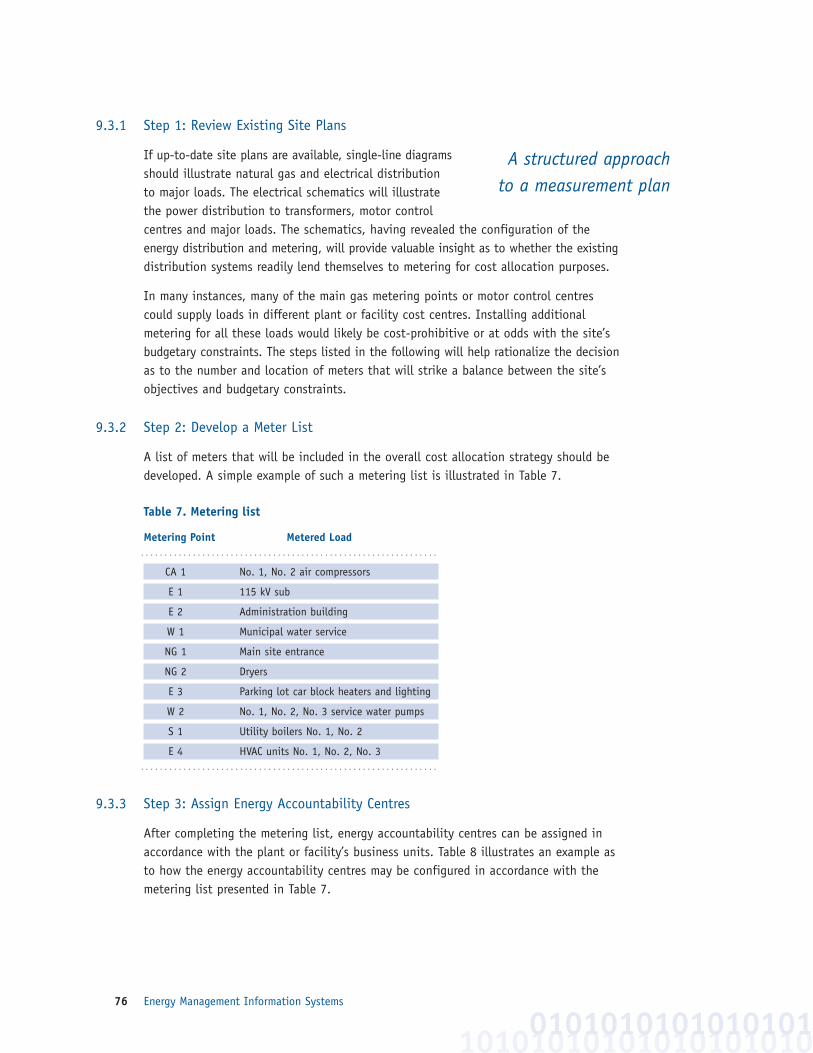
Energy Management Information Systems76
9.3.1 Step 1: Review Existing Site Plans
If up-to-date site plans are available, single-line diagramsshould illustrate natural gas and electrical distributionto major loads. The electrical schematics will illustratethe power distribution to transformers, motor controlcentres and major loads. The schematics, having revealed the configuration of theenergy distribution and metering, will provide valuable insight as to whether the existingdistribution systems readily lend themselves to metering for cost allocation purposes.
In many instances, many of the main gas metering points or motor control centrescould supply loads in different plant or facility cost centres. Installing additionalmetering for all these loads would likely be cost-prohibitive or at odds with the site’sbudgetary constraints. The steps listed in the following will help rationalize the decisionas to the number and location of meters that will strike a balance between the site’sobjectives and budgetary constraints.
9.3.2 Step 2: Develop a Meter List
A list of meters that will be included in the overall cost allocation strategy should bedeveloped. A simple example of such a metering list is illustrated in Table 7.
Table 7. Metering list
Metering Point Metered Load. . . . . . . . . . . . . . . . . . . . . . . . . . . . . . . . . . . . . . . . . . . . . . . . . . . . . . . . . . . . . . .
CA 1 No. 1, No. 2 air compressors
E 1 115 kV sub
E 2 Administration building
W 1 Municipal water service
NG 1 Main site entrance
NG 2 Dryers
E 3 Parking lot car block heaters and lighting
W 2 No. 1, No. 2, No. 3 service water pumps
S 1 Utility boilers No. 1, No. 2
E 4 HVAC units No. 1, No. 2, No. 3. . . . . . . . . . . . . . . . . . . . . . . . . . . . . . . . . . . . . . . . . . . . . . . . . . . . . . . . . . . . . . .
9.3.3 Step 3: Assign Energy Accountability Centres
After completing the metering list, energy accountability centres can be assigned inaccordance with the plant or facility’s business units. Table 8 illustrates an example asto how the energy accountability centres may be configured in accordance with themetering list presented in Table 7.
101010101010101010100101010101010101
A structured approach to a measurement plan
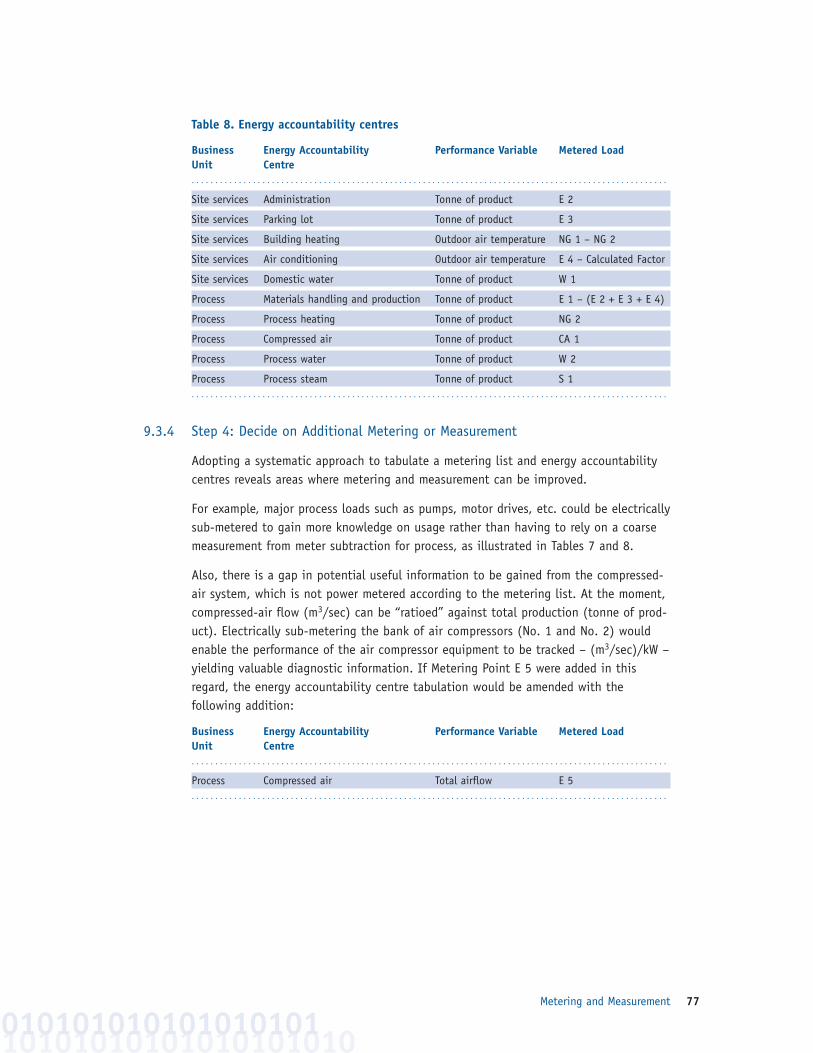
Metering and Measurement 77
Table 8. Energy accountability centres
Business Energy Accountability Performance Variable Metered LoadUnit Centre. . . . . . . . . . . . . . . . . . . . . . . . . . . . . . . . . . . . . . . . . . . . . . . . . . . . . . . . . . . . . . . . . . . . . . . . . . . . . . . . . . . . . . . . . . . . . . . . . . . . .
Site services Administration Tonne of product E 2
Site services Parking lot Tonne of product E 3
Site services Building heating Outdoor air temperature NG 1 – NG 2
Site services Air conditioning Outdoor air temperature E 4 – Calculated Factor
Site services Domestic water Tonne of product W 1
Process Materials handling and production Tonne of product E 1 – (E 2 + E 3 + E 4)
Process Process heating Tonne of product NG 2
Process Compressed air Tonne of product CA 1
Process Process water Tonne of product W 2
Process Process steam Tonne of product S 1. . . . . . . . . . . . . . . . . . . . . . . . . . . . . . . . . . . . . . . . . . . . . . . . . . . . . . . . . . . . . . . . . . . . . . . . . . . . . . . . . . . . . . . . . . . . . . . . . . . . .
9.3.4 Step 4: Decide on Additional Metering or Measurement
Adopting a systematic approach to tabulate a metering list and energy accountabilitycentres reveals areas where metering and measurement can be improved.
For example, major process loads such as pumps, motor drives, etc. could be electricallysub-metered to gain more knowledge on usage rather than having to rely on a coarsemeasurement from meter subtraction for process, as illustrated in Tables 7 and 8.
Also, there is a gap in potential useful information to be gained from the compressed-air system, which is not power metered according to the metering list. At the moment,compressed-air flow (m3/sec) can be “ratioed” against total production (tonne of prod-uct). Electrically sub-metering the bank of air compressors (No. 1 and No. 2) wouldenable the performance of the air compressor equipment to be tracked – (m3/sec)/kW –yielding valuable diagnostic information. If Metering Point E 5 were added in thisregard, the energy accountability centre tabulation would be amended with the following addition:
Business Energy Accountability Performance Variable Metered LoadUnit Centre. . . . . . . . . . . . . . . . . . . . . . . . . . . . . . . . . . . . . . . . . . . . . . . . . . . . . . . . . . . . . . . . . . . . . . . . . . . . . . . . . . . . . . . . . . . . . . . . . . . . .
Process Compressed air Total airflow E 5. . . . . . . . . . . . . . . . . . . . . . . . . . . . . . . . . . . . . . . . . . . . . . . . . . . . . . . . . . . . . . . . . . . . . . . . . . . . . . . . . . . . . . . . . . . . . . . . . . . . .
10101010101010101010010101010101010101
Energy Management Information Systems78
9.4 Deciding on What Types of Metering to Use and PracticalConsiderations
9.4.1 Electrical Metering
In many cases, power quality and feed protection issues represent the driving force forsub-metering electrical power instead of energy management considerations. In movingto an energy management and cost control justification for installing additional meter-ing capability, the following should be considered when reviewing the types of commer-cially available metering equipment and subsequent selection.
As a start, existing utility revenue metering should be utilized to the fullest possibleextent, particularly to gain an appreciation of a site’s total electrical load profile or forbilling verification. Special concerns related to using existing revenue metering includethe following:
• Because the revenue meter is the property of the utility and is a regulated device, utility personnel should make any modifications.
• Modifications typically include retrofit with a pulse initiator or installation of a pulsesplitter on an existing pulse initiator.
• It is key that the pulse value is obtained from the meter or the utility.
• When existing facility panel meters cannot be refitted with pulse initiators or when voltage levels prohibitcost-effective installation of new meters, new 5-amp current transformers could beinstalled on the secondary side of existing meter current transformers, which would in turn be connected to new metering equipment. This metering approach is not asaccurate as direct metering because measurements based on secondary current introduce a second measurement error.
Power meters owned by the site for monitoring total power to a major load centrewould typically be located at the point of delivery (sub-station) and monitor the wattsand Q-pulse from the utility revenue meters. Total kVA, kW and kVAR readings wouldthen be calculated from these signals. A typical digital power meter for this applicationwould offer a digital readout display and a maximum sampling rate of 128 Hz. A standardversion may allow for a maximum of four channels. In comparison, a premium, moreadvanced version of this power meter would include most of the same features buthave a video display terminal and allow for a maximum of 42 channels. The premiumversion is generally more suited to revenue grade metering and would offer power quality analysis, event-triggered data storage and logging.
An economical power measurement unit for sub-metering could typically offer a digitalreadout display and a maximum sampling rate of 32 Hz. Typical power measurementwould include apparent power (VA), reactive power (VAR) and power factor (PF), as inthe more premium models previously referred to. This unit would typically be ideal foruse as a power transducer for DCS, EMS, SCADA and PLC systems.
10101010101010101010010101010101010101010101
Tying into existing powerutility revenue metering

Metering and Measurement 79
A deregulated power market application may impose certain metering requirements. Thefollowing Web sites are included for reference, representing power-metering productsthat are deemed to conform to the requirements of some open markets:
• Conforming list for an Independent Electricity Market Operator in Ontario:www.iemo.com/imoweb/metering/meterlist.asp
• IEMO Wholesale Revenue Metering Standard:www.iemo.com/imoweb/pubs/metering/mtr_wrmStdHw.pdf
End-users are encouraged to research the particular requirements that apply to theregion in which their plant or facility is located.
9.4.2 Natural Gas Metering
In most cases, natural gas sub-meters with dial indicators are used. Although equippedwith pulse output capability, this feature is rarely used, largely due to perceived costconsiderations. Larger areas of natural gas consumption may have meters that make useof the utility’s pulse signal.
Natural gas meters range in size and capacity from 2-in. (50-mm) flanged connectionsat 800 CFH (22.6 m3/hr.) capacity to 56 000 CFH (1600 m3/hr.) rating. For small com-mercial loads of up to 15 psig (1 bar), compact line-mounted meters with a dial-face orodometer-type index can be purchased. For higher-volume industrial loads, a full rangeof meters that are rated for working pressures of up to 300 psig (24 bar) are available.
Many site-owned meters remain uncorrected for temperature andpressure, bringing the accuracy of many site-metered volumesinto question. Compensation for temperature effects can beaccomplished by a mechanical computer with a spiral bi-metallicthermocouple probe, positioned at the meter inlet within asealed temperature well. Natural gas volume readings may becorrected to a 60°F (15°C) basis to yield readouts in standardcubic feet (SCF) or normal cubic metres (Nm3) between flowingtemperatures of 220°F to 120°F (229°C to 49°C).
Pressure correction factors may be calculated according to the following formula:
Utility delivery pressure + Site atmospheric pressure
Atmospheric pressure at sea level
For example, if the utility delivery pressure is 50 psig (345 kPa), estimated site atmospheric pressure is 14.6 psi (100.66 kPa) and atmospheric pressure at sea level is 14.73 psi (101.56 kPa), then the pressure correction factor would be
50 + 14.6
14.73= 4.39
As such, the metered volume would be multiplied by 4.39 to obtain a “true” reading in this case.
10101010101010101010010101010101010101010101010101010101
Ensure thatpressure/temperature
compensation is applied to natural
gas meters.

Energy Management Information Systems80
Temperature- and pressure-compensated meters are commercially available from majorvendors. Some meters are available with battery-powered microprocessor-based correc-tion for temperature and pressure effects. The corrector may be integrally mountedwithin the body of the meter or externally mounted on a wall, pipework or standardinstrument drive.
Thermal-dispersion-type flow meters offer relative simplicity of measurement through a single-pipe penetration, thus eliminating temperature and pressure transmitters anddensity compensation calculations required by differential pressure, vortex and turbinetype metering. As such, less hardware is needed for a metering system, and this flowmeter offers an alternative and accurate means of gas-flow measurement. Communicationbetween the flow meter and signal processor assembly is over two-wire pair. Linearoutput signals of 0-5 V DC or 4-20 mA can interface with either RS 232 or RS 485 communication.
It must be remembered that because gas service entrances and meters are usuallylocated outdoors, a $1,000 metering point can incur a final cost of $10,000 when thecosts of trenching, buried conduit and structural penetrations through buildings forpipework are considered. In these cases, wireless data communications may present aviable alternative.
Much like electrical meters, a pulse initiator could be installed on existing natural gas meters by the utility to provide shared signals. For cases where a pulse initiator is already present on the meter, a pulse splitter may be installed. Important points toconsider in using shared signals for natural gas metering include
• allocate enough coordination time with the utility• obtain from the utility the correct scale factor for the meter• temperature and pressure compensation of the output from the pulse initiator
It should be emphasized that although sharing signals with utility meters can be cost-effective, sharing signals with existing facility meters can entail unforeseen calibrationand repair expenses. Related concerns include
• all the inaccuracies of the existing metering system are assumed• existing facility meters could potentially be improperly sized• calibration documentation could be limited or unavailable• impracticality of removing meters from a live system could leave no alternative but
field calibration, with its associated approximations
9.4.3 Steam Metering
Orifice plate meters are in common use throughout plants. Calibration data would haveto be obtained either from the facility’s calibration records or from a meter’s nameplatedata. Steam flow is proportional to the square root of the pressure difference across themeasuring orifice plate. At low flows, significant changes in flow may not generate significant changes in differential pressure, leading to measurement error. This is aconcern if steam generation falls below the turndown ratio for rated accuracy of theorifice plate measuring device, leading to inaccurate data logging.
10101010101010101010010101010101010101010101

Metering and Measurement 81
Another caution regarding the use of orifice plate steam flow meters relates to whensteam pressure is lowered. Steam flow readings extracted by differential pressure orificeplate devices are usually affected when steam pressure is lowered due to a correspondingreduction in steam density. This in turn results in a greater pressure drop at the orificeplate for a given flow, yielding a proportionally higher steam flow reading. Calculatedmass flow correction factors must be applied to steam flow readings in this case toobtain a true reading. Discussions with site personnel reveal that automatic pressurecompensation is rarely applied.
An example of mass flow correction as applied to orifice plates for saturated steam isoutlined as follows:
Given a flow reading of 13 607 kg/hr. of saturated steam, an operating pressure of 690 kPa and an orifice plate design pressure of 862 kPa, what is the actual correctedmass flow?
The correction formula is: Cm = (dD/dA) 3 (dA/dD)
Where dA = steam density at actual pressuredD = steam density at design pressure
Cm = mass flow correction factor
From steam tables: dD = (1/specific volume) = 1/0.201 = 4.976 kg/m3
dA = (1/specific volume) = 1/0.243 = 4.120 kg/m3
Cm = (4.976/4.120) 3 (4.120/4.976) = 0.9098
Therefore, the actual steam flow is 0.9098 3 13 607 = 12 380 kg/hr.
Differential pressure is usually measured by a differential pressure transmitter and conditioned into a 4-20 mA or other industry standard signal to an energy managementand control system.
Vortex flow meters, although more costly, offer greater accuracy compared with orificeplate flow meters and have over three times the “rangeability.” Another alternative toflow measurement by orifice plate is offered by annubars, whichconsist of diamond-shaped sensors that are inserted in the flowstream. Annubar flow sensors generate lower permanent pres-sure loss due to reduced flow restriction and require less labourto install. As an example, an annubar installed on an 8-inch(200-mm) pipe requires only 4 linear inches (20 cm) of weldingcompared with an orifice plate, which requires 50 inches (125 cm) of welding for thesame pipe. Installed cost savings range from 25 percent on smaller pipes to 70 percent on larger pipes. As in the case for orifice plates, manufacturer’s data mustbe consulted to determine the appropriate temperature and pressure compensation factors. Rangeability will be similar to orifice plates.
1010101010101010101001010101010101010101010101010101010101010101
Beware of calibrationfor orifice plate steam metering.
Energy Management Information Systems82
9.4.4 Water and Condensate Metering
Unless a meter is very old, existing turbine, rotating disc, vortex and magnetic flow meters can usually be retrofitted with a pulse head. Final confirmation of this should be madewith the meter manufacturer. Although rarely calibrated, mostof these flow meters probably have reasonable accuracy if themeters are in serviceable condition. Be aware that the costs ofmeter removal, replacement of worn parts and recalibration could often equal the costof a new meter. It is suggested that any pulse-head retrofit should be accompanied bythe installation of a local register to provide a check reading.
If the metering pipework includes a check valve to stop the flow of condensate or water through the meter, and if the check valve fails, the flow may be correctlymetered on the local register but metered multiple times by the pulse head.
Numerous types of venturi, annubar and orifice plate meters that use differential pressure transmitters will be encountered in the field. These are susceptible to numerous operational and calibration issues.
Non-intrusive type flow meters offer a means of performing spot checks for liquid flowmeasurement. These include magnetic, transit time and doppler-type sonic flow meters.The main advantage of this metering equipment is that it offers portability of measure-ment and unobstructed flow with no pressure drop in the pipework. Important pointsto consider in selecting non-intrusive meters include
• magnetic flow meters are relatively expensive but offer high rangeability (30:1) andare suitable for dirty fluids and bi-directional flow measurement
• transit-time-based sonic flow meters offer high accuracy for relatively clean flows butare adversely affected by bubbles or particles in the flow stream and internal depositionon pipe walls, and require full pipe flow with moderate turbulence
• the accuracy of doppler-type sonic flow meters depends on the presence of suspendedparticles or bubbles in the liquid flow stream
9.4.5 Compressed-Air Metering
Although widely used, orifice plates are inappropriate for compressed-air systemsbecause they offer limited turndown capability (3:1), and they generate relatively highdifferential pressures. It is suggested that Pitot-tube-based instruments offer improvedturndown and relatively negligible differential pressure. Selection of a Pitot-tube-basedmeasurement should include temperature and pressure compensation in order to producetrue flow readings. Both the Pitot tube and Type J thermocouple should be installed inan undisturbed section of the compressed-air line from each compressor.
10101010101010101010010101010101010101010101
Pulse head retrofit isusually required for
water meters.
Metering and Measurement 83
Lack of pressure gauges or uncalibrated gauges in the system restrict measurement of differential pressures on critical components such as filters, coolers and separators.Installation of test taps at selected locations would enable the use of one calibratedprecision instrument to obtain reliable pressure readings and avoid maintaining andcalibrating a number of gauges.
9.4.6 Data Loggers
In situations where access is cumbersome (e.g., motor andfan housings, electrical junction boxes, air vents, etc.), datarelated to temperature, relative humidity, voltage, amperage,pressure and CO2 can be monitored by data loggers. Since they are stand-alone devices,they can also be re-used for other assignments. Relative cost is low compared withmore permanent data-acquisition systems.
Most data loggers can interface with a PC. Some have external input capabilities thatmay be wired to existing gauges and sensors that are equipped with voltage outputterminals, also enabling these devices to be monitored and recorded.
Data loggers offer an alternative measurement application for opportunities where asmall number of simple retrofit measures (e.g., lighting) are replicated in great quantityand only a representative sample requires metering. Knowing the operational profile of a motor or lighting system that has a flat amperage-draw profile enables energy consumption to be readily computed.
9.5 Linking Meters to Monitoring Systems
Following the selection of metering equipment, the architecture of the system thatlinks the data collected in real time from various remote electronic meters (natural gas,power, compressed air, steam and water) to the EMIS software must be configured.
Currently, most meters have analogue output options (4-20 mA), serial digital interfaceoptions (direct RS 232) and network bus communication interface capability, for example,Ethernet, Modbus remote terminal unit (RTU), etc. As such, although most meters canbe initially used on a stand-alone basis, these can be integrated within a completeplant or facility-wide system for monitoring and control through a common communica-tion link, offered through open architecture.
Figure 38 illustrates a commonly used system that utilizes RTUs mounted in the field tomonitor energy use in various areas of a plant or facility. The RTUs are interconnectedvia a local area network (LAN) to a main EMIS computer.
10101010101010101010010101010101010101010101010101010101
The role of data loggers
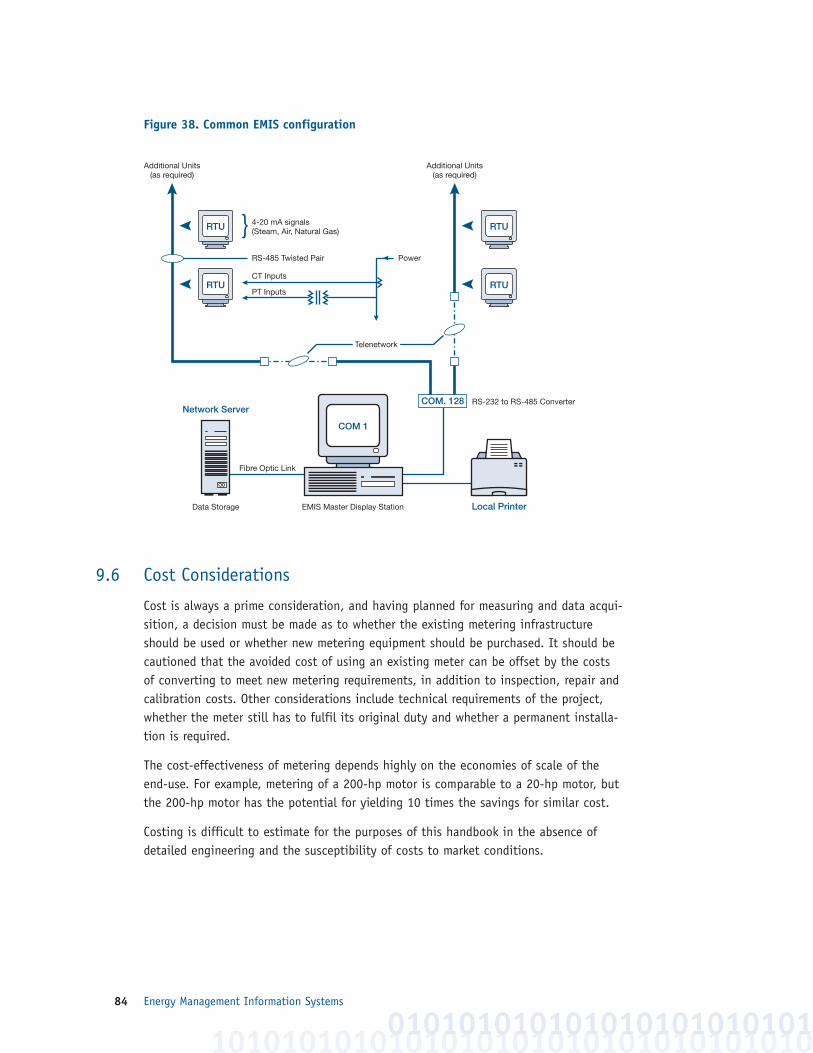
Energy Management Information Systems84
Figure 38. Common EMIS configuration
9.6 Cost Considerations
Cost is always a prime consideration, and having planned for measuring and data acqui-sition, a decision must be made as to whether the existing metering infrastructureshould be used or whether new metering equipment should be purchased. It should becautioned that the avoided cost of using an existing meter can be offset by the costsof converting to meet new metering requirements, in addition to inspection, repair andcalibration costs. Other considerations include technical requirements of the project,whether the meter still has to fulfil its original duty and whether a permanent installa-tion is required.
The cost-effectiveness of metering depends highly on the economies of scale of theend-use. For example, metering of a 200-hp motor is comparable to a 20-hp motor, butthe 200-hp motor has the potential for yielding 10 times the savings for similar cost.
Costing is difficult to estimate for the purposes of this handbook in the absence ofdetailed engineering and the susceptibility of costs to market conditions.
1010101010101010101010101010101010010101010101010101010101
RTU RTU
RTU RTU
Local PrinterData Storage
Network Server
EMIS Master Display Station
Additional Units(as required)
Additional Units(as required)
4-20 mA signals(Steam, Air, Natural Gas)
RS-485 Twisted Pair
CT Inputs
Power
PT Inputs
COM 1
COM. 128 RS-232 to RS-485 Converter
Fibre Optic Link
Telenetwork
Metering and Measurement 85
9.7 Concluding Remarks
The expectation of absolute precision for all of a site’smeasurements and the difficulty of achieving this is oftenperceived as a barrier to implementing improved meteringcapability. This should not deter the site from upgradingmetering systems before it implements an EMIS. Staged implementation applied withinbudgetary constraints is a practical way to get started. At this point it is important torealize that, in practice, measurements will not be perfect.
Action to achieve improvements is best ensured byan organizational culture that encourages rewardsand sustains utility cost-reduction initiatives. TheEMIS is intended to supply useful information anddata about the site’s utility consumption patterns. Effectively communicating, encour-aging participation and involving personnel across all levels of the site requires peopleskills. Motivation will be sustained when a team experiences early success with provenresults, as validated by the EMIS. Credibility will also enhance motivation and buy-infrom all personnel. Methods of rewarding good performance should be developed withan organization’s human resources group. This may involve giving recognition throughpublicity (e.g., testimonial posters, company publications such as newsletters, non-monetary awards at company events, etc.) or a modest cash award. Motivation will also be enhanced when staff is assured that help is available from the team to correctpoor performance.
Although procedures and standards such as ISO serve a useful purpose, beware of overreliance on these as a driver for improving energy use efficiency. For example, ISO 14000 is widely regarded as a proven international standard for effective and comprehensive environmental management. Although it is broad enough to encompassenergy use efficiency, this broad focus may miss some unique aspects of energy man-agement. For example, strategic energy purchasing is a complex and key requirementwhen operating within a deregulated environment. The key focus of ISO 14000 is onenvironmental conformance and compliance. As such, this standard offers no guidanceon energy purchasing because purchasing is not normally related to conformance com-pliance. Undeniably, there is a direct link between energy and the environment, and an EMIS can serve as a useful complementary tool to environmental issues.
Another area that can be a problem is relying too much on a single energy champion. Many organizations have been in situations in which information could not be found because“only a certain person knew” or because that person wasabsent. An effective EMIS will capture the collective knowl-edge of a site’s energy use and make it broadly available. In addition, by reducingdata-collection time, personnel can devote more time to developing solutions.
10101010101010010101010101010101010101010101010101
It is better to be roughlyright than precisely wrong.
Reward good performance andhelp poor performance.
Overreliance on a singleenergy champion
is risky.

010101010101010101010101
Energy Management Information Systems86
1010101010101010101010101010101010010101010101010101010101

Do You Have an Effective EMIS? A Checklist 87
1010101010101010101001010101010101010101010110Do You Have an Effective EMIS? A Checklist
The following can help assess an EMIS and compare it with the structured approachpresented in this handbook. This checklist may indicate that many of the elements ofan EMIS as presented are there, but are under-utilized or not utilized at all. Severaldesirable elements may be able to be implemented at minimal cost. At the very least,this checklist will indicate what is missing vs. what is achievable and can lead togreater profitability through improved energy use efficiency.
An effective EMIS should include the items listed in the following checklist.Implementing these items should reduce annual energy costs by at least 5 percent.
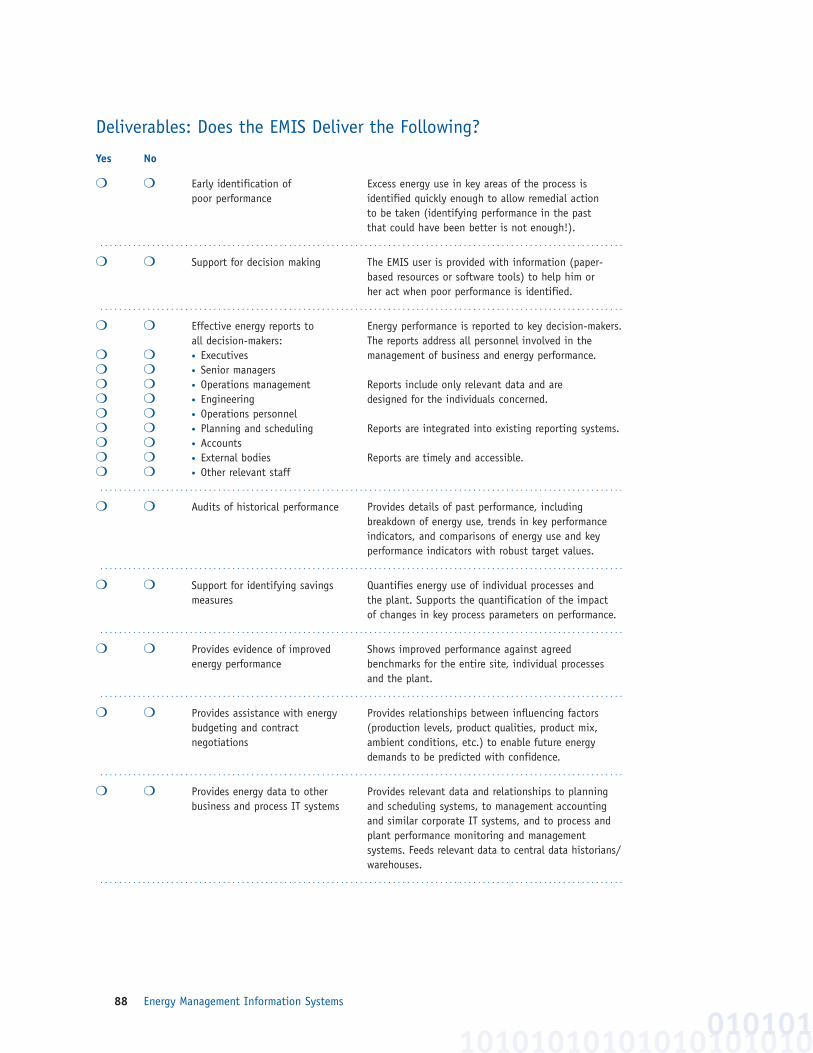
Energy Management Information Systems88
Deliverables: Does the EMIS Deliver the Following?
Yes No
❍ ❍ Early identification of Excess energy use in key areas of the process is poor performance identified quickly enough to allow remedial action
to be taken (identifying performance in the past that could have been better is not enough!).
. . . . . . . . . . . . . . . . . . . . . . . . . . . . . . . . . . . . . . . . . . . . . . . . . . . . . . . . . . . . . . . . . . . . . . . . . . . . . . . . . . . . . . . . . . . . . . . . . . . . . . . . . . . . . . .
❍ ❍ Support for decision making The EMIS user is provided with information (paper-based resources or software tools) to help him or her act when poor performance is identified.
. . . . . . . . . . . . . . . . . . . . . . . . . . . . . . . . . . . . . . . . . . . . . . . . . . . . . . . . . . . . . . . . . . . . . . . . . . . . . . . . . . . . . . . . . . . . . . . . . . . . . . . . . . . . . . .
❍ ❍ Effective energy reports to Energy performance is reported to key decision-makers.all decision-makers: The reports address all personnel involved in the
❍ ❍ • Executives management of business and energy performance.❍ ❍ • Senior managers❍ ❍ • Operations management Reports include only relevant data and are ❍ ❍ • Engineering designed for the individuals concerned.❍ ❍ • Operations personnel❍ ❍ • Planning and scheduling Reports are integrated into existing reporting systems.❍ ❍ • Accounts❍ ❍ • External bodies Reports are timely and accessible.❍ ❍ • Other relevant staff . . . . . . . . . . . . . . . . . . . . . . . . . . . . . . . . . . . . . . . . . . . . . . . . . . . . . . . . . . . . . . . . . . . . . . . . . . . . . . . . . . . . . . . . . . . . . . . . . . . . . . . . . . . . . . .
❍ ❍ Audits of historical performance Provides details of past performance, including breakdown of energy use, trends in key performance indicators, and comparisons of energy use and key performance indicators with robust target values.
. . . . . . . . . . . . . . . . . . . . . . . . . . . . . . . . . . . . . . . . . . . . . . . . . . . . . . . . . . . . . . . . . . . . . . . . . . . . . . . . . . . . . . . . . . . . . . . . . . . . . . . . . . . . . . .
❍ ❍ Support for identifying savings Quantifies energy use of individual processes and measures the plant. Supports the quantification of the impact
of changes in key process parameters on performance. . . . . . . . . . . . . . . . . . . . . . . . . . . . . . . . . . . . . . . . . . . . . . . . . . . . . . . . . . . . . . . . . . . . . . . . . . . . . . . . . . . . . . . . . . . . . . . . . . . . . . . . . . . . . . . .
❍ ❍ Provides evidence of improved Shows improved performance against agreed energy performance benchmarks for the entire site, individual processes
and the plant. . . . . . . . . . . . . . . . . . . . . . . . . . . . . . . . . . . . . . . . . . . . . . . . . . . . . . . . . . . . . . . . . . . . . . . . . . . . . . . . . . . . . . . . . . . . . . . . . . . . . . . . . . . . . . . .
❍ ❍ Provides assistance with energy Provides relationships between influencing factors budgeting and contract (production levels, product qualities, product mix, negotiations ambient conditions, etc.) to enable future energy
demands to be predicted with confidence. . . . . . . . . . . . . . . . . . . . . . . . . . . . . . . . . . . . . . . . . . . . . . . . . . . . . . . . . . . . . . . . . . . . . . . . . . . . . . . . . . . . . . . . . . . . . . . . . . . . . . . . . . . . . . . .
❍ ❍ Provides energy data to other Provides relevant data and relationships to planning business and process IT systems and scheduling systems, to management accounting
and similar corporate IT systems, and to process and plant performance monitoring and management systems. Feeds relevant data to central data historians/warehouses.
. . . . . . . . . . . . . . . . . . . . . . . . . . . . . . . . . . . . . . . . . . . . . . . . . . . . . . . . . . . . . . . . . . . . . . . . . . . . . . . . . . . . . . . . . . . . . . . . . . . . . . . . . . . . . . .
10101010101010101010010101
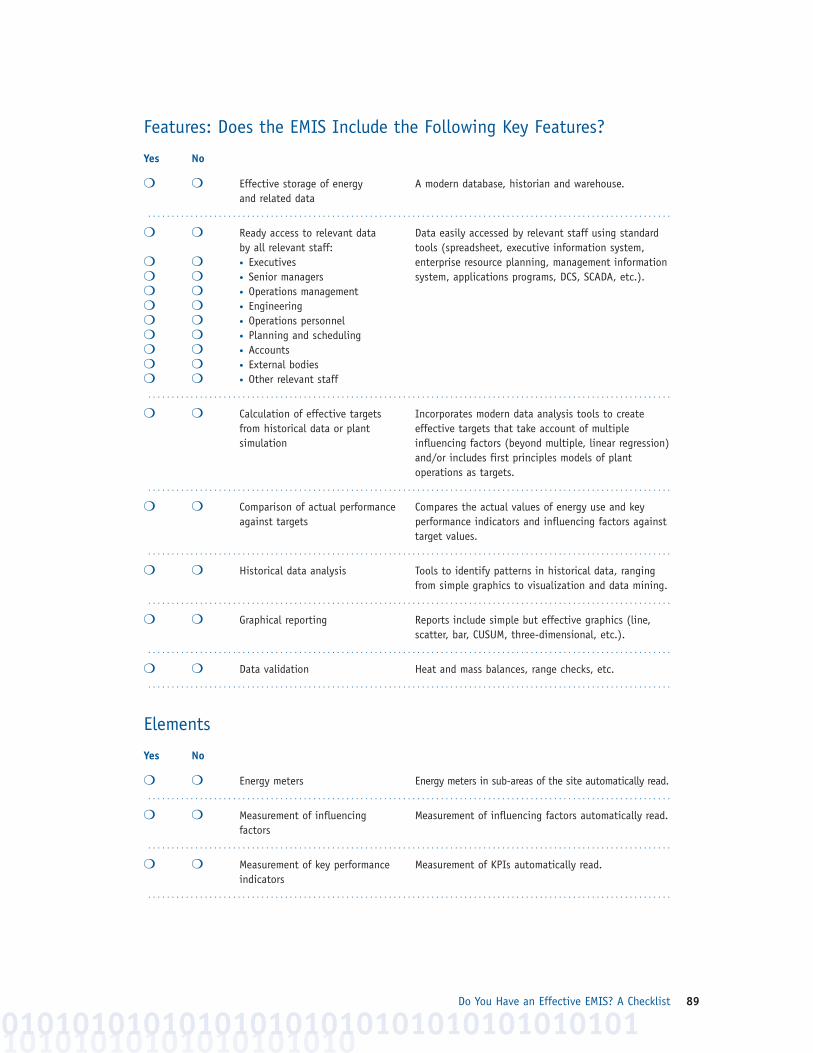
Do You Have an Effective EMIS? A Checklist 89
Features: Does the EMIS Include the Following Key Features?
Yes No
❍ ❍ Effective storage of energy A modern database, historian and warehouse.and related data
. . . . . . . . . . . . . . . . . . . . . . . . . . . . . . . . . . . . . . . . . . . . . . . . . . . . . . . . . . . . . . . . . . . . . . . . . . . . . . . . . . . . . . . . . . . . . . . . . . . . . . . . . . . . . . .
❍ ❍ Ready access to relevant data Data easily accessed by relevant staff using standard by all relevant staff: tools (spreadsheet, executive information system,
❍ ❍ • Executives enterprise resource planning, management information❍ ❍ • Senior managers system, applications programs, DCS, SCADA, etc.).❍ ❍ • Operations management❍ ❍ • Engineering❍ ❍ • Operations personnel❍ ❍ • Planning and scheduling❍ ❍ • Accounts❍ ❍ • External bodies❍ ❍ • Other relevant staff . . . . . . . . . . . . . . . . . . . . . . . . . . . . . . . . . . . . . . . . . . . . . . . . . . . . . . . . . . . . . . . . . . . . . . . . . . . . . . . . . . . . . . . . . . . . . . . . . . . . . . . . . . . . . . .
❍ ❍ Calculation of effective targets Incorporates modern data analysis tools to create from historical data or plant effective targets that take account of multiple simulation influencing factors (beyond multiple, linear regression)
and/or includes first principles models of plant operations as targets.
. . . . . . . . . . . . . . . . . . . . . . . . . . . . . . . . . . . . . . . . . . . . . . . . . . . . . . . . . . . . . . . . . . . . . . . . . . . . . . . . . . . . . . . . . . . . . . . . . . . . . . . . . . . . . . .
❍ ❍ Comparison of actual performance Compares the actual values of energy use and key against targets performance indicators and influencing factors against
target values. . . . . . . . . . . . . . . . . . . . . . . . . . . . . . . . . . . . . . . . . . . . . . . . . . . . . . . . . . . . . . . . . . . . . . . . . . . . . . . . . . . . . . . . . . . . . . . . . . . . . . . . . . . . . . . .
❍ ❍ Historical data analysis Tools to identify patterns in historical data, ranging from simple graphics to visualization and data mining.
. . . . . . . . . . . . . . . . . . . . . . . . . . . . . . . . . . . . . . . . . . . . . . . . . . . . . . . . . . . . . . . . . . . . . . . . . . . . . . . . . . . . . . . . . . . . . . . . . . . . . . . . . . . . . . .
❍ ❍ Graphical reporting Reports include simple but effective graphics (line, scatter, bar, CUSUM, three-dimensional, etc.).
. . . . . . . . . . . . . . . . . . . . . . . . . . . . . . . . . . . . . . . . . . . . . . . . . . . . . . . . . . . . . . . . . . . . . . . . . . . . . . . . . . . . . . . . . . . . . . . . . . . . . . . . . . . . . . .
❍ ❍ Data validation Heat and mass balances, range checks, etc. . . . . . . . . . . . . . . . . . . . . . . . . . . . . . . . . . . . . . . . . . . . . . . . . . . . . . . . . . . . . . . . . . . . . . . . . . . . . . . . . . . . . . . . . . . . . . . . . . . . . . . . . . . . . . . .
Elements
Yes No
❍ ❍ Energy meters Energy meters in sub-areas of the site automatically read. . . . . . . . . . . . . . . . . . . . . . . . . . . . . . . . . . . . . . . . . . . . . . . . . . . . . . . . . . . . . . . . . . . . . . . . . . . . . . . . . . . . . . . . . . . . . . . . . . . . . . . . . . . . . . . .
❍ ❍ Measurement of influencing Measurement of influencing factors automatically read.factors
. . . . . . . . . . . . . . . . . . . . . . . . . . . . . . . . . . . . . . . . . . . . . . . . . . . . . . . . . . . . . . . . . . . . . . . . . . . . . . . . . . . . . . . . . . . . . . . . . . . . . . . . . . . . . . .
❍ ❍ Measurement of key performance Measurement of KPIs automatically read.indicators
. . . . . . . . . . . . . . . . . . . . . . . . . . . . . . . . . . . . . . . . . . . . . . . . . . . . . . . . . . . . . . . . . . . . . . . . . . . . . . . . . . . . . . . . . . . . . . . . . . . . . . . . . . . . . . .
10101010101010101010010101010101010101010101010101010101
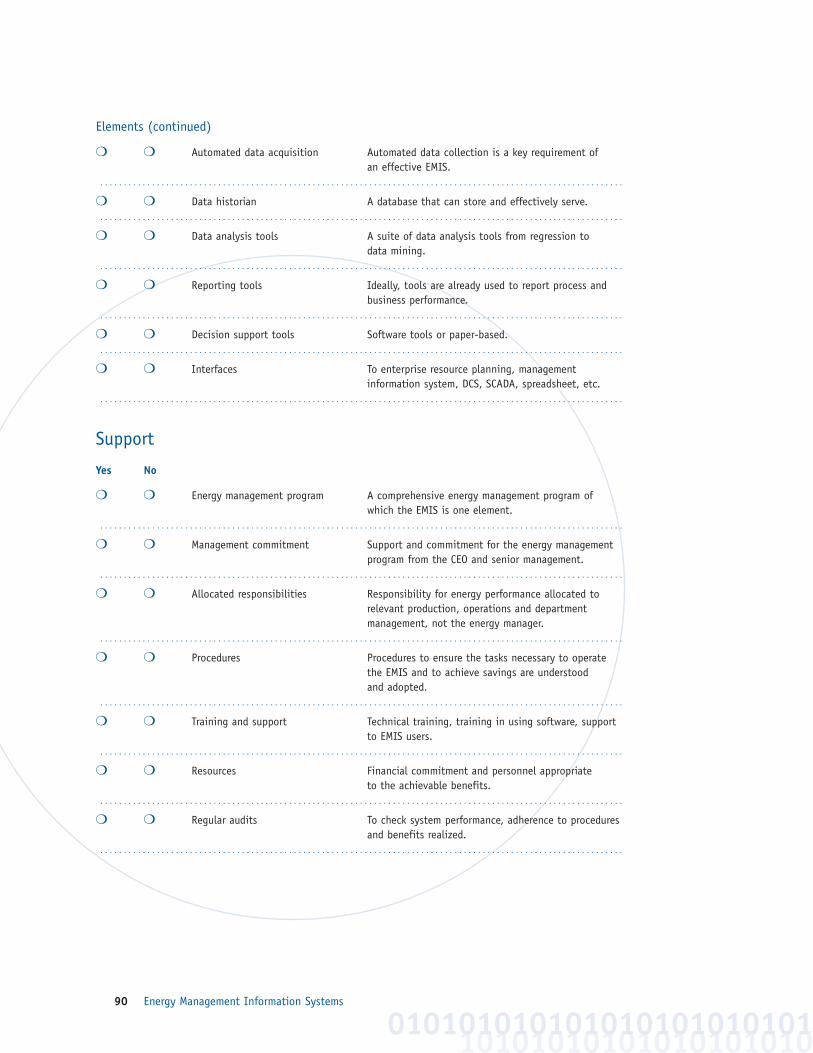
Energy Management Information Systems90
Elements (continued)
❍ ❍ Automated data acquisition Automated data collection is a key requirement of an effective EMIS.
. . . . . . . . . . . . . . . . . . . . . . . . . . . . . . . . . . . . . . . . . . . . . . . . . . . . . . . . . . . . . . . . . . . . . . . . . . . . . . . . . . . . . . . . . . . . . . . . . . . . . . . . . . . . . . .
❍ ❍ Data historian A database that can store and effectively serve. . . . . . . . . . . . . . . . . . . . . . . . . . . . . . . . . . . . . . . . . . . . . . . . . . . . . . . . . . . . . . . . . . . . . . . . . . . . . . . . . . . . . . . . . . . . . . . . . . . . . . . . . . . . . . . .
❍ ❍ Data analysis tools A suite of data analysis tools from regression to data mining.
. . . . . . . . . . . . . . . . . . . . . . . . . . . . . . . . . . . . . . . . . . . . . . . . . . . . . . . . . . . . . . . . . . . . . . . . . . . . . . . . . . . . . . . . . . . . . . . . . . . . . . . . . . . . . . .
❍ ❍ Reporting tools Ideally, tools are already used to report process and business performance.
. . . . . . . . . . . . . . . . . . . . . . . . . . . . . . . . . . . . . . . . . . . . . . . . . . . . . . . . . . . . . . . . . . . . . . . . . . . . . . . . . . . . . . . . . . . . . . . . . . . . . . . . . . . . . . .
❍ ❍ Decision support tools Software tools or paper-based. . . . . . . . . . . . . . . . . . . . . . . . . . . . . . . . . . . . . . . . . . . . . . . . . . . . . . . . . . . . . . . . . . . . . . . . . . . . . . . . . . . . . . . . . . . . . . . . . . . . . . . . . . . . . . . .
❍ ❍ Interfaces To enterprise resource planning, management information system, DCS, SCADA, spreadsheet, etc.
. . . . . . . . . . . . . . . . . . . . . . . . . . . . . . . . . . . . . . . . . . . . . . . . . . . . . . . . . . . . . . . . . . . . . . . . . . . . . . . . . . . . . . . . . . . . . . . . . . . . . . . . . . . . . . .
Support
Yes No
❍ ❍ Energy management program A comprehensive energy management program of which the EMIS is one element.
. . . . . . . . . . . . . . . . . . . . . . . . . . . . . . . . . . . . . . . . . . . . . . . . . . . . . . . . . . . . . . . . . . . . . . . . . . . . . . . . . . . . . . . . . . . . . . . . . . . . . . . . . . . . . . .
❍ ❍ Management commitment Support and commitment for the energy management program from the CEO and senior management.
. . . . . . . . . . . . . . . . . . . . . . . . . . . . . . . . . . . . . . . . . . . . . . . . . . . . . . . . . . . . . . . . . . . . . . . . . . . . . . . . . . . . . . . . . . . . . . . . . . . . . . . . . . . . . . .
❍ ❍ Allocated responsibilities Responsibility for energy performance allocated to relevant production, operations and department management, not the energy manager.
. . . . . . . . . . . . . . . . . . . . . . . . . . . . . . . . . . . . . . . . . . . . . . . . . . . . . . . . . . . . . . . . . . . . . . . . . . . . . . . . . . . . . . . . . . . . . . . . . . . . . . . . . . . . . . .
❍ ❍ Procedures Procedures to ensure the tasks necessary to operate the EMIS and to achieve savings are understood and adopted.
. . . . . . . . . . . . . . . . . . . . . . . . . . . . . . . . . . . . . . . . . . . . . . . . . . . . . . . . . . . . . . . . . . . . . . . . . . . . . . . . . . . . . . . . . . . . . . . . . . . . . . . . . . . . . . .
❍ ❍ Training and support Technical training, training in using software, support to EMIS users.
. . . . . . . . . . . . . . . . . . . . . . . . . . . . . . . . . . . . . . . . . . . . . . . . . . . . . . . . . . . . . . . . . . . . . . . . . . . . . . . . . . . . . . . . . . . . . . . . . . . . . . . . . . . . . . .
❍ ❍ Resources Financial commitment and personnel appropriate to the achievable benefits.
. . . . . . . . . . . . . . . . . . . . . . . . . . . . . . . . . . . . . . . . . . . . . . . . . . . . . . . . . . . . . . . . . . . . . . . . . . . . . . . . . . . . . . . . . . . . . . . . . . . . . . . . . . . . . . .
❍ ❍ Regular audits To check system performance, adherence to procedures and benefits realized.
. . . . . . . . . . . . . . . . . . . . . . . . . . . . . . . . . . . . . . . . . . . . . . . . . . . . . . . . . . . . . . . . . . . . . . . . . . . . . . . . . . . . . . . . . . . . . . . . . . . . . . . . . . . . . . .
10101010101010101010010101010101010101010101
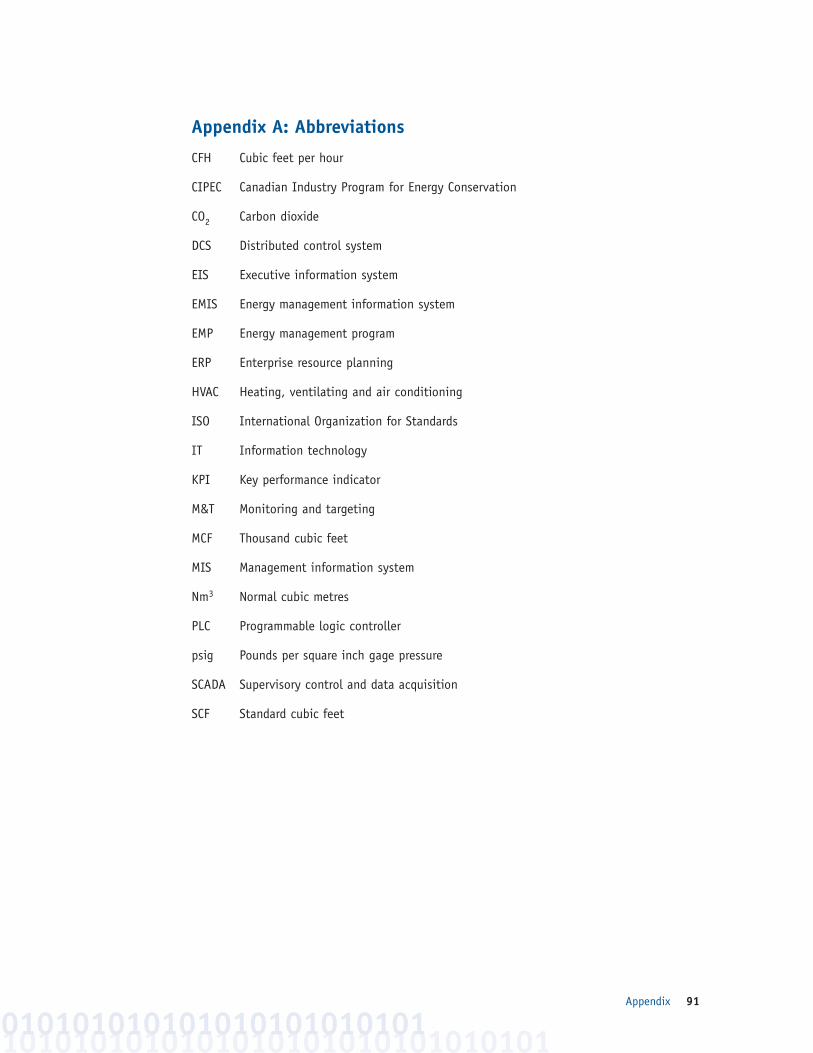
Appendix 91
Appendix A: Abbreviations
CFH Cubic feet per hour
CIPEC Canadian Industry Program for Energy Conservation
CO2 Carbon dioxide
DCS Distributed control system
EIS Executive information system
EMIS Energy management information system
EMP Energy management program
ERP Enterprise resource planning
HVAC Heating, ventilating and air conditioning
ISO International Organization for Standards
IT Information technology
KPI Key performance indicator
M&T Monitoring and targeting
MCF Thousand cubic feet
MIS Management information system
Nm3 Normal cubic metres
PLC Programmable logic controller
psig Pounds per square inch gage pressure
SCADA Supervisory control and data acquisition
SCF Standard cubic feet
1010101010101010101010101010101010101010101010101010101

Energy Management Information Systems92
Appendix B: Figures and Tables
Figure 1. Basics of an EMIS 6
Figure 2. Elements of an energy management program (EMP) 8
Figure 3. Operations report showing poor performance 10
Figure 4. Operations report showing improving performance 11
Figure 5. Report with instructions on how to achieve optimum operating conditions 15
Figure 6. Learning from data 15
Figure 7. Example of management report, showing weekly progress 16
Figure 8. Example of executive report, showing monthly progress 16
Figure 9. Example of frequency distribution 17
Figure 10. The EMIS should quantify energy use and costs 18
Figure 11. Graph showing cumulative savings achieved since an EMIS was installed 19
Figure 12. Elements of a typical EMIS 21
Figure 13. Steps toward achieving success 23
Figure 14. A profile showing blips in energy use 30
Figure 15. EMIS impact on organizational structure 31
Figure 16. Decision loop accountabilities and reviews 41
Figure 17. Effective energy reporting: Questions and answers 46
Figure 18a. Example of an operations report alert 50
Figure 18b. Another example of an operations report alert 50
Figure 19. Block diagram showing elements of energy data analysis 54
Figure 20. Breakdown of energy use 56
Figure 21. Breakdown of utilities’ use and cost 57
Figure 22. Monthly breakdown of electricity use showing day and nighttime units 57
Figure 23a. Typical half-hourly demand profiles (as a line graph) 58
Figure 23b. Typical half-hourly demand profiles (as a contour plot) 58
Figure 24. Example of frequency distribution 59
Figure 25. Energy use vs. production 60
Figure 26. Example of three-dimensional plot, showing energy use vs. production and feed quality 61
Figure 27. Multiple scatter plot 62
10101010101010101010010101010101010101010101
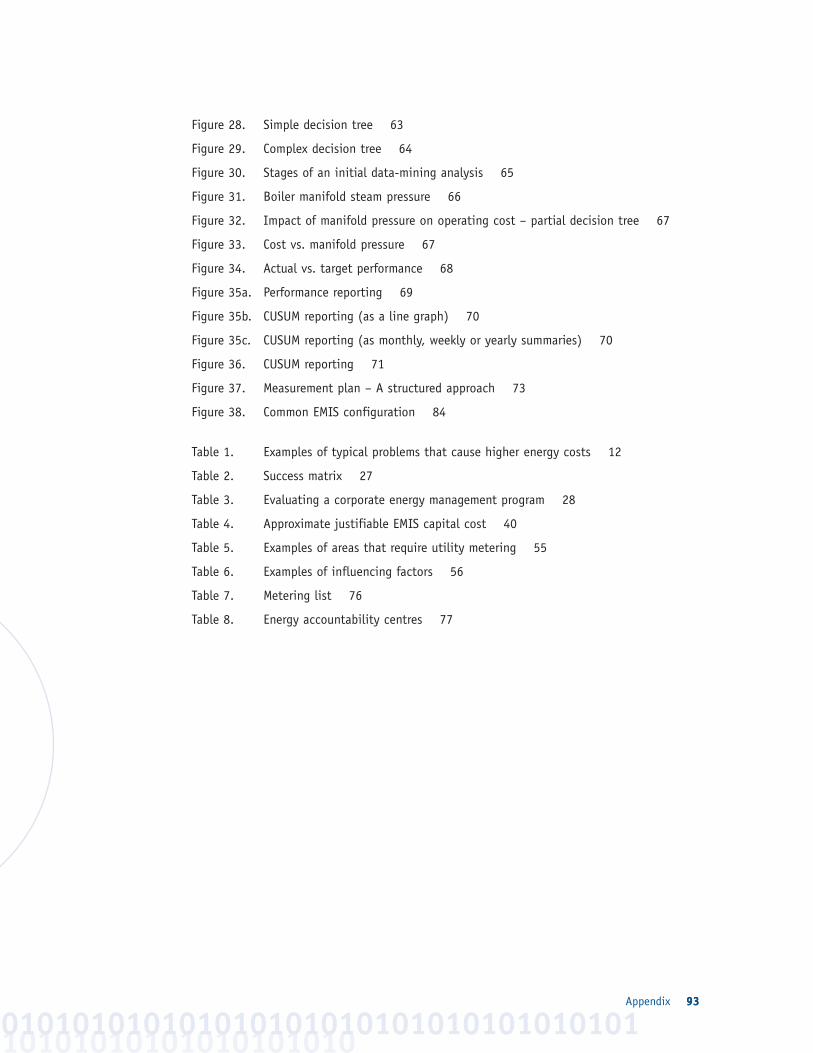
Appendix 93
1010101010101010101001010101010101010101010101010101010193
Figure 28. Simple decision tree 63
Figure 29. Complex decision tree 64
Figure 30. Stages of an initial data-mining analysis 65
Figure 31. Boiler manifold steam pressure 66
Figure 32. Impact of manifold pressure on operating cost – partial decision tree 67
Figure 33. Cost vs. manifold pressure 67
Figure 34. Actual vs. target performance 68
Figure 35a. Performance reporting 69
Figure 35b. CUSUM reporting (as a line graph) 70
Figure 35c. CUSUM reporting (as monthly, weekly or yearly summaries) 70
Figure 36. CUSUM reporting 71
Figure 37. Measurement plan – A structured approach 73
Figure 38. Common EMIS configuration 84
Table 1. Examples of typical problems that cause higher energy costs 12
Table 2. Success matrix 27
Table 3. Evaluating a corporate energy management program 28
Table 4. Approximate justifiable EMIS capital cost 40
Table 5. Examples of areas that require utility metering 55
Table 6. Examples of influencing factors 56
Table 7. Metering list 76
Table 8. Energy accountability centres 77

Energy Management Information Systems94

O10101010101010101010101010101010101010101010101010101010
1010101010101010101010101010101010101010101010101010101010101010101010101010101010101010
Leading Canadians to Energy Efficiency at Home, at Work and on the Road
The Office of Energy Efficiency of Natural Resources Canadastrengthens and expands Canada’s commitment to energy efficiency
in order to help address the challenges of climate change.
For more information or to receive additonal copiesof this publication, write to
Canadian Industry Program for Energy ConservationOffice of Energy Efficiencyc/o Natural Resources Canada580 Booth Street, 18th FloorOttawa ON K1A 0E4Tel.: (613) 995-6839Fax: (613) 992-3161TTY: (613) 996-4397 (teletype for the hearing impaired)E-mail: [email protected]