10.1007_s11205-009-9467-0
TRANSCRIPT

7/27/2019 10.1007_s11205-009-9467-0
http://slidepdf.com/reader/full/101007s11205-009-9467-0 1/25
International Migration and Human Development
in Destination Countries: A Cross-National Analysis
of Less-Developed Countries, 1970–2005
Matthew Sanderson
Accepted: 23 March 2009 / Published online: 5 April 2009 Springer Science+Business Media B.V. 2009
Abstract Contemporary levels of international migration in less-developed countries are
raising new and important questions regarding the consequences of immigration for human
welfare and well-being. However, there is little systematic cross-national evidence of how
international migration affects human development levels in migrant-receiving countries in
the less-developed world. This paper addresses this gap in the literature by assessing the
impact of cumulative international migration flows on the human development index, a
composite measure of aggregate well-being. A series of panel models are estimated using asample of less-developed countries for the period, 1970–2005. The results indicate that
higher levels of international migration are associated with lower scores on the human
development index, net of controls, but that the effect of international migration is
relatively small.
Keywords Migration Development Human development Globalization Less-developed countries Population
1 Introduction
Historically, international migration in developing countries has been directed predomi-
nately toward developed countries. More recently, however, international migration in
developing countries has become more globalized to the extent that migrant flows now
include a broader variety of both sending and receiving countries (Castles and Miller 2003;
Nyberg-Sorenson et al. 2002). The globalization of migration has coincided with a trend
toward more prevalent South-to-South movements, with persons increasingly moving
between developing countries (Nyberg-Sorenson et al. 2002). Indeed, one-half of all
migrants from developing countries now move to another developing country (Ratha andShaw 2007), and South-to-South migration has become as prevalent as South-to-North
migration (Martin and Widgren 2002).
M. Sanderson (&)Lehigh University, Bethlehem, PA 18015, USAe-mail: [email protected]
1 3
Soc Indic Res (2010) 96:59–83DOI 10.1007/s11205-009-9467-0
7/27/2019 10.1007_s11205-009-9467-0
http://slidepdf.com/reader/full/101007s11205-009-9467-0 2/25
The present level of international migration in less-developed countries has raised new
and important questions regarding the impact of these movements for human development
outcomes. In a world in which international migration is produced in large part by per-
sistent cross-national differences in income levels (Hatton and Williamson 2006),
policymakers and development practitioners are searching for ways to utilize the mobilityof people to raise income levels, living standards, and promote aggregate development in
less-developed countries (Annan 2006; UN 2006; WB 2006a).
However, there is little systematic cross-national evidence regarding whether or how
international migration affects development outcomes in migrant-receiving countries in the
less-developed world. Previous cross-national studies (Frey and Al-Roumi 1999; Frey and
Field 2000; Lena and London 1993; London 1988; London and Williams 1988; 1990;
Nolan 1988; Nolan and White 1983; 1984; Shandra et al. 2004, 2005; Shen and
Williamson 1997, 1999, 2001; Wimberley 1990, 1991; Wimberley and Bello 1992) have
neglected the role of international migration as an explanation of variation in development
outcomes. Moreover, when it has been studied, the development implications of interna-tional migration have been examined almost exclusively in terms of the effects of
remittances on migrant-sending countries (Adams Jr. and Page 2005; Cohen 2005; Durand
et al. 1996; Gammeltoft 2002; de Haas 2005; Martin and Straubhaar 2002; Massey and
Parrado 1998; Stark 2004; Taylor 1999; Taylor et al. 1996a, b; WB 2006a). The impact of
international migration on development outcomes in migrant-receiving countries has not
been addressed systematically across countries and over time.
My aim is to assess whether and how international migration affects development
outcomes in migrant-receiving countries in the less-developed world. My analysis
advances previous efforts in several ways. First, by assessing the impact of internationalmigration, I incorporate an alternative explanation of human development into previous
models. Second, I analyze the impact of international migration alongside a variety of other
domestic and international explanations of development identified in previous studies.
Third, I examine the effect of international migration on a more extensive measure of
development that incorporates both economic and non-economic factors. Fourth, I use
more recent data on developing countries and employ more modern estimation techniques
that address some of the methodological concerns identified in previous studies. Finally, I
examine the impacts of international migration on human development across countries
and over time. This allows a more comprehensive understanding of the relationship
between international migration and human development compared to previous studies.
2 Review of Previous Literature
2.1 Conceptualizing Development
While there have been some significant improvements over the past twenty years (Easterlin
2000), the contemporary developing world still faces an array of pressing development
challenges. Approximately 40% (2.5 billion) of the world’s population survives on lessthan $2 per day (UNDP 2005). These problems are vividly evident in sub-Saharan Africa
where a child born today in Zambia is less likely to survive to age 30 than a child born in
England in 1840 (UNDP 2005).
Historically, the most common answer to such challenges has been to improve per
capita income levels (UNDP 1990). In this respect, development has traditionally been
considered largely in material, economic terms and cross-national studies have examined
60 M. Sanderson
1 3
7/27/2019 10.1007_s11205-009-9467-0
http://slidepdf.com/reader/full/101007s11205-009-9467-0 3/25
the impact of various domestic and international explanations of per capita income levels
(Bornschier et al. 1978; Chase-Dunn 1975; Dixon and Boswell 1996; Kentor 1981, 1998,
2001; Kentor and Boswell 2003; Timberlake and Kentor 1983).
There is now, however, an emerging consensus that development is a multidimensional
concept that encompasses both economic and non-economic elements of human welfare(UNDP 2005). From this perspective, income is viewed not as an end, but as a means to
increase ‘‘human development’’ (UNDP 1990). This is a more comprehensive view
of development that considers improvements in human capabilities and expansions in
human freedoms to be as equally important for human welfare as expansions in income
(Sen 1999).
Previous cross-national studies have employed a variety of composite indicators to
measure human development, including the Physical Quality of Life Index (Ragin and
Bradshaw 1992; Shin 1989) and the Index of Net Social Progress (London and Williams
1990). However, more recent studies (Davies and Quinlivian 2006; Tsai 2006, 2007)
employ the United Nations (1990) Human Development Index (HDI), which supplementsthe material dimension of human welfare (income) with measures of the capacity to
acquire knowledge (education) and the ability to live a long and healthy life (longevity).
Composite indicators have been criticized on the grounds that they are sensitive to
the weights applied to their components. If there is disagreement about the relative
importance of weights for each component of the HDI, then the HDI might not represent a
reliable composite indicator of the quality of life, or well-being, in a country. However,
Hagerty and Land (2007) explored the robustness of the HDI, and other composite indi-
cators of well-being, to various weighting schemes. Their empirical analysis demonstrated
that the HDI is very robust to different weighting schemes: ‘‘For the HDI 2001, differentweights are simply not an impediment to agreement on a QOL (quality-of-life) index’’
(p. 473). Thus, although their utility has been disputed, the HDI is useful when the research
inquiry is interested in the ‘net’ effect of a variety of indicators, even when different
weights are assigned to its components. In this respect, the HDI is considered ‘‘excellent in
the general level of aggregation in its purpose of providing an assessment of development’’
(Hagerty et al. 2001).
2.2 Previous Cross-National Studies of Human Development Outcomes
There is significant variation in human development levels across developing countries.While per capita income is associated with human development (Ranis et al. 2000),
countries with similar levels of GDP per capita can have considerable variation in human
development scores. For example, Albania (HDI = .80) has a human development score
similar to Iran (HDI = .76), but Iran’s per capita income level ($8,800) is much greater
than Albania’s per capita income level ($5,300) (UNDP 2007).
Discrepancies between economic and human development levels have encouraged
cross-national researchers to look beyond GDP per capita toward external, or global,
explanations of variation in human development outcomes (Easterlin 2000). These studies
acknowledge the importance of global integration for intranational processes anddynamics. In this respect, international trade and foreign direct investment have been
identified as important explanations. However, the empirical evidence linking these factors
with human development outcomes is mixed. While some studies report that trade
(Boehmer and Williamson 1996; Lena and London 1993; Shen and Williamson 2001) and
foreign investment (Lena and London 1993; London 1988; Shandra et al. 2004, 2005; Shen
and Williamson 2001; Wimberley 1990) are detrimental to human development outcomes
International Migration and Human Development in Destination Countries 61
1 3
7/27/2019 10.1007_s11205-009-9467-0
http://slidepdf.com/reader/full/101007s11205-009-9467-0 4/25
in developing countries, others find that either trade or foreign investment has no effect on
human development outcomes (Brady et al. 2007; Cutright and Adams 1984; Frey and
Field 2000).
The lack of robust findings for international trade and foreign investment suggests the
need to incorporate alternative measures of global integration into cross-national models of human development outcomes. International migration could be one such measure, as
cross-national movements of people generate the very economic (Massey et al. 2002) and
non-economic (Glick Schiller et al. 1995; Portes 2001) linkages between countries that
constitute global integration. However, while cross-national research has included a variety
of demographic factors as determinants of human development outcomes (Boehmer and
Williamson 1996; Brady et al. 2007; Frey and Al-Roumi 1999; Frey and Field 2000;
London 1988; Nolan 1988; Shandra et al. 2004, 2005; Shen and Williamson 1997, 1999;
Wickrama and Lorenz 2002; Wimberley 1990) the role of international migration has been
neglected.
2.3 The Role of International Migration
Population dynamics (fertility, mortality, and migration) are vital to the prospects for
development (Barlow 1994; Crenshaw et al. 1997; Kelley and Schmidt 1995; Preston
1986). The relationship between population dynamics and development is commonly
expressed in terms of the demographic transition, which describes the shift from high
fertility and mortality toward lower fertility and mortality that occurs with economic
development and modernizing social structures (Kirk 1996). The historical experience of
developed countries generally demonstrates that persistently elevated fertility andmortality rates are impediments in the demographic transition toward advances in devel-
opment, including improvements in economic development, literacy, and longevity (Lee
2003). In this respect, international migration is important because it is a population
dynamic that can affect the factors that promote or impede the demographic transition
toward improvements in human development: ‘‘Immigration is the wild card: it can hasten
or slow these trends’’ (Kent and Haub 2005, p. 7).
I describe the impacts of migration on human development in the following discussion.
I focus the discussion on the impacts of migration in urban areas of developing countries
for two reasons. First, international migration in developing countries has historically been
directed predominately toward urban areas (Skeldon 1997). Second, urban areas arebecoming increasingly important as loci of social change in developing countries, as these
areas are expected to experience the largest gains in population in the foreseeable future:
‘‘Nearly all the net population growth in the next 50 years will occur in the cities and towns
of less developed countries …’’ (Kent and Haub 2005, p. 12). For these reasons, the
impacts of migration on human development outcomes are perhaps most clearly exem-
plified in the urban and urbanizing areas of developing countries.
2.3.1 Migration and the Human Influx
Historically, the ‘‘urban transition’’ (Weeks 2005, p. 99) from a predominately rural,
agricultural-based society to a largely urban, industrial-based society has been associated
with the demographic transition toward improvements in human development levels.
Rising urbanization levels have generally been associated with decreased fertility and
mortality levels and improved standards of living: … no country in the industrial age has
ever achieved significant economic growth without urbanization (UNFPA 2007, p. 1).
62 M. Sanderson
1 3
7/27/2019 10.1007_s11205-009-9467-0
http://slidepdf.com/reader/full/101007s11205-009-9467-0 5/25
Indeed, migration into urban areas has played a key role in promoting urbanization and the
demographic transition in developed countries (UN 2006, pp. 46–51).
Urbanization in developing countries, however, is qualitatively different from urbani-
zation in developed countries because it is shaped, at least in part, by the global political-
economic context (Roberts 1995; Smith 1996; Timberlake 1985). Urbanization patterns indeveloping countries exhibit several undesirable features related to the countries’ struc-
turally-disadvantaged positions in the global economy. Among the most pressing issues is
the problem of ‘‘overurbanization’’ (Smith 1987), which occurs when urbanization levels
increase faster than rates of economic development. In this context, population growth
outstrips the ability of the host economy and society to ‘‘adjust, absorb, and cope with the
human influx’’ (Smith 1987, p. 271), resulting in insufficient labor demand, unemployment,
and burgeoning informal sector employment levels (Evans and Timberlake 1980). Over-
urbanization has been shown to have detrimental effects on economic development in
LDCs (London 1987, 1988; London and Smith 1988; Smith 1996).
Migration fuels the ‘‘human influx’’ (Smith 1987, p. 271) that generates detrimentalurbanization patterns in developing countries. Internal, rural-urban, migration flows cer-
tainly play a key role in rising urbanization levels (Chen et al. 1998). However,
international migration into developing countries is also very important. About 80% of all
south-south international migration now occurs between countries with contiguous borders
(Martin and Widgren 2002; Ratha and Shaw 2007), and rural–urban migrations that cross
national boundaries are increasingly common, particularly where the income differential
between neighboring countries is higher (Ratha and Shaw 2007). Thus, to the extent that
immigration facilitates overurbanization, it is likely to have detrimental effects on human
development.
2.3.2 Impediments to Human Development
The harmful effects of migration on human development are also evident in the increased
prevalence of health problems in urban areas of developing countries. While cities were
once considered, ‘‘islands of privilege’’ (Harrison 1982, p. 145), with lower fertility and
mortality rates and higher standards of living for residents, they are increasingly becoming
‘‘unhealthy islands’’ (Stephens 1996, p. 9) as the advantages of urban life for health
outcomes deteriorates. Indeed, there is renewed concern over an emerging ‘‘urban penalty’’
(Harpham and Molyneux 2001, p. 119) associated with health outcomes in urban areas of many developing countries.
Infant mortality rates are a particularly important component of the renewed urban
penalty. While infant mortality rates have fallen dramatically in developed countries, they
have remained high or stable across a large proportion of urban areas in developing
countries (Brockerhoff and Brennan 1998). This trend is particularly ominous for human
development prospects because urban areas have historically been on the leading edge of
mortality declines in the demographic transition.
Persistently elevated infant mortality rates are attributable, at least in part, to the spread
of infectious diseases in the cities of developing countries. Indeed, while the prevalence of many communicable diseases has been dramatically reduced in developed countries, these
diseases remain prevalent in the cities of developing countries: ‘‘Urban malaria, for
example, has never gone away in many areas of the world … and for the urban poor in the
South, tuberculosis never went away’’ (Stephens 1996, p. 23). Immigration is important
here because human mobility, by definition, increases the risk of transmitting infectious
disease: ‘‘The frequency of contact, the density of the population and the concentration and
International Migration and Human Development in Destination Countries 63
1 3
7/27/2019 10.1007_s11205-009-9467-0
http://slidepdf.com/reader/full/101007s11205-009-9467-0 6/25
proximity of infective and susceptible people in an urban population promote the trans-
mission of the infective organisms. The constant influx of migrants susceptible to infection
and possible carriers of the new virulent strains of infective agents, together with the
inevitable increase in household numbers, foster the transfer of … microorganisms’’
(Satterthwaite 1993, p. 91).However, compounding the problem is the tendency for immigrants to face conditions
that promote the spread of infectious and communicable diseases. The relationship
between migration and HIV/AIDS exemplifies this situation (Decosas and Adrien 1997;
Mabey and Mayaud 1997; Quinn 1994). International migrants often work for extended
periods of time, usually measured in years, away from spouses in anomic social contexts
with ‘‘…limited access to health services, minimal social contact or recreational activities’’
(Lamptey et al. 2006, p. 6). These conditions increase the likelihood that migrants will
engage in risky sexual behaviors that spread HIV/AIDS (ILO 2002; Lurie 2006). Indeed,
migrants have been shown to be at a higher risk for HIV/AIDS than non-migrants (Brewer
et al. 1998; Hunt 1989; Lurie et al. 2003). Thus, by facilitating the spread of communicablediseases, including HIV/AIDS, immigration may impede declines in infant mortality rates
and reduce aggregate human development levels.
In addition to being detrimental to infant mortality, immigration may also negatively
impact human development by raising fertility rates. This may occur in one of two
ways. First, to the extent that it promotes increases in infant mortality rates, immigration
places upward pressure on fertility rates. Persistently elevated infant mortality rates
promote high fertility rates because families want to ensure that an appropriate number
of children survive. Second, immigrants generally exhibit higher fertility rates, partic-
ularly when they originate in rural areas (Brockerhoff 1995; Hirschman 1994; Zarateand de Zarate 1975). These fertility patterns are embedded in cultural norms and
expectations and can be resistant to change, at least in the short-term: ‘‘traditional
values are typically rooted in rural environments and among recent migrants to urban
areas. Cultural values, however, may persist long after the structural conditions in which
they originated have eroded’’ (Hirschman 1994, p. 216). Thus, immigration may raise
fertility rates, slowing the demographic transition, and potentially impeding human
development.
3 Method and Data
3.1 Dependent Variable
I assess the impact of international migration on human development by using the human
development index (HDI) (UNDP 1990). The HDI is a composite measure that combines
indices of three essential elements of human life: longevity, knowledge, and standard of
living. Longevity is measured using an estimation of life expectancy at birth for the
population. Knowledge is measured as a composite score of adult literacy and gross
primary and secondary enrollment rates for the population, with adult literacy weighted at67% and school enrollments weighted at 33%. The standard of living is a proxy for the
dimensions of human development not captured by measures of longevity and knowledge.
It is measured as the level GDP per capita adjusted for purchasing power parity in U.S.
dollars. An index for each dimension of the HDI is created by identifying the minimum and
maximum levels for the dimension, and entering these values into the following formula:
64 M. Sanderson
1 3

7/27/2019 10.1007_s11205-009-9467-0
http://slidepdf.com/reader/full/101007s11205-009-9467-0 7/25
Dimension index ¼ observed country value minimum value for all countries
maximum value minimum value
The dimension indices are then averaged to compute the HDI:
HDI ¼ 1
3 life expectancy indexð Þ þ
1
3 education indexð Þ þ
1
3 GDP indexð Þ:
3.2 Key Independent Variable
The key explanatory variable is international migration. International migration is
measured as the stock of international migrants as a percentage of the total population.
This measure is taken from the World Bank’s World Development Indicators database
(WB 2006b) and is logged to correct for skewness. The stock of international immi-grants is estimated from census data. These data included information on the place of
birth or the citizenship status of the enumerated population, which allowed identification
of the foreign born and foreign population. I expect that higher levels of international
migration will be associated with lower scores on the human development index, net of
controls.
3.3 Control Variables
Previous cross-national studies have identified international trade and foreign directinvestment (FDI) as important global-level explanations of human development out-
comes (Boehmer and Williamson 1996; Lena and London 1993; London 1988;
Shandra et al. 2004, 2005; Shen and Williamson 2001; Wimberley 1990). Thus, I
include controls for exports per GDP and stocks of FDI per GDP in order to assess the
impact of international migration on human development net of these controls. How-
ever, I advance previous cross-national studies by also including a measure of FDI
stocks decomposed by economic sector (primary, secondary) per GDP. These measures
allow us to assess whether and how the impact of FDI on human development differs
across economic sectors of the host economy. The FDI data are taken from the United
Nations’ World Investment Directories (UN 1992, 1994, 1996, 2000, 2003) and theOrganization for Economic Co-Operation and Development’s International Direct
Investment Statistics Yearbook (OECD 2001), and are logged to correct for skewness.
The exports data are taken from the World Bank’s World Development Indicators
database (WB 2006b).
Previous studies (Dixon and Boswell 1996; Firebaugh 1992) have found that domestic
investment and foreign investment can have different effects on host social structures.
My analysis therefore includes a control for gross domestic investment per GDP in order
to distinguish between any differential effects of investment sources on human
development.
The analysis includes several other controls for important intranational explanations of
human development outcomes. I control for the impact of size of the domestic market and
the aggregate level of wealth in a society by including the level of GDP per capita. I also
include a control for the prevalence of health care resources and medical care infrastructure
in the country by including the number of physicians per 1,000 in the population. This
International Migration and Human Development in Destination Countries 65
1 3
7/27/2019 10.1007_s11205-009-9467-0
http://slidepdf.com/reader/full/101007s11205-009-9467-0 8/25
variable has been used in previous cross-national studies of health outcomes (Shen and
Williamson 1997; Wimberley 1990).
Previous studies have identified political democracy as an important intranational
explanation of human development outcomes (Frey and Al-Roumi 1999; Shandra et al.
2004, 2005). Democratic political structures are more likely to respond to public opinionand special interest groups concerned with issues related to development than more
repressive political structures. I control for this effect by including a measure of domestic
political structure. Values on this variable range from -10 to ?10, with lower scores
indicating more authoritarian political structures and higher scores indicating more dem-
ocratic political structures. These data are taken from the Polity IV dataset (Marshall et al.
2006).
The analysis also controls for a number of demographic factors that could impact
human development. The age composition of the population has important implications
for development. Populations with relatively young age structures are characterized by a
dependency burden that can impede human development outcomes (Barlow 1994). Icontrol for the dependency burden by including the infant mortality rate, which proxies
the size of the youth population. As birth cohorts age, they enter the labor force and
transition from net resource consumers to become net resource producers, producing a
‘‘demographic windfall’’ (Crenshaw et al. 1997) effect as the size of the labor force
expands relative to the other segments of the population. Higher levels of the population
in the prime working-age category should thus produce positive spillover effects for
human development. I control for the demographic windfall effect by including the
percentage of the total population in the 20–29 age category. All of the age compo-
sition variables are taken from the United Nations’ (2007) World Population Prospectsdataset.
The analysis also includes a control for the spatial distribution of the population. Higher
levels of urbanization may be associated with reduced development levels in developing
countries (London and Smith 1988; Smith 1987, 1996). As a result, there is renewed
discussion of an ‘‘urban penalty’’ (Harpham and Molyneux 2001) associated with health
outcomes in the cities of many developing countries. However, urbanization is also con-
sidered to be an important prerequisite for economic development and rising levels of
human development (UNFPA 2007, p. 1). Rising levels of urbanization allow for
agglomeration of industries, and economies of scale, promoting economic development
(McNicoll 1984). Similarly, higher levels of urbanization may also allow for health to betreated for efficiently and effectively, thus reducing the prevalence of factors that increase
morbidity and mortality. Finally, urbanization levels are closely associated with past levels
of rural–urban, or internal, migration levels (White and Lindstron 2006). Internal migration
and international migration are qualitatively different types of population movements
(White and Lindstron 2006). It is important not to confound these two types of movements
in assessing the impact of international migration on human development. The analyses of
economic and human development therefore control for the percentage of population in
urban areas. These data are taken from the World Bank’s (2006b) World Development
Indicators database.The analysis also includes controls for the status of women. The status of women in
society is an important explanation of human development outcomes (Boehmer and
Williamson 1996; Shen and Williamson 1997, 1999). I measure the status of women
with two measures, each of which captures a unique aspect of the status of women in
society.
66 M. Sanderson
1 3
7/27/2019 10.1007_s11205-009-9467-0
http://slidepdf.com/reader/full/101007s11205-009-9467-0 9/25
Education is a crucial determinant of fertility behavior (Caldwell 1982) and rising levels
of education among females strongly reduces fertility rates and improves a variety of
human development outcomes (Cleland and Hobcraft 1985). Rising levels of education
also improve the relative status of women in society, which is associated with decreases in
fertility and infant mortality and increases in positive health outcomes for women(Caldwell 1993; Hirschman 1994; Subbarao and Raney 1995; Wickrama and Lorenz
2002). The analysis controls for the aggregate level of female education by including a
measure of the gross secondary school enrollment ratio for females. The gross secondary
school enrollment ratio is the ratio of total school enrollment, regardless of age, to the
population of the age group that officially corresponds to the secondary level of education.
These data are taken from the United Nations’ (UN 2005) Population, Resources, and
Environment database.
I also control for a second aspect of women’s status: the female labor force partici-
pation rate. The female labor force participation rate is the percentage of the total
economically active population who are females. The economically active populationrefers to all employed and unemployed women, including those seeking work for the first
time, persons working on their own account, employees, unpaid family workers, members
of producers’ cooperatives and members of the armed forces. Like the rate of female
education, higher levels of female participation in the labor force may indicate that women
have obtained a higher level of status in society. If so, female labor force participation
would be expected to be associated with improvements in human development. However,
higher levels of female labor force participation may have a detrimental effect on infant
mortality rates because working mothers may not have sufficient time to devote to caring
for infants (Hobcraft et al. 1984). Thus, it is necessary to distinguish between the impact of education and labor force participation for women, as they may have different effects on
human development. These data are taken from the United Nations’ (2005) Population,
Resources, and Environment database.
Finally, in order to capture time-specific effects that may affect the level of human
development but are not explicitly controlled for in the analysis (e.g. military conflicts,
famines, refugee crises), the analysis includes dummy variables for each of the 10-year
periods, or waves, examined in the analysis (Wooldridge 2006).
3.4 Panel Analysis
This study uses cross-national panel data to examine the impact of international migration
on human development in developing countries. The panel dataset includes data measured
at ten year intervals over the period, 1970–2005. The dependent variable is lagged ten
years in each wave in order to allow hypothesized effects to become evident.
Unobserved effects are central to the problem of causal inference, and panel data
provide an advantage over cross-sectional data in addressing the issue of unobservable
influences (Halaby 2004). Panel models have traditionally included a lagged endogenous
variable on the right hand side of the equation and used ordinary least-squares to estimate
the model. Including the lagged endogenous variable is considered to at least partiallycontrol for the unobserved effects of omitted variables on the dependent variable (Finkel
1995).
Fixed effects models and random effects models represent more sophisticated approa-
ches to the problem of unobserved heterogeneity. Between-unit variation is the source of
heterogeneity bias in OLS (Stimson 1985, p. 921). Ordinary least squares, however, cannot
International Migration and Human Development in Destination Countries 67
1 3

7/27/2019 10.1007_s11205-009-9467-0
http://slidepdf.com/reader/full/101007s11205-009-9467-0 10/25
address the problem because it assumes observations are homogenous on the level of the
dependent variable; that is, observations are constrained to a common intercept (Stimson
1985, p. 921). To correct for heterogeneity bias, fixed effects and random effects models
‘‘simulate’’ (Alderson and Nielsen 1999, p. 616) time-invariant country-specific effects by
allowing each country to have a unique intercept, or effect.The two approaches differ, however, in how each treats country-specific effects. Fixed
effects models introduce a series of dummy variables to allow each country to have a
unique effect (Wooldridge 2006). It treats the country-specific effects as ‘fixed’ while
retaining the classic OLS error structure. Fitting individual intercepts effectively removes
all between-unit variation from the data, thereby removing the source of heterogeneity bias
(Stimson 1985). The fixed effects model is specified as follows:
yit ¼ ao þ ai þ b0 xit þ eit
where ao is the mean overall intercept; ai is the country-specific intercept, or the country-
specific deviation from the overall mean intercept for country i that explicitly controls for
unobserved heterogeneity; xit is a vector of covariates for country i at time t ; and eit is the
familiar error term from OLS.
Random effects modeling treats the country-specific intercepts as part of the error term
and considers them as ‘random’ draws from a larger population (Wooldridge 2006).
Because the country-specific effects are considered to be random, the distribution
parameters (mean and variance) are of more interest than the individual ‘fixed’ country-
specific effects (Stimson 1985, p. 923). Random effects modeling corrects for unobserved
heterogeneity by specifying the bias and modeling it as part of a complex error structure.
The random effects model is specified as follows:
yit ¼ ao þ b0 xit þ ui þ eit
where ao is the mean overall intercept; xit is a vector of covariates for country i at time t ; ui
is the country-specific effect, or the country-specific deviation from the overall mean
intercept for country i that explicitly controls for unobserved heterogeneity; and eit is
disturbance term.
3.5 Sample Composition
The countries included in the analyses are selected on the basis of data availability.
Countries are included in the analysis if they have information on the endogenous variable
at time t and the exogenous variables at time t-10. For example, a country is included in the
analysis if it has data available on the endogenous variable at time t (measured in 1980,
1990, 2000, or 2005) and on all of the exogenous variables at time t-10 (measured in 1970,
1980, 1990, or 1995). On the contrary, a country would not be included in the analysis if it
is missing data on the endogenous variable at time t or any of the exogenous variables at
time t-10.
Because countries are included in the analyses based upon data availability, the sampleis not, strictly speaking, a random draw from the population of all less-developed countries.
However, two issues are worth noting. First, the sample includes countries from each
region of the less-developed world, with countries in the Latin America and Caribbean
region being overrepresented. There are six countries from the East Asia and Pacific
region, five countries from the South Asia region, seventeen countries from the Latin
68 M. Sanderson
1 3

7/27/2019 10.1007_s11205-009-9467-0
http://slidepdf.com/reader/full/101007s11205-009-9467-0 11/25
America and Caribbean region, and four countries from the Eastern Europe and Central
Asian region. Thus, to the extent that the results of the analyses are generalizable, they
likely are more representative of Latin American and Caribbean countries than of countries
in other regions of the less-developed world. Appendix 1, lists the countries included in the
analysis.Second, the measures of central tendency for the endogenous variable (HDI) and the
key exogenous variable (international migrants per capita) in the sample are similar
when compared to the total population of countries for which data was available.
Appendix 2 presents correlation coefficients and basic descriptive statistics for the vari-
ables and Appendix 3 provides a comparison of basic descriptive statistics for the
endogenous variable and key exogenous variable for the sample and the total population
of countries.
3.6 Robustness Checks
In order to assess the robustness of the estimates, several checks were implemented. First,
bivariate plots were inspected for the presence of outliers. Armenia, Estonia, Georgia,
Kazakhstan, and Lithuania—five successor states of the former Soviet Union—and
Slovakia—a successor state of the former Czechoslovakia were outliers with very large
stocks of international migrants. These countries were excluded from the analysis because
the international migration data for these countries reflects substantial error from re-
classification of international migration. I note, however, that excluding these countries
does not change the substantive findings of the analyses.
Second, the models were estimated using two different estimation techniques forpanel data: random and fixed effects modeling. There is considerable debate over
whether fixed effects or random effects modeling is a more appropriate method of
addressing the problem of unobserved heterogeneity. The choice over whether to employ
random or fixed effects modeling in the analysis is commonly resolved by using the
Hausman test to test for statistical differences in the random and fixed effects estimators
(Halaby 2004). Where it was possible to run them, Hausman tests favored the fixed
effects models over the random effects models in my analysis. However, the findings
were robust to both random and fixed effects specifications. I present estimates from both
random and fixed effects models in order to assess the robustness of the findings acrossdifferent modeling techniques.
Third, although the analyses incorporate data on the largest possible sample given data
availability, the estimates might be sensitive to sample composition. Thus, two different
resampling techniques were used to estimate the standard errors for the coefficients:
bootstrapping and jackknifing. Both bootstrapping and jackknifing are data-dependent,
nonparametric, approaches to estimating standard errors from the observed distribution
of the sample (Davison and Hinkley 1997; Efron 1979; Mooney and Duval 1993).
Bootstrapping constructs samples of the standard errors by taking random draws of N
observations from a N -observation dataset. For this analysis, the bootstrapped standard
errors were calculated based upon 1,000 repetitions of sample size 34.Jackknifing repeatedly calculates the statistic by omitting one randomly-selected
observation from each sample. As a result, jackknifing has been used to check the
robustness of the estimates to influential observations in addition to its utility as a
resampling technique (Gould 1994). Because the data are clustered, one country (i.e.,
International Migration and Human Development in Destination Countries 69
1 3

7/27/2019 10.1007_s11205-009-9467-0
http://slidepdf.com/reader/full/101007s11205-009-9467-0 12/25
observation) was omitted from each sample when calculating the jackknife standard errors
for the estimates.
The estimates are presented below with standard errors estimated using random and
fixed effects modeling. However, these estimates were robust to both the bootstrap and the
jackknife resampling techniques. Results from these supplemental analyses are availableupon request.
4 Results
The central finding of the analysis is that international migration has a negative effect on
human development levels over a 10-year period, net of controls. The negative impact of
international migration is robust across both random and fixed effects modeling techniques
and in the presence of all control variables. However, it is important to note that the effectof international migration is relatively small: because the migration variable is logarith-
mically transformed, a 1% increase in international migration as a proportion of the
population is associated with a decline of 0.01 in the human development index.
While no other variable has a consistent effect on human development across random
and fixed effects models, four variables are robust across random effects models net of
controls. Levels of economic development are positively associated with human devel-
opment, while infant mortality rates have a negative effect on human development across
random effects models. I also find that the two measures of women’s status have con-
trasting effects. Female labor force participation rates have a negative impact on human
development, but female education rates have a positive impact on human development.The models also provide partial evidence that stocks of FDI have a positive effect on
human development, and that there is a trend toward rising levels of human development
since 1970 across developing countries.
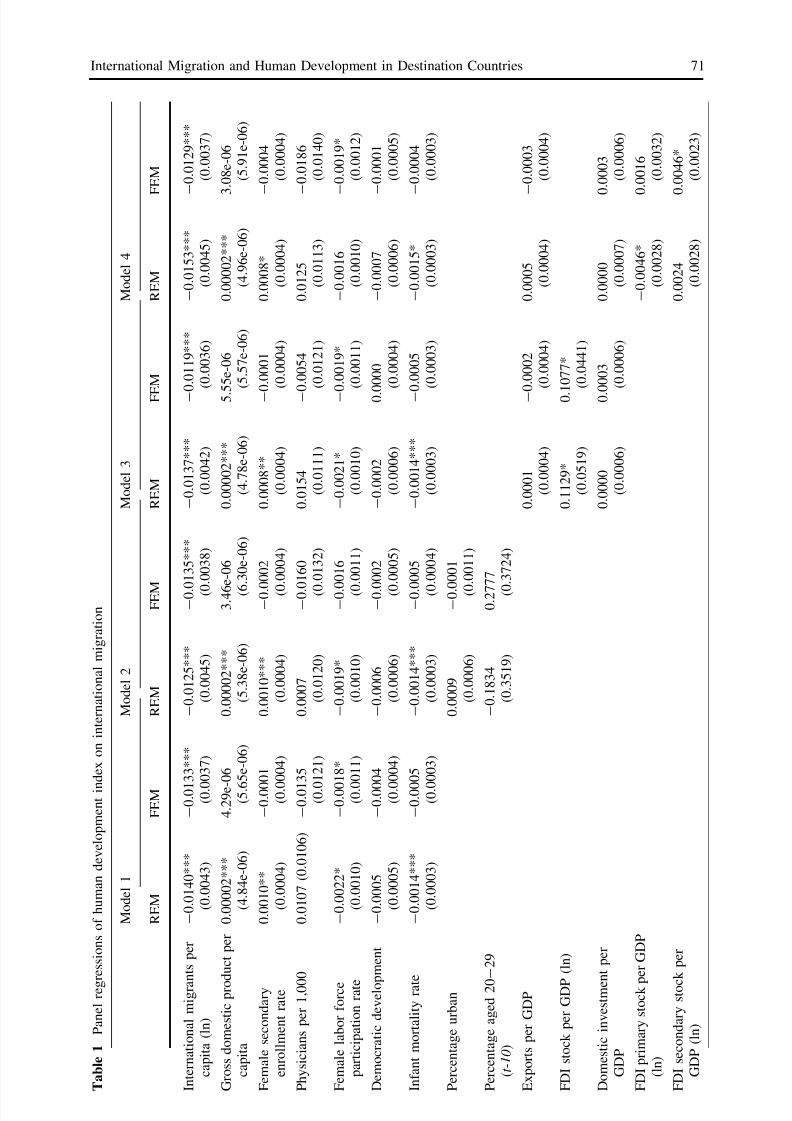
The complete results are given in Table 1, which includes four models.
Model 1 includes international migration along with controls for important intra-
national characteristics of the country: levels of economic development, female education
rates, prevalence of medical resources, female labor force participation rates, levels of
democratic development, and infant mortality rates. International migration has a negative
effect on human development, net of these control variables. Higher levels of internationalmigration are associated with lower levels of human development. This effect is robust
across random and fixed effects models. This finding provides support for Malthusian-type,
population pessimist theories that view immigration as a detriment to human development.
Higher levels of female labor force participation rates also have a negative effect on human
development. This effect is robust across modeling techniques. However, while higher
rates of female participation in the labor market have a detrimental impact on human
development, higher rates of female education are positively associated with human
development. Economic development also has a positive effect on human development
levels. Infant mortality rates are also negatively associated with human development.
However, the effects of female education, economic development, and infant mortality arenot robust across modeling techniques. The prevalence of medical resources and the level
of democratic development are not associated with human development in this model. The
results do, however, find partial evidence that human development levels have consistently
increased since 1970, as each of the time trend variables in the fixed effects models is
positive and significant.
70 M. Sanderson
1 3
7/27/2019 10.1007_s11205-009-9467-0
http://slidepdf.com/reader/full/101007s11205-009-9467-0 13/25
T a b l e 1
P a n e l r e g r e s s i o n s o f h u m a n d e v e l o p m e n t i n d e x o n i n t e r n a t i o n a l m i g r a t i o n
M o d e l 1
M o d e l 2
M o d e l 3
M o d e l 4
R E M
F E M
R E M
F E M
R E M
F E M
R E M
F
E M
I n t e r n a t i o n a l m i g r a n t s p e r
c a p i t a ( l n )
- 0 . 0 1 4 0 * * *
( 0 . 0 0 4 3 )
- 0 . 0 1 3 3 * * *
( 0 . 0 0 3 7 )
- 0 . 0 1 2 5 * * *
( 0 . 0 0 4 5 )
- 0 . 0 1 3 5 * * *
( 0 . 0 0 3 8 )
- 0 . 0 1 3 7 * * *
( 0 . 0 0 4 2 )
- 0
. 0 1 1 9 * * *
(
0 . 0 0 3 6 )
- 0 . 0 1 5 3 * * *
( 0 . 0 0 4 5 )
- 0 . 0 1 2 9 * * *
( 0 . 0 0 3 7 )
G r o s s d o m e s t i c p r o d u
c t p e r
c a p i t a
0 . 0 0 0 0 2 * * *
( 4 . 8 4 e - 0 6 )
4 . 2 9 e - 0 6
( 5 . 6 5 e - 0 6 )
0 . 0 0 0 0 2 * * *
( 5 . 3 8 e - 0 6 )
3 . 4 6 e
- 0 6
( 6 . 3 0 e - 0 6 )
0 . 0 0 0 0 2 * * *
( 4 . 7 8 e - 0 6 )
5 . 5 5 e - 0 6
(
5 . 5 7 e - 0 6 )
0 . 0 0 0 0 2 * * *
( 4 . 9 6 e - 0 6 )
3
. 0 8 e - 0 6
( 5 . 9 1 e - 0 6 )
F e m a l e s e c o n d a r y
e n r o l l m e n t r a t e
0 . 0 0 1 0 * *
( 0 . 0 0 0 4 )
- 0 . 0 0 0 1
( 0 . 0 0 0 4 )
0 . 0 0 1 0 * * *
( 0 . 0 0 0 4 )
- 0 . 0 0 0 2
( 0 . 0 0 0 4 )
0 . 0 0 0 8 * *
( 0 . 0 0 0 4 )
- 0
. 0 0 0 1
(
0 . 0 0 0 4 )
0 . 0 0 0 8 *
( 0 . 0 0 0 4 )
- 0 . 0 0 0 4
( 0 . 0 0 0 4 )
P h y s i c i a n s p e r 1 , 0 0 0
0 . 0 1 0 7 ( 0 . 0 1 0 6 )
- 0 . 0 1 3 5
( 0 . 0 1 2 1 )
0 . 0 0 0 7
( 0 . 0 1 2 0 )
- 0 . 0 1 6 0
( 0 . 0 1 3 2 )
0 . 0 1 5 4
( 0 . 0 1 1 1 )
- 0
. 0 0 5 4
(
0 . 0 1 2 1 )
0 . 0 1 2 5
( 0 . 0 1 1 3 )
- 0 . 0 1 8 6
( 0 . 0 1 4 0 )
F e m a l e l a b o r f o r c e
p a r t i c i p a t i o n r a t e
- 0 . 0 0 2 2 *
( 0 . 0 0 1 0 )
- 0 . 0 0 1 8 *
( 0 . 0 0 1 1 )
- 0 . 0 0 1 9 *
( 0 . 0 0 1 0 )
- 0 . 0 0 1 6
( 0 . 0 0 1 1 )
- 0 . 0 0 2 1 *
( 0 . 0 0 1 0 )
- 0
. 0 0 1 9 *
(
0 . 0 0 1 1 )
- 0 . 0 0 1 6
( 0 . 0 0 1 0 )
- 0 . 0 0 1 9 *
( 0 . 0 0 1 2 )
D e m o c r a t i c d e v e l o p m
e n t
- 0 . 0 0 0 5
( 0 . 0 0 0 5 )
- 0 . 0 0 0 4
( 0 . 0 0 0 4 )
- 0 . 0 0 0 6
( 0 . 0 0 0 6 )
- 0 . 0 0 0 2
( 0 . 0 0 0 5 )
- 0 . 0 0 0 2
( 0 . 0 0 0 6 )
0 . 0 0 0 0
(
0 . 0 0 0 4 )
- 0 . 0 0 0 7
( 0 . 0 0 0 6 )
- 0 . 0 0 0 1
( 0 . 0 0 0 5 )
I n f a n t m o r t a l i t y r a t e
- 0 . 0 0 1 4 * * *
( 0 . 0 0 0 3 )
- 0 . 0 0 0 5
( 0 . 0 0 0 3 )
- 0 . 0 0 1 4 * * *
( 0 . 0 0 0 3 )
- 0 . 0 0 0 5
( 0 . 0 0 0 4 )
- 0 . 0 0 1 4 * * *
( 0 . 0 0 0 3 )
- 0
. 0 0 0 5
(
0 . 0 0 0 3 )
- 0 . 0 0 1 5 *
( 0 . 0 0 0 3 )
- 0 . 0 0 0 4
( 0 . 0 0 0 3 )
P e r c e n t a g e u r b a n
0 . 0 0 0 9
( 0 . 0 0 0 6 )
- 0 . 0 0 0 1
( 0 . 0 0 1 1 )
P e r c e n t a g e a g e d 2 0 - 2 9
( t - 1 0 )
- 0 . 1 8 3 4
( 0 . 3 5 1 9 )
0 . 2 7 7
7
( 0 . 3 7 2 4 )
E x p o r t s p e r G D P
0 . 0 0 0 1
( 0 . 0 0 0 4 )
- 0
. 0 0 0 2
(
0 . 0 0 0 4 )
0 . 0 0 0 5
( 0 . 0 0 0 4 )
- 0 . 0 0 0 3
( 0 . 0 0 0 4 )
F D I s t o c k p e r G D P ( l n )
0 . 1 1 2 9 *
( 0 . 0 5 1 9 )
0 . 1 0 7 7 *
(
0 . 0 4 4 1 )
D o m e s t i c i n v e s t m e n t
p e r
G D P
0 . 0 0 0 0
( 0 . 0 0 0 6 )
0 . 0 0 0 3
(
0 . 0 0 0 6 )
0 . 0 0 0 0
( 0 . 0 0 0 7 )
0
. 0 0 0 3
( 0 . 0 0 0 6 )
F D I p r i m a r y s t o c k p e r G D P
( l n )
- 0 . 0 0 4 6 *
( 0 . 0 0 2 8 )
0
. 0 0 1 6
( 0 . 0 0 3 2 )
F D I s e c o n d a r y s t o c k
p e r
G D P ( l n )
0 . 0 0 2 4
( 0 . 0 0 2 8 )
0
. 0 0 4 6 *
( 0 . 0 0 2 3 )
International Migration and Human Development in Destination Countries 71
1 3

7/27/2019 10.1007_s11205-009-9467-0
http://slidepdf.com/reader/full/101007s11205-009-9467-0 14/25
T a b l e 1
c o n t i n u e d
M o d e l 1
M o d e l 2
M o d e l 3
M o d e l 4
R E M
F E M
R E M
F E M
R E M
F E M
R E M
F
E M
1 9 8 0
- 0 . 0 0 0 8
( 0 . 0 1 2 0 )
0 . 0 4 8 9 *
* *
( 0 . 0 1 2 8 )
0 . 0 0 2 2
( 0 . 0 1 3 1 )
0 . 0 4 4
5 * * *
( 0 . 0 1 5 1 )
- 0 . 0 0 3 8
( 0 . 0 1 2 0 )
0 . 0 4 4 8 * * *
(
0 . 0 1 3 1 )
- 0 . 0 1 3 1
( 0 . 0 1 3 0 )
0
. 0 5 9 1 * * *
( 0 . 0 1 6 8 )
1 9 9 0
0 . 0 1 3 0 ( 0 . 0 0 5 8 )
0 . 0 9 4 1 *
* *
( 0 . 0 2 0 3 )
0 . 0 1 4 1
( 0 . 0 0 6 0 )
0 . 0 8 6
4 * * *
( 0 . 0 2 4 5 )
0 . 0 0 2 9
( 0 . 0 1 7 8 )
0 . 0 8 1 7 * * *
(
0 . 0 2 0 7 )
0 . 0 0 2 2
( 0 . 0 1 8 1 )
0
. 1 0 8 1 * * *
( 0 . 0 2 4 1 )
1 9 9 5
0 . 0 0 2 5 *
( 0 . 0 2 0 1 )
0 . 1 0 1 4 *
* *
( 0 . 0 2 3 9 )
0 . 0 0 8 5 *
( 0 . 0 2 4 4 )
0 . 0 9 5
6 * * *
( 0 . 0 2 6 8 )
- 0 . 0 1 4 8
( 0 . 0 2 0 4 )
0 . 0 8 3 7 * * *
(
0 . 0 2 4 7 )
- 0 . 0 1 4 0
( 0 . 0 2 0 5 )
0
. 1 1 6 0 * * *
( 0 . 0 2 8 5 )
C o n s t a n t
0 . 6 9 0 0 * * *
( 0 . 0 4 3 7 )
0 . 6 6 7 2 *
* *
( 0 . 0 3 8 4 )
0 . 6 8 6 6 * * *
( 0 . 0 8 5 0 )
0 . 6 3 1
1 * * *
( 0 . 0 8 6 0 )
0 . 6 8 1 8 * * *
( 0 . 0 4 5 8 )
0 . 6 6 1 3 * * *
(
0 . 0 4 1 0 )
0 . 6 5 5 1 * * *
( 0 . 0 5 2 1 )
0
. 7 0 0 8 * * *
( 0 . 0 5 6 2 )
R 2
0 . 8 8 2
0 . 4 4 4
0 . 8 8 9
0 . 3 2 5
0 . 8 6 2
0 . 5 4 1
0 . 8 8 9
0
. 1 8 8
N
3 4 / 6 6
3 4 / 6 6
3 4 / 6 6
3 4 / 6 6
3 4 / 6 6
3 4 /
6 6
3 4 / 6 6
3
4 / 6 6
* * * p \
. 0 0 1 ; * * p \
. 0 1 ; * p \
. 0 5 ( o n e - t a i l e d t e s t s )
72 M. Sanderson
1 3
7/27/2019 10.1007_s11205-009-9467-0
http://slidepdf.com/reader/full/101007s11205-009-9467-0 15/25
In Model 2, I include controls for the age composition and the spatial distribution of the
population. Neither of these variables has an effect on human development in these
models. International migration remains negative and significant, net of these control
variables, and is robust across random and fixed effects models. The opposing effects of
women’s status remain apparent in this model. Higher levels of female labor force par-ticipation rates have a negative effect on human development, but higher rates of female
education are positively associated with human development. However, compared to
Model 1, female labor force participation rates are no longer robust across random and
fixed effects models. Infant mortality rates are also negatively associated with human
development, but this effect is not apparent in the fixed effect model. Similarly, economic
development has a positive impact on human development, but only in the random effects
model. The prevalence of medical resources and the level of democratic development are
not associated with human development in this model. The time trend variables indicate
rising levels of human development since 1970, but this effect is not robust across
modeling techniques.In Model 3, I add controls for international trade and FDI to assess the impact of
international migration on human development net of these important international
variables. I also include domestic investment to control for the differential effects of
foreign and domestic investment on human development. International migration has a
negative effect on human development, net of these controls, and it is robust across
random and fixed effects models. Contrary to the global political economy literature, I
find that stocks of FDI have a positive effect on human development. This effect is
robust across random and fixed effects models. International trade and domestic
investment, however, do not have an effect on human development in these models. Thetwo measures of women’s status have contrasting effects, as higher levels of female
labor force participation rates are associated with lower levels of human development,
but higher levels of female education rates are associated with higher levels of human
development. Of these two variables, however, only the negative effect of female labor
force participation rates is consistent across random and fixed effects models. Infant
mortality rates are also negatively associated with human development, but this effect is
not apparent in the fixed effect model. The prevalence of medical resources and the level
of democratic development are not associated with human development in this model.
The models again report partial evidence that human development levels have consis-
tently increased since 1970, as each of the time trend variables in the fixed effectsmodels is positive and significant.
In Model 4, I substitute controls for FDI decomposed across economic sectors of the
host economy for the aggregated FDI variable used in Model 3. International migration
still has a negative effect on human development, net of the disaggregated FDI measures
and other controls. This effect is robust across random and fixed effects models. Neither
FDI primary stocks nor FDI secondary stocks are robust across modeling techniques.
However, the analysis does indicate that the aggregate FDI stocks measure may conceal
contradictory effects of FDI on human development. In the random effects model, stocks
of FDI in the primary sector have a negative impact on human development, but FDIsecondary stocks has no effect. In the fixed effects model, stocks of FDI in the secondary
sector has a positive effect on human development, but FDI primary has no effect.
International trade and domestic investment do not have an effect on human develop-
ment in these models. Female education rates are positively associated with human
development, but are only significant in the random effects model. Female labor force
International Migration and Human Development in Destination Countries 73
1 3

7/27/2019 10.1007_s11205-009-9467-0
http://slidepdf.com/reader/full/101007s11205-009-9467-0 16/25
participation rates are negatively associated with human development, but are only
significant in the fixed effects models. Infant mortality rates are also negatively asso-
ciated with human development, but this effect is not apparent in the fixed effect model.
Similarly, economic development has a positive impact on human development, but only
in the random effects model. The prevalence of medical resources and the level of democratic development are not associated with human development in this model. The
time trend variables indicate rising levels of human development since 1970, but this
effect is not robust across modeling techniques.
5 Discussion
This study suggests that international migration is an important explanation of cross-
national variation in human development levels. This analysis finds that higher levels of international migration are associated with lower human development levels over a 10-year
period. This finding is robust across two different modeling techniques that include con-
trols for important international and internal economic, demographic, and political
explanations of human development. Developing countries with larger shares of interna-
tional migrants as a proportion of the population face several impediments to human
development as a result of the international immigration. While the harmful impacts of
migrant streams into developed countries tend to be diminished by relatively robust
economies, political structures, and social welfare infrastructures, it is likely that migration
into less-developed countries places excess burden on the relatively minimal infrastruc-
tures that support social welfare and human well-being. As a result, immigration intodeveloping countries tends to undermine, rather than promote, human development and
social well-being.
This analysis contributes to our understanding of the structural impacts of international
migration on development outcomes in less-developed countries. As the destinations of
migrant flows becomes increasingly diverse (Castles and Miller 2003) and a broader array
of developing countries are more deeply enmeshed into global processes, understanding
the structural consequences of international migration will only become more important
both for social theory and for development policies.
It is worth stressing, however, that the findings reported here suggest that although theeffect of international migration is statistically significant, it is also relatively small in
size: a 1% increase in the stock of international immigrants as a proportion of the
population is associated with a .01 decrease in the human development index. Thus,
these findings lend credence to the importance of international migration as an expla-
nation of human development outcomes in cross-national research. In this respect, much
more research along these lines is needed. For example, there is reason to believe that
the effect of international migration might be larger than is indicated by the findings
presented here, as the indicators of international migration stocks in less-developed
countries likely undercount, quite significantly, the actual size of the foreign born
populations (Zlotnik 1998). Most migrants who move into less-developed countries arefrom younger age cohorts, which increases the likelihood that they will enter the host
country without documents, or illegally (McKenzie 2008). Thus, to the extent that
censuses and population registers in less-developed countries undercount undocumented
migration, the effect of international migration could be larger than these findings sug-
gest. Hence, the need for future research. Regardless, however, the results presented here
74 M. Sanderson
1 3

7/27/2019 10.1007_s11205-009-9467-0
http://slidepdf.com/reader/full/101007s11205-009-9467-0 17/25
do not support the position that international migration is the strongest, nor the most
important, explanation of human development levels in migrant-receiving countries in
the less-developed world.
Nevertheless, the findings do advance cross-national scholarship on human devel-
opment in several ways. Previous studies have relied primarily on economic measuressuch as international trade and foreign direct investment to assess the impact of global
integration on human development. By demonstrating the explanatory power of inter-
national migration, I have identified an important non-economic dimension of global
integration that exerts a significant effect on human development levels across countries
and over time. Thus, this study suggests that incorporating international migration into
theoretical and empirical models would further enhance our understanding of global-
ization as a multidimensional phenomenon that includes both economic and non-
economic components. Studies that consider only economic forms of global integration
offer less complete answers to increasingly complex questions about the consequences
of globalization.Another contribution of this analysis is to provide additional insights into the effect of
foreign direct investment on development. Compared to previous studies, I examine the
effect of foreign direct investment on a broader measure of development and over a
longer time horizon. The analysis controls for a wider array of variables and uses more
sophisticated modeling techniques that address methodological problems inherent in
panel analysis. I also disaggregate foreign direct investment by economic sectors in
addition to assessing the impact of the total stock of foreign direct investment. When
measured in the traditional manner as total stocks, foreign direct investment has a
positive impact on human development levels. This finding is contrary to some of theprevious research in this area, which reports a negative impact of foreign investment
(Lena and London 1993; London 1988; Shandra et al. 2004, 2005; Shen and Williamson
2001; Wimberley 1990). However, when foreign direct investment is disaggregated
across economic sectors, the results are more mixed. Foreign investment in the primary
sector has a negative effect on human development and foreign investment in the sec-
ondary sector has a positive effect. While neither of these effects is robust across
modeling techniques, this analysis does provide a more nuanced understanding of the
relationship between foreign direct investment and human development and suggests an
important area for future research. Previous studies that report that foreign investment
has a detrimental impact on human development outcomes might be capturing the effectof foreign investment in the primary sector. Thus, if samples are comprised largely of
countries in which primary sector foreign investment is predominate, the findings may be
a partial artifact of sample composition. Subsequent studies on the relationship between
sectoral foreign investment and development outcomes are therefore particularly
worthwhile.
Two other notable findings are the relatively minimal impact of per capita income levels
and the relatively robust impacts of women’s status on human development. While the
traditional answer to human development problems is to raise per capita income levels, this
analysis suggests that this strategy may have limited impact. Economic development cer-tainly promotes social well-being, as these findings indicate, but there are several other non-
economic factors that have larger impacts on human development levels, including
migration.
In this respect, the status of women in society is another such factor. The analysis
suggests that women’s status has opposing effects on human development. Countries with
higher proportions of educated women tend to have higher human development levels.
International Migration and Human Development in Destination Countries 75
1 3

7/27/2019 10.1007_s11205-009-9467-0
http://slidepdf.com/reader/full/101007s11205-009-9467-0 18/25
However, human development levels tend to be lower where women represent larger
proportions of the labor force. These findings suggest the importance of educating women
for development prospects but also provide evidence of the importance of women in
providing child care and basic needs for households in developing countries. These find-
ings deserve serious attention in future research in that they may provide additionalinsights into the expanding role of women in development processes.
Finally, this analysis has implications for development policies. Although international
migration remains the ‘‘step-child’’ (Bouvier et al. 1997; Goldstein 1976) of demographic
research and development policy, these findings suggests the need to more thoroughly
incorporate international migration into development frameworks. At the national level,
migration clearly has an impact on labor markets, political structures, and social welfare
infrastructures. While I acknowledge the constraints placed upon policy construction by
transnational social structures (Meyers 2000), it remains incumbent upon national poli-
cymakers to account for the impact of international migration, regardless of the size of its
relative effect on host social structures and development outcomes.Economic growth and human development are correlated, and raising per capita
incomes is important for development prospects. However, there is increasing evidence
that suggests that improvements in human development outcomes are more important for
increasing living standards (Ranis et al. 2000). Country performance in raising living
standards depends on two factors: the time sequencing of the relationship and the strength
of the association (Ranis et al. 2000).
In terms of the timing of development policies, human development seems to be more
important than economic development. Development policies that emphasize economic
growth, without concomitant improvements in human development, tend to lead countriestoward a ‘‘dead end’’, while policies that promote human development can lead countries
toward virtuous, mutually-reinforcing cycles that promote both economic and human
development: ‘‘Economic growth itself will not be sustained unless preceded or accom-
panied by improvements in human development (Ranis et al. 2000, pp. 212–213). Thus, to
the extent that migration is detrimental for human development, it is likely to also
undermine the prospects for economic development. In response, policymakers should
attempt to strengthen the relationship between economic and human development. In this
respect, these results provide evidence that states could potentially minimize the detri-
mental impact of international migration by providing sufficient resources for health and
education, particularly for women.
Appendix 1
See Table 2.
76 M. Sanderson
1 3

7/27/2019 10.1007_s11205-009-9467-0
http://slidepdf.com/reader/full/101007s11205-009-9467-0 19/25
Appendix 2
See Table 3.
Table 2 Countries included in cross-national analysis of human development
1970–1980 1980–1990 1990–2000 1995–2005
Argentina x x
Bangladesh xBulgaria x
Bolivia x
Brazil x x x
Chile x x
Colombia x x x
Costa Rica x x x
Dominican Republic x x
Ecuador x x x
Guatemala xHonduras x x
Hungary x x
Indonesia x x
India x x
Sri Lanka x
Mexico x x
Mongolia x
Nigeria x x
Nepal x xPakistan x x
Panama x
Peru x x x x
Philippines x x
Papua New Guinea x x
Poland x x
Paraguay x
El Salvador x x
Thailand x x x
Trinidad and Tobago x x
Turkey x x x
Tanzania x
Venezuela, RB x x x
Vietnam x
N = 34, 66 observations
International Migration and Human Development in Destination Countries 77
1 3

7/27/2019 10.1007_s11205-009-9467-0
http://slidepdf.com/reader/full/101007s11205-009-9467-0 20/25
T a b l e 3
Z e r o - o r d e r c o r r e l a t i o n s a n d b a s i c d e s c r i p t i v e
s t a t i s t i c s f o r v a r i a b l e s u s e d i n c r o
s s - n a t i o n a l a n a l y s i s o f h u m a n d e v e l o p m e n t i n d e x
( a )
( b )
( c )
( d )
( e )
( f )
( g )
( h )
( i )
( j )
( k )
( l )
( m )
( n )
( o )
( a ) H D I
1 . 0 0 0
( b ) M i g r a t i o n
0 . 0 4 5
1 . 0 0 0
( c ) G D P
0 . 7 2 9
0 . 3 6 4
1 . 0 0 0
( d ) F e m . e d u c .
0 . 8 0 4
- 0 . 0 2 0
0 . 5 5 7
1 . 0 0 0
( e ) D o c . p e r 1 0 0 0
0 . 6 5 1
0 . 1 6 5
0 . 6 2 2
0 . 7 3 1
1 . 0 0 0
( f ) F e m . L . F . P a r t .
- 0 . 0 3 6
- 0 . 1 7 1
- 0 . 1 3 4
0 . 1 9 1
0 . 1 4 8
1 . 0 0 0
( g ) D e m o c r a c y
0 . 3 7 6
0 . 3 4 4
0 . 3 6 5
0 . 3 4 5
0 . 3 7 0
0 . 0 4 1
1 . 0 0 0
( h ) I n f a n t m o r t .
- 0 . 8 6 9
- 0 . 1 2 4
- 0 . 6 0 9 -
0 . 7 5 8
- 0 . 5 9 1
- 0 . 1 4 7
- 0 . 4 5 1
1 . 0 0 0
( i ) U r b a n i z a t i o n
0 . 7 0 0
- 0 . 0 2 2
0 . 6 6 0
0 . 5 3 7
0 . 6 9 7
- 0 . 2 1 7
0 . 2 7 6
- 0 . 5 2 0
1 . 0 0 0
( j ) A g e c o m p .
0 . 0 8 3
- 0 . 1 7 5
- 0 . 0 5 6
0 . 0 2 4
- 0 . 2 3 1
0 . 0 4 2
0 . 0 2 9
- 0 . 1 9 1
- 0 . 0 2 2
1 . 0 0 0
( k ) E x p o r t s
0 . 3 3 1
0 . 1 8 0
0 . 1 9 9
0 . 3 2 8
0 . 1 6 6
0 . 1 3 4
0 . 3 2 9
- 0 . 5 3 9
- 0 . 0 6 3
0 . 2 3 5
1 . 0 0 0
( l ) F D I s t o c k
0 . 1 7 6
0 . 1 2 9
0 . 2 1 4
0 . 1 2 7
- 0 . 0 5 3
- 0 . 0 0 8
0 . 1 9 8
- 0 . 3 1 8
- 0 . 1 7 9
0 . 2 4 3
0 . 5 1 1
1 . 0 0 0
( m ) F D I P r i m a r y
0 . 1 1 6
- 0 . 1 4 2
0 . 0 6 7
0 . 1 0 5
0 . 0 3 8
0 . 0 0 0
0 . 1 0 9
- 0 . 2 7 9
- 0 . 0 1 8
0 . 1 0 1
0 . 3 8 4
0 . 7 0 6
1 . 0 0 0
( n ) F D I s e c o n d a r y
0 . 1 4 3
0 . 0 6 2
0 . 2 1 8 -
0 . 0 3 7
- 0 . 0 4 2
- 0 . 3 6 7
0 . 0 5 1
- 0 . 1 8 9
0 . 1 1 9
0 . 2 2 7
0 . 2 1 7
0 . 4 5 5
0 . 2 8 9
1 . 0 0 0
( o ) D o m e s t i c I n v .
0 . 1 8 0
- 0 . 0 9 5
- 0 . 1 3 5
0 . 2 2 6
- 0 . 0 1 1
0 . 3 0 3
0 . 0 8 0
- 0 . 3 0 5
- 0 . 0 2 5
0 . 3 3 1
0 . 2 0 2
0 . 0 1 9
0 . 0 2 8
-
0 . 0 8 8
1 . 0 0 0
M e a n
0 . 7 0
0 . 0 2
2 0 9 1 . 3 9
4 3 . 4 5
0 . 9 0
3 3 . 7 7
4 . 6 1
5 8 . 3 1
4 7 . 9 1
0 . 1 7
2 5 . 1 0
0 . 1 1
0 . 0 5
0 . 0 3
2 1 . 8 0
M e d i a n
0 . 7 4
0 . 0 1
1 6 8 7 . 6 9
4 0 . 7 5
0 . 7 1
3 3 . 2 0
7 . 0 0
4 6 . 0 0
5 1 . 4 0
0 . 1 7
2 4 . 5 4
0 . 0 7
0 . 0 1
0 . 0 3
2 1 . 5 7
S D
0 . 1 3
0 . 0 2
1 7 1 1 . 5 4
2 5 . 3 9
0 . 8 2
8 . 0 0
5 . 6 9
3 7 . 5 7
2 3 . 1 8
0 . 0 2
1 4 . 2 8
0 . 1 2
0 . 1 0
0 . 0 3
6 . 4 4
N
6 6
6 6
6 6
6 6
6 6
6 6
6 6
6 6
6 6
6 6
6 6
6 6
6 6
6 6
6 6
78 M. Sanderson
1 3

7/27/2019 10.1007_s11205-009-9467-0
http://slidepdf.com/reader/full/101007s11205-009-9467-0 21/25
Appendix 3
See Table 4.
References
Adams, R. H., Jr, & Page, J. (2005). Do international migration and remittances reduce poverty in devel-oping countries? World Development, 33, 1645–1669. doi:10.1016/j.worlddev.2005.05.004.
Alderson, A. S., & Nielsen, F. (1999). Income inequality, development, and dependence: A reconsideration. American Sociological Review, 64, 606–631. doi:10.2307/2657259.
Annan, K. (2006). Address of Mr. Kofi Annan, secretary-general, to the high-level dialogue of the UnitedNations general assembly on international migration and development. The International Migration
Review, 40, 963–965. doi:10.1111/j.1747-7379.2006.051_1.x.Barlow, R. (1994). Population growth and economic growth: Some more correlations. Population and
Development Review, 20, 153–165. doi:10.2307/2137634.Boehmer, U., & Williamson, J. B. (1996). The impact of women’s status on infant mortality rate: A cross-
national analysis. Social Indicators Research, 37 , 333–360. doi:10.1007/BF00286237.Bornschier, V., Chase-Dunn, C., & Rubinson, R. (1978). Cross-national evidence of the effects of foreign
investment and aid on economic growth and inequality: A survey of findings and a reanalysis. American Journal of Sociology, 84, 651–683. doi:10.1086/226831.
Bouvier, L. F., Poston, D. L., & Zhai, N. B. (1997). Population growth impacts of zero net internationalmigration. The International Migration Review, 31, 294–311. doi:10.2307/2547221.
Brady, D., Kaya, Y., & Beckfield, J. (2007). Reassessing the effect of economic growth on well-being inless-developed countries, 1980–2003. Studies in Comparative International Development, 42, 1–35.doi:10.1007/s12116-007-9003-7.
Brewer, T. H., Hasbun, J., & Ryan, C. A. (1998). Migration, ethnicity, and environment: HIV risk factorsfor women on the sugar cane plantations of the Dominican Republic. AIDS (London, England), 12,1879–1887. doi:10.1097/00002030-199814000-00020.
Brockerhoff, M. (1995). Child survival in big cities: The disadvantages of migrants. Social Science &
Medicine, 40, 1371–1383. doi:10.1016/0277-9536(94)00268-X.Brockerhoff, M., & Brennan, E. (1998). The poverty of cities in developing regions. Population and
Development Review, 24, 75–114. doi:10.2307/2808123.Caldwell, J. C. (1982). Theory of fertility decline. London: Academic Press.Caldwell, J. C. (1993). Health transition: The cultural, social, and behavioural determinants of health in the
Third World. Social Science & Medicine, 36 , 125–135. doi:10.1016/0277-9536(93)90204-H.Castles, S., & Miller, M. J. (2003). The age of migration (3rd ed.). New York: The Guilford Press.
Chase-Dunn, C. (1975). The effects of international economic dependence on development and inequality:A cross-national study. American Sociological Review, 40, 720–738. doi:10.2307/2094176.Chen, N., Valente, P., & Zlotnik, H. (1998). What do we know about recent trends in urbanization? In R. E.
Bilsborrow (Ed.), Migration, urbanization, and development: New directions and issues (pp. 59–88).New York: United Nations Population Fund.
Cleland, J., & Hobcraft, J. N. (1985). Reproductive change in developing countries: Insights from the World
Fertility Survey. New York, NY: Oxford University Press.
Table 4 Basic descriptive statistics for the sample and the total population of countries
HDI International migration
Sample Total population Sample Total population
Mean 0.70 0.67 0.02 0.07
Median 0.74 0.71 0.01 0.03
SD 0.13 0.19 0.02 0.12
N 66 932 66 1,426
International Migration and Human Development in Destination Countries 79
1 3

7/27/2019 10.1007_s11205-009-9467-0
http://slidepdf.com/reader/full/101007s11205-009-9467-0 22/25
Cohen, J. (2005). Remittance outcomes and migration: Theoretical contests, real opportunities. Studies in
Comparative International Development, 40, 88–112. doi:10.1007/BF02686290.Crenshaw, E. M., Ameen, A. Z., & Christenson, M. (1997). Population dynamics and economic develop-
ment: Age-specific population growth rates and economic growth in developing countries, 1965–1990. American Sociological Review, 62, 974–984. doi:10.2307/2657351.
Cutright, P., & Adams, R. (1984). Economic dependency and fertility in Asia and Latin America, 1960–1980.Comparative Social Research, 7 , 111–132.
Davies, A., & Quinlivian, G. (2006). A panel data analysis of the impact of trade on human development. Journal of Socio-Economics, 35, 868–876. doi:10.1016/j.socec.2005.11.048.
Davison, A. C., & Hinkley, D. V. (1997). Bootstrap methods and their application. Cambridge: CambridgeUniversity Press.
de Haas, H. (2005). International migration, remittances, and development: Myths and facts. Third World
Quarterly, 26 , 1269–1284.Decosas, J., & Adrien, A. (1997). Migration and HIV. AIDS (London, England), 11, S77–S84.Dixon, W. J., & Boswell, T. (1996). Dependency, disarticulation, and denominator effects: Another look at
foreign capital penetration. American Journal of Sociology, 102, 543–562. doi:10.1086/230956.Durand, J., Parrado, E. A., & Massey, D. S. (1996). Migradollars and development: A reconsideration of the
Mexican case. The International Migration Review, 30, 423–444. doi:10.2307/2547388.Easterlin, R. A. (2000). The globalization of human development. The Annals of the American Academy of
Political and Social Science, 570, 32–48. doi:10.1177/0002716200570001003.Efron, B. (1979). Bootstrap methods: Another look at the jackknife. Annals of Statistics, 7 , 1–26. doi:
10.1214/aos/1176344552.Evans, P., & Timberlake, M. (1980). Dependence, inequality, and the growth of the tertiary: A comparative
analysis of less developed countries. American Sociological Review, 45, 531–552. doi:10.2307/2095006.
Finkel, S. E. (1995). Causal analysis with panel data. Thousand Oaks: Sage.Firebaugh, G. (1992). Growth effects of foreign and domestic investment. American Journal of Sociology,
98, 105–130. doi:10.1086/229970.Frey, R. S., & Al-Roumi, A. (1999). Political democracy and the physical quality of life: The cross-national
evidence. Social Indicators Research, 47 , 73–97. doi:10.1023/A:1006967124534.Frey, R. S., & Field, C. (2000). The determinants of infant mortality in the less developed countries: A cross-
national test of five theories. Social Indicators Research, 52, 213–234.Gammeltoft, P. (2002). Remittances and other financial flows to developing countries. International
Migration (Geneva, Switzerland), 40, 181–212. doi:10.1111/1468-2435.00216.Goldstein, S. (1976). Facets of redistribution: Research challenges and opportunities. Demography, 13, 423–434.
doi:10.2307/2060500.Gould, W. (1994). Jackknife estimation. Stata Technical Bulletin, 24, 25–29.Hagerty, M. R., Cummins, R. A., Ferriss, A. L., Land, K., Michalos, A. C., Peterson, M., et al. (2001).
Quality of life indexes for national policy: Review and agenda for research. Social Indicators
Research, 55, 1–96. doi:10.1023/A:1010811312332.Hagerty, M. R., & Land, K. C. (2007). Constructing summary indices of quality of life: A model for the
effect of heterogeneous importance weights. Sociological Methods & Research, 35, 455–496. doi:10.1177/0049124106292354.
Halaby, C. N. (2004). Panel models in sociological research: Theory into practice. Annual Review of
Sociology, 30, 507–544. doi:10.1146/annurev.soc.30.012703.110629.Harpham, T., & Molyneux, C. (2001). Urban health in developing countries: A review. Progress in
Development Studies, 1, 113–137.Harrison, P. (1982). Inside the Third World . Harmondsworth, UK: Penguin.Hatton, T. J., & Williamson, J. G. (2006). Global migration and the world economy: Two centuries of policy
and performance. Cambridge, MA: MIT Press.Hirschman, C. (1994). Why fertility changes? Annual Review of Sociology, 20, 203–233. doi:10.1146/
annurev.so.20.080194.001223.Hobcraft, J. N., McDonald, J. W., & Rutstein, S. O. (1984). Socio-economic factors in infant and child
mortality: A cross-national comparison. Population Studies, 38, 193–223. doi:10.2307/2174073.Hunt, C. W. (1989). Migrant labor and sexually-transmitted disease: AIDS in Africa. Journal of Health and
Social Behavior, 30, 353–373. doi:10.2307/2136985.ILO. (2002). Meeting report 3: Technical workshop on population mobility, migration, and HIV/AIDS .
Geneva: International Labor Organization.Kelley, A. C., & Schmidt, R. M. (1995). Aggregate population and economic growth correlations: The role
of the components of demographic change. Demography, 32, 543–555. doi:10.2307/2061674.
80 M. Sanderson
1 3

7/27/2019 10.1007_s11205-009-9467-0
http://slidepdf.com/reader/full/101007s11205-009-9467-0 23/25
Kent, M. M., & Haub, C. (2005). Global demographic divide. Population Bulletin, 60, 1–24.Kentor, J. (1981). Structural determinants of peripheral urbanization: The effects of international depen-
dence. American Sociological Review, 46 , 201–211. doi:10.2307/2094979.Kentor, J. (1998). The long term effects of foreign investment dependence on economic growth, 1940–1990.
American Journal of Sociology, 103, 1024–1048. doi:10.1086/231295.
Kentor, J. (2001). The long term effects of globalization on income inequality, population growth, andeconomic development. Social Problems, 48, 435–455. doi:10.1525/sp.2001.48.4.435.
Kentor, J., & Boswell, T. (2003). Foreign capital dependence and development: A new direction. American
Sociological Review, 68, 301–313. doi:10.2307/1519770.Kirk, D. (1996). Demographic transition theory. Population Studies, 50, 361–387. doi:10.1080/0032
472031000149536.Lamptey, P. R., Johnson, J. L., & Khan, M. (2006). The global challenge of HIV and AIDS. Population
Bulletin, 61, 1–24.Lee, R. (2003). The demographic transition: Three centuries of fundamental change. The Journal of
Economic Perspectives, 17 , 167–190. doi:10.1257/089533003772034943.Lena, H. F., & London, B. (1993). The political and economic determinants of health outcomes: A cross-
national analysis. International Journal of Health Services, 23, 585–602.
London, B. (1987). Structural determinants of Third World urban change: An ecological and political-economic analysis. American Sociological Review, 52, 28–43. doi:10.2307/2095390.
London, B. (1988). Dependence, distorted development, and fertility trends in noncore nations: A structuralanalysis of cross-national data. American Sociological Review, 53, 606–618. doi:10.2307/2095852.
London, B., & Smith, D. A. (1988). Urban bias, dependence, and economic stagnation in noncore nations. American Sociological Review, 53, 454–463. doi:10.2307/2095652.
London, B., & Williams, B. A. (1988). Multinational corporate penetration, protest, and basic needsprovision in non-core nations: A cross-national analysis. Social Forces, 66 , 747–773. doi:10.2307/ 2579574.
London, B., & Williams, B. A. (1990). National politics, international dependency, and basic needsprovision: A cross-national analysis. Social Forces, 69, 565–584. doi:10.2307/2579674.
Lurie, M. (2006). The epidemiology of migration and HIV/AIDS in South Africa. Journal of Ethnic and
Migration Studies, 32, 649–666. doi:10.1080/13691830600610056.Lurie, M., Williams, B., Zuma, K., Mkaya-Mwamburi, D., Garnett, G. P., & Sturm, A. W. (2003). The
impact of migration on HIV-1 transmission: A study of migrant and non-migrant men and theirpartners. Sexually Transmitted Diseases, 10, 149–156. doi:10.1097/00007435-200302000-00011.
Mabey, D., & Mayaud, P. (1997). Sexually transmitted diseases in mobile populations. Genitourinary
Medicine, 73, 18–22.Marshall, M.G., Jaggers, K., & Gurr, T.R. (2006). Polity IV project: Political regime characteristics and
transitions, 1800–2004. Center for International Development and Conflict Management, University of Maryland.
Martin, P., & Straubhaar, T. (2002). Best practices to reduce migration pressures. International Migration
(Geneva, Switzerland), 40, 5–23. doi:10.1111/1468-2435.00194.Martin, P., & Widgren, J. (2002). International migration: Facing the challenge. Population Bulletin, 57 ,
1–40. doi:10.1016/S0025-326X(01)00292-2.Massey, D. S., Durand, J., & Malone, N. (2002). Beyond smoke and mirrors: Mexican immigration in an era
of economic integration. New York, NY: Russell Sage Foundation.Massey, D. S., & Parrado, E. A. (1998). International migration and business formation in Mexico. Social
Science Quarterly, 79, 1–20.McKenzie, D. J. (2008). A profile of the world’s young developing country international migrants. Popu-
lation and Development Review, 34, 115–135. doi:10.1111/j.1728-4457.2008.00208.x.McNicoll, G. (1984). Consequences of rapid population growth: An overview and assessment. Population
and Development Review, 10, 177–240. doi:10.2307/1973081.Meyers, E. (2000). Theories of international migration policy: A comparative analysis. The International
Migration Review, 34, 1245–1282. doi:10.2307/2675981.Mooney, C. Z., & Duval, R. D. (1993). Bootstrapping: A nonparametric approach to statistical inference.
Newbury Park, CA: Sage.Nolan, P. D. (1988). World system status, techno-economic heritage, and fertility. Sociological Focus, 21,
9–33.Nolan, P. D., & White, R. B. (1983). Demographic differentials in the world system: A research note. Social
Forces, 62, 1–8. doi:10.2307/2578344.Nolan, P. D., & White, R. B. (1984). Structural explanations of fertility change: The demographic transition,
economic status of women, and the world system. Comparative Social Research, 7 , 81–109.
International Migration and Human Development in Destination Countries 81
1 3
7/27/2019 10.1007_s11205-009-9467-0
http://slidepdf.com/reader/full/101007s11205-009-9467-0 24/25
Nyberg-Sorenson, N., van Hear, N., & Engberg-Pedersen, P. (2002). The migration-development nexus:Evidence and policy options state of the art overview. International Migration (Geneva, Switzerland),
40, 3–43. doi:10.1111/1468-2435.00210.OECD. (2001). International direct investment statistics yearbook, 1980–2000. Paris: OECD Publications.Portes, A. (2001). Introduction: The debates and significance of immigrant transnationalism. Global Net-
works, 1, 181–194. doi:10.1111/1471-0374.00012.Preston, S. H. (1986). Population growth and economic development. Environment, 28, 6–12.Quinn, T. C. (1994). Population migration and the spread of types 1 and 2 human immunodeficiency viruses.
Proceedings of the National Academy of Sciences of the United States of America, 91, 2407–2414. doi:10.1073/pnas.91.7.2407.
Ragin, C., & Bradshaw, Y. (1992). International economic dependence and human misery, 1938–1980.Sociological Perspectives, 35, 217–247.
Ranis, G., Stewart, F., & Ramirez, A. (2000). Economic growth and human development. World Devel-
opment, 28, 197–219. doi:10.1016/S0305-750X(99)00131-X.Ratha, D., & Shaw, W. (2007). South-South migration and remittances. New York, NY: World Bank.Roberts, B. (1995). The making of citizens: Cities of peasants revisited . New York, NY: Wiley.Satterthwaite, D. (1993). The impact on health of urban environments. Environment and Urbanization, 5,
87–111. doi:10.1177/095624789300500208.Schiller, G., Nina, L. B., & Black, C. S. (1995). From immigrant to transmigrant: Theorizing transnational
migration. Anthropological Quarterly, 68, 48–63. doi:10.2307/3317464.Sen, A. (1999). Development as freedom. New York, NY: Anchor Books.Shandra, J. M., Nobles, J., London, B., & Williamson, J. B. (2004). Dependency, democracy, and infant
mortality: A quantitative, cross-national analysis of less developed countries. Social Science &
Medicine, 59, 321–333. doi:10.1016/j.socscimed.2003.10.022.Shandra, J. M., Nobles, J., London, B., & Williamson, J. B. (2005). Multinational corporations, democracy,
and child mortality: A quantitative, cross-national analysis of developing countries. Social Indicators
Research, 73, 267–293. doi:10.1007/s11205-004-2009-x.Shen, C., & Williamson, J. B. (1997). Child mortality, women’s status, economic dependency and state
strength: A cross-national study of less developed countries. Social Forces, 76 , 667–694. doi:
10.2307/2580728.Shen, C., & Williamson, J. B. (1999). Maternal mortality, women’s status, and economic dependency in less
developed countries: A cross national analysis. Social Science & Medicine, 49, 197–214. doi:10.1016/S0277-9536(99)00112-4.
Shen, C., & Williamson, J. B. (2001). Accounting for cross-national differences in infant mortality decline(1965–1991) among less developed countries: Effects of women’s status, economic dependency, andstate strength. Social Indicators Research, 53, 257–288. doi:10.1023/A:1007190612314.
Shin, D. C. (1989). Political democracy and the quality of citizens’ lives: A cross-national study. Journal of
Developing Societies, 5, 30–41.Skeldon, R. (1997). Of migration, great cities, and markets: Global systems of development. In W. Gungwu
(Ed.), Global history and migrations (pp. 183–215). Boulder, CO: Westview Press.Smith, D. A. (1987). Overurbanization reconceptualized: A political economy of the world-system
approach. Urban Affairs Quarterly, 23, 270–294.Smith, D. A. (1996). Third World cities in global perspective: The political economy of uneven urbanization.
Boulder: Westview Press.Stark, O. J. (2004). Rethinking the brain drain. World Development, 32, 15–22. doi:10.1016/j.world
dev.2003.06.013.Stephens, C. (1996). Healthy cities or unhealthy islands? The health and social implications of urban
inequality. Environment and Urbanization, 8, 9–30. doi:10.1177/095624789600800211.Stimson, J. A. (1985). Regression in time and space: A statistical essay. American Journal of Political
Science, 29, 914–947. doi:10.2307/2111187.Subbarao, K., & Raney, L. (1995). Social gains from female education: A cross-national study. Economic
Development and Cultural Change, 44, 105–128. doi:10.1086/452202.Taylor, J. E. (1999). The new economics of labour migration and the role of remittances in the migration
process. International Migration (Geneva, Switzerland), 37 , 63–88. doi:10.1111/1468-2435.00066.Taylor, J. E., Arango, J., Hugo, G., Kouaouchi, A., Massey, D. S., & Pellegrino, A. (1996a). International
migration and community development. Population Index, 62, 397–413. doi:10.2307/3645924.Taylor, J. E., Arango, J., Hugo, G., Kouaouchi, A., Massey, D. S., & Pellegrino, A. (1996b). International
migration and national development. Population Index, 62, 181–212. doi:10.2307/3646297.Timberlake, M. (1985). Urbanization in the world-economy. Orlando: Academic Press.
82 M. Sanderson
1 3

7/27/2019 10.1007_s11205-009-9467-0
http://slidepdf.com/reader/full/101007s11205-009-9467-0 25/25
Timberlake, M., & Kentor, J. (1983). Economic dependence, overurbanization, and economic growth: Astudy of less-developed countries. The Sociological Quarterly, 24, 489–507. doi:10.1111/j.1533-8525.1983.tb00715.x.
Tsai, M.-C. (2006). Does political democracy enhance human development in developing countries? Across-national analysis. American Journal of Economics and Sociology, 65, 233–268. doi:10.1111/
j.1536-7150.2006.00450.x.Tsai, M.-C. (2007). Does globalization affect human well-being? Social Indicators Research, 81, 103–126.
doi:10.1007/s11205-006-0017-8.UN. (1992). World investment directory. New York, NY: United Nations.UN. (1994). World investment directory. New York, NY: United Nations.UN. (1996). World investment directory. New York, NY: United Nations.UN. (2000). World investment directory. New York, NY: United Nations.UN. (2003). World investment directory. New York, NY: United Nations.UN. (2005). Population, resources, and environment database, version 4.. New York, NY: United Nations
Department of Economic and Social Affairs, Population Division.UN. (2006). International migration and development: Report of the secretary-general. New York, NY:
United Nations.
UN. (2007). World population prospects, 2006 revision. New York, NY: United Nations.UNDP. (1990). Human development report . New York, NY: United Nations Development Programme.UNDP. (2005). Human development report, 2005: Aid, trade, and security in an unequal world . New York:
United Nations Development Programme.UNDP. (2007). Human development report. Fighiting climate change: Human solidarity in a divided world .
New York, NY: United Nations Development Program.UNFPA. (2007). State of the world population 2007: Unleashing the potential of urban growth. New York,
NY: United Nations Population Fund.WB. (2006a). Global economic prospects: Economic implications of remittances and migration. New York,
NY: World Bank.WB. (2006b). World development indicators, 2006 . New York, NY: World Bank.Weeks, J. R. (2005). Population: An introduction to concepts and issues (9th ed.). Belmont, CA: Thomson
Wadsworth.White, M. J., & Lindstron, D. P. (2006). Internal migration. In D. L. Poston & M. Micklin (Eds.), Handbook
of population (pp. 311–346). New York, NY: Springer Press.Wickrama, K. A. S., & Lorenz, F. O. (2002). Women’s status, fertility decline, and women’s health in
developing countries: Direct and indirect influences of social status on health. Rural Sociology, 67 ,255–277.
Wimberley, D. W. (1990). Investment dependence and alternative explanations of third world mortality: Across-national study. American Sociological Review, 55, 75–91. doi:10.2307/2095704.
Wimberley, D. W. (1991). Transnational corporate investment and food consumption in the Third World: Across-national analysis. Rural Sociology, 56 , 406–431.
Wimberley, D. W., & Bello, R. (1992). Effects of foreign investment, exports, and economic growth onThird World food consumption. Social Forces, 70, 895–921. doi:10.2307/2580194.
Wooldridge, J. M. (2006). Introductory econometrics: A modern approach (3rd ed.). Mason, OH: ThomsonSouthwestern.
Zarate, A., & de Zarate, A. U. (1975). On the reconciliation of research findings of migrant-nonmigrantfertility differentials in urban areas. The International Migration Review, 9, 115–156. doi:10.2307/ 3002746.
Zlotnik, H. (1998). International migration 1965–96: An overview. Population and Development Review,
24, 429–468. doi:10.2307/2808151.
International Migration and Human Development in Destination Countries 83