100g intrusion detection - cspi intrusion detection ... table of contents background approach...
TRANSCRIPT

100G Intrusion Detection August 2015 v1.0 Vincent Stoffer Aashish Sharma Jay Krous
1 of 32

Table of Contents
Background Approach Solution Overview Alternative Solutions Distribution Device
Requirements Selection
Bro Cluster Build Guide
Overview Arista Myricom Bro Hardware
Performance Traffic Distribution to the Cluster Bro Cluster CPU Utilization and Performance Performance Measure of Capture Loss
Shunting Components of Shunting
Acknowledgements References Appendices
Appendix A: Arista Config Arista 7504 configuration Arista 7150 configuration
Appendix B: Cluster Configuration (FreeBSD) Appendix C: Procurement Details
Arista Procurement Bro hardware Procurement Myricom Drivers Procurement
Appendix D: Photo of Production Solution
2 of 32

Background
Berkeley Lab is a DOE National Laboratory operated by the University of California that conducts largescale unclassified research across a wide range of scientific disciplines. Berkeley Lab was a pioneer in the formation and use of the modern Internet and continues to make incredible demands on high performance computing and high speed networks to fulfill its scientific mission. Primarily driven by the data output of modern scientific instruments and the data transfer needs of scientists, network traffic on the Energy Sciences Network (ESNet) has roughly doubled every 18 months for the past 10 years (see Figure 1). ESNet is hosted at and is the primary network provider for Berkeley Lab. ESnet completed an upgrade to its backbone network to 100Gbps in 2012, and now nine of the DOE national laboratories, major universities, and other network providers also peer with ESNet at 100Gbps.
Figure 1: ESnet traffic growth While 100Gbps links have become more prevalent, security operations’ ability to maintain network monitoring at this traffic volume has not kept pace. As of this writing, no commercially available 100G monitoring solutions provide functional parity with Berkeley Lab’s network monitoring approach. Comprehensive monitoring is a significant challenge and can become a barrier to implementation of 100G networks, or worse, security monitoring requirements can be weakened to expedite an implementation. The Berkeley Lab scientific mission and fundamental approach to cybersecurity required that we overcome these challenges, and in June 2014 we began a project to design and implement a system capable of monitoring a 100G network.
3 of 32

Approach
Our approach was to build a system based upon the 100G prototyping work performed by Campbell and Lee in “Intrusion Detection at 100G”1 and “Prototyping a 100G Monitoring System.”2 The basic methodology of our solution is to break down the 100G network connection into smaller pieces of traffic, while preserving the affinity of individual network sessions to a single analysis process. We then distribute that analysis across many dozens or hundreds of worker processes, allowing the system to scale up to speeds of 100G. We also implement a unique traffic reduction mechanism called “shunting” to further shed load from the analysis pipeline. Several components comprise the network monitoring system:
Traffic distribution—a device capable of aggregating, filtering, and distributing the 100G traffic to multiple systems.
Host distribution—a mechanism to further divide the traffic at the host level into smaller pieces. Network intrusion detection system (IDS)—to perform distributed analysis on the traffic received at
the host. Operating system (OS)—the physical hardware and operating system used to run the IDS nodes.
The traffic distribution device performs several critical functions. It aggregates traffic from multiple taps (including 100G), performs filtering, and distributes the traffic in an even way to analysis hosts at 10G speeds. In the past, the functions of aggregation, distribution, and filtering have sometimes necessitated separate hardware devices or software. The current generation of traffic distribution devices collects these functions into a single piece of hardware. We defined requirements that such a device needs to meet for our operation and talked to many of the major device vendors to evaluate available options. We were particularly interested in commodity hardware products for reduced costs and for solutions that would support nextgeneration, openstandards traffic distribution, such as OpenFlow. Further details about our evaluation process are covered in the “Distribution Device” section. The traffic from the distribution device arrives at the host’s network card at 10G, which is too much for a single IDS process to handle. The host’s network card further divides the 10G stream into smaller pieces, which can be handled by a single IDS process. This replicates the previous distribution step but at the host level. We evaluated several options for host distribution, our primary requirement being that it would support our preferred OS of FreeBSD. By passing through both the traffic and host distribution, the traffic finally reaches a volume that can be effectively analyzed by a single IDS worker process. A distributed network IDS is now needed to perform analysis across many dozens or hundreds of workers, all acting on a small fraction of the overall traffic volume. Although many network IDS products are available, there are only a few options to chose from when evaluating cluster capable systems that can handle 100G traffic volumes. As we note in the “Alternative Solutions” section of this paper, there are several viable options for each of these components. The particular combination of components we selected was informed by our local expertise and the experience of our team, institution, and colleagues.
4 of 32

Solution Overview
We chose the following technological components to create our 100G monitoring system: Traffic distribution—Arista switches (7150 and 7504) Host distribution—Myricom network interface cards (NIC) and Sniffer 10G software Network IDS—Bro Network Security Monitor OS—FreeBSD
Our monitoring system runs completely out of band, meaning it takes traffic from optical taps and operates only on the duplicated traffic; it does not sit inline (see Figure 2). Alerts and actions generated by the IDS can affect network traffic (by placing blocks, for example) but these processes happen in parallel to normal network operation. This separation allows the monitoring system to scale to greater network speeds and also removes the monitoring system from a critical dependency for normal network operation.
Figure 2: Simplified flow diagram of the network and monitoring system
5 of 32

Figure 3 is a diagram of the 100G monitoring solution. The Arista 7504 is at the top of the diagram. This device performs two functions: It aggregates the inputs of the optical taps from Berkeley Lab’s Internet connections and creates a 10G Link Aggregation Group (LAG) of that aggregated traffic to pass to the 7150 device.
Figure 3: Block diagram of 100G cluster setup showing 100G feed going to the Arista (7504), which uses an Arista 7150 for symmetric hashing/loadbalancing. Traffic is then fed to the Bro cluster using Myricom cards. Below the 7504 is the Arista 7150. This device performs the critical function of ensuring each TCP session is distributed on a single link. This function is provided by the Arista DANZ technology through symmetric hashing. As of this writing, symmetric hashing is not currently available in the Arista 7504; once the code that supports symmetric hashing is available on the 7504, the 7150 can be eliminated if desired. The bottom of the diagram shows the Bro cluster. Each Bro node is built on commodity hardware described in more detail in the “Build Guide” section of this paper. A Myricom 10G NIC is installed on each Bro node. The NIC (and associated software) further divides the traffic to multiple Bro processes running on the node. A single Bro node is designated the Bro manager, which aggregates events from the other Bro nodes, creates logs, and controls shunting.
6 of 32

On the right side of the diagram the shunting process is represented by the dashed red line. In realtime, Bro detects specific large data flows based on predetermined characteristics and communicates with the Arista 7150 via an API to stop sending those flows to Bro for analysis. The shunt rules apply an ACL to the Arista which allows control packets to continue but ignores the remaining “heavy tail” of the data volume. This allows Bro to maintain awareness and logs of these shunted large flows but dramatically reduce the analysis load necessary to process traffic. Shunting is discussed in further detail in the “Shunting” section.
Alternative Solutions
The following table summarizes the technology stack implemented at Berkeley Lab. Table 1: Berkeley Lab technology stack
Traffic distribution Host distribution IDS OS
Arista (7504+7150) Myricom 10GPCIE28C22+ and Myricom 10G sniffer drivers
Bro FreeBSD
Our specific choices for these components were informed by evaluation, local expertise, and experience but are not the only choices. Table 2 provides alternative tools and technologies for the various building blocks of a 100G monitoring solution. Table 2: Alternative technology stacks
Distribution device Traffic split/node IDS OS
Arista Brocade Endace Gigamon OpenFlow / SDN
PF_RING Packet Bricks + netmap
Endace DAG
Snort Suricata
Linux
7 of 32

Distribution Device
Requirements
Berkeley Lab has been operating 10G network monitoring infrastructure since 2007. We have used a variety of distribution devices, including Apcon and most recently cPacket cVu devices. The cPackets served as a reference as we developed our requirements for a 100G distribution device. We needed to maintain the ability to aggregate, distribute, and filter like the cPacket, but also needed to support multiple 100G and 10G links. Our requirements were to support the following:
Input ports Two 100G input ports to monitor both transmit and receive on a 100G link
This would handle our primary internet connection to ESnet Needed to support 100GLR4 optics using optical taps Scaling beyond two 100G ports was not a requirement but considered a desirable
future capability Eight 10G interfaces to allow backup links to be aggregated
Transmit and receive for all backup links (secondary connection to ES.net, UC Berkeley, CENIC, offsite links, Science DMZ, etc.)
Output ports Fourteen 10G interfaces (minimum) to feed a clustercapable IDS and other standalone
monitoring systems Five to ten 10G links for the proofofconcept cluster system Enough ports to handle scaling up towards 100G 1G and 10G ports to standalone monitoring systems desirable
Aggregation and load balancing
Ability to aggregate input ports and load balance across the output ports Fivetuple symmetric loadbalancing (srcip,dstip,srcport,dstport,protocol) Every port can be assigned to input or output Separate input and output port groups Port speed agnostic (1/10/100G)
Filtering
TCP flag and IP header filtering to enable granular control and filtering of traffic stream Filtering to exclude data and allow only control packets (see shunting section) Arbitrary IP headers and TCP flags for testing and development IPv6 filtering
Filters on input or output ports to enable flexibility and prevent oversubscription Filter on input or output ports or groups API or CLI interface to automate filtering
8 of 32

Selection
Over the course of a year, we researched available packet distribution devices and evaluated three devices onsite (see Table 3). Table 3: Device evaluations
Device Met requirements Pros Cons
Arista (7150, 7504)
Yes API, GUI, SDN capability
Two devices initially needed for 100G, no IPv6 filtering at testing time
Brocade MLXe Yes Lowest cost, SDN capability
No GUI, no API
EndaceAccess No (no 10G input ports) Form factor, first to market
Two devices needed for bidirectional, no filtering, cost
We constructed a testbed of a 100G link and duplicated traffic over 10G for input. We used both raw captures to multiple interfaces (tcpdump) and Bro to test for consistency of packet delivery and effectiveness of hashing. We compared ease of use of the devices, including CLI, GUI, and API features. We tested creation of ports and port groups and directing traffic to and from them. We also compared the filtering features including using our own set of TCP flags. Part of our testing was to ensure that symmetric hashing of all flows was happening correctly across the distribution device. When a single flow is aggregated and/or loadbalanced across a number of ports, it is critical for IDS analysis that the flow passes exclusively and reliably to a single output for further distribution and analysis. Symmetric hashing allows a number of variables to be defined to characterize the flows with usually some combination of source IP, source port, destination IP, destination port, and protocol. Most of the devices we tested allow for those characteristics to be adjusted and then applied such that each bidirectional matched flow will egress out the same link in its entirety. This is a critically important feature that enables even distribution of traffic and allows for the horizontal scaling we describe in our monitoring system. After evaluation we chose Arista for the distribution devices, utilizing both a 7504 chassis and smaller 7150 switch. Brocade came in a close second and was most competitive on price alone. Arista was the only vendor who exceeded all of our requirements. Perhaps the most compelling feature was Arista’s JSON API, which allows us to have external programs dynamically modify the device’s packet filter settings (in our case for Bro’s shunting capability). The density of the Arista was also compelling; in our current configuration we are able to tap three fullduplex 100G links while still having more than 144 10G connections available for input and output ports.
9 of 32

Bro Cluster
The Bro Network Security Monitor was created at Berkeley Lab in the 1990s by Vern Paxson. It is a powerful, flexible, and opensource platform for networking monitoring and intrusion detection. Berkeley Lab’s long history and deep experience with Bro made it a clear choice when settling on the intrusion detection component of the monitoring system. Further, the team’s experience with Bro clustering technology at 10G speeds led us to believe that Bro could scale towards 100G. Bro’s ability to scale horizontally and maintain visibility at high speeds makes it uniquely suited for intrusion detection on high speed networks. Simply put, we believe Bro to be the only IDS able to handle both the speed and analytic complexity necessary for comprehensive networking monitoring at 100G. The traditional approach at Berkeley Lab was a packet broker device that handled tap aggregation, filtering, and distribution. This aggregated output was fed via a single 10G link to a device capable of further distributing the traffic to 1G worker machines that comprised a Bro cluster. A more modern approach for Bro clustering is a single multicore server, directly feeding a 10G NIC and handling the distribution of traffic with specialized network drivers and individual CPU cores as workers. After experimenting with this approach, we felt it could easily scale up to handle >10G traffic using a combination of these two approaches (many multicore servers each operating on 10G worth of traffic). Dividing 100G traffic into smaller pieces presents challenges for attack detection and monitoring. For example, packets from a sitewide network scan might be separated across multiple IDS servers, which may not see enough traffic individually to trigger detection thresholds. The IDS must provide a way to correlate the traffic across multiple nodes to identify attacks that span more than one traffic stream. In a cluster configuration, Bro has the capability to exchange lowlevel analysis state realtime, giving it a global picture of network activity to provide accurate intrusion detection. Correctly scaling a Bro cluster is highly dependent on the site’s traffic patterns, hardware capabilities of the IDS, and the running policies. Local experimentation is needed to determine not only the correct number of workers, but also the correct balance of workers to proxies. We suggest starting with roughly 1Gbps of traffic per worker and scaling up or down based on traffic loss or cluster instability. We also suggest a starting point is one proxy for every 10 workers; this ratio should be adjusted based on performance and packet loss until stability is maintained. For our 100G Bro cluster setup, we run one manager, five proxies, and 50 worker nodes. This architecture first splits the 100Gb link traffic into five streams, each sent over a 10Gb link on one Bro host in the Bro cluster. The Bro host splits the 10Gb stream into 10 1Gb streams via a Myricom network card. Each of the 10 Bro processes running a Bro host analyzes one of the 1GB streams. Our choice of architecture splits the traffic in such a manner that each of the worker nodes sees about 1/50th of the total traffic volume. Current peak network traffic is roughly 20Gps, so each Bro process analyzes about 400Mbps of the traffic. The following section of this paper, 'Build Guide,' provides the details of our solution.
10 of 32

Build Guide
Overview
Three hardware components are needed for our build. The first is the set of Arista devices, the second is the Myricom NIC and driver installed on each of the Bro hosts, and the third is the cluster of commodity hardware that runs Bro. In Appendix C we provide the line items for the hardware used for our build. We are not providing line item pricing details, but our overall build cost was under US$400,000, which included maintenance and support for one year for most of the hardware components. The following three sections describe each of the components of the build in more detail.
Arista
Certain Arista models support a feature called DANZ (Data Analyzer) which can place the device into taponly mode. This disables all switching and routing functions and allows for configurations unique to tap aggregation, filtering, and distribution. With this feature set, we are able to create port groups specific to input and output, apply filters to them, and distribute the traffic groups as needed for monitoring. The Arista hardware configuration necessary to handle 100G includes two devices: one 7504 chassis, which holds the 100G line card, and one 7150 to which it is connected. At the time of purchase, the 7500 series did not have software support for symmetric hashing, so this critical feature runs on the 7150 device. Support for symmetric hashing is coming to the 7500 series in a future code release, which will eliminate the need for the 7150. All of our external links are fed into the 7504 chassis, including both 100G and 10G connections. Since we are using optical taps, two ports must be reserved for each tapped link to account for the receive and transmit sides of the fiber optic connection. Input port groups are created to aggregate the links together. A series of connections must be made between the 7504 device and the 7150. We accomplished this using 10G twinax copper cables, which have a lower cost than optical fiber connections. We initially made five 10G twinax connections between the 7504 and the 7150. A LAG combines all of these physical connection ports into a trunked connection between the two devices. A tap aggregation group is then created, which connects the input port group to the output port group, essentially passing through all of the collected traffic through the 7504 to the 7150 device. Once at the 7150, traffic moves through a similar group configuration. An input group is created for the connection ports between the two devices, and an output port group is created for the 10G ports to the Bro cluster hosts. Though the input ports are being collected together and hashed on the 7504, recall that symmetric hashing is not possible on the 7504 at the time of this writing, so the traffic is symmetrically hashed as it ingresses the 7150. This ensures even balancing of all incoming network flows, allowing each flow to be directed in its entirety to a distinct Bro worker machine. The 7150 is also where we apply static filters and dynamic shunting filters to limit the amount of traffic being sent to the Bro cluster. One of the primary reasons that we chose the Arista was the ability to do dynamic shunting. Through use of Arista’s JSON API, we are able to push simple accesslist changes to the device from our Bro cluster. This is described in further detail in the “Shunting” section of this paper. After the initial setup, there is little configuration necessary for either of the Arista devices. Only when a new port or tap is added on the input or a new cluster node or monitoring device is added on the output is it necessary to change configuration. See Appendix A for linebyline configuration of each Arista device.
Myricom
11 of 32
A necessary component of the clusterinabox approach is an NIC and drivers that allow the system to distribute the traffic to different IDS analysis threads for distributed processing. The majority of the production monitoring systems at Berkeley Lab run FreeBSD, which somewhat limited our options for the NICs and software drivers. The most commonly used approach on Linux for highvolume packet capture is PF_RING, which doesn’t run on FreeBSD. We have used Myricom NICs for several years and decided to use Myricom’s enhanced drivers to facilitate traffic distribution within the cluster. Myricom NICs are a commodity product and are relatively inexpensive. Several other specialized NIC options exist at greater cost, including Endace and Napatech. Myricom’s driver is called Sniffer10G, and it is a paid, licensed feature that runs exclusively on Myricom’s 10Gb network cards. For FreeBSD the paid Sniffer10G driver is mutually exclusive with the standard Myricom FreeBSD driver. There are two versions of the software: v2 and v3. We experimented with both versions; the critical difference is that v2 allows only for a single application to connect to the traffic streams (Bro, for example), and no other operations can be performed on the traffic (e.g., a tcpdump). The v3 code allows multiple applications to connect to the traffic simultaneously, which is valuable for testing and analysis machines running multiple monitoring tools. Once the card is installed and the license applied to the NIC, a kernel module must be loaded on the host. Binary packages are available from Myricom for Linux, FreeBSD, and Windows, but no source is available. A set of tools is installed with the Sniffer package that allows for configuration and diagnostics. Once the system configuration is complete and the kernel driver installed, a new network interface is created, which can be read by Bro or other monitoring tools. The Bro configuration sets up the connection to the Myricom streams and allows them to maintain affinity to distinct CPU cores for processing. It is important that the correct CPU pinning settings are used for the OS, number of physical cores, and number of desired workers (see the discussion in the next section, “Bro Hardware”). Configuration for the Myricom drivers is well documented and allows for control of hashing values among other advanced options.
Bro Hardware
The Bro cluster utilizes a manager node that oversees the operation of the entire cluster and acts as log aggregator for the workers. The manager is assisted by proxies that facilitate communications between manager and Bro worker nodes and within the cluster itself. Worker nodes process and analyze the network traffic and pass it to the manager to generate logs and alerts. After some experimentation, five proxies were chosen as the optimal number to allow one proxy for each of the Bro hosts in the cluster. Our experiments showed that greater than one proxy per node could cause instability and less than one proxy per node could cause congestion in the traffic analysis. In our current setup, the 100G Bro cluster has five hardware nodes, which are commodity multicore systems. Each node has a Myricom NIC installed and it runs a single Bro proxy and 10 Bro workers. The functionality of manager is also carried out by one of these nodes. This means that the manager box runs 10 workers, a proxy, and the manager processes. Our current run shows that although the manager box is under more load, it handles the dual duties of worker and manager successfully. Processor and CPU pinning: We chose Intel 3.5GHz Ivy Bridge dual hexcore (12 cores total) CPUs for each of the cluster hosts. The most important consideration when choosing processors for Bro analysis is the overall speed; we recommend purchasing the fastest processors possible. Hyperthreading is a complication worth mentioning. We decided to enable hyperthreading because the Bro nodes are doing other system and kernel processing in addition to Bro. Leaving a free core or two generally helps the system perform better, and the system can take advantage of the hyperthreaded cores. When pinning CPU cores to Bro worker processes, however, one must be cautious to use only physical cores. In Linux and FreeBSD the numbering of physical cores is different, so the correct CPU identifiers must be set for only the physical
12 of 32

cores in the system. If the physical and hyperthreaded core are both selected for the same CPU, Bro will overwhelm that core and analysis will be degraded. In the current setup we have chosen to run 10 workers and one proxy per Bro cluster host, leaving two physical cores free for other system processes. RAM: Each of the cluster hosts is equipped with 128GB DDR3 1600 MHz ECC/REG RAM. In our environment, we observe that an average Bro worker consumes about 6GB of RAM if the cluster is performing deep packet analysis with extended policies. Since each of our hosts is running 10 workers, with 6GB/worker, we need 60GB of RAM at minimum. 128GB is installed for capacity planning to scale up the number of workers if necessary or to enable more resource intensive policies. Disk: The current hardware setup comprises a mirror of two Intel 6GB/s 2.5” 120GB SSD drives for the OS and a RAID6 of six WD1000CHTZ 10K RPM 6GB/s 1TB SATA drives for the /data partition. Logs are stored temporarily in /data before being moved to a separate archive machine. Using SSDs for the OS partition provides us with a fast /tmp/ along with additional speed for swap space. Please see Appendix C for Bro hardware procurement details.
Performance
As we have outlined, our current setup splits inbound traffic into five 10Gb streams (using the Arista hardware), which are further split at the Bro hosts into roughly 1 Gbps flows to feed to each Bro worker process (using the Myricom sniffer drivers). This gives us a total theoretical monitoring capacity of 50Gbps. This is sufficient for our production network, which currently operates with sustained traffic of about 2–3Gbps and peaks going as high as 24 Gbps. We plan to scale beyond 50Gbps by adding additional Bro nodes in the future; the other distribution details and configuration remain the same. In our capacity planning we designed our system to handle what we expected to be the overall volume of our network connection (approaching 50Gbps). By using the shunting capabilities and reducing the analysis of large data flows, our system scales well beyond what we initially expected. In the following sections we discuss some specific performance measurements: traffic distribution to the cluster, CPU utilization of Bro cluster manager and workers, packet drops or traffic capture losses, and the efficacy of the shunting mechanism.
13 of 32

Traffic Distribution to the Cluster
Figure 4: Graphs of the total traffic to the cluster and then separate graphs for each Bro node As shown by the Node1 through Node5 graphs, the average volume seen by each Bro cluster node is generally under 1Gbps.
14 of 32

Bro Cluster CPU Utilization and Performance
Figure 5 shows the CPU performance of Bro cluster’s manager and worker nodes over a span of four days through a series of graphs. These graphs reveal that the average CPU utilization of an individual worker is about 20% while the Bro manager sees an average CPU utilization of about 10% with frequent spikes of up to 80%. Assuming that traffic is being processed correctly, low CPU utilization while performing indepth protocol analysis is a good indicator of nearly zero packet drops.
CPU Utilization of about 20% for Manager (with frequent peaks of 80%)
CPU Utilization of about 20% for Node1 running 10 workers
CPU Utilization of about 20% for Node2 running 10 workers
CPU Utilization of about 20% for Node3 running 10 workers
CPU Utilization of about 20% for Node4 running 10 workers
CPU Utilization of about 20% for Node5 running 10 workers
Figure 5: CPU utilization of Manager and worker Bro processes across 5 physical nodes of the cluster
15 of 32
Performance Measure of Capture Loss
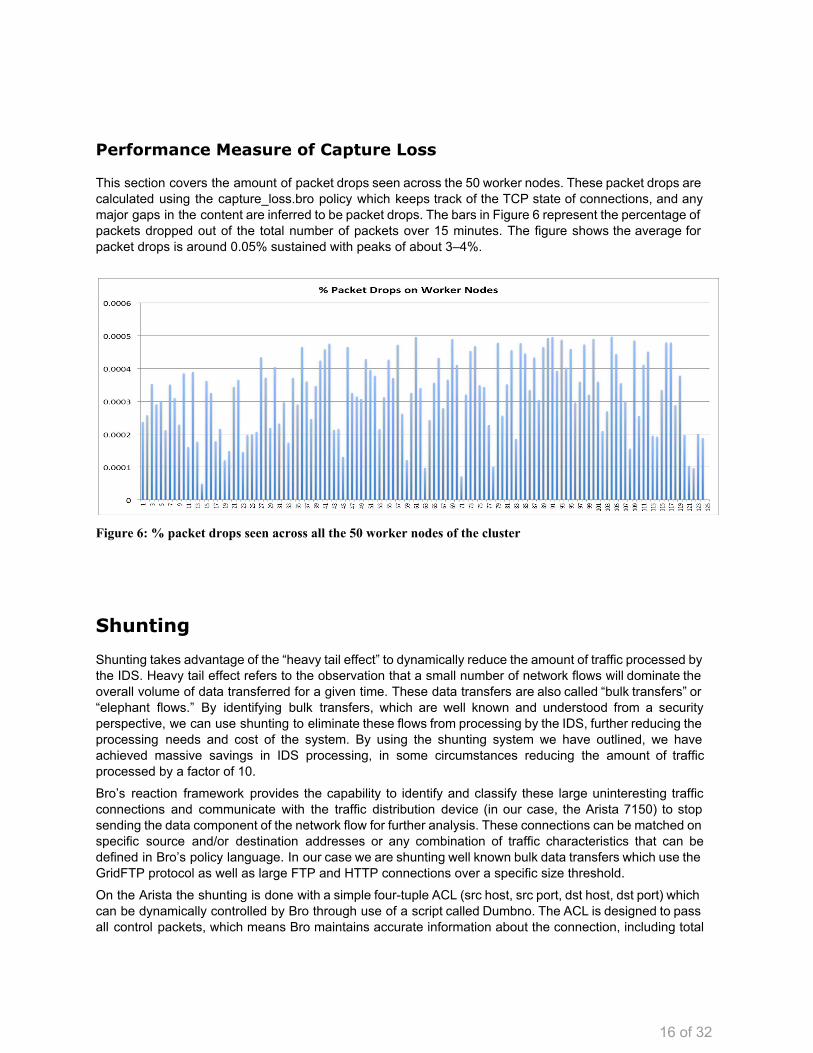
This section covers the amount of packet drops seen across the 50 worker nodes. These packet drops are calculated using the capture_loss.bro policy which keeps track of the TCP state of connections, and any major gaps in the content are inferred to be packet drops. The bars in Figure 6 represent the percentage of packets dropped out of the total number of packets over 15 minutes. The figure shows the average for packet drops is around 0.05% sustained with peaks of about 3–4%.
Figure 6: % packet drops seen across all the 50 worker nodes of the cluster
Shunting
Shunting takes advantage of the “heavy tail effect” to dynamically reduce the amount of traffic processed by the IDS. Heavy tail effect refers to the observation that a small number of network flows will dominate the overall volume of data transferred for a given time. These data transfers are also called “bulk transfers” or “elephant flows.” By identifying bulk transfers, which are well known and understood from a security perspective, we can use shunting to eliminate these flows from processing by the IDS, further reducing the processing needs and cost of the system. By using the shunting system we have outlined, we have achieved massive savings in IDS processing, in some circumstances reducing the amount of traffic processed by a factor of 10. Bro’s reaction framework provides the capability to identify and classify these large uninteresting traffic connections and communicate with the traffic distribution device (in our case, the Arista 7150) to stop sending the data component of the network flow for further analysis. These connections can be matched on specific source and/or destination addresses or any combination of traffic characteristics that can be defined in Bro’s policy language. In our case we are shunting well known bulk data transfers which use the GridFTP protocol as well as large FTP and HTTP connections over a specific size threshold. On the Arista the shunting is done with a simple fourtuple ACL (src host, src port, dst host, dst port) which can be dynamically controlled by Bro through use of a script called Dumbno. The ACL is designed to pass all control packets, which means Bro maintains accurate information about the connection, including total
16 of 32

size and duration. This provides critical metadata about the ongoing data transfer and also allows Bro to remove the corresponding ACL once a shunted connection has ended. Dumbno uses Arista’s JSON API to communicate directly between Bro and the Arista device to create and manage the ACLs. Dumbno was written by Justin Azoff (currently at NSCA) and is available from https://github.com/JustinAzoff/dumbno.
Components of Shunting
There are three components to shunting.
1. Bro’s reaction framework: This module of Bro is primarily responsible for identifying the bulk flows and triggering a block. Once Bro identifies a connection as “bulk” (based on various protocollevel heuristics), Bro triggers a “Bulk::connection_detected” event. The following code snippet highlights the event definition as well as the React::shunt() function which is called to trigger an action to shunt a connection:
event Bulk::connection_detected(c: connection) local action = (c$orig$size > c$resp$size) ? React::SHUNT_ORIG : React::SHUNT_RESP; React::shunt(c, "bulk", action); The React::shunt() function calls an external script to connect with the Dumbno daemon (see below) which generates and implements ACLs on the Arista in realtime.
2. Dumbno daemon/script: The Dumbno daemon is a python script to facilitate communication
between Bro and the Arista device. The box below illustrates an ACL rule triggered by the Dumbno script after Bro determines that a connection is a bulk transfer:
20150130 04:07:46,857 INFO op=ADD seq=33475 rule=u'tcp host 54.183.14.226 eq 80 host 131.243.191.181 eq 47000' 20150130 04:08:44,983 INFO op=REMOVE acl=bulk_1 seq=33475 rule="deny tcp host 54.183.14.226 eq www host 131.243.191.181 eq 47000" matches=0
The op=ADD operation is performed when a bulk connection is identified, and Bro’s React::shunt() function supplies the connection specifics to Dumbno. The Arista continues to send control packets to Bro while filtering the data packets. When the connection completes (based on the TCP state or Bro’s internal timers), Bro triggers another call to Dumbno, which processes the op=REMOVE operation, removing the ACL from the Arista. By dynamically removing the ACL after completion, the number of ACLs can be prevented from growing until resources are exhausted. The box below shows a specific shunted HTTP connection from the Bro connection log. This connection lasted for ~280 seconds and was shunted when the connection reached 150 Mb in size. All data before
17 of 32

150Mb were analyzed by Bro as well as the control packets, which closed the connection.
Jan 30 04:07:11 CAlIv61BX3YxDFSdod 131.243.191.181 47000 54.183.14.226 80 tcp http 280.754874 129 154300309 SF T 2154880 ShADadfFr 42623 2216689 108240 158909881 (empty) worker35
Shunting Effectiveness Figure 7 illustrates the effectiveness of shunting. Bro has identified connections (as illustrated by the yellow series) and instructed the Arista to stop sending the remaining data of those connections to the cluster for analysis. The figure shows that, on average, shunting reduces the traffic from around 10Gbps in the original stream to about 1 Gbps sent to the cluster. The “To IDS” series highlights the total traffic seen by the Bro cluster after shunting. The spikes show several large flows of 8–10.5Gbps being removed from analysis through the shunting mechanism. These large spikes generally occur when applications like GridFTP or SSH are doing long running, large data transfers.
Figure 7:Shunting in action: bytes filtered by active shunting
18 of 32

Figure 8 shows the number of ACL operations per day where the Bro cluster identified and shunted connections which were characterized as uninteresting and presenting no security risk. For the current 100G cluster setup, we identify GridFTP and any connections > 2GB (the vast majority of such connections are SSH, HTTP, FTP data transfers) as potential candidates for shunting.
Figure 8: ACL transactions showing the number of shunting operations executed on the Arista
19 of 32

Acknowledgements
This work was supported in part by Wayne Jones, the Acting Associate Administrator for Information Management and Chief Information Officer within the Office of the Chief Information Officer at the National Nuclear Security Administration within the U.S. Department of Energy. Strategic guidance and project support was provided by Rosio Alvarez, Ph.D., Chief Information Officer at Berkeley Lab. We would also like to thank the following people for their technical support of this project: Robin Sommer, Scott Campbell, Seth Hall, Justin Azoff, James Welcher, Craig Leres, Partha Banerjee, Miguel Salazar, and Vern Paxson. Earlier versions of this document were improved thanks to editorial reviews by Michael Jennings, Adam Slagell, Scott Campbell, Robin Sommer, and Rune Stromsness. We also thank Jessica Scully for technical editing. The following organizations also provided technical guidance or hardware to support our evaluation process: ICSI, Broala, Arista, Brocade, and Endace. Please direct questions or comments about this document to [email protected].
20 of 32

References
This section provides links to relevant background reading or reference material for the technology used in our 100G IDS implementation.
1. Campbell, Scott, and Jason Lee, “Intrusion Detection at 100G,” the International Conference for High Performance Computing, Networking, Storage, and Analysis, November 14, 2011.
2. Campbell, Scott, and Jason Lee, “Prototyping a 100G Monitoring System,” 20th Euromicro International Conference on Parallel, Distributed, and NetworkBased Processing (PDP 2012), February 12, 2012, http://ieeexplore.ieee.org/stamp/stamp.jsp?tp=&arnumber=6169563.
3. Paxson, Vern, “Bro: A System for Detecting Network Intruders in RealTime,” in Proceedings of the
7th USENIX Security Symposium, San Antonio, TX, 1998.
4. Leland, W., M. Taqqu, and Wilson D. Willinger, “On the SelfSimilar Nature of Ethernet Traffic,” Proceedings, SIGCOMM ’93, September 1993.
5. Vallentin, M., R. Sommer, J. Lee, C. Leres, V. Paxson, and Brian Tierney, “The NIDS Cluster:
Scalable, Stateful Network Intrusion Detection on Commodity Hardware,” Proceedings RAID 2007, http://www.icir.org/robin/papers/raid07.pdf.
6. Weaver, N., V. Paxson, and J. Gonzalez, “The Shunt: An FPGABased Accelerator for Network
Intrusion Prevention,” Proceedings FPGA 07, February 2015, http://www.icir.org/vern/papers/shuntfpga2007.pdf.
7. Schneider, F., J. Wallerich, and A. Feldmann, “Packet Capture in 10Gigabit Ethernet
Environments Using Contemporary Commodity Hardware,” PAM 2007, Louvainlaneuve, Belgium.
8. PF_RING: Highspeed packet capture, filtering and analysis (n.d.), retrieved February 20, 2015, from http://www.ntop.org/products/pf_ring/.
9. Myricom Sniffer 10G: Sniffer10G Documentation and FAQ (n.d.), retrieved February 20, 2015, from
https://www.myricom.com/software/sniffer10g.html.
10. Endace DAG Data Capture Cards (n.d.), retrieved February 20, 2015, from http://www.emulex.com/products/networkvisibilityproductsandservices/endacedagdatacapturecards/features/.
11. Napatech Products (n.d.), retrieved February 20, 2015, from http://www.napatech.com/products.
21 of 32

Appendices
Appendix A: Arista Config
Arista 7504 configuration
! device: arista7504 (DCS7504, EOS4.14.4F) ! ! boot system flash:/EOS4.14.4F.swi ! transceiver qsfp defaultmode 4x10G ! hostname arista7504 ip nameserver vrf default 131.243.5.1 ip domainname lbl.gov ! ntp server tic.lbl.gov ntp server toc.lbl.gov ! ptp hardwaresync interval 1000 ! spanningtree mode mstp ! no aaa root ! username admin role networkadmin secret ! tap aggregation mode exclusive ! interface PortChannel1 description arista7150 switchport mode tool switchport tool group set CENICer2 ESneter1100G UCBer1 UCBer2 ! interface Ethernet3/1/1 description "ESnet 100G RX" switchport mode tap switchport tap default group ESneter1100G ! interface Ethernet3/1/2 !
22 of 32

... ! interface Ethernet3/2/1 description "ESnet 100G TX" switchport mode tap switchport tap default group ESneter1100G ! interface Ethernet3/2/2 ! ... ! interface Ethernet4/5 description "in from er1UCB tap rx" switchport mode tap switchport tap default group UCBer1 ! interface Ethernet4/6 description "in from er1UCB tap tx" switchport mode tap switchport tap default group UCBer1 ! interface Ethernet4/7 description "in from er2UCB tap rx" switchport mode tap switchport tap default group UCBer2 ! interface Ethernet4/8 description "in from er2UCB tap tx" switchport mode tap switchport tap default group UCBer2 ! interface Ethernet4/9 description "in from CENICer2 tap rx" switchport mode tap switchport tap default group CENICer2 ! interface Ethernet4/10 description "in from CENICer2 tap tx" switchport mode tap switchport tap default group CENICer2 !
23 of 32

interface Ethernet4/11 ! ... ! interface Ethernet4/17 description "LAG to arista7150" channelgroup 1 mode on switchport mode tool ! interface Ethernet4/18 description "LAG to arista7150" channelgroup 1 mode on switchport mode tool ! interface Ethernet4/19 description "LAG to arista7150" channelgroup 1 mode on switchport mode tool ! interface Ethernet4/20 description "LAG to arista7150" channelgroup 1 mode on switchport mode tool ! interface Ethernet4/21 description "LAG to arista7150" channelgroup 1 mode on switchport mode tool ! ... ! interface Management1/1 ip address ! no ip routing ! management api httpcommands no shutdown ! ! end
24 of 32

Arista 7150 configuration
! device: arista7150 (DCS7150S52CL, EOS4.13.9M) ! ! boot system flash:/EOS4.13.9M.swi ! transceiver qsfp defaultmode 4x10G ! loadbalance policies loadbalance fm6000 profile symmetric no fields mac fields ip protocol dstip dstport srcip srcport distribution symmetrichash macip ! ! hostname arista7150 ip nameserver vrf default 131.243.5.1 ip domainname lbl.gov ! ntp server tic.lbl.gov ntp server toc.lbl.gov ! spanningtree mode mstp ! no aaa root ! username admin role networkadmin secret ! tap aggregation mode exclusive ! interface PortChannel1 description arista7504in ingress loadbalance profile symmetric ip accessgroup bulk_1 in switchport mode tap switchport tap default group 100G_test ! interface PortChannel2 description 100Gout
25 of 32

switchport mode tool switchport tool allowed vlan 1,517,1204,1206,1411,1611 switchport tool group set 100G_test ! interface Ethernet12 ingress loadbalance profile symmetric ip accessgroup bulk_1 in switchport mode tap ! ... ! interface Ethernet17 description Link to arista7504 #1 channelgroup 1 mode on switchport mode tap ! interface Ethernet18 description Link to arista7504 #2 channelgroup 1 mode on switchport mode tap ! interface Ethernet19 description Link to arista7504 #3 channelgroup 1 mode on switchport mode tap ! interface Ethernet20 description Link to arista7504 #4 channelgroup 1 mode on switchport mode tap ! interface Ethernet21 description Link to arista7504 #5 channelgroup 1 mode on switchport mode tap ! ... ! interface Ethernet36 description 100Gmgr channelgroup 2 mode on
26 of 32

switchport mode tool ! interface Ethernet37 description 100G01 channelgroup 2 mode on ! interface Ethernet38 description 100G02 channelgroup 2 mode on ! interface Ethernet39 description 100G03 channelgroup 2 mode on ! interface Ethernet40 description 100G04 channelgroup 2 mode on ! ... ! interface Management1 ip address ! ip accesslist bulk_1 statistics perentry 10 permit tcp any any fin 20 permit tcp any any syn 30 permit tcp any any rst 100001 permit ip any any ! ip route ! no ip routing ! management api httpcommands no shutdown ! ! end
27 of 32

Appendix B: Cluster Configuration (FreeBSD)
[bro@100Gmgr /usr/local/bro/etc]$ cat node.cfg ## Below is an example clustered configuration. [manager] type=manager host=100Gmgr.lbl.gov [proxy1] type=proxy host=100G01.lbl.gov env_vars=LD_LIBRARY_PATH=/usr/local/opt/snf/lib:$PATH [worker1] type=worker host=100G01.lbl.gov interface=myri0 lb_method=myricom lb_procs=10 pin_cpus=3,5,7,9,11,13,15,17,19,21 env_vars=LD_LIBRARY_PATH=/usr/local/opt/snf/lib:$PATH, SNF_DATARING_SIZE=0x100000000, SNF_NUM_RINGS=10, SNF_FLAGS=0x1 [proxy2] type=proxy host=100G02.lbl.gov env_vars=LD_LIBRARY_PATH=/usr/local/opt/snf/lib:$PATH [worker2] type=worker host=100G02.lbl.gov interface=myri0 lb_method=myricom lb_procs=10 pin_cpus=3,5,7,9,11,13,15,17,19,21 env_vars=LD_LIBRARY_PATH=/usr/local/opt/snf/lib:$PATH, SNF_DATARING_SIZE=0x100000000, SNF_NUM_RINGS=10, SNF_FLAGS=0x1 [proxy3] type=proxy host=100G03.lbl.gov env_vars=LD_LIBRARY_PATH=/usr/local/opt/snf/lib:$PATH [worker3] type=worker host=100G03.lbl.gov interface=myri0 lb_method=myricom lb_procs=10 pin_cpus=3,5,7,9,11,13,15,17,19,21 env_vars=LD_LIBRARY_PATH=/usr/local/opt/snf/lib:$PATH, SNF_DATARING_SIZE=0x100000000, SNF_NUM_RINGS=10, SNF_FLAGS=0x1 [proxy4] type=proxy host=100G04.lbl.gov
28 of 32

env_vars=LD_LIBRARY_PATH=/usr/local/opt/snf/lib:$PATH [worker4] type=worker host=100G04.lbl.gov interface=myri0 lb_method=myricom lb_procs=10 pin_cpus=3,5,7,9,11,13,15,17,19,21 env_vars=LD_LIBRARY_PATH=/usr/local/opt/snf/lib:$PATH, SNF_DATARING_SIZE=0x100000000, SNF_NUM_RINGS=10, SNF_FLAGS=0x1 [proxy5] type=proxy host=100Gmgr.lbl.gov env_vars=LD_LIBRARY_PATH=/usr/local/opt/snf/lib:$PATH [worker5] type=worker host=100Gmgr.lbl.gov interface=myri0 lb_method=myricom lb_procs=10 pin_cpus=3,5,7,9,11,13,15,17,19,21 env_vars=LD_LIBRARY_PATH=/usr/local/opt/snf/lib:$PATH, SNF_DATARING_SIZE=0x100000000, SNF_NUM_RINGS=10, SNF_FLAGS=0x1
29 of 32

Appendix C: Procurement Details
Arista Procurement
1. Arista Hardware:GSADCS7504EBND Arista 7504E chassis bundle. Includes 7504 chassis, 4x2900PS, 6xFabricE modules, 1xSupervisorE
2. Arista Hardware:GSADCS7500ESUP# Supervisor module for 7500E series chassis (ships in chassis)
3. Arista Hardware:GSADCS7500E6C2LC# 6port 100GbE CFP2 wirespeed linecard for 7500E Series (ships in Chassis)
4. Arista Hardware:GSADCS7500E48SLC# 48 port 10GbE SFP+ wirespeed linecard for 7500E Series (ships in chassis)
5. Arista Hardware:GSACFP2100GLR4 100G LR Transceiver CFP2, 10KM
6. Arista Hardware:GSADCS7150S52CLF Arista 7150S, 52x10GbE (SFP+) switch with clock, fronttorear air, 2xAC, 2xC13C14 cords
7. Arista Hardware:GSALICFIX2Z Monitoring & provisioning license for Arista Fixed switches 40128 port 10G (ZTP, LANZ, TapAgg, API, Timestamping, OpenFlow)
8. Arista Hardware:GSASFP10GSR 10GBASESR SFP+ (Short Reach)
9. Arista Hardware:GSASFP10GLR 10GBASELR SFP+ (Long Reach)
10.Arista Hardware:GSASFP1GT 1000BASET SFP (RJ45 Copper)
11.Arista Hardware:GSACABSFPSFP0.5M 10GBASECR twinax copper cable with SFP+ connectors on both ends (0.5m)
12.Arista Hardware:GSACABSFPSFP3M 10GBASECR twinax copper cable with SFP+ connectors on both ends (3m)
30 of 32

Bro hardware Procurement
We purchased five of the following pieces of hardware through a local small vendor of hardware. Note the Myricom network cards are included.
1. FTE52643V2/2U, Intel Dual Xeon (Ivy Bridge) E52643V2 3.5GHz 2U 2. Motherboard SM, X9DRiF 3. Intel E52643V2 3.5GHz Ivy Bridge (2x6=12 Cores) 4. Copper Base CP0219 CPU Cooler Active 5. 128GB DDRIII 1600MHz ECC/REG (8x16GB Modules Installed) 6. On Board 10/100/1000 7. On Board VGA 8. On Board IPMI 2.0 Via 3rd. Lan 9. Intel 120GB SSD 6GB/s 2.5" 10.WD1000CHTZ 1TB 10KRPM 6GB/s SATA 11.10GPCIE28C22S+; Myricom 10G "Gen2" (5 GT/s) PCI Express NIC with two SFP+ 12.Myricom 10GSR Modules 13.LSI 92718i 8 Ports Raid 14.LSI Cache Vault LSI 00297 15.LSI Mounting Board LSI00291 16.SMCi Chassis 213LTQR720LPB (black) 17.720W highefficiency (94%+) redundant power supplies
Myricom Drivers Procurement
In addition to purchasing the Myricom hardware, to use the advanced feature of the Myricom cards to distribute traffic additional drivers must be purchased. Myricom requires the serial number of the card to link it to the driver license.
1. 10GSNF3LICENSE Version 3 license
31 of 32

Appendix D: Photo of Production Solution
32 of 32