10-year housing and homelessness plan progress report
TRANSCRIPT

10-YearHousing and Homelessness Plan Progress Report
2014 to 2017
A city where everyone has a place to call homeMarch 2018

In 2011, Ottawa City Council approved an annual investment of $14M in a number of housing and homelessness initiatives to help people in need in our community. This investment grew by an additional $2 million in 2015.
In 2013, City Council approved a 10-Year Housing and Homelessness Plan that guides our collective efforts in creating a city where everyone has access to suitable, affordable and supportive housing.
We can all agree that more needs to be done in our community. Over 10,000 households are waiting for affordable housing and over 7,000 people used an emergency shelter last year.
We are, however, making good progress to date on our 10-Year Plan. I look forward to continuing to work with upper levels of government to accomplish even more in the year ahead. We are committed to creating housing that meets the needs of Ottawa’s residents through new construction, housing subsidies and by expanding investments in programs that help people achieve housing stability.
By working together we can leverage recently announced funding opportunities through the National Housing Strategy. Ottawa welcomes these new federal and provincial programs that will help create momentum around the 10-Year Plan. Progress is only possible with the sustained commitment of all levels of government and the local community.
I would like to thank Councillor Mark Taylor, Special Liaison on Housing and Homelessness, for his own work with the sector, aimed at identifying new ideas that will strengthen our shared commitment to robust, long-term housing and homelessness solutions.
I would also like to recognize and thank our community partners for their ongoing work towards this shared goal. Your commitment and continued support of our most vulnerable residents, is to be commended.
Although much still needs to be done, the City’s 10-Year Plan has my full support. We remain committed to creating a city where everyone can succeed, and having a safe, affordable home is an important foundation for that success.
Jim WatsonMayor

2
As a City, we have a responsibility to our residents to ensure that everyone has a home that is safe and affordable with the supports they need to keep their home over the long term. Stable housing allows people to engage in their communities and to participate in all aspects of civic life.
In Ottawa, there are over 55,000 households living on low incomes and struggling to maintain adequate housing. Our 10-Year Housing and Homelessness Plan established ambitious goals and I am proud of the progress we have made. This report highlights the tremendous work that has occurred, in collaboration with community partners, to address these needs but I also recognize the distance we have to go.
These are complex issues and require the ongoing commitment and involvement of all levels of governments to create a system of housing and support services that are easily accessible and responsive to people’s needs.
As we come to the Plan’s halfway point, we must take the opportunity to look at the changing landscape, the new opportunities, and focus our energy on the outcomes we want. I look forward to the continued efforts of the City of Ottawa Housing Services, our community partners, and our residents to end homelessness in our city and create a home for all.
Diane DeansCouncillor, Chair of the Community and Protective Services Committee
Table of Contents
A Home for Everyone 2014 to 2024 3
Housing Service System 4
Housing and Population Highlights 5
Everyone Has a Home 7
Ensuring our Homes are in a Good State of Repair 9
Emergency Shelters 10
Housing First 13
Housing First Outcomes 14
Chronic and Episodic Homelessness 15
Municipal, Provincial and Federal Funding 17
What's Next 18

3
A Home for Everyone 2014 to 2024Our 10-Year Plan will improve the housing service
system to ensure better outcomes for our residents.
Ottawa is committed to eliminating chronic
homelessness and building a city where everyone has a safe and affordable home in a neighbourhood where they choose to live.
What we want
Everyone has a home
1.1 A range of housing options meets demand through:• Construction• Purchase• Redevelopment• Housing subsidies
1.2 Housing is in a state of good repair and well managed
People get the support they need
2.1 People receive the right types of services so they can keep their homes and avoid homelessness
2.2 People who become homeless are safe and receive adequate temporary shelter and support to find housing
2.3 There is no chronic homelessness
We work together
3.1 Ottawa has an integrated housing system that is responsive to the needs of our residents
3.2 Improved policy, service planning and coordination, combined with sustained and adequate funding from all levels of government meets people’s housing and support needs

4
Housing Service System
Housing is more than just “shelter”; it provides the foundation upon which people build their lives.
People experience homelessness and housing insecurity for a variety of reasons unique to that household. Ottawa’s housing system is a framework; a system of assets, services and programs, delivered
in collaboration with community partners and adapted to each individual household's needs and circumstances.
There needs to be a range and quality of different types of housing within the community to meet the needs of residents. Individuals will not move through the housing system
in a linear fashion, as people’s needs for support and housing affordability may change over time.
The housing system needs to be flexible and responsive to provide the right housing options and supports at the right time.
Emergency and Short Term Housing
Supportive Housing
Social Housing
Affordable Rental
Housing
Affordable Home
Ownership
Market Rental and Ownership
Housing
Housing Programs
Street outreach programsDiversion services Emergency sheltersDay programs/drop-ins
Housing FirstSupportive housing Social housing (rent-geared-to-income)Rent supplements and housing allowances
Affordable housing capital funding and land acquisitionHome ownership down payment assistanceLow-income home owner repair/renovation funding
Household can support market housing costs
Income Level
$0 to $14,000 $14,001 to $25,000 $25,001 to $85,000 $85,001 and up
System Capacity
Street outreach 16 hrs/7 days a week943 permanent shelter beds431 overflow shelter beds190 permanent transitional housing beds15 day programs/drop-ins
14,957 rent-geared-to-income units2,600 market units in social housing3,798 housing subsidies2,300 supportive/ supported units
1,849 affordable housing units created since 2003205 home ownership grants issued since 2007251 home renovation grants issued since 2014567 secondary suites and coach houses created since 2014
23,489 new dwellings created since 2014: - 19,909 ownership - 3,580 rental
Housing Loss Prevention Supports

5
Bachelor One bedroom Two bedroom Three bedroom
13%
1.7%
1.6% $836 $1,023 $1,232 $1,5681.4% 2.1% 2.4%
Housing and Population Highlights
Ottawa’s population:
934,243 in 2016
2011
5.8%
2016
5,800 people migrated to Ottawafrom 2014 to 2015, a 9.0% increase from the year before
The vacancy rate declined to 1.7% in October 2017 from 3% in October 2016
2017 average market rent for all bedroom types
City Rent
Toronto (GTA) $1,296 Ottawa-Gatineau $1,113
Kingston $1,109Guelph $1,066Kitchener $1,040Hamilton $1,020London $952Peterborough $944
Core housing needs
11.9% of the population in Ottawa- Gatineau are in core housing need. These households would have to spend 30% or more of their pre-tax income to pay the median rent for local housing that is adequate, affordable and suitable.
13% of Ottawa's population live on a low income. This is approximatively115,175 residents or more than 55,000 households.
Renting in Ottawa-Gatineau
2017 vacancy rates (%) 2017 average market rent ($) by bedroom type
Source: Statistics Canada 2016 Census, Canada Mortgage Housing Corporation, City of Ottawa 2016 Annual Development Report
6
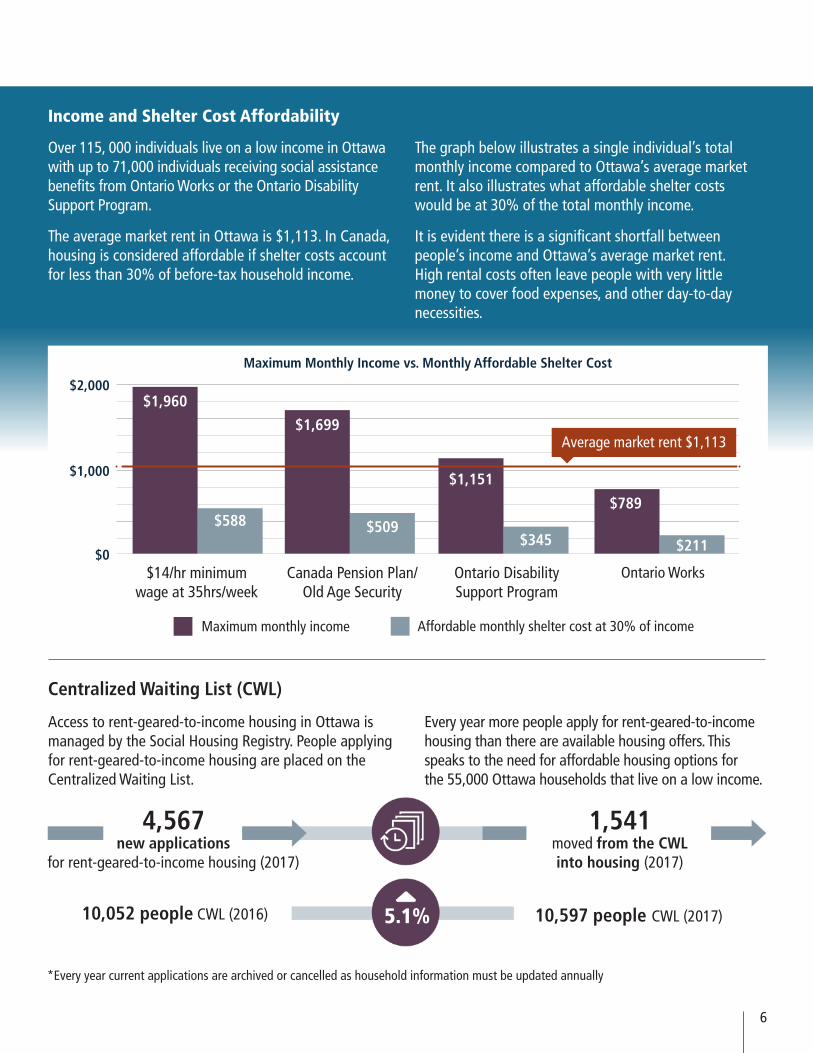
Income and Shelter Cost Affordability
Over 115, 000 individuals live on a low income in Ottawa with up to 71,000 individuals receiving social assistance benefits from Ontario Works or the Ontario Disability Support Program.
The average market rent in Ottawa is $1,113. In Canada, housing is considered affordable if shelter costs account for less than 30% of before-tax household income.
The graph below illustrates a single individual’s total monthly income compared to Ottawa’s average market rent. It also illustrates what affordable shelter costs would be at 30% of the total monthly income.
It is evident there is a significant shortfall between people’s income and Ottawa’s average market rent. High rental costs often leave people with very little money to cover food expenses, and other day-to-day necessities.
Maximum Monthly Income vs. Monthly Affordable Shelter Cost
Centralized Waiting List (CWL)
Access to rent-geared-to-income housing in Ottawa is managed by the Social Housing Registry. People applying for rent-geared-to-income housing are placed on the Centralized Waiting List.
Every year more people apply for rent-geared-to-income housing than there are available housing offers. This speaks to the need for affordable housing options for the 55,000 Ottawa households that live on a low income.
4,567new applications
for rent-geared-to-income housing (2017)
1,541moved from the CWL into housing (2017)
10,052 people CWL (2016) 5.1% 10,597 people CWL (2017)
*Every year current applications are archived or cancelled as household information must be updated annually
$14/hr minimum wage at 35hrs/week
$0
$1,000
$2,000$1,960
$1,699
$1,151
$789
$211$345$509$588
Canada Pension Plan/Old Age Security
Ontario Disability Support Program
Ontario Works
Average market rent $1,113
Maximum monthly income Affordable monthly shelter cost at 30% of income

Multifaith Housing 445 Via Verona Avenue
98 unitsOne-to four unitsShared community spaces
Montfort Renaissance
48 supportive housing units Access to programs, activities and skill development workshops Commercial kitchen that provides tenants with an opportunity to gain work experience
• •
•
1900 St. Joseph Boulevard • •
•
7
Everyone Has a HomeAffordable and Supportive Housing
Action Ottawa is the City’s primary program for increasing the supply of low-income affordable housing in Ottawa. Action Ottawa combines City incentives with funding from all three levels of government to help private and non-profit developers build new affordable rental housing for moderate and low-income households.
Affordable and supportive housing completed
2014136 units
11 supportive125 affordable
201534 units
34 supportive
201648 units
42 supportive 6 affordable
2017146 units
48 supportive 98 affordable
364 total units 135 supportive 229 affordable
2014
Ottawa Community Housing 140 Den Haag Drive (74 units)
Ottawa Community Housing 454-456 Old St. Patrick Street (10 units)
Personal Choice Independent Living 1604 Pullen Avenue (11 units)
Wigmanen Inc. 205 Eric Czapnik Way (41 units)
2015
John Howard Society 322 Gardner Street (34 units)
2016
Ottawa Community Housing 2914-2924 Michele Drive (6 units)
Ottawa Salus 1604 Clementine Boulevard (42 units)
2017 completions
Multifaith Housing 445 Via Verona Avenue • 98 units• One-to four bedrooom units• Shared community spaces
Montfort Renaissance 1900 St. Joseph Boulevard • 48 supportive housing units • Access to programs, activities
and skill development workshops • Commercial kitchen that provides
tenants with an opportunity to gain work experience

8
Affordable and Supportive Housing in Development
Youth Services Bureau 2887 Riverside Drive • 39-unit building for high-risk,
vulnerable youth aged 16 to 24• Includes a youth hub where the
Youth Services Bureau and otherpartners will offer integratedprograms
Ottawa Community Housing 900 Merivale Road • 42 one-bedroom units for seniors• Partnership between the
Carlington Community HealthCentre and Ottawa CommunityHousing
• Health clinic on ground floor• Built to Passive House standards
Shepherds of Good Hope 765 Montreal Road • 42 supportive housing units• On-site 24 hour per day staffing• Medical supports
456 new affordable and supportive housing units under development
Canadian Mental Health Association 1365 Bank Street (8 condominium units)
Cornerstone Housing for Women 373 Princeton Avenue (42 units)
Cumberland Housing Corp. 2980 Colonial Road (15 units)
John Howard Society of Ottawa 59 Carruthers Avenue (36 units)
Kings Daughters and Sons 567 Cambridge Street (58 units)
Ottawa Community Housing - 811 Gladstone Avenue (158 units) - 900 Merivale Road (42 units) - 3225 Uplands Drive (16 units)
Shepherds of Good Hope 765 Montreal Road (42 units)
Youth Services Bureau 2887 Riverside Drive (39 units)
Shepherds of Good Hope 765 Montreal Road • 42 supportive housing units• On-site 24 hour per day staffing• Medical supports
900 Merivale Road
• Health clinic on ground floor• Built to Passive House standards
••
Youth Services Bureau 2887 Riverside Drive • 39-unit building for high-risk,
vulnerable youth aged 16 to 24• Includes a youth hub where the
Youth Services Bureau and otherpartners will offer integratedprograms
Ottawa Community Housing
42 one-bedroom units for seniorsPartnership between theCarlington Community HealthCentre and Ottawa CommunityHousing

9
2014 to 2015
2016
2017
Total 386
The Rent Supplement Program provides rent-geared-to-income assistance to qualifying households selected from the Centralized Waiting List. The City contracts with private and non-profit landlords who are willing to participate in the program. The household pays approximately 30% of their gross monthly income as rent to the landlord and the remaining portion of the monthly rent is paid directly to the landlord by the Rent Supplement Program. The subsidy is attached to the rental unit and cannot be transferred if the tenant wishes to move to another location/dwelling.
A Housing Allowance is a subsidy that can be paid directly to qualifying households in need of assistance to cover housing rental costs. This benefit is $250 for a single person and $50 for each additional family member and could be paid directly to the landlord. It is portable anywhere in the City. A household in receipt of a Housing Allowance may remain on the Centralized Waiting List.
New housing subsidies (2014 to 2017)
Ensuring our Homes are in a Good State of Repair
Building new affordable and supportive housing and creating new housing subsidies is key to increasing our affordable housing options. To preserve our existing social and affordable housing, it is important that the stock remains in a good state of repair.
Investments from the federal, provincial and municipal governments 2014 to 2017
$41 million in capital repairs
12,253 in-units and/or common area repairs
277 repair projects
Housing Allowances Rent Supplements
5
132 100
9140

10
Emergency Shelters
People experience homelessness for a variety of reasons which may include a change in economic circumstances, family breakdown, domestic violence, addiction, mental health challenges, migration, etc.
The City owns and operates two family shelters and partners with eight other community organizations to provide temporary, safe emergency shelter services to people in need. The goal is to help people stabilize, as well as to find and maintain suitable, affordable housing.
Demand for emergency shelter beds continues to increase, with a 5.1% increase from 2016 to 2017. Ottawa continues to build new affordable and supportive housing, create new housing subsidies and invest in both prevention and support services to meet the needs of our community.
Total number of people using an overnight emergency shelter in Ottawa
2014 2015 2016 2017 Change
Total People 6,502 6,816 7,167 7,530 5.1% (363)
Single Men 3,041 2,964 3,108 3,224 3.7% (116)
Single Women 912 916 967 895 -7.4% (-72)
Single Youth* 379 387 289 255 -11.8% (-34)Families (units) 706 781 880 989 12.4% (109)
Individual Family Members 2,278 2,634 2,863 3,237 13.1% (374)
Total Nights 504,573 500,326 526,110 656,057 24.7% (129,947)
*Includes stays in designated youth shelters and off-site motel placements.
Average length of stay (LOS) in days
2014 2015 2016 2017 Change
Overall Average 78 73 73 87 19.2% (14)
Single Men 65 64 61 58 -4.9% (-3)
Single Women 60 59 59 64 8.5% (5)
Single Youth 39 32 47 54 14.9% (7)
Families 105 92 93 123 32.3% (30)
The average length of stay decreased by 6.4% from 2014 to 2016, however increased by 19.2% in 2017. This increase is due to higher demand from families, with a 12.4% increase in families seeking emergency shelter (880 to 989 families) and a corresponding increase of 32.3% in their length of stay.
In 2017,7,530 unique
individuals stayed in shelters, however 1,280 people were
diverted from emergency shelters.

11
AHomefor Everyone
“I moved to the women’s shelter for a year after my rooming house burned down.
My case manager helped me get a
bachelor apartment in a semi-supportive living
building. Along with mental health supports related to my PTSD, she
also helped me quit smoking. Next I hope to join some activities to improve my mental and physical health.”
YouthThe number of youth aged 16 to 25 who used an emergency shelter at any point in 2017 decreased by 4.4% for both male and female youth.
Due to the limited capacity of youth specific shelter/transitional housing options, 616 of the 802 youth who used a shelter in 2017 received services in the adult shelter system. This translates into approximately 58 youth on any given night. Young people may be unsafe and at risk in the adult shelters due to their age and vulnerabilities. These young people would be better served in an environment that has specific expertise in delivering supports to youth.
Unique youth (16 to 25) average length of stay (LOS) in days
Youth 2014 2015 2016 2017 Change
Total 924 900 839 802 -4.4% (-37)
Male 577 550 514 493 -4.1% (-21)Avg. LOS 37 41 36 34
Female 347 350 325 309 -4.9% (-16)Avg. LOS 43 37 43 55
Families Increased demand over 2016 and 2017 for family shelter placement created capacity issues within the family shelter system, resulting in more families being placed in off-site motels, hotels and post-secondary residences. The City has responded by increasing the number of available housing allowances and improving the delivery of family shelter services, allowing more families to move to permanent housing.
Average nightly occupancy of families in off-site motels
2014 2015 2016 2017 Change
Families 97 79 92 182 97.8% (90)

12
IndigenousMany Indigenous people in our community do not access services due to experiences of racism and the need for culturally sensitive programming. Additionally, many Indigenous people do not self-identify as Indigenous due to the historical legacy of colonization, intergenerational trauma, residential schools experience and the belief that self-identification may result in discrimination or lower levels of service.
The Indigenous population is overrepresented in people experiencing homelessness across Canada, and Ottawa is no exception. The percentage of Indigenous people experiencing homelessness increased 4.6% from 2014 to 2017 and represents 16% of the overall number of single people who used a shelter in 2017. It is known that this percentage is a significant underrepresentation of local Indigenous homelessness. Many Indigenous people do not utilize the shelter system, instead preferring to couch surf and stay with family and friends.
Total number of First Nations1 people using an overnight emergency shelter in Ottawa
[1] Includes clients who self-identify as First Nations: On-Reserve, First Nations: Off-Reserve, and Non-Status.
2014 2015 2016 2017 Change
Total 435 537 471 455 -3.4 % (-16)
Single Men 263 326 306 304 -0.7% (-2)
Single Women 84 97 101 90 -10.9% (-11)
Single Youth 25 28 22 13 -40.9% (-9)
Families 51 68 35 39 11.4% (4)
Total number of Inuit people using an overnight emergency shelter in Ottawa
2014 2015 2016 2017 Change
Total 120 158 164 175 6.7% (11)
Single Men 64 75 71 91 28.2% (20)
Single Women 48 61 68 52 -23.5% (-16)
Single Youth – 5 9 10 11.1% (1)
Families 8 11 12 20 66.7% (8)
Total number of Métis people using an overnight emergency shelter in Ottawa
2014 2015 2016 2017 Change
Total 32 62 57 51 -10.5% (-6)
Single Men 23 42 37 31 -16.2% (-6)
Single Women – 10 10 9 -10.0% (-1)
Single Youth – 7 – – –
Families – – – 5 –
* A dash (–) indicates less than 5.

13
Housing First
The Housing First model is the cornerstone of the City’s plan to end chronic homelessness. Housing First is based on the belief that housing is a human right and that the primary needs of people experiencing homelessness are to obtain stable, permanent housing.
Housing First prioritizes people based on need and how long they have been homeless. The model uses a common assessment tool amongst referring agencies where people with the greatest needs are able to access housing and supports more quickly.
The Landlord Partnership Program, administered by the Salvation Army, employs Housing Locator staff to find available private market rental units for the program. Program participants are eligible to receive a housing subsidy to help make housing more affordable.
12 organizations deliver Housing First services, supporting up to 750 people at any given time:
• Canadian Mental Health Association
• Elizabeth Fry Society
• John Howard Society • Minwaashin Lodge • Operation Come Home • Options Bytown • Ottawa Mission• Pinecrest-Queensway Community
Health Centre• Salvation Army • Tungasuvvingat Inuit • Wabano Centre for Aboriginal
Health • Youth Services Bureau
This map represents the homelessness service system in Ottawa. People enter homelessness from different life situations. A triage assessment determines if people can be diverted from entering emergency shelter and provided with housing search or housing loss prevention supports. If people cannot be diverted a more detailed assessment is completed to prioritize and match people to services based on their needs, and choice in housing is provided. People’s needs determine the type, intensity and duration of supports required to help them find and keep housing over the long term.

14
92% housing retention
at 12 months
519 people housed
since 2015
Housing First Outcomes
Singles
519 people have been housed since April 2015
244 people have moved into private market housing, 101 to social housing and 174 to supportive housing
Housing retention is 86% at 6 months and 92% at 12 months
151 people have successfully graduated from the program
FamiliesSince 2011, the Pinecrest-Queensway Community Health Centre has delivered the Families First program, which provides six to nine months of wrap around supports for families exiting the family shelter system.
274 households supported in 2017, which includes 1,007 individuals, of which 497 are children under the age of 14 years
1,408 households have been supported since 2011
AHomefor Everyone
“I’ve been moving between the various men’s shelters for the past few years due to alcohol and depression.
My worker found me a very helpful landlord,
a rental subsidy and great furnishings. I live near
a community centre where I attend harm reduction
services and receive daily meals at an
affordable monthly rate.”

15
AHomefor Everyone
“My worker spent five months visiting me at
the shelter and helping me get housing. I have
schizophrenia and wasn’t very cooperative at first!
Now I’m housed and I love my place. I took
great pride in decorating it and now I am working on
a novel. I feel safe here and can work on
my recovery.”
Chronic and Episodic Homelessness
Chronically homeless
Individuals who are currently homeless and have been homeless for six months or more in the past year.
Episodically homeless
Individuals who are currently homeless and have been homeless three or more times in the past year, with a minimum of 30 days between stays.
Men In 2017, the City saw a 10.8% decrease in chronic homelessness amongst single men, (from 352 men in 2016 to 314 men in 2017), with a corresponding reduction in their length of stay by 0.7%. This decline in chronic homelessness for men can be attributed to the impacts of the Housing First program and new investments in supportive housing since 2014.
WomenBetween 2016 and 2017, the number of women experiencing episodic homelessness decreased by 61.5%, while the number of women experiencing chronic homelessness increased by 6.6% (from 91 to 97 women).
Number of people experiencing chronic or episodic homelessness
2014 2015 2016 2017 Change
Single MenChronic 358 362 352 314 -10.8% (-38)Episodic 73 61 76 73 -3.9% (-3)
Single WomenChronic 82 86 91 97 6.6% (6)Episodic 13 18 13 5 -61.5% (-8)
Single YouthChronic 5 – 5 11 120.0% (6)Episodic – 0 – – –
FamiliesChronic 97 78 87 236 171.3% (149)Episodic – – – – 0.0% (0)
* A dash (–) indicates less than 5.

16
YouthChronic homelessness increased for a small number of youth; however, the overall number of youth experiencing homelessness decreased by 11.8% (from 289 youth in 2016 to 255 youth in 2017). This increase in chronic homelessness and in the average length of shelter stay aligns with the intentional actions of youth organizations to support youth for longer periods of time and offer enhanced services. This approach supports successful transitions into suitable, affordable housing, including family reconnection.
FamiliesChronic homelessness for families rose by 171.3% (from 87 families in 2016 to 236 families in 2017) due to increased requests for placement and a lack of social and affordable housing options. This resulted in families staying in the family shelter system for longer periods of time.
Average length of stay (LOS)
2014 2015 2016 2017 Change
Single MenChronic 280 277 273 271 -0.7% (-2)Episodic 63 56 59 48 -18.6% (-11)
Single WomenChronic 270 276 266 253 -4.9% (-13)Episodic 66 66 50 60 20.0% (10)
Single YouthChronic 213 261 234 238 1.7% (4)Episodic 66 0 115 96 -16.5% (-19)
FamiliesChronic 255 252 251 262 4.4% (11)Episodic 0 0 0 0 0.0% (0)
AHomefor Everyone
“We are newcomers to the country. We arrived
in Canada 9 months ago. We have no family in Canada. We felt lost
and afraid. After the first week in the family shelter we felt relieved and well looked after by shelter
staff. I was able to find a part time job supervising
children during lunch hour at my children’s
school. We are well and proud to be in Canada
Thank you.”

17
AHomefor Everyone
“I had stopped taking my medication and became homeless again for six
months. I was quite sick mentally and physically. My case manager got me back with my doctor, psychiatrist
and my sister and they helped me straighten
my life out. Now I have Ontario Disability Support Program (ODSP) income,
an apartment and a secure feeling when I wake up
in my own home.”
Funding for Housing Programs
Municipal funding is provided for:• Operating and repairs for
social housing• Rent supplements and
housing allowances• Support services to help
people find and keep housing• Employment programs for
youth from low income families• Rent and utility arrears• Operating funding for
supportive housing
New Funding Opportunities
FederalRights-based approach$40 billion over 10 years for a new National Housing Strategy, includes:
• Grants and low cost loans for new affordable housing and social housing repair
• Increased access to surplus federal land• Renewal of the federal homelessness funding stream• Funding to protect and sustain the community housing sector• Funding to create a new portable housing benefit
ProvincialInvesting in housing and supports
New Home for Good program• $19 million for up to 130 new supportive housing units• $4.7 million ongoing to expand the Housing First program and
offer up to 310 new housing subsidiesReducing our carbon footprint
Social Housing Apartment Improvement Program$47 million from 2017 to 2021 for repairs and retrofits to reduce greenhouse gas emissions in social housing communities
•
••
Municipal $107.5MProvincial
$66.7M
Federal $26.7M
Total $201M
2018
s

18
What's Next
Key Initiatives 2018 and
2019 include:
Complete a mid-point review of the 10-Year Housing and Homelessness Plan that will
involve broad consultation with stakeholders including the public
Launch a $23.3M Request for Proposals to build new affordable and supportive housing
Implement Ottawa’s first Point in Time (PiT) count, an enumeration of people experiencing homelessness
April 19 to 20, 2018
Allocate funding to create up to 380 new housing subsidies
for people experiencing homelessness
Invest new funding in repairs/retrofits to social housing
communities to reduce greenhouse gas emissions $47M from 2017 to 2021
Undertake a review of our Emergency Shelter Standards
to ensure they reflect the changing shelter environment
Complete a review of the Housing First program,
including a fidelity assessment
Implement the Home for Good Program to expand the Housing
First program through new funding for case managers, peer workers and housing subsidies
Collaborate with partners in the design and delivery of
programs for priority groups such as Indigenous people, youth,
women, and others
Participate in engagement and feedback opportunities with our federal and provincial partners in the design and delivery of
new programs
Implement new programs under the National Housing Strategy as further details become available

-
For more information about housing services in Ottawa: - Visit www.ottawa.ca/en/residents/social-services/housing- Email [email protected] Call 3-1-1
For more information about rent-geared-to-income housing:- Visit www.housingregistry.ca- Call 613-526-2088
Information and referral helpline to community, social, government and health services:
Call 2-1-1
For general housing assistance or if you are at risk of eviction:Action-Logement, 261 Montreal Road- Visit www.action-logement.ca- Email [email protected] Call 613-562-8219
Housing Help, 502-309 Cooper Street- Visit www.housinghelp.on.ca- Email [email protected] Call 613-563-4532
Layout and creative support by Initiate Marketing Inc.
3-1-1
TTY 613-580-2401
2018
-027