10 year data report - national newborn screening and genetics
TRANSCRIPT
NNaattiioonnaall NNeewwbboorrnn SSccrreeeenniinngg
1100--YYeeaarr IInncciiddeennccee RReeppoorrtt 11999911--22000000
TTaabbuullaatteedd iinncciiddeennccee ddaattaa ffoorr NNeewwbboorrnn SSccrreeeenniinngg DDiissoorrddeerrss oorrggaanniizzeedd bbyy SSttaattee aanndd GGeenneettiiccss aanndd NNeewwbboorrnn
SSccrreeeenniinngg RReeggiioonnaall CCoollllaabboorraattiivvee GGrroouuppss
NNaattiioonnaall NNeewwbboorrnn SSccrreeeenniinngg aanndd GGeenneettiiccss RReessoouurrccee CCeenntteerr iinn CCooooppeerraattiioonn wwiitthh tthhee MMaatteerrnnaall aanndd CChhiilldd HHeeaalltthh BBuurreeaauu,, GGeenneettiicc
SSeerrvviicceess BBrraanncchh aanndd tthhee AAssssoocciiaattiioonn ooff PPuubblliicc HHeeaalltthh LLaabboorraattoorriieess.. FFiinnaall RReeppoorrtt:: MMaayy 22000099
1
Produced and published by:
The National Newborn Screening and Genetics
Resource Center
1912 W. Anderson Lane
Suite 210
Austin, TX 78757
512-454-6419
The information contained in the National Newborn Screening
10-Year Incidence Report is not copyrighted. Readers are free
to duplicate and use all or part of the information contained in
the publication. In accordance with accepted publishing
standards, the National Newborn Screening and Genetics
Resource Center (NNSGRC) requests acknowledgements, in
print, of any information reproduced in another publication.
Incidence has been calculated using data provided by the state
newborn screening programs and birth data provided by the
National Center for Health Statistics. Caution is advised in
interpreting these data since unpublished caveats may
accompany some of the program data. Every attempt has been
made to indicate instances where such caveats may exist.
Acknowledgments
The editors would like to thank the State Newborn Screening
Coordinators and Laboratory Directors for their assistance in
responding to the requests for data. The Association of Public
Health Laboratories serves as a co-sponsor of this data
collection effort.

2
Table of Contents
Overview………………………………………………………………………………………………………… 3
Newborn screening……………………………………………………………………………………………….…………. 3
NNSGRC……………………………………………………………………………………………………………………. 4
National Newborn Screening Data Report…………………………………………………………………………………... 4
10-Year Incidence Data by Disorder…………………………………………………………………………... 7
Biotinidase Deficiency………………………………………………………………………………………….……………. 8
Table 1. Biotinidase Cases and Apparent Incidence by State…………………….…………………..……………… 8
Figure 1. Apparent Incidence: Biotinidase, 1991-2000……………………………………………………….……… 9
Congenital Hypothyroidism……………………………………………………………………………………...…………... 10
Table 2. Congenital Hypothyroidism Cases and Apparent Incidence by State………………………………….…… 10
Figure 2. Apparent Incidence: Congenital Hypothyroidism, 1991-2000…………………………………………...… 11
Congenital Adrenal Hyperplasia……………………………………………………………………………………………... 12
Table 3. Congenital Adrenal Hyperplasia Cases and Apparent Incidence by State………………………………….. 12
Figure 3. Apparent Incidence: Congenital Adrenal Hyperplasia, 1991-2000……………………………………….... 13
Galactosemia - Classical Transferase Deficiency From (GALT)………………………………………………………….… 14
Table 4. Galactosemia Cases and Apparent Incidence by State…………………………………………………….... 14
Figure 4. Apparent Incidence: Galactosemia, 1992-2000…………………………………………………………….. 15
Phenylketonuria (PKU)………………………………………………………………………………………………………. 16
Table 5. Phenylketonuria Cases and Apparent Incidence by State………………………………………………...… 16
Figure 5. Apparent Incidence: Phenylketonuria, 1991-2000……………………………………………………….… 17
Maple Syrup Urine Disease………………………………………………………………………………………………..… 18
Table 6. Maple Syrup Urine Disease Cases and Apparent Incidence by State…………………………………….... 18
Figure 6. Apparent Incidence: Maple Syrup Urine Disease, 1991-2000……………………………………………... 19

3
Table of Contents
Sickle Cell Diseases (SCD) – Including S,S-Disease, S,C-Disease and S-β-Thalassemia………………………………………….. 20
Table 7. Sickle Cell Diseases Cases and Apparent Incidence by State…………………………………………….... 20
Figure 7. Apparent Incidence: Sickle Cell Diseases, 1991-2000……………………………………………………... 21
Sickle Trait………………………………………………………………………………………………………………….... 22
Table 8. Sickle Trait Cases and Apparent Incidence by State……………………………………………………….. 22
Figure 8. Apparent Incidence: Sickle Trait, 1991-2000…………………………………………………………….… 23
Cystic Fibrosis……………………………………………………………………………………………………………….. 24
Table 9. Cystic Fibrosis Cases and Apparent Incidence by State………………………………………………….... 24
Figure 9. Apparent Incidence, Cystic Fibrosis, 1991-2000………………………………………………………….... 25
Congenital Toxoplasmosis………………………………………………………………………………………………….... 24
Table 10. Congenital Toxoplasmosis Cases and Apparent Incidence by State………………………………………. 24
Figure 10. Apparent Incidence, Congenital Toxoplasmosis, 1991-2000…..…………………………………………. 25
4
Overview
NEWBORN SCREENING
Introduction
Newborn screening is recognized internationally as an
essential, preventive public health program for early
identification of heritable disorders in newborns that can
adversely affect their long term health. Early detection,
diagnosis, and treatment of these disorders can lead to
significant reductions of death, disease, and associated
disabilities.
History
Newborn screening programs in the US began with the work of
Dr. Robert Guthrie, who in the 1960s developed a screening
test for phenylketonuria. Dr. Guthrie also introduced a system
for collection and transport of blood samples on filter paper,
which provided the impetus for cost effective, population based
newborn screening.
The Maternal and Child Health Bureau (MCHB) of the Health
Resources and Services Administration (HRSA), U.S.
Department of Health and Human Services (HHS), has been
involved in the evolution of newborn screening from the
beginning, and it now funds many different activities dedicated
to strengthening and expanding newborn screening
programs. The National Newborn Screening and Genetics
Resource Center is a cooperative agreement funded by MCHB.
Likewise, the National Coordinating Center (NCC) for the
Regional Genetics and Newborn Screening Collaborative
Centers (RCs) are funding initiatives of MCHB/HRSA. The
latter strive to enhance the follow-up services necessary in
newborn screening through regional networking and
collaboration.
Current Status and Scope
States routinely test blood spots collected from newborns for
over 50 metabolic, genetic, and infectious diseases. It is no
longer appropriate to refer to this as the ‘PKU’ screening
program. since many more disorders are screened and such a
misstatement can lead to improper diagnosis and treatment.
State public health departments have oversight responsibility
for newborn screening programs including rapid and
continuing follow-up to ensure that the infants identified
through newborn screening receive early diagnosis and
treatment and ongoing management. Proper education of
professionals, parents, and policy makers is also a program
management responsibility along with ensuring that counseling
and other ancillary services are available and accessed.
The panel of disorders screened varies from program to
program, and decisions for adding or deleting tests involve
many complex social, ethical, and political issues. Usually,
newborn population screening disorders are tied to issues such
as disorder prevalence, detectability, treatment availability,
outcome, and overall cost effectiveness.
In 2006, the American College of Medical Genetics (ACMG)
published its recommendations for a uniform national
screening panel and the Secretary of HHS’s Advisory
Committee on Heritable Disorders in Newborns and Children
(ACHDNC) concurred. A core panel of 29 conditions
(including hearing screening) was recommended for inclusion
in all program mandates. An additional 25 secondary targets
(conditions identified in the differential diagnosis of the core
29) were also recommended for consideration for inclusion.
Most programs have included the core conditions and many

5
have included all or most of the 25 secondary targets in their
program requirements. Modification of the core panel is an
ongoing process with additional disorders likely to be added as
the scientific evidence mounts. A formal approval process for
this eventuality has been developed and is being utilized by the
ACHDNC.
The role and scope of newborn screening is expanding. While
traditional newborn screening was only concerned with a few
inborn errors that led to mental retardation, programs now
include disorders that can cause premature death, infectious
diseases, hearing disorders, and even heart problems.
Future Challenges
In the last decade, many technological changes occurred that
have the potential for improving the sensitivity, specificity and
scope of newborn screening services. DNA research and the
human genome project contributed new knowledge that aided
in bringing molecular testing to newborn screening. Not only
can DNA be used for second tier confirmation of some
newborn screening conditions, but chip technology may allow
its use in the future as a routine primary screen. Detection of
later onset conditions is now possible, raising new issues about
which conditions to include in newborn screening. The storage,
access, and use of the residual blood spot material remaining
after screening are also major issues that may impact the
research potential of newborn screening programs.
NNSGRC
The National Newborn Screening and Genetics Resource
Center (NNSGRC) is a cooperative agreement between the
Maternal and Child Health Bureau (MCHB), Genetic Services
Branch and the University of Texas Health Science Center at
San Antonio (UTHSCSA), Department of Pediatrics. The
project is funded by the Health Resources and Services
Administration (HRSA). The mission of the NNSGRC is to: 1)
provide a forum for interaction between consumers, health care
professionals, researchers, organizations, and policy makers in
refining and developing public health newborn screening and
genetics programs; and 2) serve as a national resource center
for information and education in the areas of newborn
screening and genetics.
The NNSGRC was established on the principle that accurate
genetic information and competent genetic services should be
provided to all individuals in a culturally competent,
community based, family focused, information oriented, non-
directive, and confidential manner. To this end, states have a
critical role to play in ensuring nondiscriminatory effective
genetic service and information delivery.
The NNSGRC serves as a focal point for national newborn
screening and genetics activities and provides related resources
to benefit health professionals, the public community,
consumers, and government officials. It also serves to assist
states in refining their newborn screening activities through
technical assistance reviews and to enhance their capacity to
incorporate new developments in genetics, health promotion,
and disease prevention into the public health system. In
addition to annual national information reports and online data
outlining state and territorial newborn screening activities, the
NNSGRC coordinates and facilitates national discussions of
pertinent topics in the areas of newborn screening and genetics
and assists in developing and implementing related
demonstration projects of national interest.
The NNSGRC is a component of the Genetics Division of the
Department of Pediatrics, UTHSCSA, and is located in Austin,
Texas.
6
National Newborn Screening Data
Report
In order to facilitate and enhance newborn screening
data collection efforts, the Council of Regional Networks for
Genetic Services (CORN) began collecting national newborn
screening data and prepared annual National Newborn
Screening Reports in 1988. These data and their maintenance
responsibility were transitioned to the NNSGRC in 1999. In
2001, the NNSGRC developed an online database, the National
Newborn Screening Information System (NNSIS), which
allows for real time data entry by state programs. Some
elements of these data can be viewed by the general public.
Annual National Newborn Screening Reports were
designed to respond to the needs of federal, state, and local
health agencies for pertinent data. Since 2001, the data found
in these reports have been available online through the
NNSGRC website. The data entered into the NNSIS system
since 2001 are available for program self-evaluation of the
scope and effectiveness of their existing screening program and
to assist in identifying unmet needs. Comparisons of data can
readily be made over time and across programs so that
programs can monitor both their internal and comparative
efficiency and effectiveness.
The NNSGRC currently prepares annual reports reviewing and
summarizing current program activity across the nation. This
report is a 10-year review based on data reported previously to
both CORN and the NNSGRC. These data were submitted to
the programs to validate prior to their use here. All programs
returned validated data. For simplicity, we have reported only
the apparent incidences of each screened disorder per 1000
births using the validate data. Accompanying graphs have been
provided with programs divided by regions. The seven regions
are those defined by HRSA as part of their effort to improve
screening capabilities by encouraging regional cooperation and
resource utilization. There has been no attempt to formally
analyze the current data, although the Centers for Disease
Control and others are working on various analyses.
Interpretive comments have been included to help explain
some of the limitations of the compiled information. Although
attempts have been made to make this report as reliable as
possible, its accuracy is dependent upon data provided by the
individual programs.

7
10 - Year Incidence Data by Disorder
The following tables and graphs were prepared by extracting the cases reported for each disorder from voluntary annual data
submissions from the various state newborn screening programs. Births were those reported to have occurred within the state
jurisdiction as reported to and published by the U.S. National Center for Health Statistics. When screening began at a time other than
the first of a year, the births screened for that year have been estimated by assuming 1/12 of the annual births for each month.
Extracted case data were placed into tables and returned to the state programs for validation and correction, where appropriate. All of
the data reported here were validated by the program manager for the appropriate state program at the end of 2003. The data are
displayed in regional format using the regional collaboratives currently defined by the Health Resources and Services Administration.

8
Biotinidase Deficiency
Biotinidase deficiency is caused by the lack of the
enzyme biotinidase, which results in an inability to liberate
biotin from its bound form so that it can be used by the body.
Biotinidase deficiency can lead to seizures, developmental
delay, eczema, and hearing loss. Metabolic acidosis can result
in coma and death. Biotinidase deficiency is treated with daily
biotin supplement, and with early diagnosis and treatment, all
symptoms can be prevented.
Table 1. Biotinidase cases and apparent incidence by state
Region States Cases Births Incidence
Region 1 Connecticut 1
5 331,638 0.015 Maine
2 1 17,730 0.056
Massachusetts3 23 735,807 0.031
New Hampshire Not Required Rhode Island
4 2 94,939 0.021
Vermont5 4 55,678 0.072
Region 2 Delaware6 Not Required
Dist. of Columbia Not Required Maryland 14 689,636 0.020 New Jersey Not Required New York 30 2,717,145 0.011 Pennsylvania
7 Not Required
Virginia 13 927,058 0.014 West Virginia Not Required
Region 3 Alabama Not Required Florida Not Required Georgia Not Required Louisiana
8 2 240,321 0.008
Mississippi Not Required N. Carolina Not Required S. Carolina Not Required Tennessee Not Required
Region 4 Illinois 15 1,833,397 0.008 Indiana
9 0 37,450 0.000
Kentucky Not Required Michigan 44 1,363,489 0.032 Minnesota Not Required Ohio Not Required Wisconsin 7 677,543 0.010
Region 5 Arkansas Not Required Iowa Not Required Kansas Not Required Missouri Not Required Nebraska 8 238,211 0.034 North Dakota Not Required Oklahoma Not Required South Dakota Not Required
Region 6 Arizona 5 744,355 0.007 Colorado 10 572,543 0.017 Montana Not Required Nevada 1 252,212 0.004 New Mexico
10 1 150,574 0.007
Texas Not Required Utah Not Required Wyoming 2 60,127 0.033
Region 7 Alaska 1 104,123 0.010 California Not Required Hawaii
11 2 61,109 0.033
Idaho 4 181,002 0.022 Oregon 8 449,080 0.018 Washington Not Required
Totals 202 12,535,167 0.016 1Began testing 7/1993
2Began testing 9/1999
3Began testing 3/1992
4Began testing 1/1994
5Began testing 7/1992
6Testing discontinued 7/1999
7Screening for select population only
8Began testing 10/1997
9Began testing 8/2000
10Began testing 5/1995
11Began testing 7/1997

9
Figure 1. Apparent Incidence: Biotinidase, 1991-2000
Apparent National Incidence: 0.016

10
Congenital Hypothyroidism
CH is the result of an inability to produce adequate
amounts of thyroid hormone. Left untreated, this congenital
deficiency of thyroid hormone can result in mental retardation
and stunted growth. Newborns may appear normal up to three
months of age. If detected early (before three weeks) and
maintained on appropriate levels of thyroid hormone
medication, infants diagnosed with CH should have normal
growth and development.
Table 2. Congenital Hypothyroidism cases and apparent incidence by state
Region States Cases Births Incidence
Region 1 Connecticut 107 450,760 0.237 Maine 39 142,013 0.275 Massachusetts 350 840,895 0.416 New Hampshire 59 144,239 0.409 Rhode Island 42 140,744 0.298 Vermont 16 67,164 0.238
Region 2 Delaware 26 111,542 0.233 District of Columbia 37 169,169 0.219 Maryland 167 689,363 0.242 New Jersey 448 1,132,035 0.396 New York 1448 2,717,145 0.533 Pennsylvania 462 1,540,411 0.300 Virginia 242 927,058 0.261 West Virginia 82 222,847 0.368
Region 3 Alabama 129 608,658 0.212 Florida 461 1,938,549 0.238 Georgia 342 1,178,731 0.290 Louisiana 105 681,043 0.154 Mississippi 70 416,095 0.168 North Carolina 286 1,075,129 0.266 South Carolina 108 518,370 0.208 Tennessee * 261 798,534 0.327
Region 4 Illinois 584 1,833,397 0.319 Indiana 276 843,890 0.327 Kentucky 153 523,047 0.293 Michigan 388 1,363,489 0.285 Minnesota 223 650,602 0.343 Ohio 451 1,573,024 0.287 Wisconsin 247 677,543 0.365
Region 5 Arkansas 103 347,456 0.296 Iowa 174 378,283 0.460 Kansas 134 366,466 0.366 Missouri
1 207 776,669 0.267
Nebraska 94 238,211 0.395 North Dakota 30 95,852 0.313 Oklahoma 163 465,697 0.350 South Dakota 78 106,944 0.729
Region 6 Arizona 275 744,355 0.369 Colorado 170 572,543 0.297 Montana 25 109,655 0.228 Nevada 69 252,212 0.274 New Mexico 149 269,995 0.552 Texas 1400 3,366,219 0.416 Utah 141 421,472 0.335 Wyoming 21 60,127 0.349
Region 7 Alaska 40 104,123 0.384 California 2098 5,556,877 0.378 Hawaii 57 185,910 0.307 Idaho 45 181,002 0.249 Oregon 157 449,080 0.350 Washington 274 777,024 0.353
* Totals 13513 39,801,658 0.340
* Includes all cases reported by the program. Some cases of transient hypothyroidism may be included if program did not update records over time.
1 1991 data unavailable.

11
Figure 2. Apparent Incidence: Congenital Hypothyroidism, 1991-2000

12
Congenital Adrenal Hyperplasia (CAH) –
Classical Forms (Salt Wasting and Simple
Virilizing)
CAH is a group of disorders caused by the deficiency
of an adrenal enzyme that results in decreased cortisol (and
sometimes aldosterone) production. Without sufficient
cortical and aldosterone, the affected newborn may appear
normal but can quickly develop symptoms including
lethargy, vomiting, muscle weakness, and dehydration. In
severe cases, death may occur within a few weeks if left
untreated. Infants with milder forms of the disorder are at
risk for reproductive and growth difficulties. If detected
early and maintained on appropriate doses of medication,
infants diagnosed with CAH should have normal growth and
development. Classical CAH is usually divided into salt
wasting (SW) and simple virilizing (SV) forms. For the 10-
year period, most programs were just beginning and were not
necessarily differentiating the sub types of classical CAH.
Some, particularly programs with a routine 2nd
specimen,
were detecting cases of the late onset or nonclassical CAH.
For the purposes of this report, only the classical cases have
been tabulated.
Table 3. Classical cases of Congenital Adrenal Hyperplasia and incidence by state
Region States
Cases (Classical CAH) Total Classical
Cases Births
Incidence (Classical
CAH) Salt
Wasting Simple
Virilizing Not
Classified
Region 1 Connecticut1 3 0 0 3 379,488 0.008
Maine2 0 0 0 0 30,237 0.000
Massachusetts 8 5 40 53 840,895 0.063 New Hampshire Not Required Rhode Island
3 2 0 0 2 94,939 0.021
Vermont Not Required
Region 2 Delaware Not Required Dist. Of Columbia Not Required Maryland Not Required New Jersey Not Required New York Not Required Pennsylvania
4 1 1 0 2 36,715 0.054
Virginia Not Required West Virginia Not required
Region 3 Alabama5 3 0 0 3 379,488 0.008
Florida6 30 5 0 35 1,121,173 0.031
Georgia 41 10 5 56 1,178,731 0.048 Louisiana Not required Mississippi Not required North Carolina 38 0 12 50 1,075,129 0.047 South Carolina
7 15 3 0 18 422,440 0.043
Tennessee8 1 0 0 1 21,215 0.047
Region 4 Illinois 74 15 15 104 1,833,397 0.057 Indiana
8 4 0 0 4 21,647 0.185
Kentucky Not Required Michigan
9 53 8 0 61 1,002,672 0.061
Minnesota10
28 6 0 34 543,209 0.063 Ohio Not required Wisconsin
11 38 4 0 42 526,683 0.080
Region 5 Arkansas Not required Iowa 19 14 3 36 378,283 0.095 Kansas Not required Missouri Not required Nebraska Not required North Dakota
12 7 0 0 7 80,712 0.087
Oklahoma Not required South Dakota Not required
Region 6 Arizona Not required Colorado
13 0 0 0 0 27,365 0.000
Montana Not required Nevada Not required New Mexico
14 1 0 0 1 53,662 0.019
Texas 146 56 0 202 3,366,219 0.060 Utah Not required Wyoming Not required
Region 7 Alaska 8 5 7 20 104,123 0.192 California Not required Hawaii
15 1 0 0 1 61,109 0.016
Idaho Not required Oregon Not required Washington 29 7 3 39 777,024 0.050
Totals 550 139 85 774 14,356,555 0.054 1Testing began 10/1997.
2Testing began 10/1998.
3Testing began 1/1994.
4Testing began 10/2000, Select
population screening done prior to 2000. 5Testing began 10/1994.
6Testing began 4/1995.
7Testing began 10/1992.
8Testing began 10/2000.
9Testing began 7/1993.
10Testing began 8/1992.
11Testing began 3/1993.
12Testing began
7/1992. 13
Testing began 8/2000. 14
Testing began 1/1999 15
Testing began 7/1997.

13
Figure 3. Apparent Incidence: Congenital Adrenal Hyperplasia, 1991-2000
Apparent National Incidence: 0.054

14
Galactosemia – Classical Transferase
Deficient Form (GALT)
Galactosemia results from a deficiency in the enzyme
needed to metabolize galactose in milk sugar. Newborns
typically appear normal, however, within a few days to two
weeks after initiating milk feedings, vomiting, diarrhea,
lethargy, jaundice, and liver damage develops. Untreated, the
disorder may result in developmental retardation,
hepatomegaly, growth failure, cataracts, and in severe cases,
death. With early detection and strict adherence to a galactose-
free diet, infants diagnosed with classical GAL can be expected
to achieve satisfactory general health.
Table 4. Cases of Classical Galactosemia and incidence by state
Region States Cases Births Incidence
Region 1 Connecticut 6 450,760 0.013 Maine 5 142,013 0.035 Massachusetts 14 840,895 0.017 New Hampshire 3 144,239 0.021 Rhode Island 5 140,744 0.036 Vermont 1 67,164 0.015
Region 2 Delaware 3 111,542 0.027 Dist. of Columbia 2 169,169 0.012 Maryland 18 689,363 0.026 New Jersey 22 1,132,035 0.019 New York 43 2,717,145 0.016 Pennsylvania
1 1 36,326 0.028
Virginia 48 927,058 0.052 West Virginia 7 222,847 0.031
Region 3 Alabama2 12 496,293 0.024
Florida 42 1,938,549 0.022 Georgia 33 1,178,731 0.028 Louisiana Not Required Mississippi
3 5 373,338 0.013
North Carolina 14 1,075,129 0.013 South Carolina
4 7 422,440 0.017
Tennessee5 15 719,705 0.021
Region 4 Illinois 36 1,833,397 0.020 Indiana 18 843,890 0.021 Kentucky 25 523,047 0.048 Michigan 34 1,363,489 0.025 Minnesota 25 650,602 0.038 Ohio 51 1,573,024 0.032 Wisconsin 12 677,543 0.018
Region 5 Arkansas6 4 179,053 0.022
Iowa 10 378,283 0.026 Kansas 11 366,466 0.030 Missouri
7 17 695,593 0.024
Nebraska8 2 143,751 0.014
North Dakota9 0 80,712 0.000
Oklahoma 10 465,697 0.021 South Dakota 2 106,944 0.019
Region 6 Arizona 5 744,355 0.007 Colorado 7 572,543 0.012 Montana 4 109,655 0.036 Nevada 7 252,212 0.028 New Mexico 3 269,995 0.011 Texas 44 3,366,219 0.013 Utah 5 421,472 0.012 Wyoming 0 60,127 0.000
Region 7 Alaska 2 104,123 0.019 California 72 5,556,897 0.013 Hawaii
10 0 61,109 0.000
Idaho 3 181,002 0.017 Oregon 14 449,080 0.031 Washington Not Required
Totals 729 36,025,765 0.020 1Testing began 10/2000, Select population screening done prior to 2000.
2Testing
began 11/1992. 3Testing began 10/1991, 1991 data unavailable.
4Testing began
10/1992. 5Testing began 1/1992.
6Testing began 1/1996.
71991 data unavailable.
8Testing began 11/1996.
9Testing began 7/1992.
10Testing began 7/1997.

15
Figure 4. Apparent Incidence: Galactosemia, 1991-2000
Apparent National Incidence: 0.020
16
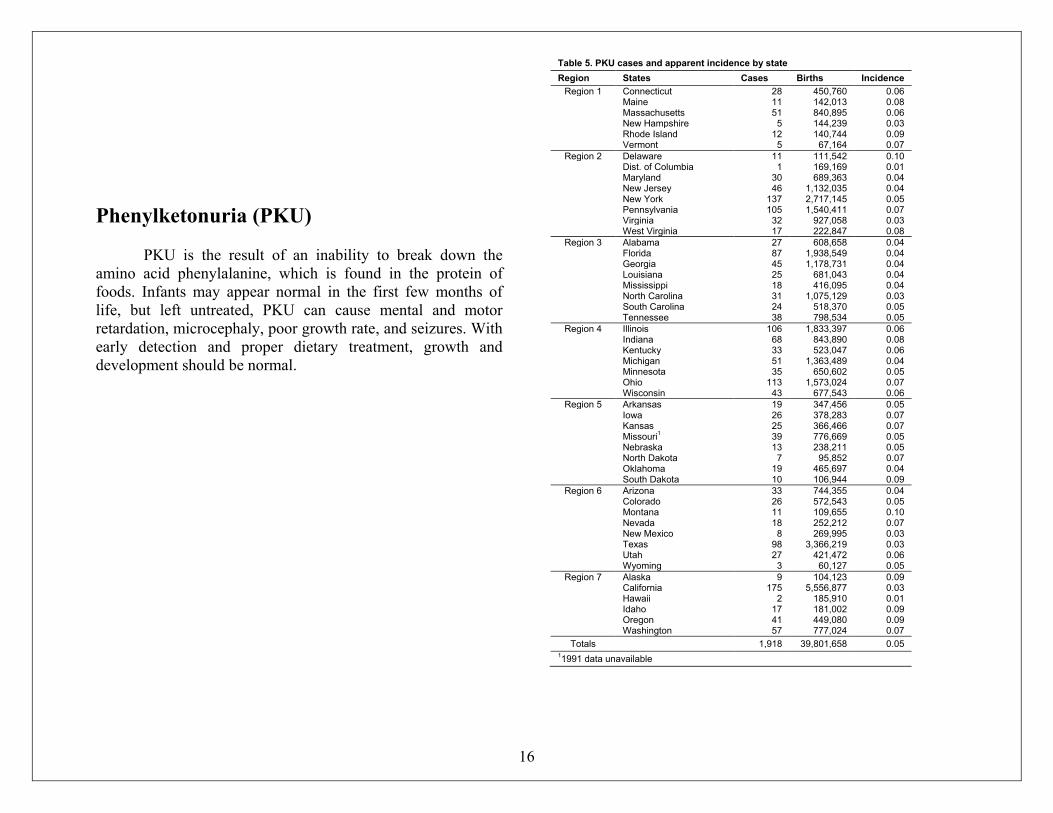
Phenylketonuria (PKU)
PKU is the result of an inability to break down the
amino acid phenylalanine, which is found in the protein of
foods. Infants may appear normal in the first few months of
life, but left untreated, PKU can cause mental and motor
retardation, microcephaly, poor growth rate, and seizures. With
early detection and proper dietary treatment, growth and
development should be normal.
Table 5. PKU cases and apparent incidence by state
Region States Cases Births Incidence
Region 1 Connecticut 28 450,760 0.06 Maine 11 142,013 0.08 Massachusetts 51 840,895 0.06 New Hampshire 5 144,239 0.03 Rhode Island 12 140,744 0.09 Vermont 5 67,164 0.07
Region 2 Delaware 11 111,542 0.10 Dist. of Columbia 1 169,169 0.01 Maryland 30 689,363 0.04 New Jersey 46 1,132,035 0.04 New York 137 2,717,145 0.05 Pennsylvania 105 1,540,411 0.07 Virginia 32 927,058 0.03 West Virginia 17 222,847 0.08
Region 3 Alabama 27 608,658 0.04 Florida 87 1,938,549 0.04 Georgia 45 1,178,731 0.04 Louisiana 25 681,043 0.04 Mississippi 18 416,095 0.04 North Carolina 31 1,075,129 0.03 South Carolina 24 518,370 0.05 Tennessee 38 798,534 0.05
Region 4 Illinois 106 1,833,397 0.06 Indiana 68 843,890 0.08 Kentucky 33 523,047 0.06 Michigan 51 1,363,489 0.04 Minnesota 35 650,602 0.05 Ohio 113 1,573,024 0.07 Wisconsin 43 677,543 0.06
Region 5 Arkansas 19 347,456 0.05 Iowa 26 378,283 0.07 Kansas 25 366,466 0.07 Missouri
1 39 776,669 0.05
Nebraska 13 238,211 0.05 North Dakota 7 95,852 0.07 Oklahoma 19 465,697 0.04 South Dakota 10 106,944 0.09
Region 6 Arizona 33 744,355 0.04 Colorado 26 572,543 0.05 Montana 11 109,655 0.10 Nevada 18 252,212 0.07 New Mexico 8 269,995 0.03 Texas 98 3,366,219 0.03 Utah 27 421,472 0.06 Wyoming 3 60,127 0.05
Region 7 Alaska 9 104,123 0.09 California 175 5,556,877 0.03 Hawaii 2 185,910 0.01 Idaho 17 181,002 0.09 Oregon 41 449,080 0.09 Washington 57 777,024 0.07
Totals 1,918 39,801,658 0.05 11991 data unavailable

17
Figure 5. Apparent Incidence: Phenylketonuria, 1991-2000
Apparent National Incidence: 0.05

18
Maple Syrup Urine Disease (MSUD)
MSUD is a disorder due to a deficiency of the
branched-chain ketoacid decarboxylase enzyme affecting the
metabolism of amino acids. Newborns typically appear normal,
but by the first week of life can present with feeding
difficulties, lethargy, and failure to thrive. Left untreated, the
disorder can lead to progressive neurological problems,
acidosis, seizures, and sudden apnea that can rapidly lead to
coma and death. Treatment consists of strict dietary
management and supplements along with close developmental
monitoring and assessment. With early detection and treatment,
infants diagnosed with MSUD can avoid many of the severe
effects of the disease and lead normal lives.
Table 6. Maple Syrup Urine Disease cases and incidence by state
Region States Cases Births Incidence
Region 1 Connecticut1 0 331,638 0.000
Maine 0 142,013 0.000 Massachusetts 2 840,895 0.002 New Hampshire 0 144,239 0.000 Rhode Island 1 140,744 0.007 Vermont 0 67,164 0.000
Region 2 Delaware2 0 105,557 0.000
District of Columbia 3 169,169 0.018 Maryland 6 689,363 0.009 New Jersey Not Required New York 9 2,717,145 0.003 Pennsylvania 16 1,540,411 0.010 Virginia 2 927,058 0.002 West Virginia Not Required
Region 3 Alabama Not Required Florida Not Required Georgia 9 1,178,731 0.008 Louisiana Not Required Mississippi Not Required North Carolina Not Required South Carolina Not Required Tennessee Not Required
Region 4 Illinois Not Required Indiana 1 843,890 0.001 Kentucky Not Required Michigan 7 1,363,489 0.005 Minnesota Not Required Ohio Not Required Wisconsin
3 0 141,248 0.000
Region 5 Arkansas Not Required Iowa
4 0 181,074 0.000
Kansas Not Required Missouri Not Required Nebraska Not Required North Dakota
5 0 80,712 0.000
Oklahoma Not Required South Dakota Not Required
Region 6 Arizona 3 744,355 0.004 Colorado
6 0 290,430 0.000
Montana Not Required Nevada 1 252,212 0.004 New Mexico Not Required Texas Not Required Utah Not Required Wyoming Not Required
Region 7 Alaska 0 104,123 0.000 California Not Required Hawaii
7 2 61,109 0.033
Idaho 0 181,002 0.000 Oregon 2 449,080 0.004 Washington Not Required
Totals 64 13,686,851 0.005 1Testing began 7/1993.
2Testing discontinued 7/1999.
3Testing discontinued 12/1992.
4Testing discontinued 9/1995.
5Testing began 7/1992.
6Testing discontinued 4/1996.
7Testing began 7/1997.

19
Figure 6. Apparent Incidence: Maple Syrup Urine Disease, 1991-2000
Apparent National Incidence: 0.005
20
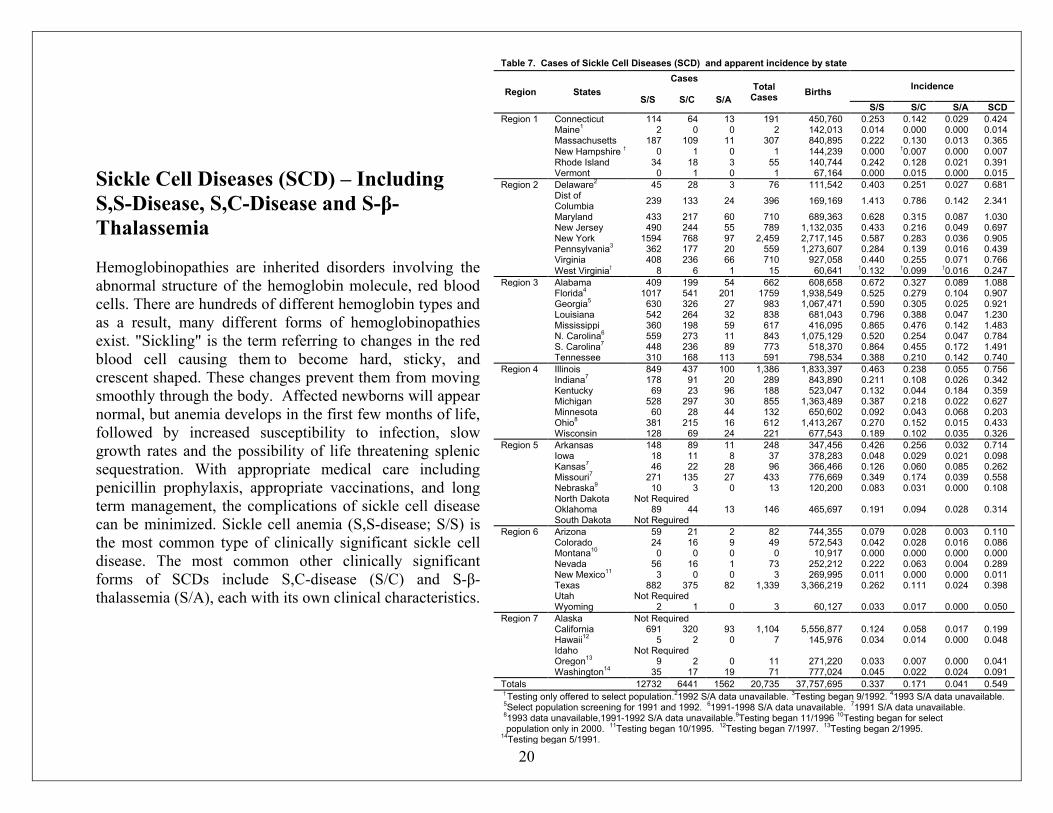
Sickle Cell Diseases (SCD) – Including
S,S-Disease, S,C-Disease and S-β-
Thalassemia
Hemoglobinopathies are inherited disorders involving the
abnormal structure of the hemoglobin molecule, red blood
cells. There are hundreds of different hemoglobin types and
as a result, many different forms of hemoglobinopathies
exist. "Sickling" is the term referring to changes in the red
blood cell causing them to become hard, sticky, and
crescent shaped. These changes prevent them from moving
smoothly through the body. Affected newborns will appear
normal, but anemia develops in the first few months of life,
followed by increased susceptibility to infection, slow
growth rates and the possibility of life threatening splenic
sequestration. With appropriate medical care including
penicillin prophylaxis, appropriate vaccinations, and long
term management, the complications of sickle cell disease
can be minimized. Sickle cell anemia (S,S-disease; S/S) is
the most common type of clinically significant sickle cell
disease. The most common other clinically significant
forms of SCDs include S,C-disease (S/C) and S-β-
thalassemia (S/A), each with its own clinical characteristics.
Table 7. Cases of Sickle Cell Diseases (SCD) and apparent incidence by state
Region States
Cases Total
Cases Births
Incidence
S/S S/C S/A S/S S/C S/A SCD
Region 1 Connecticut 114 64 13 191 450,760 0.253 0.142 0.029 0.424 Maine
1 2 0 0 2 142,013 0.014 0.000 0.000 0.014
Massachusetts 187 109 11 307 840,895 0.222 0.130 0.013 0.365 New Hampshire † 0 1 0 1 144,239 0.000 †0.007 0.000 0.007 Rhode Island 34 18 3 55 140,744 0.242 0.128 0.021 0.391 Vermont 0 1 0 1 67,164 0.000 0.015 0.000 0.015
Region 2 Delaware2 45 28 3 76 111,542 0.403 0.251 0.027 0.681
Dist of Columbia
239 133 24 396 169,169 1.413 0.786 0.142 2.341
Maryland 433 217 60 710 689,363 0.628 0.315 0.087 1.030 New Jersey 490 244 55 789 1,132,035 0.433 0.216 0.049 0.697 New York 1594 768 97 2,459 2,717,145 0.587 0.283 0.036 0.905 Pennsylvania
3 362 177 20 559 1,273,607 0.284 0.139 0.016 0.439
Virginia 408 236 66 710 927,058 0.440 0.255 0.071 0.766 West Virginia† 8 6 1 15 60,641 †0.132 †0.099 †0.016 0.247
Region 3 Alabama 409 199 54 662 608,658 0.672 0.327 0.089 1.088 Florida
4 1017 541 201 1759 1,938,549 0.525 0.279 0.104 0.907
Georgia5 630 326 27 983 1,067,471 0.590 0.305 0.025 0.921
Louisiana 542 264 32 838 681,043 0.796 0.388 0.047 1.230 Mississippi 360 198 59 617 416,095 0.865 0.476 0.142 1.483 N. Carolina
6 559 273 11 843 1,075,129 0.520 0.254 0.047 0.784
S. Carolina7 448 236 89 773 518,370 0.864 0.455 0.172 1.491
Tennessee 310 168 113 591 798,534 0.388 0.210 0.142 0.740
Region 4 Illinois 849 437 100 1,386 1,833,397 0.463 0.238 0.055 0.756 Indiana
7 178 91 20 289 843,890 0.211 0.108 0.026 0.342
Kentucky 69 23 96 188 523,047 0.132 0.044 0.184 0.359 Michigan 528 297 30 855 1,363,489 0.387 0.218 0.022 0.627 Minnesota 60 28 44 132 650,602 0.092 0.043 0.068 0.203 Ohio
8 381 215 16 612 1,413,267 0.270 0.152 0.015 0.433
Wisconsin 128 69 24 221 677,543 0.189 0.102 0.035 0.326
Region 5 Arkansas 148 89 11 248 347,456 0.426 0.256 0.032 0.714 Iowa 18 11 8 37 378,283 0.048 0.029 0.021 0.098 Kansas
7 46 22 28 96 366,466 0.126 0.060 0.085 0.262
Missouri7 271 135 27 433 776,669 0.349 0.174 0.039 0.558
Nebraska9 10 3 0 13 120,200 0.083 0.031 0.000 0.108
North Dakota Not Required Oklahoma 89 44 13 146 465,697 0.191 0.094 0.028 0.314 South Dakota Not Reguired
Region 6 Arizona 59 21 2 82 744,355 0.079 0.028 0.003 0.110 Colorado 24 16 9 49 572,543 0.042 0.028 0.016 0.086 Montana
10 0 0 0 0 10,917 0.000 0.000 0.000 0.000
Nevada 56 16 1 73 252,212 0.222 0.063 0.004 0.289 New Mexico
11 3 0 0 3 269,995 0.011 0.000 0.000 0.011
Texas 882 375 82 1,339 3,366,219 0.262 0.111 0.024 0.398 Utah Not Required Wyoming 2 1 0 3 60,127 0.033 0.017 0.000 0.050
Region 7 Alaska Not Required California 691 320 93 1,104 5,556,877 0.124 0.058 0.017 0.199 Hawaii
12 5 2 0 7 145,976 0.034 0.014 0.000 0.048
Idaho Not Required Oregon
13 9 2 0 11 271,220 0.033 0.007 0.000 0.041
Washington14
35 17 19 71 777,024 0.045 0.022 0.024 0.091
Totals 12732 6441 1562 20,735 37,757,695 0.337 0.171 0.041 0.549 † Testing only offered to select population.
21992 S/A data unavailable.
3Testing began 9/1992.
41993 S/A data unavailable.
5Select population screening for 1991 and 1992.
61991-1998 S/A data unavailable.
71991 S/A data unavailable.
81993 data unavailable,1991-1992 S/A data unavailable.
9Testing began 11/1996
10Testing began for select
population only in 2000. 11
Testing began 10/1995. 12
Testing began 7/1997. 13
Testing began 2/1995. 14
Testing began 5/1991.

21
Figure 7. Apparent Incidence: Sickle Cell Diseases, 1991-2000
Apparent National Incidence: S/S: 0.337 S/C: 0.171 S/A: 0.041

22
Sickle Cell Trait Sickle cell trait occurs when a gene for hemoglobin S is
inherited from one parent and a gene for hemoglobin A is
inherited from the other parent. Sickle cell trait rarely causes
medical problems, and individuals with trait are usually
healthy. Both parents must be carriers of sickle cell trait in
order to have a child affected with sickle cell disease.
Table 8. Sickle Cell Trait Cases and apparent incidence by state
Region States Cases Births Incidence
Region 1 Connecticut 5,378 450,760 11.93 Maine
1 123 26,948 4.56
Massachusetts 7,795 840,895 9.27 New Hampshire 81 18,322 4.42 Rhode Island
2 1,158 113,948 10.16
Vermont 57 67,164 0.85
Region 2 Delaware3 1,758 100,181 17.55
Dist. of Columbia 8,161 169,169 48.24
Maryland 17,194 689,363 24.94 New Jersey 20,294 1,132,035 17.93 New York 60,677 2,717,145 22.33 Pennsylvania
4 8,357 1,273,607 6.56
Virginia 18,243 927,058 19.68 West Virginia
1 607 60,641 10.01
Region 3 Alabama 14,448 608,658 23.74 Florida 65,163 1,938,549 33.61 Georgia 31,011 1,067,471 29.05 Louisiana 21,175 681,043 31.09 Mississippi
5 9,488 248,785 38.14
N. Carolina 22,857 1,075,129 21.26 S. Carolina 17,339 518,370 33.45 Tennessee 11,771 719,705 16.36
Region 4 Illinois 43,217 1,833,397 23.57 Indiana
6 6,236 674,328 9.25
Kentucky 7 88 313,791 0.28
Michigan 19,062 1,363,489 13.98 Minnesota 3,217 650,602 4.94 Ohio 20,030 1,413,267 14.17 Wisconsin 6,007 677,543 8.87
Region 5 Arkansas 6,073 347,456 17.48 Iowa 1,257 378,283 3.32 Kansas 2,741 366,466 7.48 Missouri 10,239 776,669 13.18 Nebraska
8 274 120,200 2.28
North Dakota Not Required Oklahoma 3,991 465,697 8.57 South Dakota Not Required
Region 6 Arizona 2,886 744,355 3.88 Colorado 1,913 572,543 3.34 Montana
9 11 10,917 1.01
Nevada 2,851 252,212 11.30 New Mexico 430 269,995 1.59 Texas
10 46,590 3,366,219 13.84
Utah Not Required Wyoming 44 60,127 0.73
Region 7 Alaska Not Required California 45,766 5,556,877 8.24 Hawaii
11 459 145,976 3.14
Idaho Not Required Oregon
12 921 271,220 3.40
Washington 13
3,315 777,024 4.27
Totals 570,753 36,853,599 15.49 1Select population screening only
21997, 1998 data unavailable
31992 data unavailable
4Testing began in 9/1992
51997-2000 data unavailable
61991-1992 data unavailable
71991-1994 data unavailable
8Testing began 11/1996
92000 data only.
10May include some repeats due to second screen.
11Testing began 1993
12Testing began 2/1995
13Testing began 5/1991

23
Figure 8. Apparent Incidence: Sickle Trait, 1991-2000
Apparent National Incidence: 15.49

24
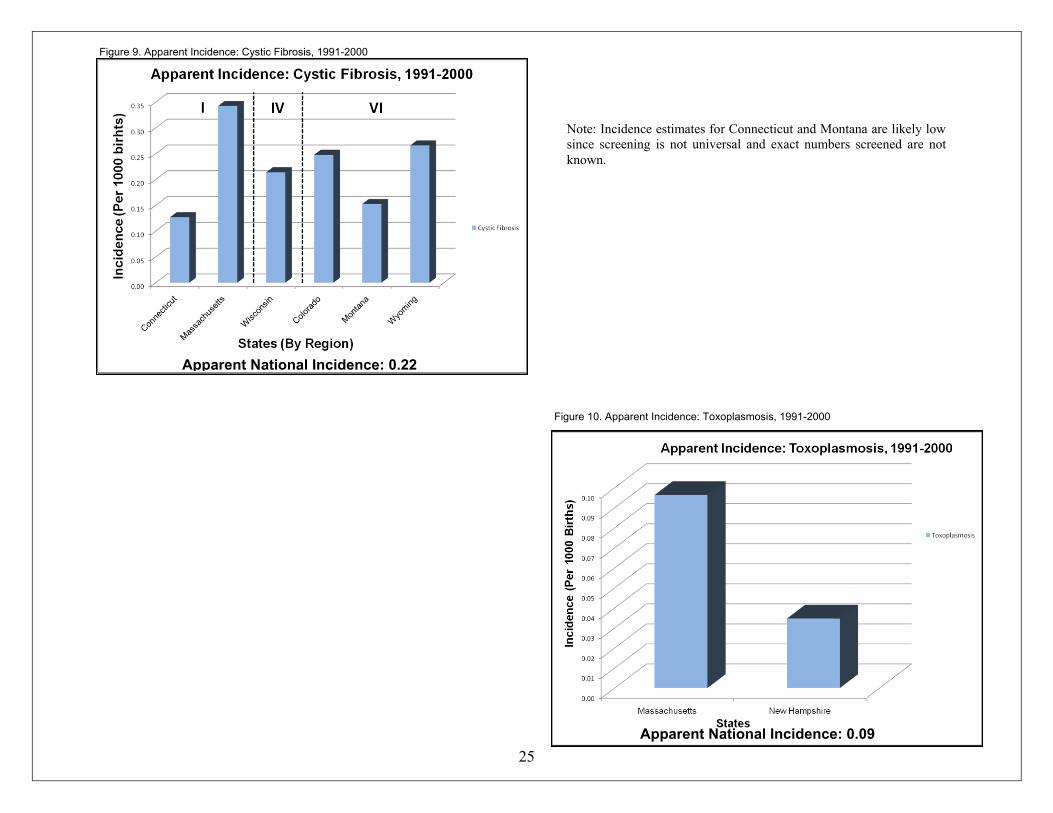
Cystic Fibrosis
CF results from an altered synthesis of a protein
involved in the transport of chloride ions. The major clinical
consequences are the production of abnormally thickened
mucous secretions in the lungs and digestive systems of
affected newborns. With early detection and lifelong
comprehensive treatment plans, infants diagnosed with CF can
be expected to live longer and in a better state of health than in
the past.
Congenital Toxoplasmosis
Congenital toxoplasmosis is caused by infection of the
fetus with the protozoan parasite Toxoplasma gondii, typically
by active infection of the mother during pregnancy. The
mothers can become infected by eating raw or undercooked
contaminated meat or by accidentally ingesting cat oocysts in
feces or in contaminated soil or unwashed vegetables. Signs of
congenital infection may be present at birth or develop over the
first few months of life. Newborns may show signs of central
nervous system disorders, enlargement of the liver and spleen,
blindness, and mental retardation. Early diagnosis and drug
therapy will greatly reduce the risk of serious complications.
Table 9. Cystic Fibrosis cases and apparent incidence by state
Region States Cases Births Incidence
Region 1 Connecticut 1 45 354,449 0.13
Massachusetts 2 54 157,654 0.34
Region 4 Wisconsin 3
100 467,378 0.21
Region 6 Colorado 142 572,543 0.25 Montana
4 15 98,361 0.15
Wyoming 16 60,127 0.27
Totals 372 1,710,512 0.22 1 Testing offered to select populations since 1993; incidence calculations may not be completely valid 2 Testing began in 1999.
3 Testing began in 1994.
4 Selected testing began in 1992.
Table 10. Congenital toxoplasmosis cases and apparent incidence by state
Region States Cases Births Incidence
Region 1 Massachusetts 81 840,895 0.10 New Hampshire 5 144,239 0.03
Totals Totals 86 985,134 0.09
25
Note: Incidence estimates for Connecticut and Montana are likely low
since screening is not universal and exact numbers screened are not
known.
Apparent National Incidence: 0.22 Apparent National Incidence: 0.09
Apparent National Incidence: 0.22
Figure 9. Apparent Incidence: Cystic Fibrosis, 1991-2000
Figure 10. Apparent Incidence: Toxoplasmosis, 1991-2000
Figure 9. Apparent Incidence: Cystic Fibrosis, 1991-2000