10-randomization-test - charlotte wickhamstat511.cwick.co.nz/lectures/10-randomization-test.pdf ·...
TRANSCRIPT

Stat 411/511
Charlotte Wickham stat511.cwick.co.nz
THE RANDOMIZATION TESTOct 16 2015
TodayReview randomization modelConduct randomization testWhat about CIs?Using a t-distribution as an approximation to the randomization distribution.

Display 1.1 p. 2
Creativity scores in two motivation groups, and their summary statistics
5.05.46.110.911.812.012.314.815.016.817.217.2
17.417.518.518.718.719.219.520.721.222.124.0
12.012.012.913.616.617.217.518.219.119.319.820.3
20.520.621.321.622.122.222.623.124.024.326.729.7
ExtrinsicIntrinsic
Motivation Group
Sample Size:Average:
Sample Standard Deviation:
2419.884.44
2315.745.25
Assigned randomly by researcher
Does intrinsic motivation improve creativity?
= 4.1-
The intrinsic group has an average creativity score 4.1 points higher than the extrinsic
group
Read: 1.1.1 in Sleuth

Display 1.2 p. 3Questionnaires given creative writers, to rank intrinsic and extrinsic reasons for writing
INSTRUCTIONS: Please rank the following list of reasons for writing, in order ofpersonal importance to you (1 = highest, 7 = lowest).
You get a lot of pleasure out of reading something good that you have written.You enjoy the opportunity for self-expression.You achieve new insights through your writing.You derive satisfaction from expressing yourself clearly and eloquently.You feel relaxed when writing.You like to play with words.You enjoy becoming involved with ideas, characters, events, and images in your writing.
You realize that, with the introduction of dozens of magazines every year, the marketfor free-lance writing is constantly expanding.
You want your writing teachers to be favorably impressed with your writing talent.You have heard of cases where one bestselling novel or collection of poems has made
the author financially secure.You enjoy public recognition of your work.You know that many of the best jobs available require good writing skills.You know that writing ability is one of the major criteria for acceptance into graduate
school.Your teachers and parents have encouraged you to go into writing.
INSTRUCTIONS: Please rank the following list of reasons for writing, in order ofpersonal importance to you (1 = highest, 7 = lowest).
List of extrinsicreasons for writing
List of intrinsicreasons for writing

The randomized experiment modelKey idea: there is no population, and no sampling!
Some experimental units
Doesn’t matter where they came from.
get treatment 1
get treatment 2
assigned at random
observed responsesfor units assigned to
treatment 1
observed responsesfor units assigned to
treatment 2
Chance only enters through the random assignment of units to treatments

Set up the null hypothesis(and alternative hypothesis)1.
Calculate the test statistic2.Evaluate the evidence against the null hypothesis by comparing the test statistic to test statistics expected under the null hypothesis, the null distribution.
The evidence is summarized by a p-value, the probability we would see such an extreme test-statistic if the null hypothesis is true.
3
If the p is low, the null must go!4.Reject or fail to reject the null hypothesis
Remember: Statistical testing
To do a test all we really need to know is the null distribution. I.e. the randomization distribution if the null was true.

Randomization DistributionThe randomization distribution is the histogram of all values for the statistic from all possible ways the experimental units could have been randomly assigned to groups.
In the sampling model, the reason there is variability in a sample statistic is because we induced variability by taking a random sample. We describe the variability using the sampling distribution of the statistic.In the randomized experiment model, the only reason we see variability in group statistics is because we induced variability by randomly assigning people to groups. We describe the variability using the randomization distribution of the statistic.
In randomized experiments it’s the relationship between the randomization distribution and the effect of the treatment that allow us to make inferences.

subject 1subject 2
...

An approximation to the distribution we would expect
from chance alone
null distribution
The value from the data
1335/500000 are as large or larger
than 4.14
1302/500000 are as small or smaller
than -4.14
two-sided p-value = (1302 + 1335)/500000 = 0.005274
500,000 test-statistics, from 500,000 random regroupings

A statistical summary
There is strong evidence that the effect of the intrinsic questionnaire is not the same as the extrinsic questionnaire in this set of subjects (randomization test, p-value = 0.005).
no population inference

ProcedureWe pick a test-statistic and calculate the observed value.To get a p-value we compare our observed test-statistic to the randomization distribution of test-statistics obtained by assuming the null is true.The p-value will be the proportion of test-statistics in the randomization distribution that are as or more extreme than the observed test-statistic.
Explain the steps in a randomization test for testing for a treatment effect in a controlled experiment.
Randomization test
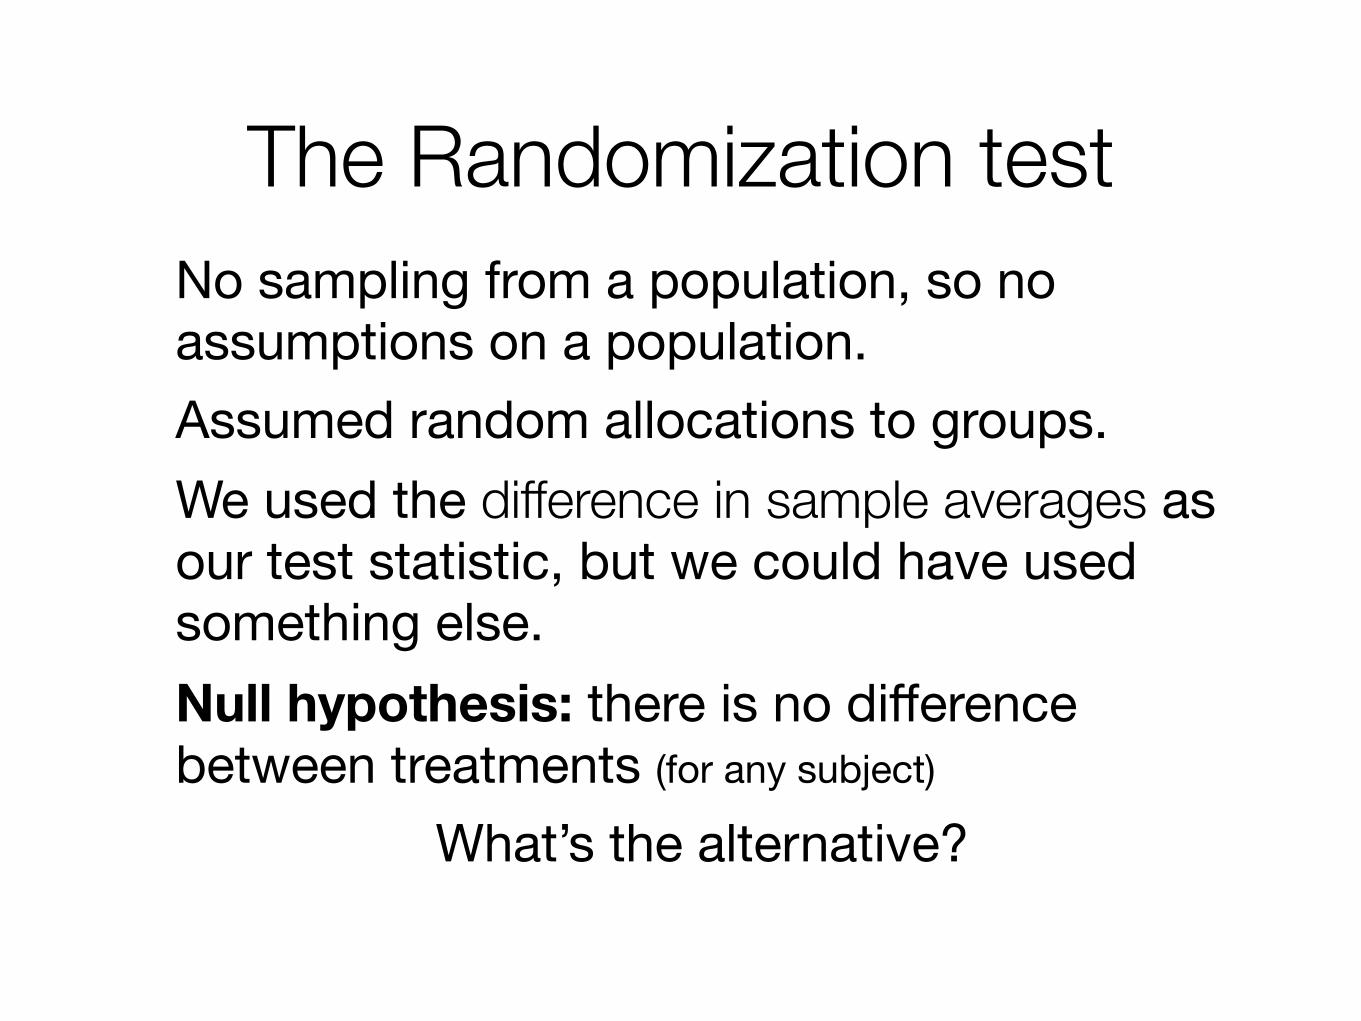
The Randomization testNo sampling from a population, so no assumptions on a population.Assumed random allocations to groups.We used the difference in sample averages as our test statistic, but we could have used something else.Null hypothesis: there is no difference between treatments (for any subject)
What’s the alternative?

Alternative hypothesis: there is some difference between treatments for at least one subject.
Some ways the alternative could be true:one treatment induces a fixed additive change in response, δ, for all subjects (a.k.a the additive treatment model)one treatment induces a larger mean response across subjectsone treatment induces a larger variance in response across subjectsone treatment induces more skewness in response across subjects
We might tailor our test statistic to the type of deviation from the null we expect to see,but different test statistics don’t change the alternative hypothesis

Confidence IntervalsThere are no parameters of interest so, there are no confidence intervals of interest.We could assume a particular type of alternative that is parameterized. Then we could make confidence intervals on that parameter.(e.g. additive treatment model).
this is what the Sleuth doesSection 2.4.1

The additive treatment modelThe additive treatment model, says:A subject’s response on treatment 2 is their response on treatment 1 plus
some fixed number, δ, that is the same for everyone.
In math, consider subject iYi1 = Observed value of subject i under treatment 1Yi2 = Observed value of subject i under treatment 2Yi2 = Yi1 + δ for all i
If we have random allocation to groups and we are willing to assume the additive treatment model, then our hypotheses in the randomization test become:Null hypothesis: the treatment effect is zero, δ = 0Alternative hypothesis: the treatment effect is not zero, δ ≠ 0
unknown parameter

Let’s assume the additive treatment model.
Creativity score given Intrinsic Questionnaire =
Creativity score given Extrinsic Questionnaire + δ
Let’s also use the t-statistic, instead of the
difference in sample averages, as our test statistic.Y 1 � Y 2
SEY 1�Y 2
Creativity case study

subject 1subject 2
... Extrinsic Intrinsic
sample avg 15.74 19.88 sample sd 5.25 4.44 sample n 23 24
Actual grouping
two sample t-stat = 2.92
1 2 sample avg 18.87 16.80 sample sd 5.46 4.88 sample n 24 23
Another grouping
two sample t-stat = 1.37
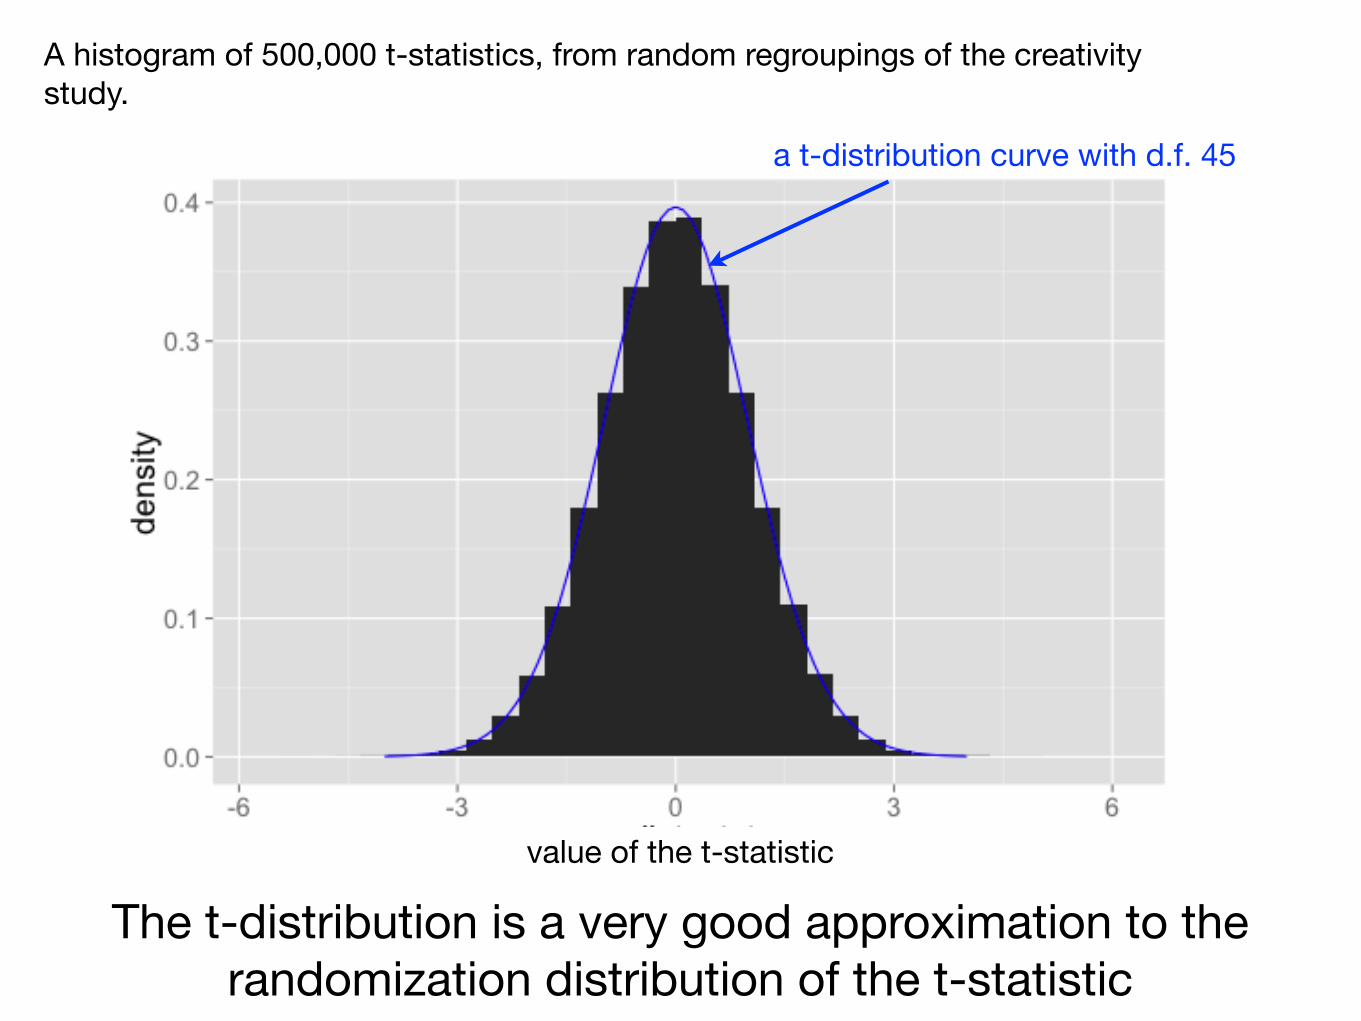
A histogram of 500,000 t-statistics, from random regroupings of the creativity study.
value of the t-statistic
a t-distribution curve with d.f. 45
The t-distribution is a very good approximation to the randomization distribution of the t-statistic

The result from a two sample t-test is approximately the same as a randomization test, when:
you assume the additive treatment model the observed responses aren’t too non-Normal
This is pretty amazing! The two sample t-test arose from a completely different model,
random sampling from populations.
In a randomized experiment,

This means we have increased the number of situations we can do a t-test. We can do a two sample t-test when we have samples from Normal populations,and when we have a randomized experiment of two treatments, with data that isn’t too non-Normal.
The scope of inference (population or causal) is still completely restricted by the study design.
more on too non-Normal later...

> t.test(Score ~ Treatment, data = case0101, var.equal = TRUE)
Two Sample t-test
data: Score by Treatment t = -2.9259, df = 45, p-value = 0.005366 alternative hypothesis: true difference in means is not equal to 0 95 percent confidence interval: -6.996973 -1.291432 sample estimates: mean in group Extrinsic mean in group Intrinsic 15.73913 19.88333

A statistical summary
There is strong evidence that the effect of the intrinsic questionnaire is not the same as the extrinsic questionnaire in this set of subjects (two sample t-test, p-value = 0.005).We estimate the effect of the intrinsic questionnaire is to add 4.14 points to the creativity score compared to the extrinsic questionnaire.With 95% confidence, the effect of the intrinsic questionnaire is to add between 1.29 and 7.00 points to the creativity score compared to the extrinsic questionnaire.
based on the t-test
note the language of an additive treatment model
Creativity case study
“the effect … is to add …”