· pdf fileon 10 october 2007 since 11 july 2007 and was at 10.75% on 11 october 2006. the...
TRANSCRIPT

Jaka
rta
Tre
nds
PT PricewaterhouseCoopers FAS
In cooperation with
PT Penilai Wahana CarakaPT Paragon Property
3rd Quarter 2007
TRENDS SUMMARYOffice: Demand for office space in South Jakarta, such as on Jl.
Simatupang and in neighboring areas, continues to increasefrom companies that do not require a CBD location.
Retail: In spite of generally high lease occupancies, landlords arestill pegging US$ rents at lower IDR rates. This is a practiceinitiated almost ten years ago during the monetary crisis toaccommodate retailers.
Apartment: Since the monetary crisis until now, occupancies of both forlease and strata units continue to remain below industrystandard levels.
Hotel: Hotel occupancies, room rates and RevPAR continue toimprove. This trend, coupled with slowing new supply, bodeswell for an eventual recovery to pre-crisis performancelevels.
economic overview
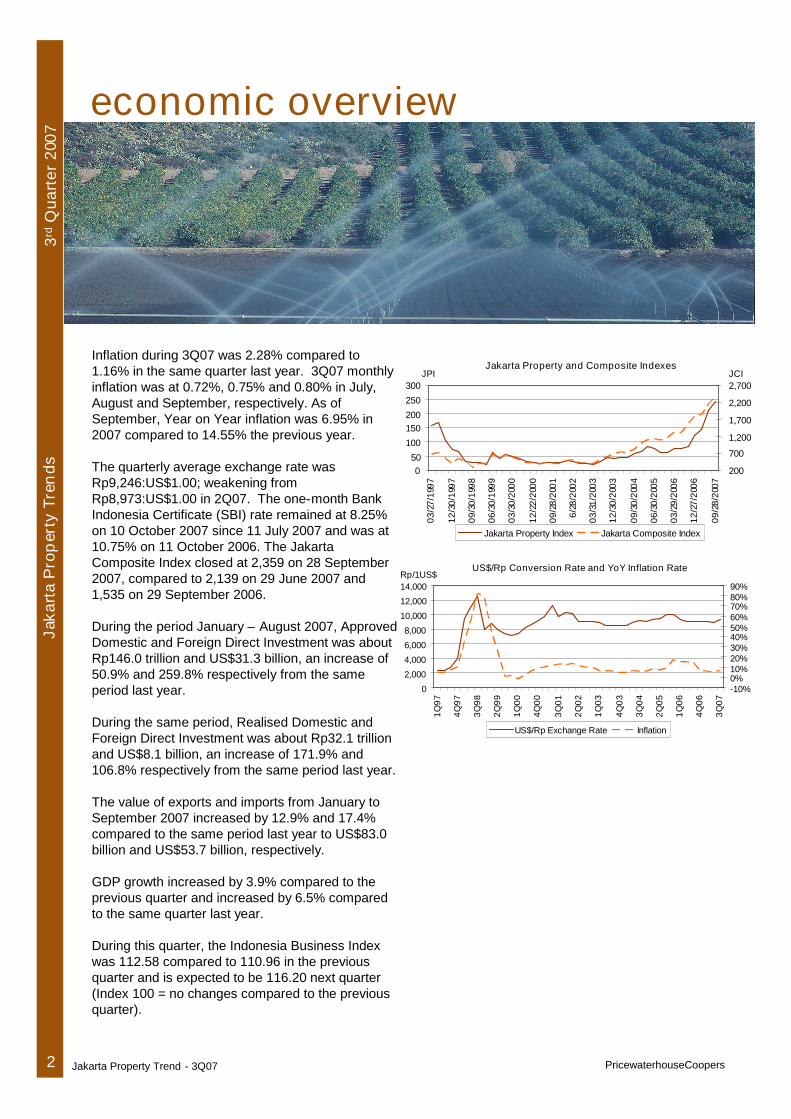
Inflation during 3Q07 was 2.28% compared to1.16% in the same quarter last year. 3Q07 monthlyinflation was at 0.72%, 0.75% and 0.80% in July,August and September, respectively. As ofSeptember, Year on Year inflation was 6.95% in2007 compared to 14.55% the previous year.
The quarterly average exchange rate wasRp9,246:US$1.00; weakening fromRp8,973:US$1.00 in 2Q07. The one-month BankIndonesia Certificate (SBI) rate remained at 8.25%on 10 October 2007 since 11 July 2007 and was at10.75% on 11 October 2006. The JakartaComposite Index closed at 2,359 on 28 September2007, compared to 2,139 on 29 June 2007 and1,535 on 29 September 2006.
During the period January – August 2007, ApprovedDomestic and Foreign Direct Investment was aboutRp146.0 trillion and US$31.3 billion, an increase of50.9% and 259.8% respectively from the sameperiod last year.
During the same period, Realised Domestic andForeign Direct Investment was about Rp32.1 trillionand US$8.1 billion, an increase of 171.9% and106.8% respectively from the same period last year.
The value of exports and imports from January toSeptember 2007 increased by 12.9% and 17.4%compared to the same period last year to US$83.0billion and US$53.7 billion, respectively.
GDP growth increased by 3.9% compared to theprevious quarter and increased by 6.5% comparedto the same quarter last year.
During this quarter, the Indonesia Business Indexwas 112.58 compared to 110.96 in the previousquarter and is expected to be 116.20 next quarter(Index 100 = no changes compared to the previousquarter).
3rd
Qua
rter
2007
Jaka
rta
Pro
per
tyTr
ends
2 Jakarta Property Trend - 3Q07 PricewaterhouseCoopers
Jakarta Property and Composite Indexes
050
100
150200
250
300
03/2
7/19
97
12/3
0/19
97
09/3
0/19
98
06/3
0/19
99
03/3
0/20
00
12/2
2/20
00
09/2
8/20
01
6/28
/200
2
03/3
1/20
03
12/3
0/20
03
09/3
0/20
04
06/3
0/20
05
03/2
9/20
06
12/2
7/20
06
09/2
8/20
07
JPI
200
700
1,200
1,700
2,200
2,700JCI
Jakarta Property Index Jakarta Composite Index
US$/Rp Conversion Rate and YoY Inflation Rate
0
2,000
4,000
6,000
8,000
10,000
12,000
14,000
1Q97
4Q97
3Q98
2Q99
1Q00
4Q00
3Q01
2Q02
1Q03
4Q03
3Q04
2Q05
1Q06
4Q06
3Q07
Rp/1US$
-10%0%10%20%30%40%50%60%70%80%90%
US$/Rp Exchange Rate Inflation

SupplyThere was a new supply of about 49,500 m2
from the completion of Senayan City Office andWisma 76 (converted from Wisma Calindraapartment) in the secondary area during 3Q07.Office stock increased to approximately 4.64million m2.
Buildings currently under construction in theCBD include: Sentral Senayan II, Menara Satrio,Grand Indonesia, Pacific Place and The East.
Demand / OccupancyOverall, occupancy of office buildings in Jakartaincreased during this quarter to 85.9%.Occupancy rates increased to 86.2% in the CBDand 85.3% in the secondary area. Total vacantspace decreased to approximately 646,000 m2.
Secondary area Grade A transacted gross rentsranged from US$15.00 – US$17.00; Grade Bfrom Rp75,000–Rp100,000/m2/mth and Grade Cfrom Rp65,000–Rp70,000.
Service charges (within gross rents) for the CBDranged from Rp30,000–Rp70,000/m2/mth and, forsecondary areas, Rp25,000–Rp60,000. Thebroad ranges are due, in part, to theinclusion/exclusion of tenant electricity charges.
3
TrendsDemand for office space in South Jakarta, suchas on Jl. Simatupang and in neighboring areas,continues to increase from companies that donot require a CBD location. Rents and demandcontinue to increase, but not yet to the pre-crisislevels of 1996.
office
3rdQ
uart
er20
07Ja
kart
aP
rop
erty
Tren
ds
Occupancy rates for the various office grades inthe CBD were 84.0%, 86.1%, 87.4% and 85.4%for Grades A+, A, B and C, respectively. In thesecondary area, occupancy was 86.3% and79.9% in Grades B and C.
RentsMost CBD Grade A+ transacted gross rentsgenerally remained in the range of US$17.00 -US$19.00/m2/mth. For other grades, mosttransactions were still in Rupiah: Grade ARp130,000–Rp145,000/m2/mth; Grade BRp100,000–Rp125,000; and Grade C Rp80,000–Rp95,000.
Jakarta Property Trend - 3Q07PricewaterhouseCoopers
Leased Office Occupancy RatesCBD & Secondary Area 4Q97 - 3Q07
50%
60%
70%
80%
90%
100%
4Q97
3Q98
2Q99
1Q00
4Q00
3Q01
2Q02
1Q03
4Q03
3Q04
2Q05
1Q06
4Q06
3Q07
Occ
upan
cyR
ate
(%)
CBD A+ CBD A CBD B CBD C Sec B Sec C
Leased Office Gross Offering RentsCBD & Secondary Area 4Q97 - 3Q07
0
5
10
15
20
25
4Q97
3Q98
2Q99
1Q00
4Q00
3Q01
2Q02
1Q03
4Q03
3Q04
2Q05
1Q06
4Q06
3Q07
Ren
t(U
S$/
m2 /m
th)
CBD A+ CBD A CBD B CBD C Sec B Sec C

SupplyThere was a new supply of about 6,000 m2 fromthe operation of Pusat Grosir Cililitan 2 (strata)during 3Q07. Total Jakarta leased stockremained at approximately 1.53 million m2 andstrata title stock increased to 1.20 million m2,respectively. Bodetabek leased stock increasedto approximately 510,000 m2 and strata titlestock remained at 371,000 m2.
Subject to timely completion, new supply up to2009 is estimated at about 1.1 million m2. Apartial list of future supply includes: Mall ofIndonesia, Kemang Village, Kota Casablanca,Grand Indonesia and Pacific Place.
Demand / OccupancyJabodetabek for leased shopping centreoccupancy rates increased to 92.3% in thisquarter. Jakarta occupancy increased to 92.2%and Bodetabek increased to 92.9%.
Occupancies were 96.0%, 91.1%, 87.1% and91.9% for Grades A+/A, B, C and D respectivelyin Jakarta.
Offering effective rents for typical floorsdecreased to US$40.60/m²/mth in Jakarta andUS$19.40/m²/mth in the Bodetabek area. The3Q07 fixed exchange rates generally rangedbetween Rp9,000 (Grade A+) and Rp5,000(Grade C) across Jabodetabek. Offeringcontract service charges remained at the rangeof US$7.00 to US$14.50/m2/mth forJadebotabek. Strata title kiosk units and longlease prices generally range from Rp30million/m2 to Rp250 million/m2.
4
Jaka
rta
Prop
erty
Tren
ds
RentOverall, offering effective rents decreased, butfixed exchange rates increased in Jakarta andBodetabek compared to the previous quarter.
retail3rd
Qua
rter
2007
Jakarta Property Trend - 3Q07 PricewaterhouseCoopers
TrendsIn spite of generally high lease occupancies,landlords are still pegging US$ rents at lowerIDR rates. This is a practice initiated almost tenyears ago during the monetary crisis toaccommodate retailers.
The apparent endless new supply of retail space,especially kiosks, continues to threaten the midto long term outlook of the retail sector.
For Lease Shopping Centre Occupancy Rates4Q97 - 3Q07
70%
75%
80%
85%
90%
95%
100%
4Q
97
3Q
98
2Q
99
1Q
00
4Q
00
3Q
01
2Q
02
1Q
03
4Q
03
3Q
04
2Q
05
1Q
06
4Q
06
3Q
07
Occ
upa
ncy
Rat
e
Grade A+ Grade A Grade B Grade C
For Lease Shopping Centre US$ Offering Effective'Typical Floor' Rent (excludes Ground Floor and Anchor Tenants)
4Q97 - 3Q07
0102030405060708090
4Q
97
3Q
98
2Q
99
1Q
00
4Q
00
3Q
01
2Q
02
1Q
03
4Q
03
3Q
04
2Q
05
1Q
06
4Q
06
3Q
07
Re
nts
(US
$/m
2 /mth
)
Grade A+ Grade A Grade B Grade C

SupplyThere was a new supply of approximately 2,250strata title units from the operation of The 18th
Residence Taman Rasuna South Tower andSenayan City in the CBD, and City ResortResidences, Serpong Town Square and TelukIntan Tower Topaz in the secondary area.
The total stock of apartments increased to about15,100 units in the CBD and 38,220 units in thesecondary area. Leased (non strata title) andserviced apartments account for about 5,640units (48% CBD and 52% secondary) and stratatitle approximately 47,680 units (26% CBD and74% secondary).
New supply up to 2009 is estimated at about40,000 units. A partial list of future supplyincludes: Shangri-la Residences, HollywoodResidences, Oakwook Premier and KemangVillage Condominium.
Occupancy / Sold RateOverall occupancy of leased/servicedapartments of all grades increased in the CBDand secondary areas by 1.9% and 1.5%,respectively.
The average leased/serviced apartmentoccupancy was about 77.3% in the CBD and73.9% in secondary areas. In the strata market,84.7% of the CBD supply (current stock andprojects under construction/launched) and88.6% in secondary areas was stated bydevelopers as sold. The occupancy rate of thecurrent stock was 66% and 70%, respectively.
5
3rdQ
uart
er20
07Ja
kart
aP
rope
rty
Tren
ds
apartment
Average 3Q07 transaction base rents for CBDUpper and Middle Grade leased apartmentswere US$13.30 and US$8.00 respectively andfor serviced apartments were US$15.70 andUS$9.20 respectively. Average service chargeswere around US$3.20 and US$1.60 for leasedapartments and US$4.70 and US$3.80 forserviced apartments. Average transactionprices for strata title apartments wereUS$1,840/m2 for Upper and effectivelyUS$1,020/m2 for Middle Grade apartments.
Rent / PricesOn average, rents for leased/servicedapartments remained the same in the CBD anddecreased in the secondary areas compared tothe previous quarter. Strata apartment offeringprices decreased in the CBD and in thesecondary areas each by 1.0%.
Jakarta Property Trend - 3Q07PricewaterhouseCoopers
CBD Average Base Rents2Q97 to 3Q07
0
10
20
30
2Q97
3Q98
2Q99
1Q00
4Q00
3Q01
2Q02
1Q03
4Q03
3Q04
2Q05
1Q06
4Q06
3Q07
US$
/m2/m
th
Serviced Lease
CBD Average Occupancy & Sold Rates2Q97 to 3Q07
50%
60%
70%
80%
90%
100%
2Q
97
3Q
98
2Q
99
1Q
00
4Q
00
3Q
01
2Q
02
1Q
03
4Q
03
3Q
04
2Q
05
1Q
06
4Q
06
3Q
07O
cc
up
an
cy
/So
ldR
ate
Serviced Lease Strata

6
3rdQ
uart
er20
07Ja
kart
aP
rope
rty
Tren
ds
apartment
TrendsSince the monetary crisis until now, occupanciesof both for lease and strata units continue toremain below industry standard levels.
The amount of new strata title supply completedduring the next few years will test the depth ofthe investor market.
Jakarta Property Trend - 3Q07 PricewaterhouseCoopers

hotel
SupplyThere was no new supply during 3Q07. Jakartahotel supply remained at 22,188 rooms,consisting of 8,910 5-star, 8,009 4-star and 5,2693-star rooms.
New hotels under development include: RitzCarlton Pacific Place and Hotel Indonesia -Kempinski.
Bodetabek hotel supply remained atapproximately 1,030 rooms, consisting of 3705-star, 490 4-star and 170 3-star rooms. Overall,Jadebotabek hotel supply was 23,327 rooms.
Demand / OccupancyOverall, occupancy increased by 3.0% to 68.2%from the previous quarter. The changes were1.9%, 5.0% and 1.6% for 5-star, 4-star and 3-star hotels. The occupancies were 60.1%,74.4% and 76.4%, respectively.
Compared to the same quarter last year, thechanges were 4.8%, 8.2% and -2.4% for 5-star,4-star and 3-star hotels, respectively. Overallsame quarter year on year occupancy increasedby 5.2%.
Room RatesThe overall rate decreased from the previousquarter by 2.3% to US$54.80 per night. Thechanges were -3.3%, -0.7% and -1.5% for 5-star, 4-star and 3-star hotels. US$ room rateswere US$73.50, US$45.20 and US$34.40 pernight, respectively.
Compared to the same quarter last year, roomrates changed by 4.1% for 5-star, 7.0% for 4-star and 9.7% for 3-star hotels. Overall, roomrates increased by 5.6%.
7
Jaka
rta
Pro
per
tyTr
ends
3rdQ
uart
er20
07Revenue Per Available RoomOverall RevPAR this quarter was US$37.40 pernight or about 2.3% higher than the previousquarter. Compared to the previous quarter,all-star hotel categories RevPAR increased,except 5-star hotels. The changes were 0.0%,6.4% and 0.6% for 5-star, 4-star and 3-starhotels. RevPAR was US$44.20, US$33.70 andUS$26.30 per night, respectively.
Compared to the same quarter last year,RevPAR changed by 13.1%, 19.6% and 6.3%for each star-category and 14.1% overall.
PricewaterhouseCoopers Jakarta Property Trend - 3Q07
Jabodetabek Hotel Occupancy Rates4Q97 to 3Q07
20%
30%
40%
50%
60%
70%
80%
4Q97
3Q98
2Q99
1Q00
4Q00
3Q01
2Q02
1Q03
4Q03
3Q04
2Q05
1Q06
4Q06
3Q07
Occ
upan
cyRa
te
5 Star 4 Star 3 Star Overall
Jabodetabek Hotel Average Room Rates4Q97 to 3Q07
020406080
100120140
4Q97
3Q98
2Q99
1Q00
4Q00
3Q01
2Q02
1Q03
4Q03
3Q04
2Q05
1Q06
4Q06
3Q07
US$/
nigh
t
5 Star 4 Star 3 Star Overall

hotel
8
Jaka
rta
Pro
pert
yTr
ends
3rdQ
uart
er20
07
TrendsHotel occupancies, room rates and RevPARcontinue to improve. This trend, coupled withslowing new supply, bodes well for an eventualrecovery to pre-crisis performance levels.
Jakarta Property Trend - 3Q07 PricewaterhouseCoopers
Jabodetabek Hotel RevPAR1Q99 to 3Q07
0
10
20
30
40
50
1Q99
3Q99
1Q00
3Q00
1Q01
3Q01
1Q02
3Q02
1Q03
3Q03
1Q04
3Q04
1Q05
3Q05
1Q06
3Q06
1Q07
3Q07
US
$/ni
ght
5-star 4-star 3-star Overall

Jakarta Property Trends
Mirza DiranPT PricewaterhouseCoopers FAS
In cooperation with
Willie PrasetioPT Penilai Wahana Caraka
Jay SmithPT Paragon Property
PricewaterhouseCoopersJl. HR. Rasuna Said Kav. X-7 No.6Jakarta 12940Tel: +62(21) 521 2901Fax: +62(21) 521 3926www.pwc.com/id
ABBREVIATIONS
PwC : PricewaterhouseCoopersCBD : Central Business DistrictJadebotabek : includes Jakarta, Depok, Bogor,
Tangerang and BekasiDebotabek : includes Depok, Bogor, Tangerang
and BekasiGDP : Gross Domestic ProductE : estimatedm2 : square metres/m2/mth : per square metre per months-g area : semi-gross areapa : per annum3Q07 : 3rd Quarter 2007
(each quarter abbreviated similarly)s/c : service chargeUS$ : US dollarRp. : Rupiah
DEFINITIONS
GeneralCentral Business : bounded by Jl Sudirman, Jl RasunaDistrict Said and Jl Gatot Subroto (the
‘Golden Triangle’ of Jakarta)Secondary area : area outside the CBDNet area : space occupied solely by tenant (or
available for the tenant’s sole use)Semi-gross area : net area plus proportion of common
spaceRents and service : are stated per m2 according to thecharge relevant basis of lease in each sector
(such as on s-g area for offices, seebelow)
SectorsOfficesGrade A+ : A high quality and well maintained
office building located in CBD area,generally more than 20,000m2
Grade A : A standard quality office building,generally more than 20,000 m2
Grade B : A medium quality office building,generally 6,000 –20,000 m2
Grade C : A low quality office building,generally less than 6,000 m2 andusually more than 20 years old
Retail (Shopping centres)Grade A+ : High specification with quality finishes,
located in prime CBD area, generallymore than 40,000 m2. Mainly upperclass retailers and internationaldepartment stores
Grade A : Modern specification with qualityfinishes located in CBD and secondaryarea, generally more than 40,000m2.Mainly middle to upper class retailersand international department stores
Grade B : Medium specification of generally morethan 20,000 m2. Mainly middle classlocal retailers and department stores
Grade C : Basic to medium quality buildinggenerally less than 20,000m2
Basis of lease : Retail units are let on a net area basis
HotelsStar Categorization: The 5, 4 and 3 categories used in our
survey are in accordance with theGovernment licenses awarded to eachindividual hotel
ApartmentUpper Grade : High specification building with larger
units (3BR>150 m2), and range of sportand leisure activities
Middle Grade : Medium specification building withsmaller units (3BR<150 m2), andstandard sports facilities
Basis of lease : Apartments are let on a net area basisApartment size : Average base rents and service chargesurveyed are derived from rentals of three-bedroom
unitsSold Unit : A unit is considered sold after a
deposit has been paid
This publication is provided as a general overview of market trends. Whilst the information contained is believed accurate at the time of printing, it may be subject to future changewithout notice. PricewaterhouseCoopers and PT Paragon Property accept no liability to any party for reliance on the contents of this publication. This document is the property of PwC
and no part of it may be copied or reproduced without our prior written permission.