1.0 introduction - mass.gov · web viewwhen conducting integrated sampling, pump flow rates should...
TRANSCRIPT

INDOOR AIR SAMPLING AND EVALUATION GUIDE
WSC POLICY #02-430
Office of Research and StandardsDepartment of Environmental Protection
1 Winter StreetBoston, MA 02108
April, 2002

WSC POLICY #02-430
TABLE OF CONTENTSSECTION / TITLE PAGE
LIST OF TABLES vi
LIST OF FIGURES vi
CONTRIBUTORS, WORKGROUP PARTICIPANTS AND OTHER REVIEWERS vii
GUIDANCE DOCUMENT SUMMARY AND SCOPE ix
INDOOR AIR SAMPLING STUDY CHECKLIST xii
1.0 INTRODUCTION 1
1.1 Overview 1
1.2 Relationship to the Bureau of Waste Site Cleanup (BWSC) Site Risk Characterization Program 1
1.2.1 Risk Characterization Under the MCP 21.2.2 MCP Notification and Remedial Action Requirements 4
1.2.2.1 Substantial Release Migration 41.2.2.2 Critical Exposure Pathways 4
1.2.3 Emergency Response Evaluations 61.2.4 Petroleum Hydrocarbons 7
1.3 Scope of the Indoor Air Sampling and Evaluation Guidance 71.3.1 Evaluation of Indoor Air at Industrial Sites 9
2.0 PLANNING THE STUDY 10
2.1 Defining Objectives 11
2.2 The Role of Screening In Planning Extent of Indoor Air Sampling 12
2.3 Identifying Contaminants of Concern 13
2.4 Considering Sampling Duration and Frequency 14
2.5 Considering Detection Limits 16
2.6 When Should Indoor Air Sampling Be Conducted? 18
3.0 GENERAL AIR MONITORING TECHNIQUES 18
i

WSC POLICY #02-430
3.1 Analytical (Screening) Methods 203.1.1 Direct-Measuring Methods for VOCs 203.1.2 Field Analytical Methods for VOCs 21
3.2 Collection Methods 213.2.1 Active VOC Sampling With Adsorbent Filled Traps 25
3.2.1.1 Collection Sorbents 263.2.2 Sampling VOCs Using Evacuated Canisters 263.2.3 Use and Handling of Tedlar Bag Samples 273.2.4 Passive Sampling for Longer Term Durations 28
3.3 Available Formal Air Monitoring Methodologies 28
4.0 SOURCES OF INDOOR AIR CONTAMINATION 33
4.1 Pre-Sampling Investigation 33
4.2 Factors Influencing Contaminant Concentrations in Indoor Air 33
5.0 SAMPLING STUDY 38
5.1 Sampling Conditions 395.1.1 “Worst-Case” Versus “Actual” Conditions 395.1.2 Sampling Conditions that Are Indirectly Controllable 405.1.3 Controllable Sampling Conditions 41
5.2 Sampling Duration 44
5.3 Sampling Frequency 475.3.1 Confirmatory Sampling or Re-sampling 49
5.4 Spatial Considerations 51
5.5 Determining Sampling Locations and Number of Samples 52
5.6 Oversampling Strategy Using Passive Samplers 52
5.7 Sampling Other Media 535.7.1 Groundwater Sampling 545.7.2 Soil Gas Sampling 555.7.3 Ambient Air Sampling 57
5.8 Sample Categories and Nomenclature 60
5.9 Background 61
6.0 ANALYTICAL METHODS FOR DETECTING AIR TOXICS 63
ii

WSC POLICY #02-430
6.1 Basic Chromatography 63
6.2 Detectors used with Chromatographs 646.2.1 Ultraviolet and Infrared Detectors 656.2.2 Flame Ionization Detector 666.2.3 Photoionization Detector 676.2.4 Electron capture detector 676.2.5 Nitrogen-Phosphorous Detector 676.2.6 Mass Spectrometry 67
7.0 QUALITY ASSURANCE/QUALITY CONTROL 70
7.1 Data Quality Objectives and Data Quality Indicators 70
7.2 Sampling and Analytical Quality Assurance 73
7.3 Sampling Quality Control 74
7.4 Analytical Quality Control 76
7.5 Sampling and Analysis Quality Control Acceptability Criteria 78
8.0 DATA EVALUATION PROCEDURES 82
8.1 Overall Approach 82
8.2 Indoor Air Evaluation and Response Under the MCP 82
8.3 Conversion of Units 79
8.4 Data Quality Evaluation 79
8.5 Data Representativeness 82
8.6 Determination of Possible Data Trends 82
8.7 Comparison of Data With Chemical Background Concentration Distributions 83
9.0 HEALTH RISK ASSESSMENT UNDER THE MCP 84
9.1 Comparison of Data with Applicable MCP Guidance 85
9.2 Occupational Health Standards 86
9.3 Inhalation Risk Assessment Methodology as per the MCP 879.3.1 Hazard Identification 879.3.2 Dose-response Assessment 88
iii

WSC POLICY #02-430
9.3.2.1 Types of Dose-Response Values 899.3.2.1.1 Threshold 899.3.2.1.2 Non-threshold 89
9.3.2.2 Sources of Toxicity Information 909.3.3 Exposure Assessment 91
9.3.3.1 Calculating a Weighted Average 929.3.3.2 Calculation of Average Daily Exposure for Volatiles 939.3.3.3 Risk Assessment Exposure Durations 949.3.3.4 Recommended Approach for Developing and Evaluating Non-cancer Exposures 95
9.3.4 Risk Characterization 959.3.4.1 Non-cancer risk 96
9.3.4.1.1 Screening Hazard Index 989.3.4.1.2 Health Endpoint-Specific Hazard Index 98
9.3.4.2 Cancer Risk 999.3.5 Uncertainty Analysis 1009.3.6 Method 3 Risk Assessment of Petroleum Hydrocarbons Using the APH Methodology 1019.3.7 Imminent Hazard and Substantial Hazard Evaluations 1019.3.8 Emergency Response Evaluation of BTX using Indoor Air Guidance Levels
102
9.4 Risk Management Criteria 104
REFERENCES 106
GLOSSARY OF MONITORING TERMS 110
APPENDIX 1. SUMMARIES OF EPA TOXIC ORGANIC ANALYTICAL METHODS
APPENDIX 2. INDOOR AIR QUALITY BUILDING SURVEY AND INSTRUCTIONS FOR RESIDENTS OF HOMES TO BE SAMPLED
INSTRUCTIONS FOR RESIDENTS
APPENDIX 3. QUALITY ASSURANCE/QUALITY CONTROL CHECKLIST: INDOOR AIR MONITORING OF VOLATILE ORGANIC COMPOUNDS
iv

WSC POLICY #02-430
APPENDIX 4. RECOMMENDED STANDARD OPERATING PROCEDURE (SOP) FOR THE COLLECTION OF AIR SAMPLES
APPENDIX 5. RECOMMENDED REAL-TIME SOIL GAS SAMPLING Procedures
v

WSC POLICY #02-430
LIST OF TABLESTITLE PAGETable 1. Risk Characterization Benchmarks 3Table 2. Summary of Some General Air Monitoring Techniques 20Table 3. A Partial Listing of Sampling and Analytical Methods Applicable to Indoor Air 30Table 4. Default Exposure Conditions for a Groundwater/Soil Gas Contamination Source 44Table 5. Recommended Sampling Durations 46Table 6. Oversampling Approach 53Table 7. Indoor Air Sampling Approach 58Table 8. Sampling Categories and Nomenclature 60Table 9. Selected List of Quality Control Elements 80Table 10. Steps in the Evaluation of Potential Indoor Air Impacts 85Table 11. Some Interpretations and Recommended Actions for Various Indoor Air Concentration Scenarios 87Table 12. Some Default Risk Assessment Exposure Durations 94
LIST OF FIGURESTITLE
PAGE Figure 1. Indoor Air Study Approach xiFigure 2. Substantial Release Migration and Critical Exposure Pathway 6Figure 3. Photovac®
22Figure 4. Two Types of HNU® Instruments 23Figure 5. Organic Vapor Analyzer
22 Figure 6. Organic Vapor Analyzer
23Figure 7. Portable GC with six interchangeable detectors 23Figure 8. Pumped Sample Collection Method With Adsorbent Media Tubes 32Figure 9. “Summa”® Canisters 32Figure 10. Passive Badge Samplers 32Figure 11. Temperature Gradient 32Figure 12. Rainy Weather 33 Figure 13. Re-Sampling Decision Tree 50Figure 14. Gas Chromatograph with Flame Ionization Detector (FID) 69Figure 15. Gas Chromatograph with Mass Spectrometer (MS) Detector 69Figure 16. Relative Indoor Air Concentration Scenarios for a Groundwater/Soil Gas Contamination Source 86Figure 17. Indoor Air Evaluation and Response Under the MCP 89
vi
WSC POLICY #02-430
CONTRIBUTORS, WORKGROUP PARTICIPANTS AND OTHER REVIEWERS
Contributors:MADEP/Office of Research and Standards: Michael S. Hutcheson Diane M. Manganaro Nicholas D. Anastas
MADEP/Wall Experiment Station: Thomas McGrath, Air Assessment Branch
MADEP/Regional Offices: John Fitzgerald, BWSC, Northeast Regional Office
Workgroup Participants and Other ReviewersSherry Albert Weston and SampsonLisa Bailey Menzie-Cura and Associates Raphael Cody U.S. EPAEric Dube Gradient CorporationThomas Dumyahn Harvard School of Public HealthMichael Feeney Massachusetts Dept. of Public HealthGary Ginsberg Connecticut Dept. of Environmental ProtectionDebra Hawks MADEP/Bureau of Waste Site CleanupStephen Johnson MADEP/Bureau of Waste Site CleanupJames Kenny MADEP/Bureau of Waste Site CleanupDenise Kmetzo Woodard and CurranJenny Liu Haley and AldrichPaul Locke MADEP/Office of Research and StandardsMarilyn Lourandos HandexSean McGuigan AMEC Earth and EnvironmentalJack Miano MADEP/Bureau of Waste Site CleanupBonnie Potocki Eco-SolutionsRich J. Rago Haley and AldrichElliot I. Steinberg Haley and AldrichRalph Tella Cygnus Group, Inc.Donna Voorhees Menzie-Cura and AssociatesChris Wakefield Contest LabsCatherine Wanat MADEP/Bureau of Waste Site CleanupRobert A Weker Harvard School of Public Health
Notice: Use of trade names and/or representations of products in this document do(es) not constitute endorsement by the Massachusetts Department of Environmental Protection.

WSC POLICY #02-430
GUIDANCE DOCUMENT SUMMARY AND SCOPE
This document provides an overview of the considerations involved in planning and executing an indoor air sampling study and evaluating its results. It is intended as an essential reference for those who are new to the field of indoor air sampling, analysis and data evaluation and as a tool for those interested in or conducting indoor air evaluations under the Massachusetts Contingency Plan (MCP). It is not intended as a “cookbook” methodology. To a large extent, the sampling of indoor air and interpretation of results involves science-based judgment. There is a fair amount of flexibility in the process, allowing for interpretation of results and management decisions to be made using a case-specific practical approach.
The guidance provided in this document is consistent with risk characterization protocols used to evaluate contaminated media under the MCP. Guidance for performing indoor air evaluations for purposes of achieving response actions under the MCP is presented and should be considered relevant guidance under 310 CMR 40.0190, the MCP Response Action Performance Standards (RAPS). The information contained in this document is intended solely for guidance. This guidance document does not create any substantive or procedural rights, enforceable by any party in any administrative proceeding with the Commonwealth.
The advice presented addresses indoor air concentrations representing environmental levels of contamination emitted to the indoor air from contamination introduced from other media. This guidance could also be applicable to indoor air contamination originating from indoor sources although typically, the DEP does not regulate such indoor contamination under the MCP.
There is substantial information available on the measurement and evaluation of indoor air contaminants in the industrial setting. However, these methodologies are not generally sensitive enough to allow for the quantification of environmental levels of contamination of concern. Air levels of contamination measured in the indoor air of residences and schools are generally much lower than the concentrations associated with occupational exposures in industrial settings. The indoor air investigator should consider these differences in sensitivity when making decisions regarding monitoring or choosing a consultant to conduct an air study. It is important to ensure that industrial hygienists or other indoor air consultants contracted to do indoor air site work under the MCP be familiar with accepted sampling and analytical methodologies which have been validated for detecting environmental levels of exposure. These include U.S. Environmental Protection Agency (EPA) sampling and analytical methodologies as well as the Massachusetts Department of Environmental Protection (MADEP) Air-Phase Petroleum Hydrocarbon (APH) methodology.
The design of an indoor air-sampling plan will vary with the objectives of the study. This guidance presents a number of components that should be addressed in the planning stages of the study in order for the study objectives to be met. These components include developing a list of target compounds and parameters to be analyzed, determining the required sampling duration, choosing a sampling and analytical method and detection capability consistent with the study objectives, establishing representative sampling conditions, and ensuring that adequate quality assurance and quality control practices are in place throughout the sampling and
viii

WSC POLICY #02-430
analytical process. Figure 1 below provides a schematic of an overall decision-making process that can be used to assist in designing and conducting an indoor air study. The Air Sampling Study Checklist that follows cross-references the figure and summarizes some of the key considerations and/or options associated with the designated topic for each box. Each of these topics is discussed in more detail in subsequent sections of this document.
The interpretation and evaluation of the analytical results is addressed in the last part of this document. The risk assessment and risk management methodologies used to conduct risk assessment, consistent with Massachusetts Contingency Plan (MCP) protocols, are described and discussed.
Although this document occasionally focuses its discussion on indoor air evaluation of residences, the concepts, practices and sampling/analytical principles discussed can be applied to any single or multiple-story non-residential buildings where the goal is to evaluate indoor air quality.
For additional, more detailed information and case studies relating to the performance of
an indoor air sampling study, readers may also to consult “Assessing Potential Indoor Air Impacts for Superfund Sites” (EPA, 1992a).
ix

WSC POLICY #02-430
Figure 1. Indoor Air Study Approach
1.) Define Study Objective
3.) Identify Required Sampling Duration& Frequency
5.) Check if Adequate Limit of Detection
4.) Choose Sampling Method
Sec. 2.32.) Identify Chemicals of Concern
Sec. 2.1
Sec. 2.4; 5.2; 5.3
Sec. 2.5; 7.4
Sec. 3.0 – 3.3; Appdx. 1
7.) Do Pre-Sampling Investigation
8.) Establish Appropriate Sampling Conditions and
Conduct Sampling
9.) Analyze Samples
10.) Evaluate Data andCalculate Health Risks
Sec. 4.0 – 4.2; Appdx. 2(a)
Sec. 5.0 – 5.5Appdx. 2(b);Appdx. 4
Sec. 6.0 – 6.2.6; Appdx. 4
Sec. 5.9; Sec. 8.0 – 8.7; Sec. 9.0 – 9.7
6. Define QA/QC Indicators for Sampling/Analysis Sec. 7.0 – 7.5; Appdx. 3
x

WSC POLICY #02-430
INDOOR AIR SAMPLING STUDY CHECKLIST
1.) DEFINE STUDY OBJECTIVE(S). See Sec. 2.1
A.) Screening Study• to determine if indoor air (or associated groundwater and/or soil gas) is contaminated;• to confirm the presence of contaminants;• to trace contaminants to the source;• to compile a preliminary list of contaminants at a site;
B.) Refined Sampling Study• to quantify concentrations of contaminants in indoor air over acute, subchronic and/or chronic periods of time;• to detect concentrations of indoor air contaminants at levels which may be health-relevant;
2.) DEVELOP A LIST OF TARGET COMPOUNDS AND PARAMETERS. See Sec. 2.3
Include: • compounds which have been found in previous indoor air studies of the building;• contaminants found in associated groundwater and/or soil gas;• contaminants which have been identified in any screening studies;
• compounds which are known constituents of the contamination in question (e.g., petroleum);• compounds associated with historical uses of the site• breakdown products of above compounds
3.) DETERMINE WHICH EXPOSURE DURATION(S) NEED TO BE EVALUATED. See Sec. 2.4 and 5.2
• For evaluation of acute exposures/health effects……........................................................................................................grab samples to 1 hour duration
• for evaluation of subchronic, chronic or lifetime exposures/threshold and/or non-threshold health effects………………………........................................................…samples of 2-24 hour duration; possibly supplemented with longer-term (e.g., 3-week
passive) and seasonal
xi

WSC POLICY #02-430
sampling (depending on situation and resources)
4.) CHOOSE SAMPLING METHOD. See Sec. 3.0-3.3; Appendix 1
Screening: • Organic Vapor Analyzer
• Photo-ionization Detector
Refined: • EPA Toxic Organic (TO) Methods • EPA Indoor Air (IP) Methods • MADEP Air-Phase Petroleum Hydrocarbon (APH) Methods
5.) CHECK THAT THE PRACTICAL QUANTITATION LIMIT IS ADEQUATE TO MEET THE OBJECTIVES OF THE STUDY. See Sec. 2.5 and 7.4
• Compare the Practical Quantitation Limits (PQLs) for individual compounds to their available toxicity criteria• Compare the PQLs to literature values representing typical background concentrations of those compounds in indoor air.
6.) DEFINE QUALITY ASSURANCE/QUALITY CONTROL INDICATORS FOR SAMPLING/ANALYSIS. See Sec. 7.0-7.5; Appendix 3
Sampling QA/QC • Maintain chain of custody records for all samples. • Include at least one set of collocated samples in the sampling design. • Include at least one field blank in the study. • with cartridge sampling, include at least one site where series sampling (i.e., the attachment of two or more cartridges in series) is conducted
• an oversampling strategy is recommended for the passive badge samplers, in which three collocated samplers can be placed at each sampling point. Analytical QA/QC
• Include at least one instrument blank and one method blank during analysis. • Include at least one set of duplicate analyses. • with canister sampling, provide documentation of clean canisters by submitting results of chemical analysis of one representative canister in
each batch. • Include analysis of at least one spiked sample. • with passive samplers, an oversampling strategy prescribes taking at least three collocated samplers at each sampling location. Two of the three replicate samples can be analyzed initially and the third can be analyzed if the two initial data points differ by more than about 15%.
xii

WSC POLICY #02-430
• Calculate percent recovery data using standard reference material. 7.) CONDUCT PRE-SAMPLING SURVEY. See Sec. 4.0-4.2; Appendix 2(a)
Check for:
Other Indoor Sources • any use of sprays, solvents, pesticides, personal products? • any storage/emissions of paints or other hobby supplies?
• any scented natural products (e.g., Christmas trees, wreaths, potpourri, scented wood, etc.) • any other scented product (e.g., air fresheners, burning candles, etc.) • any gasoline and/or fuel storage tanks? • any tobacco smokers? • any other combustion sources (e.g., wood stoves, etc.)? • any freshly dry-cleaned clothing? • is there a solvent storage area?
• any other pollutant-generating activity occurring in the building?
Building Issues
• any new construction/remodeling/painting? • any new carpeting or other furnishings? • what type of foundation: (slab-on-grade) (crawl space) (basement) • any cracks in the foundation in contact with soil?
If feasible, an effort should be made before sampling is conducted to remove, to the extent possible, all potential contaminant sources from the indoor environment at least 24 hours prior to
sampling.
Material Safety Data Sheets (MSDS) (which must be submitted by industry to the consumer upon request under the Federal Emergency Planning
and Community Right To Know Act (EPCRTKA)) can be consulted for additional information on
emissions from products.
Sampling should not be conducted until new building products have been given time to off-gas
VOCs for a period of at least six months.
xiii

WSC POLICY #02-430
• does the building have an attached garage? • what is the space usage of the basement: (finished) (workshop) (rough)
• is there a forced hot air heating system?
Outdoor Sources • is the building near any outdoor stationary source(s)
(e.g., gas stations, industrial stacks, etc.)? • is the building near any outdoor mobile source(s) (e.g., idling vehicles, highways, airports, etc.) • are there any pollutant-generating activities in the vicinity of the building (e.g., lawnmowing, asphalting, painting, sanding)?
Ventilation • are windows open/closed?
• any mechanical ventilation system operating in the building (e.g., central air conditioning, air-to-air heat exchangers, bathroom ventilation
fan, kitchen range/hood)? • is the building weatherproofed (e.g., storm windows, energy-efficient windows, insulation) or is it drafty? • is there any ventilation between sampling zones (e.g., a closed door between cellar and living quarters or open exchange)?
All pollutant-generating activities should be suspended for a period of at least 24 hours before sampling is
conducted. An effort should also be made to conduct sampling during a period in which outdoor stationary and mobile sources will not be operating or will be
operating at a minimum output.
Steps should be taken to simulate typical season-specific ventilation and heating conditions for the building.
NOTE: A worst-case condition may be presented when the building is sealed by closing windows and doors and (in winter)
when the heating system is operating.
xiv

WSC POLICY #02-430
Meteorology
a.) what is the inside temperature relative to the outside temperature? b.) any recent precipitation changes in the last 12 hours? c.) any recent barometric pressure changes in the last 12 hours? d.) is the wind speed steady and is it greater than about 5 mph?
8.) CONDUCT SAMPLING USING APPROPRIATE SAMPLING CONDITIONS See Sec. 5.0-5.5; Appendix 2(b);
• to obtain a representative estimate of building occupants’ exposure;
NOTE: A worst-case condition in terms of meteorology may be presented when the inside temperature is at least 10oF
warmer than the outside temperature and the windspeed is steady and greater than about 5 mph. Sampling should
generally not be conducted in situations in which there have been significant barometric pressure or precipitation
fluctuations in the preceding 12 hours although volatilization of chemicals from groundwater to indoor air is often greatest
during the spring when the water table is the highest.
Sampling should be timed as scheduling allows to coincide with appropriate meteorological conditions. Ventilation and heating parameters should simulate
typical conditions for that building. The sampler should be located in the breathing zone in the center of the
room. Samples should be taken on multiple floors in the living area, including the area in which the suspected source emits its contamination (e.g., the basement for groundwater/soil gas contamination). Representative
areas should be selected based on high activity use areas and near potential pathways.
xv

WSC POLICY #02-430
• to obtain a worst-case estimate of contaminant concentration from the source area;
• to establish whether levels are present above a background condition, indicating the existence of a Substantial Release Migration;
9.) CONDUCT ANALYSIS AS PER CHOSEN METHOD. See Sec. 6.0-6.2.6; Appendix 4
10.) EVALUATE DATA AND CALCULATE HEALTH RISKS. See Sec. 8.0-8.7; Sec. 9.0-9.7
• Perform a data usability/data validation analysis;• Compare data to typical indoor air background concentrations of the chemicals of interest;• Evaluate data to determine whether the contaminant situation triggers a Substantial Release Migration and/or a Critical Exposure Pathway;• Calculate non-cancer and cancer health risks.
xvi

WSC POLICY #02-430
1.0 INTRODUCTION
1.1 Overview
This guidance document was developed in response to an increasing number of questions directed to the Massachusetts Department of Environmental Protection (MADEP) concerning appropriate methodologies to be used to conduct sampling and analysis of chemical contaminants in indoor air. Before the late 1980s, the MADEP rarely became involved in situations involving contamination of the indoor air. MADEP jurisdiction over air quality was limited to ambient air issues governed by the 1970 federal Clean Air Act of the Environmental Protection Agency (EPA) or by the state’s Air Toxics program. MADEP’s approach regarding indoor air reflected a policy that the indoor air was an extension of the ambient air and that by focusing resources on the protection of the ambient air, the indoor air was also being protected. Contaminated air issues that were attributed to indoor sources of contamination were and still are referred to the Massachusetts Department of Public Health (DPH).
During the 1980s, an increasing amount of information was becoming available on the fate and transport of volatile chemicals in groundwater and how they could impact indoor air. It was the developing understanding of such fate and transport issues that convinced the MADEP of the importance of including consideration of this pathway when evaluating the impacts of a hazardous waste site on human health. With promulgation of the Massachusetts Contingency Plan (MCP) (310 CMR 40.0000) for cleaning up hazardous waste sites in Massachusetts in 1988, the MADEP began to see many examples of environmental releases of oil and hazardous materials [OHM] that were impacting indoor air in buildings. Since that time, evaluation of the indoor air in buildings suspected of being impacted by environmental contamination has become a very common component of risk characterizations conducted under the MCP.
1.2 Relationship of Indoor Air Sampling and Analysis to the Bureau of Waste Site Cleanup (BWSC) Site Risk Characterization Program
The MADEP Bureau of Waste Site Cleanup (BWSC) is responsible for implementing the MCP. The MCP is a regulation for the notification, assessment and remediation of contaminated sites. This regulation is codified in M.G.L. Chapter 21E (c.21E), the Massachusetts Oil and Hazardous Materials Release, Prevention and Response Act. Some of the requirements from the MCP which pertain to the notification and assessment of sites with contaminated indoor air will be discussed below.
1.2.1 Risk Characterization Under the MCP
Subpart I (310 CMR 40.0900) of the MCP describes the requirements pertaining to risk characterization under the MCP. Formal risk characterization is the predominant method used in the MCP to determine whether a remedial response action is necessary and to document that a level of no significant risk of harm to health, safety, public welfare or the environment exists or has been achieved for the site. The general data gathering and interpretation requirements which must precede the risk characterization
1

WSC POLICY #02-430
are described in the regulations beginning at 310 CMR 40.0904. In particular, 310 CMR 40.0904 (2)(a) specifies that the risk characterization must include in its documentation, a description of the horizontal and vertical extent and concentrations of oil and/or hazardous material in all evaluated media. The MCP sets investigation and cleanup requirements in terms of a general performance standard, rather than detailed procedural directives. The MADEP publication, Guidance for Disposal Site Risk Characterization -- In Support of the Massachusetts Contingency Plan (MADEP, 1995a), hereafter referred to as the “MCP Guidance Document”, provides some very useful interpretation of this section but it is beyond the scope of the MCP Guidance Document to provide a more detailed discussion of the sampling and analysis issues pertaining to the indoor air. Section 9.3 of this document describes the general risk assessment methods used to conduct risk assessments under the MCP.
There are several types of risk characterizations that are conducted under the MCP. Each type of evaluation is used to answer a different risk question. These evaluation types are discussed below:
Significant Risk – A significant risk evaluation focuses on current and/or future exposures considering all current and future uses of the site. Both short-term and long-term exposures are evaluated for non-cancer risk as well as long-term cancer risk. At a site where indoor air impacts have been demonstrated under the MCP, a Method 3 evaluation (i.e., site-specific risk assessment) can be used to evaluate whether exposure to measured air concentrations may pose a significant risk to health as part of the achievement of a Permanent Solution as defined in the MCP. Method 3 risk characterization is addressed in the MCP in 310 CMR 40.0995.
Imminent Hazard – Under the MCP, this type of evaluation is used to determine if an Imminent Hazard exists in accordance with 310 CMR 40.0950. The focus of such an evaluation is on actual or likely exposures under current site conditions considering the current use(s) of the disposal site and the surrounding environment and considering an appropriate short-term period of exposure. The MCP defines a short-term period of time in this case as five years unless site conditions indicate a shorter time period is appropriate.
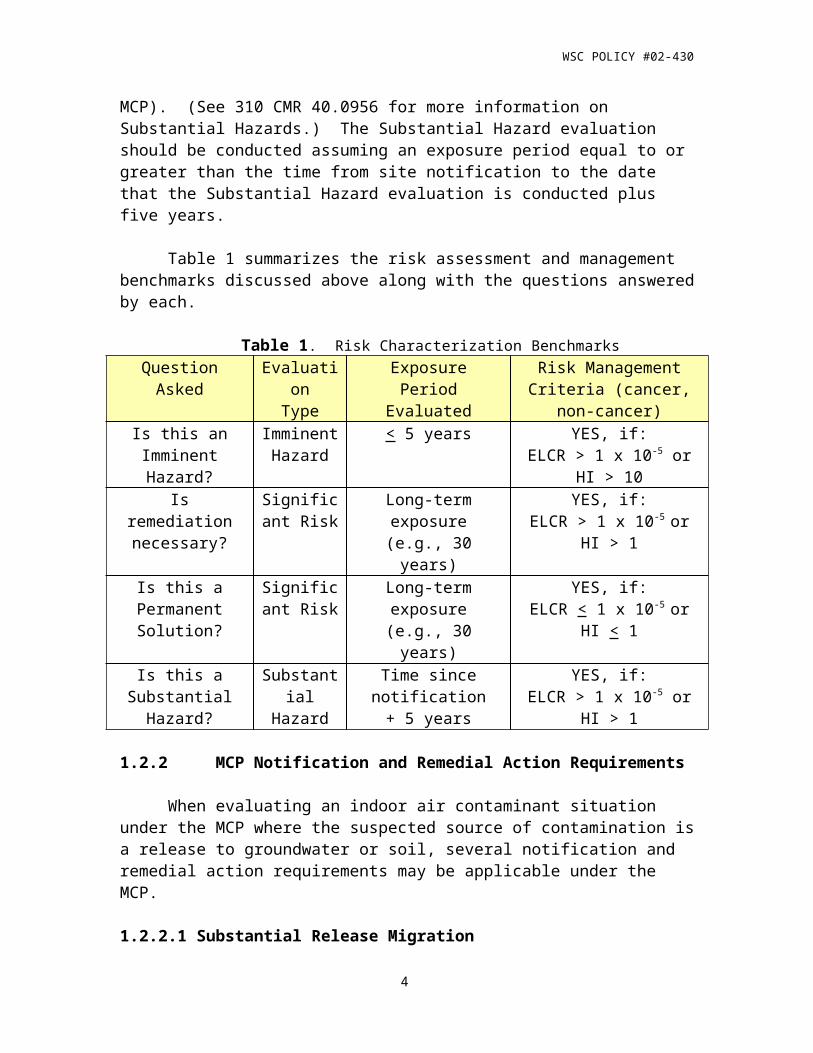
Substantial Hazard – A substantial hazard evaluation focuses on possible exposures considering the current use(s) of the disposal site and the surrounding environment. A substantial hazard to health is one that would pose a significant risk of harm to health if it continued to be present for several years. Such an evaluation is conducted to determine the applicability of a temporary solution (classified as a Class C Response Action Outcome in the MCP). (See 310 CMR 40.0956 for more information on Substantial Hazards.) The Substantial Hazard evaluation should be conducted assuming an exposure period equal to or greater than the time from site notification to the date that the Substantial Hazard evaluation is conducted plus five years.
Table 1 summarizes the risk assessment and management benchmarks discussed above along with the questions answered by each.
2

WSC POLICY #02-430
Table 1. Risk Characterization BenchmarksQuestion
AskedEvaluation
TypeExposure
PeriodEvaluated
Risk Management Criteria (cancer, non-cancer)
Is this an Imminent Hazard?
Imminent Hazard
< 5 years YES, if:ELCR > 1 x 10⁻⁵ or HI > 10
Is remediation necessary?
Significant Risk
Long-term exposure(e.g., 30 years)
YES, if:ELCR > 1 x 10⁻⁵ or HI > 1
Is this a Permanent Solution?
Significant Risk
Long-term exposure(e.g., 30 years)
YES, if:ELCR < 1 x 10⁻⁵ or HI < 1
Is this a Substantial Hazard?
Substantial Hazard
Time since notification+ 5 years
YES, if:ELCR > 1 x 10⁻⁵ or HI > 1
1.2.2 MCP Notification and Remedial Action Requirements
When evaluating an indoor air contaminant situation under the MCP where the suspected source of contamination is a release to groundwater or soil, several notification and remedial action requirements may be applicable under the MCP.
1.2.2.1 Substantial Release Migration
The MCP defines a number of specific release or site conditions as “Conditions of Substantial Release Migration (SRM)”. One of these SRM conditions that is directly pertinent to the evaluation of indoor air involves releases to groundwater that have resulted or are within one year likely to result in the discharge of vapors into school buildings or occupied residential dwellings. The MCP requires that the MADEP be notified of such an SRM condition within 72 hours of obtaining knowledge of the condition in addition to performing an Immediate Response Action (IRA) to address the SRM.
At a minimum, the IRA should involve an assessment of the release or threat of release and/or site conditions (as described in 310 CMR 40.0412 of the MCP). IRAs require the initiation of one or more containment or removal actions. In addition, IRAs require the elimination and/or mitigation of Critical Exposure Pathways as defined below.
1.2.2.2 Critical Exposure Pathways
The MCP also defines several “Critical Exposure Pathways (CEP)” by which contaminants released at a disposal site may be transported to human receptors. One of these CEPs pertains directly to indoor air impacts and is described as “vapor-phase emission of measurable concentrations of oil and/or hazardous materials into the living or working space of a pre-school, daycare, school or occupied residential dwelling”.
In situations in which performance of an IRA is necessary (in response to releases/conditions that trigger a 2 or 72 hour MADEP notification threshold under the MCP) and a CEP exists, additional steps must be taken to address the CEP as part of the
3

WSC POLICY #02-430
IRA that is needed. In such cases, remedial actions to prevent, eliminate or mitigate the CEP must be taken as part of the IRA. The above requirement may be rebutted if it is demonstrated that:
1.) The CEP does not present an imminent hazard at present or in the future for the time period that is likely to be required for the implementation and/or completion of a Comprehensive Response Action.
2.) It is not feasible to eliminate the CEP.3.) In cases in which it is not feasible to eliminate the CEP, it is not feasible to
mitigate the CEP.
For CEPs involving migration of contaminants into the indoor air, one or more of the following remedial measures could be used to address the problem:
Sealing cracks/annular spaces around utilities and where the floor meets the
wall, and/or cracks in basement floor Sealing and venting groundwater sumps Vapor barriers Reducing basement depressurization by ducting in outside air for furnace
combustion/draft Overpressurization of the basement using air/air heat exchangers, where
appropriate Passive or active sub-slab depressurization systems Groundwater treatment Soil vapor extraction
An evaluation of feasibility should balance cost and effectiveness of the available methodologies. An IRA must prevent exposure or eliminate the CEP. If it is not feasible to prevent/eliminate, then the IRA must mitigate the exposure. If mitigation is not feasible, it must be demonstrated to DEP that feasible IRAs are not available, and that the exposure does not result in an Imminent Hazard.
The concept of the CEP implies a presumption that, if feasible, some containment or removal action must be taken to prevent, eliminate or mitigate the CEP regardless of the results of the risk characterization. Thus, while a CEP is a risk-based concept in that its ultimate purpose is to achieve a reduction or elimination of health risk, it goes beyond the traditional risk assessment and risk management procedures. Specifically with CEPs, the task is to ascertain the existence of an exposure pathway, not to establish “representative” exposures or quantitative EPCs, HIs or ELCRs. Thus, the goal of the CEP is to go beyond the concept of no significant risk and to break the indoor air exposure pathway.
To evaluate whether a CEP has been successfully eliminated or mitigated, the criteria that was used to establish the existence of the CEP should be revisited. One of these criteria may be a comparison of detected indoor air concentrations to literature “background” to determine whether concentrations of OHM would exist in the absence of the disposal site (i.e., to achieve background concentrations). However, the evaluation
4

WSC POLICY #02-430
should also include consideration of other compelling information that originally indicated the presence of the CEP. (This information may include notation of indoor air concentration gradients, information about the contaminants detected in soil gas and groundwater, etc.). Figure 2 below summarizes the requirements of the SRM and CEP under the MCP. For additional detail regarding IRAs, SRMs and CEPs, see 40.0410 of the MCP as well as the BWSC MCP Q & A – volume 7, number 1.
The sampling and evaluation guidance presented in this document is primarily focused on the establishment of EPCs for the purposes of quantifying threshold and non-threshold health effects. A CEP has different sampling objectives and evaluation techniques. However, the results of indoor air testing can also be used to help in establishing the existence of a CEP and the feasibility of action. Figure 17 provides a schematic of the decision process under the MCP that can be followed for notification, assessment and remediation of sites with contaminated indoor air.
1.2.3 Emergency Response Evaluations
In addition to the specific air sampling requirements of the MCP, the BWSC Emergency Response (ER) division on occasion must also conduct sampling in order to make immediate decisions regarding exposure situations that may pose an acute threat to human health. ER generally responds to situations in which there may be explosive conditions or in which health impacts are a concern for exposure durations of twenty-four hours or less. This situation may occur, for example, with a spill of petroleum or other hazardous material in or around a building. In 1991, in response to a request by regional MADEP BWSC/ER staff, the MADEP Office of Research and Standards (ORS) developed a set of health-based action levels for petroleum indicator compounds (benzene, toluene and xylenes) to be used in evaluating risks associated with petroleum spills which impact the indoor air. Since that time, ORS also developed a set of health-based guidance values for trichloroethylene. ORS plans to develop additional health-based guidance values for indoor air Emergency Response as needed in the future. A listing of the current indoor air action levels, along with documentation for their derivation can be obtained from ORS (MADEP, 1991b).
5

WSC POLICY #02-430
Figure 2. Substantial Release Migration and Critical Exposure Pathway in Indoor Air
Groundwater to Indoor AirPathway Identified
SRM
IRA
FurtherAssessment
Risk: Is there an Imminent Hazard?Is there a Substantial Hazard?
Removal/Containment Action orother measure to limit exposure
Is therea CEP?
Is the conditionworsening?
Is it feasible toeliminate or preventthe CEP (e.g., “break
the exposure pathway”)?
Is it feasibleto mitigate the CEP?
Eliminate the CEP
Do Phase II Process
yes no
yes
no
yes
no
yes
no
continue
no
yes
6

WSC POLICY #02-430
1.2.4 Petroleum Hydrocarbons
Most recently, the MADEP has developed an approach for more completely characterizing the human health risks posed by exposures to petroleum hydrocarbon compounds often present in petroleum hydrocarbon mixtures (MADEP, 1994a; Hutcheson et al., 1996). A more recent inhalation component of MADEP’s petroleum hydrocarbon policy complements MADEP’s previously developed approach for evaluating ingestion exposures involving petroleum-contaminated water and/or soil. As with the other media, the petroleum characterization methodology for indoor air identifies a list of target analytes as well as a series of subgroups of compounds which have been categorized by hydrocarbon structural group and carbon number. Associated with this risk evaluation procedure is a specific analytical method for quantifying the volatile fraction of petroleum in air (MADEP, 1999; MADEP, 2000).
This sampling and evaluation guide discusses MADEP’s sampling and analytical methodologies for quantifying these target petroleum analytes in air. It is the intent of this sampling document to go beyond the discussion provided in the MCP Guidance Document to provide practical information which can be used by individuals performing site investigations in order to characterize the extent of chemical contamination in the indoor air. For additional information regarding implementation of the APH approach, readers may also consult the document, “Characterizing Risks Posed by Petroleum-Contaminated Sites: Implementation of MADEP EPH/VPH Approach” (MADEP, 2001).
1.3 Scope of the Indoor Air Sampling and Evaluation Guidance
There are essentially two approaches available for estimating indoor air contaminant concentrations, including direct measurement (the subject of this document) and estimation using a contaminant transport model. Modeling is often limited by a lack of site-specific soil and building information to allow for accurate estimation of COC transport as well as model validation for the site under study. In addition, models generally focus on water-soil gas partitioning and soil-gas-indoor air diffusion, and don’t account for other transport pathways, such as utility lines, that may provide the dominant migration route into a particular building. While direct measurement also has some drawbacks in that it is more resource-intensive and may not be feasible in certain (e.g., industrial exposure) situations, MADEP generally recommends direct measurement as preferable overall for evaluating conditions in existing buildings associated with current groundwater contaminant concentrations.
The purpose of this document is to provide a discussion of the various approaches that are available to sample and analyze indoor air for a variety of chemical contaminants. Contaminants likely to be found in indoor air generally include lighter molecular weight compounds in the gaseous form, aerosols or solid particulates composed of metal or some other material, such as carbon, onto which volatiles may be adsorbed. The volatile organic compounds (VOCs) largely include either hydrocarbons, as are found in petroleum and substituted carbon compounds such as the chlorinated hydrocarbons. A variety of other compounds such as ethers, carbonyls and alcohols
7

WSC POLICY #02-430
among others may also be present in indoor air. Many of these compounds exist in indoor air in the absence of a known point source of contamination. The presence of typical background concentrations of many of these compounds has been well established. These compounds are generally emitted from consumer products found in the indoor environment.
Indoor air can become contaminated in a number of different ways. Perhaps the most direct way is from an indoor source of contamination such as new building products or various cleaners, cosmetics and other consumer products in the building. From the point of view of this document, indoor air contamination arising from an indoor air source is considered background contamination. This document will address a number of issues dealing with indoor air background that should be considered when planning and conducting an indoor air study.
While the focus of this document is the sampling and analysis of chemicals in indoor air, it is important to note from the start that the complex chemical composition of indoor air is only one element in a larger suite of parameters that influence the overall quality of indoor air. In addition to its chemistry, the air quality inside a building is also influenced by such factors as its particulate concentration (i.e., dust), ventilation rate, temperature, relative humidity, type of heating used (gas, oil, electric) and the specific structural characteristics of that building. These parameters in turn affect such factors as the building’s air exchange rate (also indicated by measuring the percent carbon dioxide (CO2) or carbon monoxide (CO) in indoor air) and the potential for growth of bioaerosols (e.g., molds, bacteria and viruses) that could flourish under the correct conditions. An indoor air chemistry study that may have been initiated in response to general health and comfort complaints of the occupants may produce no evidence of chemical contamination yet the air quality in that building may still be unacceptable for other reasons. Many types of health complaints may be nonspecific and often similar health effects may be produced in individuals who are exposed to certain chemicals as in unexposed individuals who may live or work in a building with inadequate ventilation, temperature and/or relative humidity. The source of the complaints could, in fact, be totally unrelated to any ambient contaminants being investigated under the MCP. This perspective should be kept in mind whenever an indoor air monitoring study is conducted.
The indoor air may contain pollutants that span a spectrum of particle sizes. There is a phase transition from gaseous-phase volatiles to particulate pollutants that is related to particle size. In the spectrum of volatiles to particles, MADEP’s focus with regard to indoor air has been largely on the more volatile organic compounds, although occasional cases have involved contamination with substances which may be on the transition point between volatiles and particulates, (e.g., such as polychlorinated biphenyls). There are sampling methods and analytical approaches for the entire spectrum of pollutants. However, because evaluation of particulate contamination has not typically been part of MADEP’s indoor air evaluations and background levels of particulates have not been well characterized in the indoor environment, this document does not address sampling, analysis and evaluation of particulate pollution in indoor air.
8

WSC POLICY #02-430
The typical indoor air sampling scenario with which MADEP is concerned usually involves some sort of chemical release into the environment in which groundwater becomes contaminated and there is a subsequent partitioning of dissolved VOCs into the vadose zone of soil. VOCs are released as soil gas which then may infiltrate through the basement of buildings, and/or through utility lines and annular spaces of utility lines to enter the indoor air. In general, the depth to groundwater to which contaminant releases are suspected to impact indoor air is relatively shallow (i.e., less than 10-15 feet) and the soil is of a homogeneous and pervious nature. Often this release is petroleum-related, as in the case of a leaking oil storage tank, but hazardous waste sites can involve contamination by a range of hazardous chemical compounds and these are in large part volatile. A situation in which significant concentrations of dissolved VOCs are migrating from the release area to nearby downgradient dwellings may be indicative of potential indoor air impacts (MADEP, 1991a).
In addition to contamination through soil gas, VOCs could also enter a building via contaminated ambient outdoor air. An example of such a scenario is a building that might be located adjacent to a landfill, gasoline station, or other industry from which fugitive emissions may emanate.
Finally, please note that this document occasionally focuses its discussion on indoor air evaluation of residences. However, the concepts, practices and sampling/analytical principles discussed can be applied to any single or multiple-story non-residential building where the goal is to evaluate indoor air quality.
1.3.1 Evaluation of Indoor Air at Industrial Sites
It is acknowledged however, that in some industrial workplaces, the evaluation of indoor air is complicated by the fact that the manufacture or use of the same chemicals investigated as being site-related is occurring within the building being evaluated. Use of the sampling/analytical methodologies discussed in this document to monitor indoor air in such a case would be pointless in terms of determining site-related contaminant concentrations since occupational concentrations of the same contaminants generated indoors would mask any site-related concentrations. Such a situation could also arise in the case of a residence under renovation or perhaps one with an attached workshop but residential exposure situations may often be easier to control, at least in terms of the ability to control the contaminant-generating activity.
In terms of evaluating an occupational situation, there are several options. One approach may be to monitor the air inside the building and then to use occupational exposure standards and guidelines from the Occupational Safety and Health Administration (OSHA) and others to evaluate the results. This approach will essentially monitor compliance with occupational limits so it may be a good idea to conduct this evaluation as an extra step, but it will not address the evaluation of site-related contamination. Another approach which has been used in such situations is to conduct modeling from detected groundwater and/or soil gas concentrations to predict possible site-related contaminant concentrations in the indoor air. The issues involved with this approach include selection of an appropriate model to use, as well as the use of accurate
9

WSC POLICY #02-430
site-specific parameters called for by that model. A third option for evaluating indoor air contaminant concentrations in such a case involves a combination of sampling and modeling. The general approach in such a case involves measuring a flux rate using a sampling method such as a Bell jar to collect VOCs released as soil gas through the building’s foundation. This flux rate is then input into a dispersion model to obtain a more accurate estimate of site-related contaminant concentrations entering the indoor air. An in-depth discussion about modeling is not within the current scope of this document. However, Appendix 6 of this document is being reserved to focus on this issue in the future. 2.0 PLANNING THE STUDY
It is important to establish the scope and objectives of the study before air monitoring is conducted. In the process of planning an indoor air sampling study, the primary governing principle should be the performance standard of the MCP. The MCP sets investigation and cleanup requirements in terms of a general performance standard, rather than detailed procedural directives. This performance standard is referred to as the MCP Response Action Performance Standard (RAPS). 310 CMR 40.0191(1) of the MCP states that the “Response Action Performance Standard is the level of diligence reasonably necessary to obtain the quantity and quality of information adequate to assess a site and evaluate remedial action alternatives, and to design and implement specific remedial actions at a disposal site to achieve a level of No Significant Risk . . . “.310 CMR 40.0191(2) further states that “RAPS shall be employed during the performance of all response actions conducted pursuant to 310 CMR 40.0000 and shall include, without limitation, . . . (a) consideration of relevant policies and guidelines issued by the Department and EPA; (b) use of accurate and up-to-date methods, standards and practices, equipment and technologies which are appropriate, available and generally accepted by the professional and trade communities conducting response actions in accordance with M.G.L. c. 21E and 310 CMR 40.0000 under similar circumstances; (c) and investigative practices which are scientifically defensible, and a level of precision and accuracy commensurate with the intended use of the results of such investigation”.
In terms of planning the indoor air sampling study, three general steps that need to be taken during the planning phase of the study include: 1) defining the objectives of the study; 2) identifying the contaminants of concern; and 3) determining the required sampling duration. In making decisions in the process of planning and carrying out an indoor air study and evaluating its results, the investigator should exercise professional judgment consistent with the RAPS provisions of the MCP in selecting the appropriate methods.
2.1 Defining Objectives
Air monitoring requirements can be very different, depending on the situation being investigated and the nature of the study. The type and duration of the sampling conducted could vary significantly depending on the study’s objectives. For this reason, the purpose of the study should be established before any sampling and analysis is
10
WSC POLICY #02-430
conducted. Is the study being conducted in order to identify gross or relative levels of contamination? Alternatively, is the purpose to determine what type of compounds may be present in the indoor air (i.e., qualitative study) or to determine how much of a detected compound may be present in the indoor air (i.e., quantitative study)?
Each of these types of studies is pertinent to a different set of scenarios. If the investigator is interested in finding contamination “hot spots” comparing contaminant concentrations in several areas, or identifying likely sampling locations, then a screening study would suffice. A screening study may typically involve use of a portable analytical monitor such an organic vapor analyzer (OVA) to help determine if contaminants are off-gassing from excavated soil or perhaps to confirm the presence of organic vapors and to trace them back to their source. Such a study might involve screening of suspected discharge points of vapor into buildings, such as around a sump or in the annular space of utility line entry points. Such a screening method is generally not sensitive enough to detect chemical concentrations of environmental concern, and should not be relied upon for identifying individual compounds. This sort of study might be sufficient as part of the information collected for demonstrating the existence of a CEP. However, it would be inadequate as a basis for ruling out that a CEP exists.
On the other hand, if the study results were needed to obtain qualitative data on individual chemicals (e.g., such as in order to compile a list of chemicals which may be present in indoor air at a site) a more sensitive screening method would be in order. Typically this would involve a collection method in which samples would be collected using canisters, Tedlar bags, etc., depending on the situation. (Specific issues related to Tedlar bags are discussed in Section 3.2.3.) In order to identify unknowns, these samples should be analyzed using gas chromatography/mass spectrometry (GC/MS). For collection of such qualitative data, it may be adequate to take grab samples if time or resource limitations exist. However, whenever possible, even for collection of qualitative data, time-weighted samples are recommended.
If the study results are needed to conduct a human health risk assessment, or if there is an overall need for more sensitive quantitative results to detect environmental levels (such as in the case of a CEP determination), then a more refined sample collection and analysis protocol, involving time-integrated sampling (using evacuated canisters or adsorbent media tubes along with GC/MS analysis) should definitely be used.
Sampling and analytical costs for a screening study would generally be less than they would for a refined study. To define the scope of the project, a well-defined process should be followed. One of the tools available to help with this process is the EPA “Guidance for Developing Data Quality Objectives”. This document outlines a simple 7-step process for developing data or project objectives.
Generally speaking, an indoor air investigation will typically involve both a screening component and a component in which sampling is done to characterize exposure. Recommended methods for each of these study types are addressed in Section 3.0 of this document. In addition, Section 2.2 below discusses a general screening approach.
11

WSC POLICY #02-430
2.2 The Role of Screening In Planning Extent of Indoor Air Sampling
A survey using a direct-measuring instrument such as an organic vapor analyzer (OVA) or a photoionization detector (PID) is often conducted as part of a preliminary assessment of a site in order to look for possible elevated concentrations of contaminants. Such instruments should not be used in isolation but should instead be integrated into a comprehensive evaluation of the situation. All available information about the site should be considered in making a determination as to the need for additional sampling. There are a number of conditions characterizing a site that may indicate the need for a more refined analytical assessment to be done. Things to consider in making such a determination include the nature, location and extent of a groundwater plume relative to the structure being investigated; site history (in terms of how and where on the site, the contamination may have been introduced); the nature and concentration of contaminants in the groundwater (e.g., whether they are volatile; whether they exceed any GW-2 concentrations, etc.); meteorology (affecting both outdoor and indoor conditions relative to volatilization of contaminants from groundwater). For example, in the spring, the groundwater table may be higher, producing a higher degree of volatilization of contaminants. During the winter, the ground may be frozen, directly affecting the pattern and release of volatile organic compounds. (See Section 4.2 of this document for additional information).
Because of the decreased sensitivity of direct-reading survey instruments and the intermittent nature of some indoor air contaminant situations, it is often likely that an OVA/PID survey may fail to detect contamination that is actually present. Thus, the existence of an indoor air pathway should not be ruled out solely on the basis of a PID or OVA screen if other conditions point directly to the need for a more refined sampling and analytical assessment. Section 3.1.1 contains additional information on direct-reading instruments such as OVAs and PIDs.
2.3 Identifying Contaminants of Concern
In conjunction with the above discussion, it is important to identify which chemical compounds are of concern in the study and should be targeted in the analysis.Cost is an important factor, but it should not be the primary consideration. Above all, the quality of the data must be consistent with the RAPS provisions of the MCP.
The typical scenario involves a situation in which the investigator is trying to determine whether an ambient source of contamination (e.g., a groundwater plume or soil gas) containing known chemicals is potentially impacting the air in a building. In such a scenario, it is often required that groundwater and/or soil gas tests be conducted before a target list of indoor air contaminants can be developed. A list of contaminants found in these media should at the very least be included in the list of target analytes. Such a study is known as a targeted study.
Additional target compounds may be added to this list based on consideration of a
number of other sources of information. Contaminants identified in any screening 12

WSC POLICY #02-430
studies as well as degradation products of target compounds may also be included in this list. Information gathered during the early stages of an indoor air investigation (such as a history of the site on which the building is located and the possible source(s) of contamination) would help identify additional contaminants of concern.
When contamination is composed of a mixture of compounds, known constituents of this mixture should also be targeted as contaminants of concern. For example, in a comprehensive investigation of a site contaminated with petroleum, the MADEP analytical approach (i.e., APH) for detecting the target analytes and carbon number subgroups of concern in petroleum should be applied.
The EPA TO Methods and other analytical methods listed in Table 3 of this document generally include a baseline list of analytes. These methods include a large number of the compounds often seen at sites. The targeted study should be conducted using one of these methods and then modifying it, if necessary, to include additional analytes of concern which may not be included in the default list.
In some cases where there are no targeted data from other media or other information from which to compile a list of target analytes, a general reconnaissance or baseline study can be used to compile a preliminary list of contaminants of concern. This study would probably be best conducted using one of the all-encompassing collection methods such as TO-14/15. Such a method incorporates mass spectrometry which can identify unknowns (see Sec. 3.0-3.3).
For additional discussion on characterizing contaminants of concern, please consult the MCP Guidance Document (MADEP, 1995a), Section 2.2 entitled “Determining the Nature and Extent of Contamination”.
2.4 Considering Sampling Duration and Frequency
The exposure of interest should be defined in order to establish the required sampling duration and frequency for the study. The sampling duration and frequency should be defined in the planning stages of the sampling study. Again, decisions made with regard to duration and frequency must be consistent with the RAPS provisions of the MCP.
Selection of representative sampling duration and frequency for a study is important for several reasons. The first concerns the evaluation of health effects. Is the scope of the study to determine whether an acute health hazard may exist in conjunction with breathing the air or is the concern longer-term (i.e., subchronic or chronic) health effects? In other words, is the exposure of interest an Emergency Response-type situation or is it a longer-term exposure situation where the exposure of interest is a time-weighted average for risk assessment purposes? Each of these questions would be addressed by a different monitoring approach. Generally speaking, characterizing exposures adequately to permit assessment of longer-term effects would be more resource-intensive than would be the requirements to characterize an acute exposure. In terms of evaluation of health effects, toxicity guidance values for chronic health
13

WSC POLICY #02-430
endpoints would generally be more restrictive than those for acute health endpoints. Thus, the issues of detection limit (discussed in Section 2.5) and background (discussed in Section 5.9) might play a more important role than they would in an acute study.
The appropriate sampling duration and frequency are also important in terms of trying to match the air monitoring method to the pattern of air contamination. Is the indoor air contaminant concentration likely to be relatively consistent or is it influenced by factors that cause it to vary on a daily, seasonal or other basis? The sampling duration that is selected should yield as representative a sample as possible. Daily fluctuations in contaminant concentration could be due to such factors as meteorological parameters (e.g., temperature, wind conditions, barometric pressure, moisture), usage patterns affecting emission rate (e.g., as in the case of a building impacted by fumes emitted from a gasoline pumping station), and the characteristics of the building being impacted (e.g., an old drafty building would have a higher ventilation rate than an energy-efficient building).
On a seasonal basis, any of the parameters mentioned above could influence the concentration, in addition to the seasonal phenomena. For example, in addition to the day-to-day fluctuations, meteorology changes predictably with the seasons. Certain months are predictably colder and/or wetter than others. These characteristics of the seasons lead to an entire secondary set of considerations regarding sampling, including the seasonal habits of a building’s inhabitants (e.g., opening windows) and seasonally variant relative diffusion and volatilization rates of VOCs and other compounds. More discussion will be provided on these considerations in Section 5.3.
Indoor air contaminant concentrations can also vary on a more immediate basis at any time, often for reasons that are not clear. Although there is often no way to predict fluctuations in contaminant concentration, it is recommended that sampling duration be as long as practicable to allow for as representative a sample as possible. The problem with sampling durations that are very short or instantaneous, is that they have a higher probability of obtaining an unrepresentative sample. An instantaneous concentration could potentially represent a peak or trough in the concentration profile which might not reflect the true time-integrated average concentration to which an inhabitant may be exposed over the longer term.
Ideally, the duration and frequency of sampling should cover expected durations and frequencies of any cyclic events which might influence the concentrations. A common example of this problem is illustrated by the tides in the ocean. If one wants to know something about the water level on the coast, measuring the water level one time or hourly for two hours does not convey the information that this water level may rise and drop two times in 24 hours. Measurements should cover a 24-hour period at a minimum to begin to give an adequate picture of the water levels at a location. This basic strategy will still not reveal that, in addition to the diurnal variabilities which will be captured, another lunar 28-day cycle will be influencing water levels. This example is given not to suggest that sampling must be a minimum of twenty-four hours but to illustrate that indoor air concentrations may vary on a seasonal, daily, hourly, etc. basis, depending on
14

WSC POLICY #02-430
the source, and that these variations should be kept in mind when designing a sampling plan.
A period of two hours is recommended as the minimum sampling duration for collecting data to be used for conducting risk assessment. However, depending on the nature of the source, longer sampling durations may increase confidence in measured concentrations. Multiple sampling studies may be used to address frequency issues. Additional discussion on sampling duration and frequency is presented in Sections 5.2 and 5.3 of this document.
2.5 Considering Detection Limits
It is very important to establish from the start the minimum amount of a compound that must be identified in the study. If, for example, the concentration data will be used to conduct risk assessments, the routine detection limits of the sampling/analysis methods to be used to conduct the sampling/analysis should be at least as low, if feasible, as the toxicity criteria that will be used to conduct the evaluation. Each published method should specify a limit of detection. Detection limits are statistically derived numbers that imply a level of uncertainty. A standard should be analyzed at the putative detection limit to verify its accuracy. If the limit of detection for a particular chemical is higher than its actual concentration in the indoor air, the chemical will not be detected. This situation could result in an incorrect conclusion that the chemical was not present at all at the monitored locations. In terms of determining a concentration for use in risk assessment, this erroneous conclusion could result in an incorrect estimation of health risks associated with exposure to the compound.
For this reason, it is prudent to identify a list of the pertinent toxicity values and compile a list of the target detection limits or practical quantitation limits before the sampling study is conducted. If it is not feasible to achieve these detection limits, then the utility of conducting such a study may be questioned.
Two types of detection limits are defined and used in this document. These include a method detection limit (MDL) for a specific methodology as well as a practical quantitation limit (PQL) or Reporting Limit (RL). The MDL is a statistically derived number that represents the minimum amount of an analyte that can be identified with 99% confidence above background instrument noise. The PQL or RL is the lowest level that can be reliably achieved within specified limits of precision and accuracy. A PQL is approximately three to five times the MDL. The instrument detection limit (IDL) or the finite capacity of the instrumentation to detect a defined quantity, is also directly related to the MDL. The IDL describes the detection capability of the instrument itself. Once that instrument is incorporated within a method that dictates such parameters as sampling rate, sample size, etc., the IDL ultimately defaults to the overall MDL. For sorbent media samples (e.g., Tenax), there may be a blank background level for some target compounds and parameters which may need to be accounted for when determining the MDL. Thus the MDL is influenced by the overall efficiency of its components, including the sampler as well as the analytical instrument. Factors that may influence the efficiency of the sampler include sampling rate, sample size, etc.
15

WSC POLICY #02-430
An important parameter that can affect sampling efficiency is the breakthrough mass of contaminants that can be collected using a particular collection sorbent. The breakthrough mass is a function of the volume of air that is passed through the sorbent media and the concentration of contaminants in that air. Breakthrough occurs when the absorptive capacity of the sampling media is exceeded. Thus, further sorption of contaminants in the air being passed through the media does not occur and/or some of the contaminants already sorbed onto the media may desorb. Sorbent-specific breakthrough masses can be estimated given the approximate concentration of contaminant in the air and the volume of air to be passed through the media.
Finally, every method used is characterized by a particular degree of accuracy, or ability to quantify what is actually there, and precision, the ability to obtain reproducible results. The concepts of precision and accuracy as well as additional information on MDLs and RLs, will be discussed in more detail in Section 7.4 on Analytical Quality Control.
It should be noted that the occupational health field offers many standardized sampling and analysis procedures for monitoring compliance with occupational air standards. Many of these methods are not suitable for environmental level sampling because of insufficiently sensitive detection capabilities. The major inherent difference with regard to detection levels between occupational health samples and environmental samples is that occupational samples are solvent (CS2) extracted and a small amount is injected for analysis. In environmental level samples, the whole sample is thermally desorbed for analysis. Occupational samples are collected using tubes which are usually smaller and contain less adsorbent material, resulting in less collected volume. Because of lower cost and easier access to services, indoor air project managers who are unaware of these differences may incorrectly choose such an occupational method. It is recommended that the project manager ensure that the laboratory performing the analysis has experience with environmental level analyses or is aware of the unique aspects of environmental level analyses compared to occupational level analysis requirements.
2.6 When Should Indoor Air Sampling Be Conducted?
Indoor air sampling should be conducted when site contaminant conditions are indicative of a potential indoor air impact. Available information about the site should be used for this determination. The analytical results of groundwater and soil gas monitoring studies should be used to indicate the types and concentrations of contaminants present in the media. Hydrogeological information collected for the site addressing the nature and pattern of groundwater contamination should also be used to predict the direction and rate of travel of the contaminated groundwater plume. If this information indicates that impacts to indoor air are possible, air sampling in the building of concern should be conducted. Methods chosen should reflect the suite of contaminants found in soil and groundwater as well as any contaminants predicted to be present based on historical use of the site. The information above may be supplemented with data obtained from a screening study if there is compelling evidence that these compounds may be site-related. However, the results of a screening study may not be as
16

WSC POLICY #02-430
relevant to targeting a list of COCs as such a study may pick up other non-site-related contaminants.
The presence of unusual odors in the indoor environment is another indicator of potential impact which should be further investigated with a monitoring study.
3.0 GENERAL AIR MONITORING TECHNIQUES
Selection of a sampling method for use in conducting an indoor air study is dependent on the objectives of the study, the contaminants of concern and the required sampling duration. The sampling method used is governed by the factors discussed above. The methodology should be able to detect compounds at ambient levels, generally in the part per trillion (ppt) to part per billion (ppb) range for environmental samples. The monitoring equipment employed should be reasonably lightweight and compact for ease of transport. The equipment should be easy to calibrate and use in the field. The methodology should produce results which are accurate and reproducible with a minimum of artifactual and contamination problems. Finally, the methodology should allow for sampling periods which are representative of occupants’ exposure time.
There are several categories of air monitoring methodologies, the selection of which is determined by the project quality objective. These methodologies range in sophistication from screening methods which use direct-reading instruments with relatively low precision and accuracy to collection methods which are the most precise and accurate. There are also analytical field methods which involve aspects of both the direct reading and collection methodologies. Strictly speaking, direct-reading methods and analytical field methods are all categorized as “analytical methods”. Analytical methods incorporate air sampling as well as on-site detection and quantification of chemical compounds. These methods differ from collection methods, which can typically achieve a more sensitive quantification limit. VOC collection methods involve the concentration or collection of the compound into a container or onto some kind of sorbent material for later analysis.
Each of the above monitoring methods can involve either active or passive sampling techniques. Active sampling involves using a pump to actively pass air through a sorbent cartridge or collection filter or into an air sample container. Passive sampling of VOCs relies on the kinetic energy of gas molecules and diffusion of the gases in an enclosed space onto a sorbent medium.
Although both types of monitoring techniques can be used to sample the indoor air, collection methods have generally been used and recommended by MADEP to conduct monitoring in conjunction with site evaluations. Direct-reading and field analytical techniques are generally used for screening (e.g., identifying hot spots).
Regardless of the monitoring strategy or technique that is chosen, basic principles guide the evaluation of indoor air VOC concentrations. These include the specific appropriateness of the methodology to the target pollutant list, the representativeness of the time intervals and sampling locations, the appropriateness of the concentration
17

WSC POLICY #02-430
measurement range and the validity of the quality control and assurance which is applied to the measurements. Finally, it is important that indoor air investigators know how to use sampling equipment and media and be familiar with the specific limitation of each.
Table 2 and the following sections below provide a summary of general air monitoring techniques.
3.1 Analytical (Screening) Methods
3.1.1 Direct-Measuring Methods for VOCs
Direct-measuring methods incorporate air-sampling as well as on-site detection and quantification of chemical compounds. These techniques can provide information on both real-time (instantaneous) concentrations as well as time-weighted averages. A direct-measuring technique is one in which the collection and analysis of the sample is all done by one portable, automated instrument in the field. Continuous portable survey instruments such as the hand-held flame ionization detector (i.e., Organic Vapor Analyzer (OVA)) and the Photoionization Detector (PID) yield nonspecific responses to different ranges of organic compounds. Although both types of instruments yield parts per million outputs (consult manufacturers for detection limits for these instruments) and can be calibrated using a known gas mixture, they cannot be used to measure absolute concentrations. These instruments respond with different sensitivities to individual chemicals. It is not possible to identify a mixture of organic compounds as a particular product such as “gasoline” or “paint thinner” using portable survey instruments. It is also not possible to determine the proportions of compounds in a VOC mixture. However, such instruments can be used to find “hot spots” and likely sampling locations, as well as to determine relative degrees of contamination. MADEP personnel have used OVA/PID surveys to help determine if excavated soil is contaminated. MADEP has used GC/PIDs to confirm the presence of organic vapors and to trace the vapors to the source. For example, in indoor air source surveys, the source has frequently been found to be a crack in the foundation or an outflow hole for a sump pump. Outdoor surveys can screen test wells and catch basins for the presence of gasoline and other vapors. OVA/PIDs should not be used for the identification of individual contaminants or for compiling a list of target analytes. Their sensitivity is inadequate for this purpose. Background readings from survey instruments do not preclude the presence of VOCs. For example, a benzene concentration of 100 parts per billion volume, which is well above typical indoor background concentrations as well as health criteria, may only cause a minimal deflection in a portable PID meter. Such a response could cause an investigator to erroneously conclude that there are no contaminants present above background whereas in reality individual compound(s) may be there at concentrations of concern. Section 2.2 contains additional discussion on the issue of using direct-reading instruments to help determine whether additional, more refined indoor air sampling should be done at a site.
Direct-measuring instruments may be the best practical way to measure carbon monoxide and carbon dioxide which are not necessarily environmentally relevant but may need to be accounted for in some cases. The drawback, as with all analytical
18

WSC POLICY #02-430
techniques, is that for some situations, these monitors are not specific enough or sensitive enough interms of detection capability. Overall, direct-reading instruments are usually less sensitive but more capable of catching excursions than time-weighted collection methods. Not all direct-reading monitoring methods are complex, expensive and require extensive experience in calibration and maintenance in the field. Length-of-stain devices (for example, Draeger tubes) are examples of simple screening monitors which can be useful for monitoring analytes not amenable to time-weighted sample collection and analysis. However, these devices are typically used for industrial hygiene applications and are not usually sensitive enough to measure environmental levels of contamination.
3.1.2 Field Analytical Methods for VOCs
While OVA or PID instruments are valuable in the onsite determination of the magnitude of potential contamination and finding sources and “hot spots”, they are not component specific and may not be sufficiently sensitive to measure in the concentration range deemed to be the threshold of concern in regards to indoor ambient air. Rather than waiting for the results from time-weighted samples, which are brought to a laboratory for in-depth analysis, sometimes portable gas chromatographs (GCs) are brought to the site for the ongoing same day analysis of grab samples. In this approach, grab samples are collected using a syringe or other collection system and injected directly into the portable GC in the field which then can analyze the sample directly in the field. Portable GCs are typically set up with photoionization (for aromatic hydrocarbon analysis), flame ionization (for aliphatic hydrocarbons) and/or electron capture (for chlorinated hydrocarbon analysis) detectors. The results generated using a portable GC can range in quality from screening level values to definitive values, depending on the level of calibration. Usually, these GC analyses are still considered screening because the analyses do not provide the confirmational identification of a mass spectrometer (MS) detector or the level of quality control of a laboratory analysis. However, they can yield general concentration numbers for tentatively identified toxic target compounds and parameters. Recently, products have been brought to the market which combine surveying with GC analysis, even introducing MS detection to the field.
19

WSC POLICY #02-430
Table 2. Summary of Some General Air Monitoring Techniques
Technique Example Instrument/Method
Positive Features Negative Features
Analytical (Screening) MethodsDirect-measuring Organic vapor
analyzer On-site detection and
quantification Capability of
catching concentration excursions
Low sensitivity Low specificity
Photo-ionization detector
Field/Analytical Portable gas chromatograph
On-site detection and quantification
Allows use of simple collection device such as a Tedlar bag
Better detection capability than the direct-measuring techniques
Usually considered a “screening” method because does not involve identification using a mass spectrometer
Collection MethodsEvacuated canisters Capability of
taking multiple aliquots for analysis
More expensive than adsorbent tube method
May require special handling to prevent sample deterioration during transport to lab for analysis
Adsorbent media tubes
Less expensive than evacuated canister method
May be subject to “breakthrough” problems
May require special handling to prevent sample deterioration during transport to lab for analysis
Passive badge sampler Can monitor longer-term period of time
Relatively inexpensive
Higher humidity can produce erroneous results
Possible back-diffusion off sampling medium
Possible interferences between compounds
20

WSC POLICY #02-430
3.2 Collection Methods
Collection techniques implemented in the field provide information on time-weighted average concentrations. Grab samples (or “instantaneous” samples) represent the smallest time period that can be obtained using a collection method. While grab samples are usually used for source or location characterization, time-weighted averages are used for exposure assessment. Whereas in the past, grab samples collected on-site (by a portable gas chromatograph, a direct-reading instrument) for screening purposes were more perishable and less sensitive than time-weighted samples brought to a laboratory, now canisters (EPA method TO14/15) can be used to collect either grab or time-weighted samples and would be equally sensitive, just representative of different time intervals.
A time-weighted average sample represents a sample taken at a known sampling rate over a fixed period of time. The results of such sampling are expressed as average concentrations over the sampling period. A time-weighted average sample is also known as a time-integrated sample. Integrated sampling may also indicate a type of sampling in which periodic samples at a known sampling rate are taken over a fixed period of time. For example, grab sampling provides a short-term or instantaneous pollutant concentration. To increase reliability of the results obtained, multiple grab samples can be taken over time and space. More correctly, the collection of multiple grab samples should be described as a diagnostic technique (for use in assessing the magnitude of contamination, fingerprinting a source, etc.) rather than as a substitute for time-weighted sampling.
In general, as more samples are taken, field logistical costs increase. Grab-sampling is generally the least expensive of the sampling methodologies but it probably yields the least reliable results (i.e., extreme fluctuations in concentrations may not be represented in the sample.)Time-integrated sampling is appropriate to use when pollutants are present in such small amounts that they are undetectable by grab sampling. In addition, time-integrated sampling should be used any time indoor air data are collected for comparison to health-based guidelines and standards or for conducting risk assessment. Time-weighted sampling has the same disadvantage as grab sampling in that once a sample is collected, it needs to be transported to a lab to be analyzed and may require special handling to avoid deterioration of the sample.
Grab samples or active (time-weighted) air sampling, using the appropriate available air quality monitoring techniques, can be used for evaluating short-term (e.g., less than or equal to twenty-four hour) exposure events. Systems for monitoring VOCs involve the use of either pumped samples collected on adsorbent media or samples collected using Summa® polished canisters (i.e., passivated evacuated stainless steel containers). MADEP recommends that, whenever possible, use of time-integrated sampling is preferable over grab sampling and will generally yield more reliable results. Also, as stated above, if data are to be used for risk assessment purposes or for comparison to health-based guidelines or standards, time-integrated sampling should be used for this purpose.
21

WSC POLICY #02-430
22

WSC POLICY #02-430
Examples of Portable Analytical MonitorsEquipped with Various Detectors
(Perkin-Elmer Instruments) (Hnu Process Analyzers) Figure 3. Photovac® Figure 4. Two Types of HNU® Instruments
(Questar Baseline) (Foxboro)
Figure 5. Organic Vapor Analyzer Figure 6. Organic Vapor Analyzer with Photoionization Detector (PID) with Flame Ionization Detector (FID)
(HNU Process Analyzers)Figure 7. Portable GC with six interchangeable detectors
(e.g., FID, PID, Electron Capture Detector (ECD), etc.)
23

WSC POLICY #02-430
3.2.1 Active VOC Sampling With Adsorbent Filled Traps
For VOCs, the use of a pumped air collection system involves the collection of time-weighted samples using adsorbent media traps packed with thermally desorbed and cryogenically preconcentrated adsorbent media. Analysis of these samples is conducted using a gas chromatograph with an attached detector such as a mass spectrometer (MS), a flame ionization detector (FID) or a photoionization detector (PID). The flow rate and “Safe Sampling Volume” used for the sampling event are determined based on the adsorbent used, the target pollutant, and the amount (mass) of adsorbent contained in the trap.
The Safe Sampling Volume is best determined and validated by the laboratory doing the analysis as it can be tailored to the particular adsorbent type(s) and amount used and the target pollutant(s) of interest. Safe sampling volumes are occasionally suggested by the laboratory supplier or manufacturer or specified for a particular set of parameters in the analytical method. Sensitivity is maximized when the largest volume of air is sampled without exceeding the safe sampling volume. The safe sampling volume is designated based on a compromise between method sensitivity and prevention of significant breakthrough.
“Breakthrough” defines the volume at which a significant amount of a constant atmosphere of an adsorbed compound drawn through a sorbent tube desorbs and appears in the tube effluent (Hodgson, 1989). One example of breakthrough occurs when a sampling cartridge or sampling tube becomes saturated with VOCs and, as a result, any additional VOCs passing on through the sampling media are not collected. In some instances, breakthrough may not involve sorbent saturation. For example, a compound trapped on sorbent media may migrate through the media with the passage of clean air. Breakthrough can therefore result in erroneous concentration calculations since concentration is a function of mass collected and the volume of air sampled. Section 7.3 contains additional discussion on this topic.
When conducting integrated sampling, pump flow rates should be set with a rotameter to assure a constant flow-rate once the sampling media is placed in line. Flow rates should be double-checked in the field as well. Rotameters should be regularly calibrated with a Gilabrator or similar method to establish linear curves or levels of confidence. Using the U.S. EPA Ambient Air Sampling TO-1, (or TO-2 or TO-17) methodology (U.S. EPA, 1984) and applying it to indoor air (or, using Method IP-1B of the EPA Indoor Air Methods) (U.S. EPA, 1990), it is possible to achieve a method detection limit of 0.1 ppb, although high confidence is only held for identifications made for compounds detected at and over 0.5 ppb.
3.2.1.1 Collection Sorbents
VOC samples (as well as semivolatiles) can be collected on adsorbent media by drawing air (at a calibrated flow rate) through a hollow tube (glass or metal) containing adsorbent media. At the end of the sampling event, samples are taken to the laboratory for thermal or chemical desorption and subsequent GC analysis. Chemical desorption of VOC samples is commonly practiced in industrial hygiene applications, but is usually insufficiently sensitive for environmental level measurements. Thermal desorption involves the preconcentration of a sample by desorbing the VOCs from the media by passing inert carrier gas (while heated)
24

WSC POLICY #02-430
through the trap and concentrating them on a smaller downstream trap (cold trap) which is usually cryogenically cooled. The concentrated sample is then flash-heated to a GC (MS) for analysis. Thermal desorption offers the analysis of the whole sample, rather than an aliquot as is the case for chemical desorption. A disadvantage of thermal desorption is the commitment of the whole sample for one analysis without the possibility of replicate analyses. Some adsorbents (especially those used to collect semivolatile organics) are not capable of being thermally desorbed and must exclusively be extracted using chemical solvents. Adsorption/Thermal Desorption methods for environmental applications can be found in Methods TO-1, TO-2 and TO-17 of the EPA “Compendium” (EPA, 1984). Key aspects of adsorbent sampling include:
1. Breakthrough is always a concern and must be accounted for in determining sampling duration and flow rate (i.e., via the Safe Sampling Volume).
2. Back-up traps for detecting breakthrough are necessary.
3. Quality control should be extensive. Many quality control measures (such as duplicates, field blanks, lab blanks) account for the ease of adsorbent media to be contaminated by non-sampling related passive adsorption of VOCs. Storage life of exposed samples and unexposed sampling traps is limited.
A variety of adsorbent media are applicable to various chemical classes and volatility ranges and can sometimes be layered to improve the versatility of the sampling element.
3.2.2 Sampling VOCs Using Evacuated Canisters
VOCs may also be collected into evacuated, polished, stainless steel (Summa® or silica- lined) canisters. This method can be used to collect either grab samples or integrated samples over time. For taking integrated samples, canisters ranging in volume from about six liters and up are used. However, smaller canisters may also be used when taking grab samples.
To collect integrated samples, the canisters are fitted with calibrated flow controllers. Once the top valve on each canister is opened, the canister can be set to fill with air slowly, over a two-hour or longer sampling period (to allow for calculation of a time-weighted average). In accordance with Methods TO-14/15/17 of the EPA “Compendium”, the canister vacuum can be used as the driving force (with the calibrated flow controller) to collect air at a fixed flow rate over a prescribed averaging time (e.g., 40 cc/minute over 2 hours using a 6 liter canister). Care should be taken to leave the canister under some vacuum at the conclusion of the event to ensure sufficient driving force to collect a steady flow rate until the end of the sampling event. Samples collected under vacuum may need to be pressurized with the addition of inert gas prior to analysis. Sampling equipment is available which actively pumps air through a calibrated flow controller into the canister, which results in a pressurized canister (up to 2 atmospheres) and a sample containing a higher volume than the previously described method. Special care must be taken with the pressurized sampling equipment to ensure that none of the components that contact the air sample prior to the canister become contaminated and compromise subsequent samples. Samplers should be flushed with zero air or clean nitrogen between samples. Appendix 4 discusses protocols that can be followed to address and prevent sampler cross-
25

WSC POLICY #02-430
contamination. Concentration/desorption procedures for canister samples are very similar to those used for adsorbent trap samples. The capability of taking multiple aliquots from canister samples is an advantage of the method. The expense and size of canisters and their accessories are considerations in choosing between canisters and adsorbents.
3.2.3 Use and Handling of Tedlar Bag Samples
MADEP has occasionally seen Tedlar bags used to collect indoor air samples. This practice is not generally recommended for sampling of the indoor air, except in cases when field analytical methods are used (as discussed in Section 3.1.2) and analysis can be accomplished within a few hours. In field monitoring methods in which a portable GC is brought to a site, the sample can be analyzed quickly. Conversely, samples that are transported back to a laboratory for later analysis often exceed recommended holding times for this method of collection. It has been shown that high concentrations of contaminants in contact with a Tedlar bag for greater than twelve hours may react with the bag and be unrecoverable for analysis. This problem has been found to be particularly significant with higher as opposed to lower contaminant concentrations. High moisture levels may also interfere with sample recovery. Thus, when samples are collected for transport and later analysis, MADEP recommends that indoor air sampling be conducted using either a pumped air collection method with adsorbent media tubes or evacuated canisters.
If an investigator chooses to use Tedlar bags despite the potential problems discussed above, then it is highly recommended that he or she take steps to demonstrate the adequacy of the data collected using this method. Documentation that the samples have been analyzed within the recommended holding time should be submitted. In addition, percent recovery (% R) data should be collected and submitted as an indicator of the degree to which wall interactions and moisture might result in sample recovery problems (i.e., matrix effects). When the sampling matrix is a Tedlar bag, %R can be determined by charging the Tedlar bag with a known gas, either a calibration standard or Standard Reference material (SRM), holding it for similar time as samples and then analyzing it. For samples taken under extreme conditions (i.e., excessive humidity, oily mist, etc.) a partially filled sample bag (with a known sample volume) could be spiked with a known concentration and volume of a calibration/SRM gas mixture and analyzed along with an unspiked sample. These results could be compared and %R calculated. Section 7.4 on Analytical Quality Control provides additional discussion on this parameter.
One possible use of Tedlar bags could be to collect “back-up” samples. For example, the Tedlar bags could be used to provisionally collect (with short holding times) additional samples to supplement thermal desorption tubes or Summa® cans. Applications include instances in which dilutions are needed and not possible (as with thermal desorption tubes) or to evaluate highly contaminated soil gas samples in an effort to preserve the integrity of Summa® cans (as discussed in Section 5.7.2).
It should be noted that Tedlar bags should never be reused. Once used to take a sample, they should be discarded.
3.2.4 Passive VOC Sampling for Longer Term Durations
26

WSC POLICY #02-430
MADEP suggests use of passive diffusion badges for the characterization of longer-term duration (up to three weeks) average concentrations of VOCs. These simple sampling devices may be more practical than other methods from a cost and logistical viewpoint for routine, longer-term indoor air sampling. To date, commercially available badges containing charcoal as the absorbent medium have been used. As with active time-weighted samples, the chemicals are first desorbed from the badge’s sampling medium and then are analyzed using gas chromatographic techniques. In general, MADEP has found good agreement between results from badges and pumped samples, and good precision.
There are several recognized potential problems with these types of passive samplers which include effects of higher humidity, back diffusion off the sampling medium, interferences between compounds and high blank values for benzene, styrene and sometimes toluene. Further development with the application of these types of samplers to indoor air VOC characterization should address these issues.
3.3 Available Formal Air Monitoring Methodologies
As discussed in the above sections, there are a variety of techniques that can be used to measure levels of contaminants in the indoor air. A number of these techniques have been incorporated into formal methods that have been developed for identification and quantification of pollutants in air. Two collections of methods which are commonly used to sample/analyze indoor air are the EPA Compendium of Methods for the Determination of Toxic Organic Compounds in Ambient Air (EPA, 1984) (also commonly referred to as the “TO methods”) and the Compendium of Methods for the Determination of Air Pollutants in Indoor Air (EPA, 1990) also commonly referred to as the “IP methods”). The VOC IP methods are essentially the same as the comparable TO methods (e.g., TO-1, TO-2, TO14/15/17, etc.) which have been adapted to the indoor application. In addition, the MADEP has recently developed a method for the determination of the volatile fraction of petroleum hydrocarbons in air (e.g., the air-phase petroleum hydrocarbons (APH)) (MADEP, 2000).
The TO methods (method TO-1 – TO-17) were developed for ambient air studies but can be easily adapted for use in conducting indoor air studies. In MADEP’s experience, Methods TO-1, TO-2, TO-14, TO-15, and TO-17 are the most commonly used TO methods for the sampling and analysis of indoor air impacted by contaminated waste sites. A summary of these more commonly used methods and the types of compounds for which they are appropriate is included in Table 3. Appendix 1 provides summaries of all the TO methods in which the advantages and disadvantages of all the TO methods are provided. The MADEP Air-Phase Petroleum Method (APH) which is a modified version of EPA Method TO-14 characterizes the volatile fraction of petroleum hydrocarbon mixtures.
The IP methods include Methods IP-1A through IP-10B. This compendium of methods was compiled for the EPA from the best elements of methods developed or used by various research or monitoring organizations. EPA notes however that although these methods are presented in a standardized format and each has been extensively reviewed by several technical experts having expertise in that method, the methods are not certified and should
27

WSC POLICY #02-430
not be regarded as officially recommended or endorsed by the EPA. As advancements are made to the methodology, current methods for other contaminants may be added as they become available. According to the EPA, nearly all of these methods have some degree of flexibility in the procedure. Therefore it is the user’s responsibility to prepare standard operating procedures (SOPs) for the particular methodology used by the laboratory. The MADEP encourages the use of performance-based methods which necessitate a higher level of QA/QC than would an established EPA method. Recommended guidance for meeting performance criteria is available from EPA (US EPA, July, 1996). A summary of the methods included in this compendium and the types of compounds for which they are appropriate is also included in Table 3.
The TO-14/15 and IP-1A Methods both use Summa® evacuated canisters whereas the TO-1 and IP-1B methods use adsorbent tubes. Both types of method have advantages and disadvantages. Both the evacuated canister and adsorbent tube methods allow for the collection of integrated samples over a specified time period. With canister methods, a sufficient volume can be collected to allow for the assessment of measurement precision and/or analysis of samples by several analytical systems. These methods are not limited by the “breakthrough” capacity of the collection method as are methods using solid sorbents. This feature is of particular merit when sampling is conducted in areas of unknown or variable concentrations. The primary advantage of adsorbent tube methods may be that they have been validated for more compounds than the canister methods. However, the adsorbent tube methods are limited by the fact that they are overall more complex and difficult to use than the canister methods. The final steps in the analytical process for the adsorbent tube methods are similar to the canister methods except thatthe compounds must be thermally desorbed from the adsorbent tube before injecting it into the gas chromatograph and that each cartridge can be analyzed only once (EPA, 1992a). Additional information on these methodologies is found in Section 3.2 of this document. The analytical equipment used in conjunction with these methods is discussed in section 6.0 of this document.
Table 3. A Partial Listing of Sampling and Analytical Methods Applicable to Indoor Air
Method Description Types of Compounds Determined
28

WSC POLICY #02-430
NumberList of TO Methods
TO-1 Tenax GC Adsorption and GC/MS or GC/FID Analysis
Volatile, nonpolar organics (e.g., aromatic hydrocarbons, chlorinated
hydrocarbons) having boiling points in the range of 80C to 200C.
TO-2 Carbon Molecular Sieve Adsorption and GC/MS or
GC/FID Analysis
Highly volatile, nonpolar organics (e.g., vinyl chloride, vinylidene chloride,
benzene, toluene) having boiling points in the range of –15C to 120C.
TO-14 Specially-Prepared Canister and GC/FID/ECD or GC/MS
Detection
Volatile, non-polar organics (e.g., toluene, benzene, chlorobenzene)
TO-15 Specially-Prepared Canister and GC/MS Analysis
Volatile, polar and non-polar organics(e.g., methanol, benzene, xylene,
nitrobenzene)TO-17 Multi-Bed Adsorbent Tube
Followed by GC/MSVolatile, polar and non-polar organics
(e.g., alcohols, ketones, benzene, toluene, o-xylene, chlorobenzene)
MADEP Air-Phase Petroleum MethodAPH Summa® Passivated Canister
Sampling and GC/MS AnalysisAir-phase petroleum hydrocarbon fraction analysis (MADEP, 1999)
List of IP Methods IP-1A Stainless Steel Canister Volatile organics (e.g., aromatic
hydrocarbons, chlorinated hydrocarbons) having boiling points in
the range of 80 to 200C.IP-1B Solid Adsorbent Tubes Same as Above
Sources: (EPA, 1984; MADEP, 1999; EPA, 1990)
29

WSC POLICY #02-430
Examples of Collection Equipment
(SKC, Inc.)
Figure 8. Pumped Sample Collection Method With Adsorbent Media Tubes
(Xon Tech, Inc.)
Figure 9. “Summa”® Canisters
(SKC, Inc.) (3M United States)
Figure 10. Passive Badge Samplers4.0 SOURCES OF INDOOR AIR CONTAMINATION
30

WSC POLICY #02-430
Indoor air concentrations of VOCs are influenced by many factors. In addition to the input rate of the chemicals from their source, concentrations are also influenced by the degree of ventilation in the building and the input rate of other sources in and near the building. Because of these factors, it is important to make some observations about the indoor environment to be sampled. This is especially important during a study in which the goal is to determine whether contaminants may be infiltrating the indoor air from an outdoor source of contamination such as groundwater, soil gas or ambient air.
4.1 Pre-Sampling Investigation
While a detailed quantitative evaluation of the factors influencing indoor air contamination is not necessary, a qualitative assessment of their importance in the indoor environment under study would facilitate data interpretation. Such an evaluation can take the form of a simple walk-through evaluation during which time observations can be made about potential indoor sources of the particular compounds under study or about other influencing factors. In addition, a questionnaire can be administered to building occupants to obtain information regarding possible sources of the compound(s) of interest. Appendix 2(a) contains an example of a questionnaire that might be used in conjunction with conducting indoor air sampling in a building. In addition, Appendix 2(b) contains a list of instructions for occupants of buildings which should be followed preceding and during an indoor air sampling study to ensure its success. The elements to be incorporated in such a survey should be site-specific but should involve consideration of potential influencing factors.
4.2 Factors Influencing Contaminant Concentrations in Indoor Air
A number of factors influence contaminant concentrations in indoor air. The following is a compilation of some of these factors. Although these parameters are listed separately, it is acknowledged that the interplay among all of these factors ultimately influences contaminant concentrations in the indoor air. While the following information is qualitative, it can be helpful in interpreting results of indoor air monitoring, in particular when comparing the results of multiple sampling events.
1.) Outdoor air - The indoor air enclosed by a structure is an extension of the surrounding ambient air. All structures are characterized by a particular air exchange rate in which outdoor air replaces indoor air. Thus, outdoor air contaminant concentrations will influence to some degree the indoor air concentrations of contaminants. This exchange is influenced by a number of factors including proximity to outdoor sources of pollution, meteorology and the topography of the surrounding area in influencing the distribution of pollutants in the area. A notation with regard to each of these categories should be made if it is relevant to the situation under study.
2.) Indoor Air Sources - Indoor air sources of VOCs are numerous. VOCs are emitted from a variety of household products and activities of residents. VOCs have been shown to offgas from a large variety of building materials such as pressed-wood products and fiberboard, and to be released from a large number of household products such as cleansers, insecticides and solvents, hobby supplies such as paints, glues, etc. and personal products including deodorants,
31

WSC POLICY #02-430
cosmetics, sprays, etc. Cigarette smoke is known to contain many VOCs which may concentrate in indoor air. Buildings with attached garages or solvent storage areas (e.g., basements, crawl spaces) have also been shown to have higher indoor VOC concentrations.
It is becoming increasingly obvious that factors related to building construction, product storage/usage and indoor activities could predominate over outside sources in determining indoor pollution levels. As the quality of the ambient air improves due to Clean Air Act initiatives, the quality of the indoor air relative to the outdoor air may appear even worse. Factors which influence indoor source strength include use patterns of occupants, age of emitting material, temperature and relative humidity.
To obtain additional information on potential emissions from household products, Material Safety Data Sheets (MSDS) for these products can be requested from their respective manufacturers. Under the Federal Emergency Planning and Community Right To Know Act (EPCRTKA), industry must submit MSDS(s) to consumers in response to requests for information on the content and potential health effects of the product(s).
3.) Location and Characteristics of Groundwater and Soil Gas Contamination - With suspected sources of groundwater and soil gas contamination, the physical and chemical properties of the COCs relative to the media in which they are contained will influence the concentrations of these chemicals in the indoor air. The concentrations of these contaminants in groundwater is the first important variable. In addition, the Henry’s Law coefficients of the COCs provide an indication of their tendency to partition from the groundwater to the air spaces in the overlying soil.
The depth of the groundwater table relative to the surface of the soil and the depth below the building structure are two important variables in terms of how far and how quickly the COCs may diffuse and/or enter the indoor air. The physical characteristics of the soil (e.g., permeability, organic content, etc.) also influence the degree to which this contamination may impact the indoor air. In addition, the presence and location of utility and electrical conduits in proximity to groundwater and soil gas may influence preferential migration pathways (other than the direct route via soil and/or groundwater) of contaminants to the indoor air.
4.) Air Exchange Rate - The rate at which outdoor air replenishes indoor air is known as the air exchange rate. The air exchange rate in a building is mainly determined by three processes, including infiltration, natural ventilation and mechanical ventilation. Infiltration describes the leaking of air through non-airtight sections of the building including in and around window frames, through cracks around doors, windows or the foundation, through construction joints or from crawl spaces underneath a building. Natural ventilation describes the movement of air through open doors and windows. Mechanical ventilation describes any system or device which mechanically moves air through a building (from fans which vent indoor air to the outdoors to complex systems which control quantities of indoor and outdoor air or that remove pollutants from the whole building).
The average air exchange rate in homes in the United States ranges from 0.7 to 1.0 air exchanges per hour (ach). In relatively airtight homes (such as might be found in New England and other areas with cold winters) the ach can be as low as 0.2 or 0.3. In “leaky” homes, the ach
32

WSC POLICY #02-430
can be as high as 2.0 (EPA, 1988a). An ach of 1.0 does not necessarily imply that in one hour all existing air pollutants will be removed. The removal of air pollutants is achieved through a gradual dilution process influenced largely by the air exchange rate but also affected by the chemical properties of the pollutant and other factors as described below.
5.) Pollutant Depletion Mechanisms - VOCs in the indoor air may be removed from the air through a number of mechanisms including atmospheric conversion, in which the compound undergoes a chemical transformation, or adsorption of the volatile onto indoor surfaces.
6.) Features of Buildings and Surrounding Grounds - Every building has unique features that influence how contaminants may enter and be distributed through it. Important factors which may influence these parameters include building size (area of building footprint and area of below-grade walls), construction type (slab-on-grade, crawl-space or basement), basement wall construction type (poured concrete or hollow block and number of stories) and the presence of obvious cracks in floors or walls in contact with soil (EPA, 1992a). Such cracks will exist in the future even if they don’t currently exist. The presence of chimneys and flues will create a “stack effect” which, as discussed below, is a process by which air is drawn into building at lower levels and exhausted out of the stack at high levels. In addition, a building which has exhaust fans and vents and/or contains gas or oil furnaces producing combustion air, generally develops a negative pressure (as discussed in #7 below) relative to the ambient environment and may preferentially influence the intrusion of soil gas to the indoor air.
The type of ground cover (e.g., grass, pavement, etc.) outside the building may also influence concentrations of VOCs in indoor air. Impermeable ground covers such as pavement may cause vapors to collect in these areas.
7.) Meteorological Factors - Meteorological factors influence the penetration and distribution of pollutants into a structure as well as its air exchange rate. Four important parameters to consider include temperature, wind, barometric pressure and moisture.
The temperature differential between the inside and outside of a building influences the penetration of a pollutant into the building as well as its circulation through the building. In cold weather, heated air within a building will rise. As a result, a stack effect will be created in which outdoor air will be drawn into the building at lower levels, will be distributed throughout the building and will be exhausted through leaks in the upper levels of the structure. Under such conditions, the likelihood that soil gas will be taken in through basement and lower levels will be increased.
Wind also produces a pressure differential between the upwind and downwind sides of a building and can thus also affect air exchange rate and pollutant distribution in indoor air. On a windy day, the wind
exerts a pressure to the outside of the building relative to the inside, thus creating a condition of underpressurization within that building and causing air to be drawn into the building (potentially containing contaminants). Differences in barometric pressure can also influence the
Figure 11. Temperature
Gradient
33

WSC POLICY #02-430
relative pressure differential between the inside of a building and outside, thus influencing contaminant flow as well.
Moisture, whether it originates from indoors or outdoors can affect the permeability of structures (e.g., causing swelling of window and doorframes, reducing infiltration). Rainy, wet conditions are generally considered to be favorable for the entrainment of soil gas into a building. In the typical rainfall scenario, soil becomes saturated with rainwater around a building (as a result of rain dripping off the roof of the structure). Underneath the building, the ground is typically drier. In such a scenario, soil gas overlying the vadose zone will not be able to diffuse through soil pores as these are already occupied by rainwater. As a result, the soil gas tends to migrate towards the drier soil which lies underneath the foundation of the building, thus increasing the likelihood that it will enter the indoor air through advection or diffusion. It should be noted that under extremely wet conditions, a groundwater lens may occasionally form over the contaminated plume in the vadose zone, in effect acting as a barrier and not allowing soil gas to diffuse further. A site-specific hydrogeological evaluation of the site should always be conducted to determine the nature of the contamination relative to its hydrogeology.
Meteorological factors can also influence release of contaminants from soil to indoor air. In the winter, when the ground is frozen, soil gas that may become trapped under ice and snow may tend to preferentially migrate toward the warmer, thawed area underneath the foundation of a building, increasing the likelihood that it will enter that building. When this frost layer thaws in the spring, trapped soil gas may also be released. Some of the worst cases have involved warm early spring rains which have thawed the ground and released pent-up VOCs (gasoline vapors) (McGrath, personal communication). 8.) Pressure Differentials – Building characteristics as well as meteorological factors are especially important in determining the pressure of a building relative to the pressure in the ambient environment. The tendency of VOCs to diffuse through soil into the indoor air is greatly influenced by differences in pressure. Extremely small differences in pressure are significant in the evaluation of soil gas intrusion. VOCs in soil generally tend to partition to the vapor phase, diffuse to fill the soil pore spaces and then migrate via diffusion or advection towards an area of lower concentration or pressure, along the underground pathways of least resistance. In an undeveloped area, these VOCs generally diffuse out of the soil and into the ambient air. However, if there is a building overlying or in the vicinity of this soil, and the building is of negative pressure relative to the surrounding environment, the building will act as a “pressure sink” and will tend to draw soil gas towards it.
There are many complex and variable mechanisms and factors that may create pressure differentials. As discussed in #6 and #7 above, temperature, wind and barometric pressure differences as well as structural features of the building may influence pressure differentials.
Figure 12. Rainy Weather
34

WSC POLICY #02-430
Building underpressurization leads to a “pressure coupling” effect in which soil gas pressures surrounding the building decrease, resulting in a pressure gradient and either advective or diffusive flow towards it into the building. Soil gas can enter the air of a building by diffusing directly through the cement of a building foundation. An underground basement is especially vulnerable to such a process. The more common infiltration mechanism by which VOCs enter the indoor air is advection. Advection is the process by which soil gas penetrates foundations, etc., through cracks in masonry foundations. Small perimeter cracks which often form in poured concrete foundations at the intersection of the footing/wall/slab are of particular concern. Other entry points include the “annulus space” between the foundation and incoming utility lines as well as shear, setting or shrinking cracks which may form over time within the walls or slab (MADEP, 1995b).
Temperature and pressure are closely linked in influencing the flow of soil gas into indoor air. In the scenario discussed in #7 above, during winter conditions, soil gas trapped under frozen ground may be diverted to a building’s foundation and may infiltrate the indoor air through one of the processes discussed above. This soil gas intrusion is even further exacerbated by the fact that in the colder weather combustion furnaces will be operating, producing temperature and resulting pressure gradients as discussed in #7, and outside ventilation will be at a minimum, producing favorable conditions for soil gas intrusion. During such a scenario in the winter, it may even be possible for diffusion to occur through a slab-on-grade foundation (MADEP, 1995b).
The degree to which such infiltration may occur is influenced by a number of factors, including the moisture content of the vadose zone and the depth of the building foundation. Seasonal changes in vadose zone moisture content will influence soil/air permeability in near-surface soils (less than 1 meter below grade). It has been reported that soil moisture and permeability conditions remain reasonably constant at depth and that little seasonal change in pressure-coupling effects will be observed in structures with full basements (MADEP, 1995b).
Conditions producing over-pressurization of a building relative to outdoor ambient pressure occur when indoor temperatures are lower than outdoor temperatures and winds are calm. Under these conditions, contaminants will not readily flow into a building and may actually flow out.
9.) Preferential Migration Pathways – In contrast to the area-wide diffusive/convective transport mechanism envisioned in the classic groundwater contamination scenario, another transport mechanism which may influence contaminant concentrations in indoor air is the preferential migration pathway. This method of contaminant intrusion involves flow of contaminants alongside and within utility lines and annular spaces of utility lines, with subsequent discharge of VOCs to indoor air. MADEP has noted that the contaminants involved are often petroleum, usually gasoline. This is attributed to the fact that gasoline constituents are generally the lighter hydrocarbons that may float at the water table interface, which is also the zone where horizontal preferential pathways are most plentiful (e.g., utility lines).
The most common preferred flow path is within and adjacent to the backfill of utility lines. It is MADEP’s experience that the utility involved is usually a sanitary sewer line that is
35

WSC POLICY #02-430
the conduit for indoor air quality problems, given their universal presence and their direct connection to structures. In contrast, other potential flow paths (such as alongside underground telephone and electrical utilities or via storm drains) may not have this direct connection and thus may represent less common flow paths. The annular space of the utility line entry into a structure (typically the basement) represents the discharge points of vapor. Also, in some cases, VOCs infiltrate and move within a utility conduit. In at least one site in which the MADEP was involved, VOCs were entering a home through a faulty plumbing system. In this case, gasoline fumes were entering the bathroom while occupants were showering because of the loss of a water seal in (non-code) drainage plumbing.
Flux rates are often transient, influenced by, among other factors, precipitation and recharge, water table fluctuations and barometric and temperature fluctuations. Such fluctuations can result in variable concentrations. For example, in the case of petroleum contamination moving though sewers and drains, such fluctuating conditions can lead to sporadic odor complaints.
5.0 SAMPLING STUDY
Once the objectives of the indoor air study have been established and a sampling method has been chosen, the details regarding how, when and where the sampling is to be implemented must be worked out. To obtain a representative estimate of a concentration to which a person is likely to be exposed over time in a building, sampling locations, times and methodology should be planned carefully. A number of indoor air sampling considerations are discussed below. Table 7, which follows Section 5.8, summarizes some of the key steps involved in conducting a sampling study for a groundwater contamination scenario.
5.1 Sampling Conditions
The successful sampling study should yield a representative estimate of contaminant concentrations in the indoor air in the building for the exposure period of interest (see Section 5.2 for additional discussion on exposure periods). As discussed in Section 4.2, a number of factors may directly influence airflow and the concentrations of chemicals in the indoor air. As a result, contaminant concentrations are likely to fluctuate to some extent on a continuous basis. However, certain sampling conditions are not controllable by the investigator whereas others are totally influenced by the activities and actions of the occupants. Ultimately sampling conditions should be established which reflect a balance between targeting the questions that need to be answered for that situation and meeting a realistic timetable for the project.
5.1.1 “Worst-Case” Versus “Actual” Conditions
One parameter that must be determined before the sampling program is initiated is whether sampling conditions should be representative of “worst-case” conditions or whether they should reflect “actual” conditions. As is discussed further in Section 5.3, this determination
36

WSC POLICY #02-430
should be made based on study objectives, taking into consideration the desired exposure duration and frequency.
To obtain an estimate of chronic exposure, the sampling approach should involve multiple sampling components over several seasons. In this case, it would be appropriate to establish “actual” exposure conditions using a common sense approach as is discussed in the section below. Similarly, if the exposure of interest is a several-month period of time or will serve as the basis for a decision regarding short-term hazard, sampling during “actual” conditions within the guidelines provided in this document would also be justifiable.
On the other hand, if time constraints are such that the results of a single sampling event must be used as a basis for estimating chronic exposure, it is generally recommended (unless this approach contradicts study objectives) that sampling be conducted under “worst-case” conditions. For purposes of ruling out the indoor pathway under the MCP, sampling must be conducted under worst-case conditions, including seasonal considerations. (See Section 5.3 for additional discussion on this issue.) Thus, the study sampling design should consider the difference between “actual” and “worst-case” exposure conditions in establishing the appropriate study conditions to meet objectives.
5.1.2 Sampling Conditions that are Indirectly Controllable
In establishing the appropriate sampling conditions, it is acknowledged that there are some parameters that are outside of the direct control of the investigator. As discussed in Section 4.2, meteorological and climatological factors comprise a large component of this potential variability. One way in which less than ideal meteorological conditions can be indirectly handled might be to schedule sampling to coincide with more desirable sets of conditions.
For example, the EPA recommends that with a groundwater or soil-gas source of contamination, a worst-case condition for sampling indoor air exists when the indoor temperature is at least ten degrees warmer than the ambient temperature and wind speeds are steady and exceed about five miles per hour. Under such conditions, reasonable air exchange rates and underpressurizations are created. Alternatively, the least conservative conditions would be created when the indoor air temperature is lower than the outdoor temperature and winds are calm. Under these conditions, soil gas entry into the lowest levels of a building may be restricted or eliminated.
If sampling is conducted during a rain event, VOCs (especially those with low water solubility) are diverted from the wet soil around a building to drier soil underneath a building as soil pores become occupied with water. The wet conditions may also bring the water table contaminants closer to the building. A combination of cold weather (e.g. early spring in which temperatures are in the 30s or low 40s) creating underpressurizations and convective flux into the building (as described above), together with conditions in which the ground is well saturated from recent or ongoing rains, should theoretically increase the influx of contaminants to the indoor air. Limited available evidence suggests that such a scenario involving rainy, cold
37

WSC POLICY #02-430
weather may result in significantly higher indoor contaminant readings than either dry or cold weather independently (CTDEP, 2000).
Additional factors should also be considered in determining a best time to sample to meet objectives. With a groundwater contamination case, selection of best time to monitor should also include seasonal considerations. In spring, in conjunction with the runoff from thawing ice and snow, water tables are usually at their highest. During periods of little rainfall or drought, water tables will be at their lowest. Temperature also has seasonal fluctuations and, as discussed above, can influence the infiltration of contaminants into a building. See Section 5.3 for additional discussion on seasonal considerations.
With a situation in which ambient air is the suspected source of contamination, the issue of when to sample should also be based on consideration of meteorological conditions (e.g., wind, temperature, etc.) or other pertinent effects such as the days on which a particular source may be more likely to be emitting contaminants. Thus, in the case of a gasoline station for example, the hours of operation or perhaps the days on which refilling of storage tanks occurs would be important to consider.
The timing of sampling to coincide with more appropriate sampling conditions requires
some flexibility in schedule. Sometimes this flexibility is not an option. Some projects may be constrained by strict schedules and often factors such as meteorology and facility operating schedules do not cooperate to accommodate such schedules. In such cases, the best approach to take is to select the most representative schedule to target sampling objectives and then record the meteorological parameters and other conditions discussed above to facilitate subsequent interpretation of the monitoring results.
5.1.3 Controllable Sampling Conditions
In contrast to the sampling parameters discussed above that are not directly controllable, there are other sampling conditions that are directly controllable by the occupants of the building to be tested and/or the investigator. These parameters generally include actions taken and activities occurring in the indoor environment.
Monitoring should not be done while pollutant-generating activities (especially those in which the same pollutants will be generated as those being monitored) are taking place. Indoor activities such as smoking, and use of sprays, solvents, paints, etc. should be suspended during this time. Outdoor activities such as lawn mowing, painting, asphalting, sanding, etc. should also be suspended during this time (depending on the pollutants being generated).
In addition, to the extent possible, indoor sources identified as potential contributors of VOCs to the indoor air should be removed, if feasible. While it is acknowledged that it is not practical to suggest that every object or household product identified as “a potential source” be removed from a building, it is noted that there are often blatantly obvious sources of contaminants, especially sources that might be off-gassing the same compounds as the COCs being investigated, which may be removed easily if identified. Such sources might include, for
38

WSC POLICY #02-430
example, recently dry-cleaned clothing or solvents or other products which are improperly stored or noticeably off-gassing.
Several other important parameters that are under the control of the investigator are listed below. It is recommended that manipulation of these factors be determined based upon study objectives and common sense in accordance with the general guidance presented in this section.
Should windows and doors be kept closed during sampling?
The underlying purpose of essentially “sealing the building” is to minimize dilution of contaminants and build up contaminant concentrations, thus achieving conditions typical of a worst-case. In this way, the potential for detecting air contaminants if they are present is maximized. A worst-case sampling scenario may be appropriate for evaluating long-term exposures. Use of a worst-case sampling scenario for such a situation allows for any fluctuations in conditions that may exist over a longer period of time.
To achieve a worst-case type scenario, it is often specified that the building to be tested should be sealed (i.e., windows and doors should be kept closed) during this time, and if possible, for a period of at least twenty-four to forty-eight hours before monitoring is conducted.
Although evaluation of worst-case exposures may be the objective for some studies, this endpoint is not always the main objective. Such a situation might be the case when evaluating data for subchronic exposure situations or short-term hazard evacuation decisions. Such an evaluation focuses on current short-term exposures and thus should be based actual data. Often, a more realistic exposure estimate is sought. In part, the decision as to whether the building should be sealed depends on the typical habits of the occupants. If an occupant usually keeps the building tightly sealed, then opening several windows and a front door would not be “typical” for that particular occupant whereas it could be quite representative for another individual who usually has several windows open. Common sense should dictate the final action to be taken. For example, leaving several windows open on an extremely gusty and windy day would probably not be a representative scenario.
Another issue related to this discussion is that of health risk. If there is a potential for high concentrations of contaminants in the building, and there are occupants in that building, sealing the building may actually exacerbate health risks. Ultimately, the health of the occupants is of primary concern and the building should not be sealed if by doing so the health of the occupants will be jeopardized.
Should mechanical ventilation systems be operated during sampling?
In the interest of sampling under realistic conditions, it is generally recommended that mechanical ventilation systems be operated in a manner consistent with the usual pattern of
39

WSC POLICY #02-430
operation for that building. However, common sense should be used in determining these conditions.
There are certain facts that should be considered. Often, investigators, in an attempt to minimize potential dilution of contaminant concentrations in indoor air, will recommend turning off all mechanical ventilation systems during sampling. While this approach may be quite defensible in the case of mechanical fans installed in open windows, this may not always be true such as in the case of a mechanical system which draws make-up air from the basement and circulates it to other parts of the building. An example of such a system is a forced hot-air heating system. Operation of such a heating system produces temperature and pressure differentials and may actually have the tendency to draw contaminants into the building. The pressure differential between inside and outside a structure is greatest when windows and doors are kept closed and the heating system is operating. In such a case, the heating system will create a stack effect which draws contaminants into the building. In addition, gas and oil-fired heating systems generally use air in the building (when good make-up air is not provided) to support combustion, thereby further increasing the pressure differential.
In New England, operation of a mechanical heating system would appear to be the norm in the colder months. While the use of ventilation fans during the summer may also be typical for some residents, increased ventilation may dilute samples. Thus, suspension of such ventilation may be more justifiable for a short period of time during which monitoring is conducted than would turning off the heating system. Having a highly diluted sample could potentially defeat the purpose of doing sampling in the first place. Ultimately, common sense should be used to obtain a sample that is reasonably realistic relative to the norm for New England and the norm for that building.
Should certain parts of the building be isolated while indoor air monitoring is being
conducted?
When the objectives of a study include the investigation of microenvironmental effects, the question as to whether certain parts of the building should be isolated arises. The source potential of the microenvironment of interest may be determined by closing the door leading to the particular area of interest within the study building and sampling that area.
One common example of this issue arises in the case of residences with basements. Often, the goal of monitoring the indoor air is to obtain health-relevant information for use in calculating potential health risks. Typically (but not always), in the case of an indoor air contamination case in which groundwater is the source, basement contaminant concentrations are the highest. Based on the assumption that the door leading to the basement from the living area is usually kept closed, it is usually recommended that if there is a door to the basement, that it is kept closed during sampling. Under this same assumption, it is generally recommended that doors separating source areas from living areas be kept closed. In this way, infiltration of contaminants to the living area is minimized. This measure not only minimizes health risks but it also permits calculation of health risks by floor. In addition, if the higher basement contamination is isolated, it may be easier to limit exposures in certain parts of the building to reduce overall exposure to the contaminant(s) being investigated.
40

WSC POLICY #02-430
Ultimately, the decision as to whether or not to close off source area doors should be made in accordance with the objective of the sampling study. If the goal is to get an estimate of exposures experienced during typical conditions for that building, then these conditions should be simulated. Under such an objective, isolation of these areas during sampling should only be done if these areas are usually isolated under typical conditions. If these areas are typically not isolated and the doors separating them will be opened as soon as sampling ends, then these areas should not be isolated during sampling.
Appendix 2 contains an Indoor Air Building Survey that can be used as a checklist when performing an investigation of an indoor location to be sampled. Table 4, below, provides a listing of some default exposure conditions for a groundwater contamination source.
Table 4. Default Exposure Conditions for a Groundwater/Soil Gas Contamination Source
Parameter Most Conservative Conditions Least Conservative Conditions
Season Late winter/early spring SummerTemperature Indoor – 10oF > than outdoors Indoor temp. < outdoor temp.
Wind Steady; > ~5 mph CalmSoil Saturated with rain Dry
Doors/Windows Closed OpenMechanical Heating System Operating Off
Mechanical fans Off On
5.2 Sampling Duration
Whatever the duration of an indoor air-sampling event (from several hours to several weeks), the results are usually used to represent exposures that occur over much longer periods of time (from several months to a lifetime). In planning the duration of a sampling event, a balance must be struck between the need to collect samples that are reasonably representative of the desired exposure and the financial and technical constraints of available technologies.
The duration of a particular sampling study should depend in part on the nature of the contaminant source. Some sources are more constant whereas others may be more variable. An example of a relatively constant source might be contaminated groundwater releasing VOCs to the indoor air (although temperature and barometric pressure may affect the rate). A more intermittent source might be a stack from a nearby facility that releases VOCs for a certain number of hours per day according to the facility's schedule of operation. Ideally the most representative sample would be obtained with a duration equal to the actual exposure time. Sometimes such a sample can be tailored to a defined, specific exposure (e.g., such as a six-hour schoolday). However, such real-time exposures are often impractical due to resource constraints; therefore the next best approach is to use a sampling time which is representative of the exposure but not necessarily of the same duration.
41

WSC POLICY #02-430
With a relatively constant source, it is assumed that contaminant emission rate and
ultimate concentration does not fluctuate; thus a shorter duration time (i.e., several hours of sampling) would be representative of a 24-hour period.
With a source that does not have a constant contaminant source, a two-component sampling period involving subchronic and chronic sampling durations is suggested. A short-term sampling component should be conducted to produce average concentrations of the monitored compounds averaged over as close to 24 hours as practicable. This component could be supplemented by a longer-term sampling component on the order of several weeks in duration. One practical way to obtain an estimate of longer-term exposure is to use a passive sampler. In addition, depending on the situation and the magnitude of contamination, acute exposures and risks may also need to be assessed. Acute sampling may be warranted in situations in which odors are present or for which information on peak exposures is necessary.
As is discussed throughout Section 5, with a groundwater contamination case, a number of parameters may influence contaminant concentration in the indoor air, especially over the long term. In such a case, use of a two-component sampling strategy as described above may yield a more representative estimate of exposure in situations in which it is suspected, based upon site conditions, that contaminant concentrations may be highly variable.
In general, the longer the sampling time, the greater the confidence that the concentration determined from the sample is representative of the true contamination situation. This rule of thumb is especially important when a contaminant enters the indoor air on a more sporadic basis and the source is non-constant. However, in reality, longer samples may be characterized by several problems. Twenty-four hour sampling may be difficult because of the expense, the lack of control over the situation (i.e., tampering, addition of variables or new sources by unsupervised building occupants) and the technical limitations of the available sampling methods. If shorter sampling intervals are used (2 or 4 hours) the flexibility and resources may be more available to resample in the future when conditions are presumed to have changed. There are cases where a wide scope of indoor air sampling may be required, such as in an apartment building. A shorter sampling interval would enable a sampler to cover more locations in one day (and under comparable conditions) than a 24-hour event. Such tradeoffs between sample duration and sampling frequency (see Section 5.3) should be considered when evaluating resources and planning a sampling strategy for a particular situation. Thus, within the limitations discussed above, the following exposure duration guidelines are offered:
Acute Exposures - As is defined in Section 9.3.8, an acute exposure is generally defined as occurring with a time period of less than or equal to twenty-four hours with an observation period not to exceed two weeks. Acute exposures are of interest toxicologically based upon the potential for acute, non-cancer effects and resulting risks associated with such exposures. Grab samples are often used to represent acute exposures but in addition, any exposure period less than or equal to 24 hours would also be appropriate as long as the sampling duration does not exceed the actual exposure time. The MADEP has rarely been involved with the evaluation of acute exposures in indoor air. These sorts of exposures are more pertinent to industrial or occupational exposures. MADEP believes that grab samples would probably be of most value
42

WSC POLICY #02-430
for qualitative and gross quantitative screening or source characterization. If data are to be used for comparison to health-based guidelines or standards or for risk assessment purposes, it is recommended that time-weighted sampling of at least 2-4 hours be used.
Subchronic Exposures - A subchronic exposure for a human is generally defined as a period of time of about two weeks to seven years in duration. Toxicologically, subchronic exposures are of interest based on the potential non-cancer risks associated with such mid-range exposures. To better estimate a subchronic exposure, the sample should also consider longer-term as well as seasonal considerations. Grab samples are therefore not appropriate for representing subchronic durations. Time-weighted average samples of as long a duration as feasible but of at least 2-4 hours would be recommended using a method such as TO-1, TO-2 or TO-14/TO-15. This sampling could be supplemented with longer-term sampling using passive samplers.
Longer-term sampling should strive for a time-integrated exposure estimate over the longest period practicable. Three to four weeks is recommended as a reasonable period for this study. It is usually impractical to obtain an annual sample for this case, and the three to four week period should provide a reasonable estimate of average exposures over a longer time period. Repetition of this measurement during the winter, spring and summer would also provide a picture of possible seasonal variability in exposures.
Chronic Exposures - Chronic exposure durations are essentially of the same type as subchronic except that the number of years exposed is greater, defined to be seven or more years. Toxicologically, chronic exposures are based on the potential for chronic non-cancer and cancer risks associated with such long-term exposure. A similar sampling approach can be used as that used to assess subchronic exposures. Ideally the sampling approach should combine time-weighted average sampling over several seasons with longer-term (i.e., several weeks) badge sampling (see Table 6 for clarification). The time-weighted average samples taken at various times during the year can then be averaged to derive chronic exposure concentrations. There is no practical way to take a long-term (i.e., over a period of years) real-time sample other than to use a continuous monitor to do real-time sampling. If a contaminant source is relatively constant or at least has some periodicity, it is ultimately assumed for the purposes of evaluation that the measured concentrations using the above recommendations are representative of the contamination over the long-term. Table 5 summarizes the sampling durations that MADEP recommends to sample for various types of exposure.
Table 5. Recommended Sampling Durations
Grab 2-24-Hour ~3 Weeks Seasonal Repeated
Acute only for quantitative screening
43
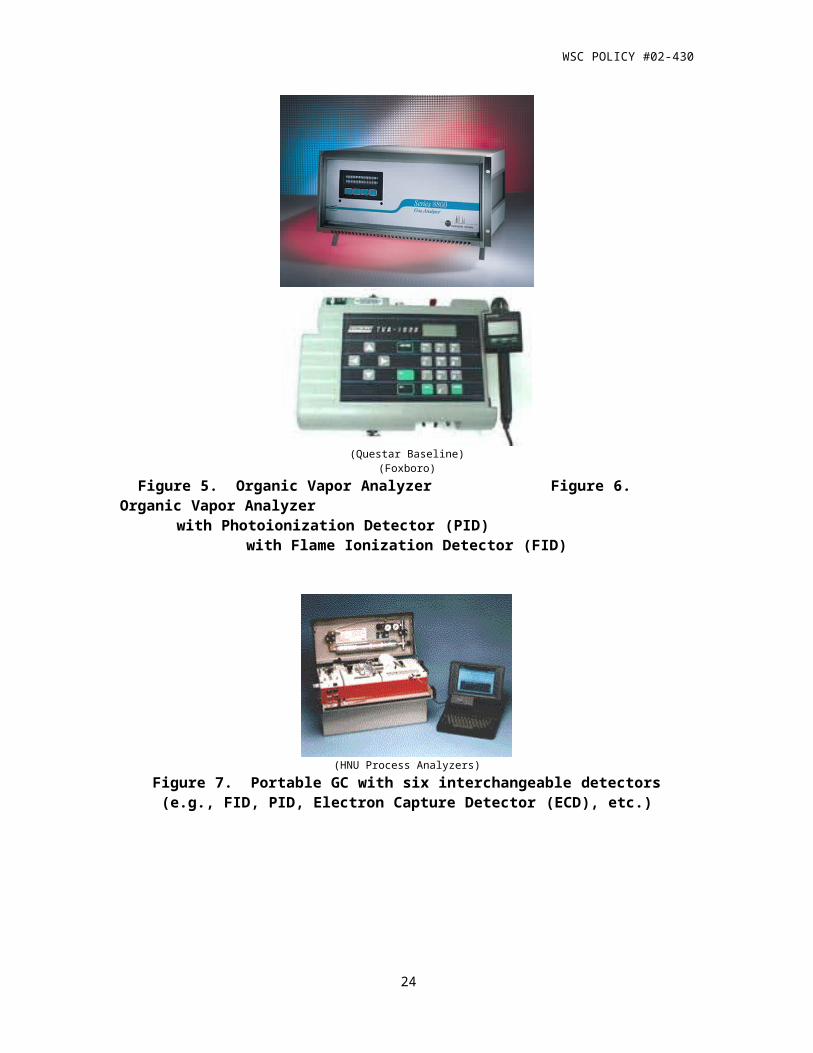
WSC POLICY #02-430
Subchronic Chronic
5.3 Sampling Frequency
The number of times sampling should be conducted (or sampling frequency) is determined by the objectives of the study and the nature of the contamination. In a situation in which the nature of the contaminant source is expected to change fairly quickly, such as for a building impacted by a quickly moving groundwater plume, more frequent sampling would be in order than in a more static contaminant situation.
If the intent is to characterize indoor air quality over a long-term (i.e., chronic) exposure, then a sampling approach should be established to characterize the variability in exposure concentration during this time. A single sampling event will not yield data that are representative of exposure concentrations over a chronic period of time.
Seasonal factors, especially in New England, may greatly influence the concentrations of contaminants in indoor air. Winter conditions typically involve a minimal air exchange rate operation of mechanical heating systems. Such heating systems typically create a stack effect in the building in which make-up air is drawn into the building at lower levels, potentially pulling contaminants in soil gas, etc. in with it. Spring conditions are typically characterized by higher rainfall and snowmelt, which produces higher groundwater tables. In combination with temperatures that are often still cold, necessitating operation of heating equipment, spring in New England often represents worst-case conditions in terms of indoor air contamination from contaminated groundwater scenarios. Summer conditions often involve open windows and use of mechanical ventilation systems. Because of the increased ventilation and air exchange rate, sampling during these conditions may often yield less concentrated indoor air contaminant concentrations in situations where groundwater is a source. However, depending on the situation, if the source of the indoor air contamination originates from ambient air sources (e.g., such as emissions from a gasoline station or other facility), summer conditions may present a period of high exposure. Fall conditions may encompass conditions typical of winter or summer. Early fall conditions are often still warm and summer-like whereas late fall conditions can be wintry. Precipitation amounts vary as well.
The bottom line regarding characterization of indoor air contaminant concentrations is that to characterize exposure over the long term, multiple sampling studies should be conducted during actual exposure conditions. Thus, ideally the sampling data should be obtained over at least three seasons (to include winter and spring) and should, at a minimum, encompass periods of high groundwater (typically during spring in New England); winter conditions such as with the heating system operating with minimal air exchange; and a rain event when the pressure and temperature gradients between the inside of the building and the outdoor environment are maximized (CTDEP, 2000). In this way, the data collected will be representative of a range of conditions, including the “worst-case” time of year.
If indoor air exposure information is needed immediately, during a season and/or meteorological conditions that would not be representative of a “worst-case” time period (e.g.,
44

WSC POLICY #02-430
during summer), then it cannot be reasonably concluded that the results of this one sampling study would be representative of continuous long-term exposure. In such a case, an effort should be made to simulate worst-case exposure situations. One approach that is often taken is to “seal” the building, typically for a period of between 24-48 hours, by closing all doors and windows and shutting down mechanical air ventilation, conditioning and filtration units in order to minimize air exchange in the building. Although this approach may maximize indoor air concentrations detected in this one study, it still may not be representative of conditions during “worst-case” seasonal conditions. This, it is recommended in such a case that this study be followed up with periodic sampling studies encompassing the conditions as described above. Ultimately, the best approach is to characterize variability in indoor air contaminant concentrations by conducting multiple sampling studies under actual conditions during several seasons of the year than to try and extrapolate this information from one study.
Occasionally the purpose of an indoor air study may be to characterize short-term (e.g., several weeks to several months) exposure or to serve as the basis for making a decision on whether a building should be evacuated. Under such conditions, it may be defensible to conduct the sampling study under conditions that do not represent “worst-case”; however, conclusions regarding long-term exposures cannot be made based on the results of this one study. In such a case, the best approach to take is to select the most representative schedule to target sampling objectives and to record the meteorological parameters and other conditions discussed above to facilitate subsequent interpretation of the monitoring results.
In summary, if the objective of the sampling study is to document typical exposures in a building, then sampling in winter, spring and summer should be sufficient. These temporally separated samples will reflect the influence of seasonally dependent variables and the extremes of building air exchange conditions. On the other hand, if the objective is to determine whether occupants of a building are being exposed on a short-term basis to concentrations of indoor air pollutants which would pose an immediate health threat to them, a sampling protocol of increased frequency would be more appropriate. A monthly sampling schedule might be established in this situation as the longer-term monitoring schedule recommended above would not meet this data need. Thus, depending on data needs, periodic indoor air monitoring could be used to follow contamination monthly, seasonally or even from year to year if monitoring is conducted during the same time each year. Ideally, representative samples should be obtained for each set of conditions, such as seasonally. However, if resources only allow for a very limited number of samples, then it is generally recommended (unless this approach contradicts study objectives) that these samples be taken during worst-case conditions, that is, during a time when the concentrations would be at their highest considering such factors as depth to groundwater, heating system operating conditions, and building tightness (closed doors and windows).Finally, if the sampling objective is to rule out the indoor air exposure pathway from the risk assessment requirement under the MCP, then sampling should be conducted during worst-case conditions, which typically occur in the winter.
5.3.1 Confirmatory Sampling or Re-sampling
In addition to temporal, meteorological and seasonal considerations, indoor air sampling frequency may also be influenced by a number of other factors. The determination as to whether
45

WSC POLICY #02-430
the contamination source is still impacting the indoor air and the likelihood of this contamination to increase with time will ultimately influence overall sampling frequency. If long-term contamination trends are being monitored over a period of remediation, for example, then periodic indoor air sampling should routinely be part of the investigation if site information indicates that the contaminant source is still present and impacting the indoor air. Poor sampling and analytical quality assurance/quality control (QA/QC) results may also indicate a need for additional sampling. Finally, although factors such as public pressure and anxiety level should not form the sole basis for determining sampling frequency, the reality of the situation is that these parameters often have a definite influence on increasing the frequency of sampling. The sampling program should be established based on informed discussions among interested parties, including the site manager or Licensed Site Professional (LSP) as well as local health authorities, and all affected parties and responsible parties. In such instances, there often is no easy answer regarding the frequency of sampling and the site manager or LSP must use professional judgment to decide whether and when additional sampling rounds are required.
Our experience has been that most parties have agreed to or have seen the need for final confirmatory sampling of results upon which final decisions are based. Based on these collective experiences, we recommend that at least one confirmatory round of sampling be included to confirm results upon which final conclusions and recommendations are based. However, the factors discussed above may influence the inclusion of additional sampling rounds. Figure 13 below offers some simple guidance to help in the determination of when confirmatory sampling should be obtained.
46

WSC POLICY #02-430
Figure 13.
Sample in response to release.
Do samples meet QA/QC specifications?
Resample
Is there an indicationof site-related contamination?
Has sampling been conducted duringseasonal “worst-case” conditions?
Is contamination expected to getworse with time? Set up periodic monitoring
plan if indicated.
Resample(confirmatory sampling)
Do samples meet QA/QC specifications?
Resample Are results within thesame range as
previous round?
no yes
no
yes
no
maybe or yes
no
no yes
no
Re-sampling Decision Tree
Is there a continuingsource of contamination?
yes
yes
no
Resample and take anynecessary remedial actions.
yes
Resample during seasonal“worst-case” conditions
Site Management Decision
47

WSC POLICY #02-430
5.4 Spatial Considerations
The decision regarding where sampling should be conducted should be made based on the objective of the sampling study. If the goal of the study is to obtain a representative estimate of the concentration to which a building’s occupants are exposed, then several samples should be taken in various parts of the “living area” and weighted accordingly. Section 9.3.3.1 discusses how to calculate a weighted average. The “living areas” are rooms in which the occupants spend the most time. If, on the other hand, the goal is to measure the worst-case (i.e., highest) concentration to which an occupant may be exposed, then sampling might instead be conducted in an area closest to the suspected source of the contamination (i.e., “source area”).
In a building impacted by a groundwater plume, for example, the highest concentration would normally be found in the basement, if there is one, especially in the area of the basement sump and/or along utility conduits. If this is an unfinished basement in a home, primarily used for storage, then the home’s residents might visit it infrequently. If an investigator wanted an estimate of the worst-case concentration, he or she could take samples in the basement, close to the suspected entry point of the contaminants if it can be determined. On the other hand, to obtain a more representative estimate of the concentration to which a resident may be exposed, sampling should be conducted primarily in the living areas, but also in the basement to obtain an estimate of basement exposures. Concentrations representing actual exposures in different areas of the building could then be weighted to yield one exposure point concentration that could be used to evaluate potential health risks. It should be noted that often, the “source” area is also a “living area” such as is the case with a basement apartment.
It is generally recommended that both the occupied (or living) areas as well as basement areas be sampled to identify contamination and to trace contamination in the building. Samples should be taken in a spatial gradient away from the suspected source (e.g., a basement sump opening) in order to determine whether there is a groundwater or other source influence. If there is a closing door that leads to the cellar, it is generally recommended that the door be kept closed during sampling only if this is its usual status. This guideline is suggested in order to have the sampling conditions as representative as possible of normal conditions. Closing the cellar door may reduce airflow from the basement to the living space, lowering air concentrations and therefore, underestimating risk. However, if one of the objectives of sampling is to estimate contaminant concentrations and resulting risks associated with a closed off basement where access should be minimized, then the door should be kept closed. The sampling conditions should reflect the objectives of the study. Section 5.1 above discusses sampling conditions in more detail. Finally, sample collection should be done in such a way as to approximate human exposures: Samplers should be situated in the breathing zone, approximately 3-5 feet off the ground (and lower if the receptors of concern are children as for a daycare center or school). Samples should be taken in a location where there is good air circulation, such as in the center of the room. Representative areas in the building should be selected based upon high activity use areas and near potential pathways (i.e., floor drains, sumps, ventilation grilles, etc.). As discussed above, manipulation of airflow should not be done prior to sampling. However, the sampling locations should be selected by investigating airflow patterns in the study area. For
48

WSC POLICY #02-430
example, placement of a sample under a supply air diffuser could dilute the true amount of a compound in the air based on the accelerated velocity of air from the diffuser.
5.5 Determining Sampling Locations and Number of Samples
The locations that should be sampled are also an important consideration. Since concentrations of contaminants in various parts of a building can vary substantially, it is important that the sampling results represent this variability. At the very least, it is recommended that sampling points include the VOC infiltration point (i.e., often the basement of a building) and the primary living area. It is also useful to take an outdoor (ambient) sample in the vicinity of the building being tested to provide information on ambient concentrations of VOCs.
In deciding where to conduct sampling within a building, the issue of statistical rigor often arises, specifically the question of what the total number of samples should be to ensure a statistically valid sample size. There are numerous statistical procedures available for calculating such a value (Sokal and Rohlf, 1981; Arkin and Colton, 1970). However, one of the shortcomings which typically characterizes indoor air studies of the type addressed in this document is an absence of statistical rigor in the sampling design. This liability stems from limited financial resources available to address these problems. Seldom is knowledge of sampling variation used to determine appropriate sample size for distinguishing significant differences from guidance or background values. The recommendations made in this document strive to balance resource constraints and statistical requirements. If resources permit, additional sampling will increase the statistical power of the study.
5.6 Oversampling Strategy Using Passive Samplers
One suggestion to allow for the collection of additional sampling information in an indoor air exposure situation is to include both a subchronic component (involving time-weighted active or passive techniques discussed previously) as well as an oversampling approach (using badge samplers to evaluate chronic exposures).
An over-sampling strategy involves placing an additional number of samplers in the field, with the option of analyzing these samplers if additional information is necessary. The major costs associated with this type of sampling are those of mobilizing field personnel to place and retrieve samplers, and analytical costs. It is therefore prudent to place as many samplers as practical to optimize data returns. For example, for a typical scenario in which VOCs are infiltrating through the foundation into the basement, triplicate (3) passive samplers could be placed in the following locations: basement; living room; master bedroom or room where vapors are most noticeable. It is suggested that at least ten percent of the total number of samples collected be field blanks. If the total number of samples is less than ten, there should be at least one field blank.
It is suggested that two of three replicate samples from each location be analyzed initially. The reported precision for this sampling technique for indoor air is about 13% of the mean concentration for air concentrations of >0.2 g/m3 (Shields and Weschler, 1987). It is
49

WSC POLICY #02-430
suggested that if the two initial data points differ by more than about 15%, then the third sample be analyzed.
The standards for analytical performance using such a method should be specified. Reported gas chromatographic instrumental limits of quantitation are 5-10 ng (3M, 1982; Shields and Weschler, 1987) for the volatile compounds sought with this method. Detection limits of 1.8 to 11.1 g/m3 have been reported by Cohen et al. (1989) for a range of VOCs in indoor air using passive samplers for three weeks.
As stated above, given that the major costs involved with using badge samplers are personnel field expenses and analytical costs, the incremental cost associated with placing additional badge samplers in the field is negligible. A decision as to whether the badge samplers should be analyzed can be made based on the results of the shorter-term time-integrated monitoring results. If these results indicate that detected chemical concentrations are not of concern, no further analysis of the badge samplers is needed. In this way, the potential to obtain additional information is present, if the information is warranted; otherwise, the samplers can simply be disposed of without incurring additional expense for their analysis. This sampling scheme is represented below in Table 6.
Table 6. Oversampling Approach
1.) Collect representative time-weighted average (TWA) samples using evacuated canisters or adsorbent media tubes.2.) At each of the same locations where TWA sampling is being conducted, place three charcoal badge samplers and collect samples of about 3-4 weeks in duration.3.) Analyze the TWA short-term samples.4.) If chemical concentrations are high (relative to typical background concentrations and/or health criteria) go on to analyze the badge samplers once the sampling period is past. (Make sure holding times specified by manufacturer are not exceeded.)5.) Analyze two out of the three badge samplers. If results of these first two differ by more than about 15%, analyze the third.
5.7 Sampling Other Media
When the objective of an indoor air study is to determine whether the source of indoor air contamination is a contaminated ambient medium (e.g., groundwater, soil gas, ambient air, etc.) which is releasing contaminants to the indoor environment, it is also recommended that sampling be conducted of that suspected medium. In this way, a qualitative and quantitative comparison can be made between the types and concentrations of the contaminants found in the indoor air and those found in the source medium.
Typically, with a groundwater contamination case, soil gas and groundwater data will already have been collected first. Ideally, these data will have been collected in a stepwise fashion, starting with groundwater, then soil gas and then indoor air. Groundwater and soil gas data are useful to have before conducting the indoor air sampling study in order to focus the
50

WSC POLICY #02-430
indoor air investigation on site-related chemicals. Once indoor air data have also been obtained, media-specific contaminant “fingerprints” can be compared across media and similarities noted.
If the stepwise media-specific data collection progression described above was not available prior to conducting indoor air sampling, it is still recommended that groundwater and soil gas sampling be conducted. In this way, a qualitative and quantitative comparison can be made between the types and concentrations of the contaminants found in the indoor air and those found in the suspected media to identify a possible source to indoor air. If possible, the media-specific data should be collected as temporally close to each other as possible. At a minimum, the various media should be sampled within the same season and similar weather conditions.
Often, groundwater and soil gas information at sites may be several years older than the indoor air data and thus may not be directly comparable. In such a case, resampling of these media may be necessary to obtain relevant data.
For all indoor air contamination situations, it is also advisable to collect at least one upwind, ambient air sample to provide information on ambient air background or to identify a potential ambient air source.
5.7.1 Groundwater Sampling
In a scenario in which contaminated groundwater is the suspected source of indoor air contamination, it is highly recommended that groundwater testing results be used to help focus the indoor investigation on site-related chemicals. The EPA 8000 series testing methods from SW-846 (EPA, 1997) are sufficient for determining the presence of contaminants in the course of investigating the extent of a disposal site. The EPA 500 series drinking water methods (EPA, 1988b), which have a more sensitive detection limit, should be used to analyze samples from drinking water supply wells. The MADEP VPH/EPH methodology for sampling and evaluation of groundwater should be used for sites contaminated with petroleum. The appropriate method should be selected based on the required detection limits for the particular chemicals under study. With investigation of a groundwater plume flowing towards an inhabited structure, at least one of the monitoring wells should be situated upgradient from the potentially impacted building. Additional guidance on groundwater monitoring can be found in “Policy for the Investigation, Assessment and Remediation of Petroleum Releases – Interim Site Investigation Protocol Document” (MADEP, 1991a). 5.7.2 Soil Gas Sampling
An indoor air investigation can be greatly enhanced with soil gas testing results. The information that is obtained from testing soil gas can be very useful for trying to determine whether there may be a link, in terms of the types of compounds detected or the relative magnitude of those compounds, between groundwater, soil gas and indoor air. Ideally, soil gas measurements should be taken as closely in time as possible to the time the indoor air is being sampled. It should be noted however, that rainy, wet conditions that are considered “worst-case” moisture conditions when doing indoor air sampling (see Section 4.2, #7 of this document) actually represent a situation in which soil gas is likely to be detected at lower, non-
51

WSC POLICY #02-430
representative concentrations due to the fact that rainwater occupying soil pores around a building tends to exclude soil gas from entering that soil. A truer estimate of soil gas concentrations under rainy conditions would be obtained from directly underneath a building.
The goal of soil gas testing during an indoor air investigation is to determine concentrations of VOCs in the soil area very close to the building’s foundation. PID/FID analysis is recommended as an initial soil gas screen. A PID/FID unit should be used to scan typical soil gas entry points into a foundation (cracks, annulus spaces around utility lines, sumps). If a sump is present, an attempt should be made to obtain and test a groundwater sample (make sure to pump out stagnant water first) (MADEP, 1995b). The following general guidelines for soil gas testing are recommended:
1.) Install at least one or two soil gas sampling probes beneath the structure of concern (e.g., through the concrete slab of a basement floor). For larger structures, additional probes may be needed. If probes cannot be installed within the footprint of the structure, install soil gas sampling probes along the perimeter of the building, as close as possible to the structure. Locations beneath pavement or other impervious surfaces are preferred to obtain “worst-case” conditions (MADEP, 2001). Soil gas concentrations will vary around a building because of the non-homogeneous nature of soil. EPA recommends that at least two soil probes be installed on each side of the building to be tested. For slab-on-grade and crawl-space type foundations, the probes should be installed at an angle to go under the building (EPA, 1992a).
2.) Sampling probes installed within the footprint of the structure should be installed and sampled in a manner that enables the collection of a soil gas sample from just beneath the lowest (floor/slab) elevation. Sampling probes outside of the footprint of the building should be installed and sampled in a manner that enables the collection of a soil gas sample from a point just below the lowest (floor/slab) elevation (EPA, 1992a).
3.) Withdraw a sample of soil gas from each probe for analysis by an appropriately calibrated photoionization detector (PID) and/or flame ionization detector (FID) meter. The gas flow rates should be low (e.g., 10-100 cm3/min.) to reduce the possibility of establishing unwanted pressure gradients (EPA, 1992a). Continuous, real-time measurements may be made, or a sample can be pumped to a Tedlar (or equivalent) bag for subsequent PID/FID) analyses. Unless it is demonstrated that the sampling technique and equipment is capable of delivering a soil gas sample to the PID/FID) meters at an adequate pressure and flow rate, use of the bag technique is recommended (MADEP, 2001).
4.) The concern with ensuring very low detection limits is not as crucial as it is with testing
indoor air. The indoor air concentrations will likely never exceed five percent of the soil gas concentration (EPA, 1992a). However, if the above analytical techniques are judged not to be sensitive enough to pick up representative contaminant levels, more sophisticated analytical testing is recommended. Using the guidelines discussed above for determining sampling location, soil gas should be sampled using EPA methods IP-1A, TO-14 or TO-15. Use of these methods has the advantage of positive compound
52

WSC POLICY #02-430
identification, lower detection limits and a wider range of compounds identified with the disadvantages of higher costs and delayed analytical results. Although the use of canisters to sample soil gas has potential, care must be taken to avoid taking samples that are too concentrated from highly contaminated locations. Samples can be diluted in the lab, but quality control is severely affected if many dilutions are necessary (to be in an acceptable range for the analytical instrumentation). The future use of canisters used for soil gas sampling can be put into jeopardy if excessively contaminated samples are put into them, because it may be difficult or not possible to clean the canisters back to trace levels. Depending on the magnitude of VOCs measured by screening techniques in the soil gas, smaller (than 6 liters) volumes of gas can be metered into the canisters so that the analysis of the canister (with its balance filled with zero air) can be analyzed on scale. In addition, care must be taken with soil gas samples to account for high methane or water levels which may be in the samples. Use of EPA methods utilizing adsorption tubes (e.g., TO-1, TO-2, IP-B1) is not recommended for screening unless a portable GC or other rapid response instrument is available to detect approximate concentrations. Because adsorptive capabilities of the tubes vary with different compounds, it is easy to underload or overload the tubes in an unknown environment (MADEP, 2001; EPA, 1992a).
5.) Appendix 5 of this document contains a recommended protocol for real-time soil gas sampling procedures. For additional guidance on how to conduct soil gas testing, please consult the EPA Air/Superfund National/Technical Guidance Study Series: Assessing Potential Indoor Air Impacts for Superfund (EPA, 1992a).
5.7.3 Ambient Air Sampling
If the suspected origin of the indoor air contamination is ambient air, then the ambient air should be extensively sampled. Any of the TO methods can be used to conduct ambient air monitoring. In addition to providing information on outside influence on indoor air concentrations, outdoor ambient samples provide valuable quality control information about the collection and analysis techniques used. The results may help determine whether a laboratory and/or collector is/are able to take samples which show low typical ambient levels of target VOCs or whether unusual results occur which could be the results of sample contamination or another problem.
It is recommended that an upwind (from the building being sampled) outdoor ambient air sample be taken during every indoor air study to be used in the final evaluation of potential sources of chemicals in the indoor environment.
For determining ambient air concentrations, the EPA recommends that ambient sampling begin at least one hour and preferably two hours before indoor air monitoring begins and continue until at least thirty minutes before indoor monitoring is complete. This is recommended since most buildings have an hourly air exchange rate in the range of 0.5-1.0 and thus air entering the building in the period before indoor sampling remains in the building for a long time. Fluctuations of outdoor air concentrations in the final thirty minutes, unless very large, have virtually no effect on the average indoor air concentration measured. Sampling
53

WSC POLICY #02-430
equipment should be placed so as to minimize potential contamination from extraneous sources such as gasoline stations, automobiles and other gasoline-powered engines, oil storage tanks, industrial facilities, etc.. The equipment should be located on the upwind side of buildings, away from windshields such as trees or bushes. The intake should be at about five feet off the ground (at the approximate midpoint of the ground story level of the building) and about 5-15 feet away from the building (EPA, 1992a).
54
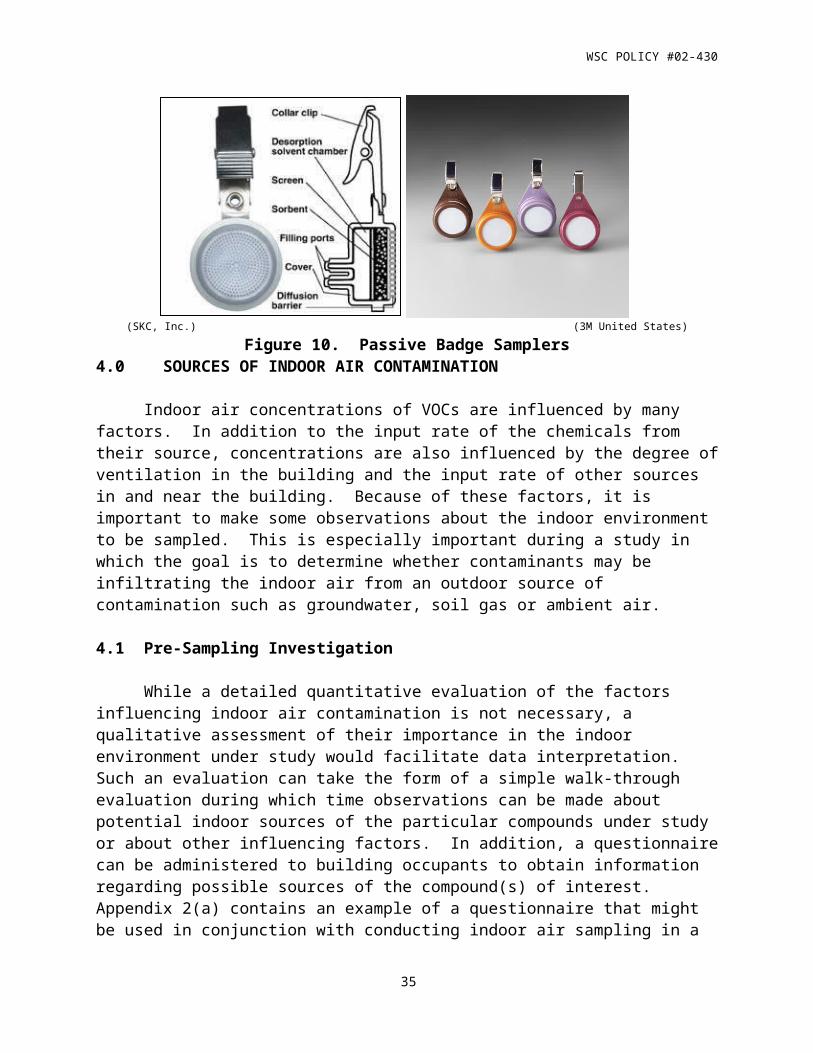
WSC POLICY #02-430
Table 7. Indoor Air Sampling Approach(for a groundwater contamination case)
1. Conduct groundwater sampling in vicinity of building to be monitored.
2. Conduct soil gas sampling around foundation of building to be monitored.
3. Conduct indoor air sampling.
Focus sampling on contaminants found in groundwater and soil gas analyses.
● Record pre-sampling information.• Use indoor air quality building survey.• Note any other pertinent factors which may influence results.
● Sample:
Temporal• Long-term exposure situation – Sample should encompass:
data over at least three seasons data taken during a period of high groundwater (rainy season; snowmelt
– typically spring in New England) data taken during winter conditions such as heat on with minimum air
exchange data taken during rain event when pressure and temperature gradients
between inside and outdoor are maximized (e.g., typically with temperature in 30’s-low 40’s)
• for Short-term evacuation decisions data taken during actual conditions representative of exposure period
of interest
Spatial Sampling locations should include:
Occupied living/working areas in breathing zone for receptors of interest Basement locations (where highest levels of contaminants may be
detected) 2nd floor of living space (and higher floors if applicable) at least one upwind outdoor sample to characterize outdoor air
concentrations
(CTDEP, 2000)
55

WSC POLICY #02-430
5.8 Sample Categories and Nomenclature
The MADEP APH methodology defines, describes and categorizes several types of indoor air sampling locations termed “sample location zone categories”. These are described in Section 6 of Appendix 4, “The Recommended Standard Operating Procedure (SOP) for the Collection of Air Samples” (from the MADEP APH methodology document (MADEP, 2000)) and are also summarized below in Table 8. These definitions may be useful in helping to identify and codify the type, source and relevance of any reported contaminant data.
Table 8. Sampling Categories and Nomenclature
Sample Location Zone
Category
Definition
Zone A Samples are obtained at vapor entry points into a building (e.g., breach in foundation, sump hole). Samples are used to identify areas of point-source vapor emissions into impacted structures and/or for investigative/health screening purposes; typically, an instantaneous grab sample, though sample volume may need to be metered to avoid overwhelming the analytical system.
Zone A-1 Soil gas samples. Samples are obtained from temporary or permanent subsurface probes; typically an instantaneous grab sample, though sample volume may need to be metered to avoid overwhelming the analytical system. Care must be exercised to avoid short-circuiting the sample pathway by the use of a high sampling vacuum or flowrate. Care must also be exercised to avoid or prevent entrapment of groundwater.
Zone B Samples taken in unoccupied (and unfinished) areas on building levels in contact with the soil. Little personal exposure is expected. This sample could be an instantaneous grab or time integrated sample.
Zone C Samples taken in occupied, finished part of the building level in contact with the soil. Some personal exposure could be expected, depending on the extent of the area’s use. This should be a time-integrated sample.
Zone D First floor living area. Personal exposure level depends on percentage of time occupied and whether sleeping quarters are located on this level. Time-integrated samples are appropriate.
Zone E Second or higher floors. Occupied during sleeping or other hours. This zone needs to be considered if there is a major contaminant situation, there is a direct-air connection with the level of entry or if it is occupied by an unusually sensitive receptor. Time-integrated samples are appropriate.
Outside/Ambient Used to assess the influence and impacts of outdoor air quality on indoor air quality. Also can be used as an additional quality control sample because background ambient air concentrations of volatile petroleum hydrocarbons are at well-documented average levels at most locations. Time-integrated samples are appropriate.
56

WSC POLICY #02-430
5.9 Background
When an indoor air investigation is conducted, the goal is often to determine whether the detected contaminant concentrations originate from the contamination under investigation or if they merely represent typical concentrations of contaminants in that building. The monitoring results are often difficult to interpret with regard to this goal in that for many compounds of concern, there already exists a background concentration of these compounds in the air which is unrelated to the source under study. The background concentration is influenced by the emissions of a vast number chemicals originating from products used and stored in the indoor environment. Although indoor background concentrations of compounds are mainly influenced by indoor activities, product use and storage, they are also influenced by background contamination in outdoor air. In addition to sampling other ambient media as discussed above, to facilitate interpretation of indoor air sampling results, it is also very important to have an estimate of what indoor background concentrations of compounds may be.
The best measure of background chemical concentrations for a particular building is, obviously, a measure taken before contamination of the indoor air allegedly occurred. Since this information is rarely available beforehand and cannot be taken in retrospect, the next best comparison would be indoor air sampling results taken in a similar building, preferably located in the same area, characterized by similar indoor activities and consumer product use. Indoor air concentrations of chemicals between buildings can vary greatly, even among residential dwellings. It is therefore not often feasible to sample enough control buildings to permit valid statistical comparisons between controls and impacted buildings on a project-by-project basis.
More rigorous comparisons to detected concentrations can be made using values which have been compiled in the scientific literature from nationwide data. A number of literature sources have attempted to characterize what typical background concentrations of various contaminants may be in the indoor air, often expressing the results in terms of percentiles of buildings (usually residential homes) characterized by a certain concentration. Such percentile data allows for the comparison of indoor air sampling results from a specific building to the collective range of indoor air concentrations monitored in a number of comparison homes. For example, a background value for a chemical that represents the 90th percentile essentially represents a value for which ninety percent of buildings sampled have indoor air with concentrations of this chemical at or below the reported value. Use of percentile values is the best way to characterize background due to the variability of background concentrations in buildings. Everyday background concentrations can vary significantly from building to building, even within the same building, depending on the activities that occur in that building.
Two literature sources that ORS commonly uses include the EPA National Ambient VOC Database Update (EPA, 1988c) and a paper entitled Assessment of Population Exposure and Carcinogenic Risk Posed by Volatile Organic Compound in Indoor Air (Stolwijk, 1990). The EPA database contains information on VOCs in indoor (as well as outdoor) air, expressed as a series of percentiles. The Stolwijk paper also compiles information on VOCs from a number of indoor air studies (conducted in the U.S. and several other countries) presented as percentiles. A search of the literature can always be done for information on the most recent estimates of indoor air background.
57

WSC POLICY #02-430
The EPA Office of Research and Development (ORD) initiated a study known as the National Human Exposure Assessment Survey (NHEXAS) in the early 1990’s. The study consisted of a population-based pilot study of the exposure of over 500 people in three areas of the United States to metals, pesticides, VOCs and other toxic chemicals. The study was a multi-media, multi-pathway study and measured a number of exposure parameters. The NHEXAS information has been made publicly available in a large database, with appropriate metadata, as of late 2001. ORS anticipates that the indoor air VOC information from the NHEXAS database will be a valuable resource for identifying typical concentrations of a variety of VOCs in indoor air, and will be reviewing this information when it becomes available.
MADEP has compiled a list of toxicity values from a number of the sources referenced above for a number of chemicals commonly seen at disposal sites. These are values used in the derivation of the MCP GW-2 standards. This list of values appears in the MCP Toxicity.xls spreadsheet used to develop the MCP numerical standards. This spreadsheet can be accessed from the MADEP website at http://www.mass.gov/dep. It is recommended that background values from this source be used when available. In the absence of a background value from the MADEP compilation, other sources (as discussed in this section) may be consulted to obtain this information.
In the future, ORS would also like to build a statewide database for background contaminant concentrations in residential indoor air. This sort of information might be obtained by investigators in cases in which background concentrations of VOCs were measured at Massachusetts sites but they were not the target compounds and parameters of the study or the indoor air quality was not impacted by an environmental source. MADEP encourages the investigator to contact MADEP to submit this information to the database. Often, an investigator conducting an indoor air study will (incorrectly) take an ambient outdoor air sample as an estimate of indoor background. As discussed previously, such an ambient air sample should be taken with every indoor air study to characterize outdoor air contaminant concentrations. Use of an ambient sample to represent indoor air should not be done. Depending on the compound under study, this practice may lead to incorrect interpretation regarding the extent to which concentrations of indoor air contaminants have been influenced by extraneous sources. Indoor air concentrations of many compounds, especially VOCs that are found in consumer products, are often found to be much higher than ambient concentrations of these compounds.
6.0 ANALYTICAL METHODS FOR DETECTING AIR TOXICS
After air has been sampled by one of the available methods, the samples must be analyzed for the presence of air toxics. There are several analytical methods available and the choice of the most appropriate method depends on the analytes of interest, the specificity needed (i.e., screening vs. fully quantitative) and the sensitivity needed, commonly referred to as the detection limit.
58

WSC POLICY #02-430
This section is meant to provide background information on the analytical component of the sampling and analysis phase of air toxics characterization. Most of the available analytical methods use either gas chromatography (GC) or high performance liquid chromatography (HPLC) to separate analytes in a mixture of compounds, and then use detectors to identify individual compounds.
6.1 Basic Chromatography
The term chromatography, literally color writing, is generally applied to all multi-stage partitioning processes that are designed to separate compounds in a complex mixture into individual components. The term was first used to describe the separation of plant pigments using adsorbent paper and an alcohol solution. Most modern chromatographic techniques use analytical columns of various lengths that have a solid or stationary phase, and a liquid or mobile phase, that can be either liquid or gas. These techniques are referred to collectively as column chromatography.
Compounds in a mixture are separated based on their differences in sorption characteristics between a mobile and a solid phase. This partitioning, at equilibrium, gives rise to a normal distribution of compounds between the mobile and the stationary phase and these distributions are the characteristic peaks of a chromatogram. Resolution refers to the ability to differentiate between two compounds and is the distance between the centers of masses. The center of mass is also called the retention time and is represented as the retention time of a compound.
To achieve the power necessary to separate a mixture of air toxics into individual components, an analytical column of sufficient length and specificity must be used. Longer columns provide a greater ability to separate the center of masses of different compounds. The characteristics of the stationary phase influence sorption and consequently resolution. A stationary phase must be chosen that will provide enough differential sorption to capture compounds of interest and then release them within a reasonable time period.
The two most commonly used separation techniques for the characterization of air toxics are gas chromatography (GC) and high performance liquid chromatography (HPLC). In GC, the mobile phase is an inert gas, usually helium. The mobile phase is used as a carrier gas to move compounds along the analytical column. In most cases, the chromatographic column used for air toxics analysis is an open tube filled with a finely meshed solid onto which a liquid stationary phase has been coated. Modern GC methods use very long, flexible, capillary columns which provide excellent resolution and speed for the analysis of complex mixtures of chemicals often found in ambient and indoor air samples. Capillary columns have the appearance of long thin springs, are often up to 100 meters long, have an internal diameter of approximately 0.54 microns and can be manufactured with a variety of stationary phases. The favorable characteristics of capillary columns for the analysis of air toxics have lead to their dominance of analytical methods over the past decade. Packed columns are shorter with larger internal diameters and therefore do not have the resolution necessary for contemporary air analysis. They have been used historically a great deal in GC work but lend themselves better to HPLC analysis.
59

WSC POLICY #02-430
In HPLC, liquids are used as mobile phases that allow an analyst to control the sorption characteristics more precisely. Mobile phase can be polar, for example, acetonitrile, or non-polar, for example hexane. The ability to manipulate the polarity of the mobile phase provides a very powerful tool to the analytical chemist and allows for better control over resolution and retention time. Gradients can be set up to further exploit polarity in liquid mobile phases that consequently allows for the use of a packed column. One advantage of using a packed column is that more sample volume can be put on column which means that the capacity of the column is greater. This may be important when a low detection limit is desired.
6.2 Detectors used with Chromatographs
Once a mixture of chemicals has been separated by chromatography, each compound can be then be identified by passing the air sample through a detector. Several types of detectors are available to identify and quantitate air toxics. The choice of the most appropriate detector depends on the structural characteristics of the compounds being identified and the required detection limits. In a mixture of chemicals with a variety of structural features, the choice of the detector allows one to exploit these features to provide specificity among compounds. There are general or universal detectors and specific detectors; each will be described below with an explanation of the advantages and disadvantages of each.
6.2.1 Ultraviolet and Infrared Detectors
Ultraviolet (UV) and Infrared (IR) spectroscopy are both absorption spectrometry analytical techniques that are based on the electronic structure of a molecule and can provide information on the identity of certain compounds. Ultraviolet (UV) spectroscopy measures the absorption of ultraviolet light by a sample in the UV range 200-400 nm. A sample is irradiated with light of a certain wavelength from a light source and the amount of light transmitted is measured with a detector. The light supplies energy to the molecules being analyzed and this energy causes electrons to be excited to higher orbitals. The wavelengths which have enough energy to excite electrons into a higher orbital are specific to the molecular structure of a particular molecule. Single or sigma bonds (-bonds) are more stable than double or pi bonds ( - bonds) and require more energy to be excited into a higher orbital. Therefore molecules which contain double bonds, e.g. conjugated halogenated compounds, alkenes and aromatic compounds, will have a greater response than an aliphatic compound. UV detectors have been used most extensively in HPLC work.
Infrared (IR) spectroscopy is based on the absorption of electromagnetic radiation in the infrared region of the spectrum (2.5-25 um). The energies in this region of the electromagnetic spectrum are much lower than those in the UV region and are not capable of exciting electrons. However, there is enough energy to cause groups of atoms to vibrate about the covalent bonds connecting them to one another. These vibrations (e.g., stretching, bending) are characteristic of the properties of the functional groups of molecules.
An IR spectrometer operates in a manner similar to UV spectrometers in that each measures the absorption of light. A beam of light of a specific wavelength is passed through a
60

WSC POLICY #02-430
sample and the frequency of the incident beam is varied by scanning the range of infrared frequencies. A detector produces a characteristic infrared spectrum for eachsample, reflecting the functional groups present in each molecule. The IR spectra of even simple molecules can contain many absorption peaks corresponding to different functional moieties. The location of absorption bonds are most often represented by wavenumbers measured in reciprocal centimeters (cm-1). The most commonly used range of wavenumbers for environmental analysis is 600-4000 cm-1.
Historically, IR has been used to characterize hydrocarbons, oils and grease. This technique has been successful when it is used as a screening tool using a single wavelength, typically 2930 cm-1 corresponding to the carbon-hydrogen stretch which may not be present in all targeted analytes or products. Using single wavelength IR may overestimate or underestimate the concentration of compounds depending on the molecular characteristics of the targeted analytes or products. For example, many plants produce natural volatile oils that contain carbon-hydrogen bonds and will therefore be detected by single wavelength IR as hydrocarbons. Limonene, which is a natural product of citrus fruits, is often detected in indoor air samples by other, more sophisticated techniques (see Mass Spectrometry below) and will not be identified using conventional single wavelength IR spectroscopy.
6.2.2 Flame Ionization Detector
The flame ionization detector (FID)) is a universal detector and is the most widely used in air toxics analysis as well as other environmental analyses. The FID) is considered a universal detector because it will respond to most organic compounds. As the carrier gas elutes from the analytical column into the FID), the eluant is burned in a hydrogen-supported flame and the entire contents of the sample is destroyed. The burning process produces ions which are separated by polarity, collected on an electrode and a current measuring device is used to produce a response. The response gives rise to the typical chromatogram that most people have seen at one time or another.
There are advantages and disadvantages with using an FID) for analysis of air toxics. It is a universal detector and therefore responds to all organic compounds which is an advantage for screening or when the identity of all of the analytes is known. This is most often the case in routine screening, for example, routine monitoring for chlorinated hydrocarbons or aromatic compounds in air. In general, the FID) is more sensitive (and linear per carbon) for unsubstituted hydrocarbons and less sensitive for substituted hydrocarbons (e.g., carbon tetrachloride).
The disadvantage of using the FID) is obviously the lack of specificity. The FID) will provide a response at a particular retention time on a chromatogram, but there is no other information to confirm the identity of the putative target analyte. There are other techniques available to the analytical chemist to supply more information to improve the confidence in the identification of targeted analytes. One technique is dual column confirmation where a second, dissimilar column is calibrated and a different set of retention times is determined for a series of analytes or for single analytes. A sample is then analyzed under the new chromatographic circumstances and the retention time of the unknown compound is determined. If the retention
61

WSC POLICY #02-430
time on the second column for the unknown analyte corresponds with the retention time of the standard compound determined by calibration on the second column, a high degree of confidence can be placed on the identity of the unknown compound. Mass spectrometry is frequently the first choice of an analytical chemist as a confirmatory technique to unequivocally ascertain the identity of an unknown compound. The Mass Spectrometry section below presents the advantages of mass spectrometry in more detail.
6.2.3 Photoionization Detector
The photoionization detector (PID) is used to provide selectivity in a chemical analysis for compounds that have ionization potentials that fall within certain boundaries. The column effluent exits the analytical column and enters the PID’s reaction chamber where it is continuously irradiated with high-energy ultraviolet light. Specialized lamps emit ultraviolet light at discrete wavelengths that correspond to specific energies measured in electron volts. Compounds which have ionization potentials at or below this energy level will produce ions and these ions will be collected, measured and recorded. The most commonly used lamp has an energy corresponding to 10.2 eV. A lamp which emits energy at 9.8 eV is often used to improve selectivity since fewer compounds will produce ions when irradiated at this energy level.
The PID has been used successfully in the analysis of complex mixtures of chemicals to segregate aromatic compounds from aliphatic compounds. In the case of petroleum analysis, a PID and an FID) can be used in series to identify the total amount of material present (FID)), the total aromatic content present (PID) and by subtraction, the total amount of aliphatic material present. An example of successful application of this approach is the Massachusetts Volatile Petroleum Hydrocarbon (VPH) procedure.
6.2.4 Electron Capture Detector
The electron capture detector (ECD) exploits the ability of certain compounds to capture electrons and uses this attribute to provide selectivity and sensitivity. A radiation source enclosed in a chamber emits a flow of electrons resulting in a current. Certain “electrophilic” compounds, (e.g., containing halogens (F, Cl, Br, I), oxygen and sulfur), as well as electrophilic groups, will capture the electrons thereby quenching this current. This approach can be used to detect volatile solvents in air (e.g. TCE, PCE) or pesticides and PCBs.
6.2.5 Nitrogen-Phosphorous Detector
A nitrogen-phosphorus detector (NPD) is a detector that has been optimized to respond to compounds containing nitrogen and phosphorous.6.2.6 Mass Spectrometry
Mass spectrometry (MS), especially when coupled to high-resolution gas chromatography (GC/MS) has certain advantages over other detectors like PID and FID that are commonly used in environmental analysis. One of the most useful features of MS is the generation of a mass spectrum for each individual compound that is unique for each compound
62

WSC POLICY #02-430
and serves as a type of fingerprint of each compound. An important feature of an MS detector, is that it is able to discriminate between compounds that coelute during gas chromatography.
Electron Impact (EI) is currently the most commonly used technique for ionizing compounds that elute from GC columns into the ionization chamber of a mass spectrometer. A beam of electrons generated by an ion source bombards molecules with enough energy to cause the molecules to break apart as fragments in characteristic and repeatable patterns. The ion fragments that are generated during this process are separated based on their mass to charge ratio (m/z) by a quadrupole mass analyzer and their relative abundance is recorded. The combination of mass fragments and ion abundance gives rise to a mass spectrum which is unique for each compound. The mass spectrum can be used to confirm the identity of a targeted analyte or to tentatively identify non-target compounds.
Most of the Toxic Organics (TO) methods use a mass spectrometer as the ultimate detector. Mass spectrometry provides a level of confidence in the identification of unknown analytes that none of the other techniques described here can provide.
63

WSC POLICY #02-430
Fixed Laboratory Analytical Equipment
(Hewlett Packard)Figure 14. Gas Chromatograph with Flame Ionization Detector (FID))
(Perkin-Elmer)Figure 15. Gas Chromatograph with Mass Spectrometer (MS) Detector
64

WSC POLICY #02-430
7.0 QUALITY ASSURANCE
In order to monitor the quality of the results obtained in an indoor air monitoring study, it is recommended that quality assurance/quality control (QA/QC) techniques be routinely incorporated into the design of the study as integral parts of a comprehensive strategy for characterizing chemicals in air. Quality assurance (QA) is a well-defined, integrated series of management activities involving planning, implementing, documenting, assessing and reporting that assure that data are of known and documented quality. Quality Control (QC) is an integrated series of technical activities that measure whether and how well the goals established in the quality assurance component were met. Quality assurance includes quality control as one of its components to ensure that data quality objectives are met and these two should not be treated as separate activities. Quality assurance is a multi-component endeavor and should be treated holistically when generating environmental data. Often quality assurance/control tasks are separated into sampling QA/QC, analytical QA/QC and data usability QA/QC. This approach fosters a type of fractionated thinking which sets up a false differentiation among various planning, sampling, analysis and data usability activities. These quality assurance activities should be integrated by the investigator among the various aspects of a project to ensure an efficient, coordinated process of generating environmental data.
In many cases, the quality assurance and quality control requirements will be chosen in advance because of regulatory mandates or historical practices. A section on QA/QC is included in each of the IP and TO methods developed by the EPA. Each method recommends minimum QA/QC practices which should be adequate for most applications; however, these minimum criteria can be augmented by the investigator depending on the needs of a specific project.
7.1 Data Quality Objectives and Data Quality Indicators
Before the sampling and analysis phase of a project begins, there must be a discussion of the data quality objectives (DQOs) for the project. This part of the process should be done at the beginning of the project (project scoping). The data quality objectives are closely linked to the overall purpose of the study. There is a formal data quality objective process developed by the EPA that can be used to develop a strategic plan for data collection, analysis and evaluation activities (EPA, 1988).
Data quality indicators (DQIs) are developed during the development of the DQOs as quantitative measures of the achievement of quality objectives. The quality of sampling and analytical data obtained can then be measured and defined using various data quality indicators. The US EPA Guidance for Data Usability in Risk Assessments (EPA, 1992b) (hereafter referred to as the “Data Usability” document) suggests the acronym PARCCS to encompass the six indicators: Precision, Accuracy, Representativeness, Comparability, Completeness and Sensitivity. These indicators are used together with data quality control measurements to define the quality of the data collected for the purpose of risk assessment. The indicators are defined below as they apply to indoor air sampling. Much of the material presented below is taken from the EPA “Data Usability” document cited above.Precision: indicates the degree to which data vary due to measurement error, which is influenced by a combination of sample collection and analytical factors. This indicator answers
65

WSC POLICY #02-430
the question, “How many times can we take a sample and get the same result?” The results do not necessarily indicate the “true” value but the results from multiple samples should be reproducible. It is a measure of variability.
In indoor air sampling, data variability resulting from sampling techniques may be evaluated by taking field duplicates or multiple air samples at a location. Analytical variability can be evaluated through the analysis of laboratory duplicates or through multiple analyses of performance evaluation samples. Analytical quality control measures used to monitor the status of this indicator include matrix spikes and matrix spike duplicates (see Section 7.4 on Analytical Quality Control for additional discussion).
Precision is particularly relevant when analytical results approach the method detection limit. A measure of precision provides a level of confidence to distinguish between site and background levels of contamination.
Accuracy: indicates a measure of the degree to which the data collected may vary from the true value due to such factors as contamination during the sampling process and loss of sample from improper collection or handling, or analytical method bias. Analytical method bias is determined by calculating percent recovery from spiked samples and is usually expressed in terms of (high or low) bias. Accuracy can be affected by sample contamination in the field or laboratory or during storage and processing of the sample.
It is recommended that standard operating procedures be followed for sample field activities (collection, handling and decontamination). Use of field and trip blanks should be incorporated into the sampling plan. Method blanks, audit samples and calibration standards should be used to evaluate laboratory contamination. Analytical quality control measures used to monitor the status of this indicator include surrogate recovery data (see Section 7.4 on Analytical Quality Control for additional discussion).
Representativeness: indicates the extent to which sampled data truly define the actual nature, extent of exposure, and concentrations of the contaminants of concern to which receptors may be exposed. This indicator answers the question, “Where do we take the samples?” in order that they may characterize the entire area of interest. Representativeness has a larger scope than precision since it has both qualitative and quantitative components.
In terms of indoor air, this indicator measures whether the data collected are representative of air concentrations which building occupants are breathing. It is recommended that a representative sampling design be used, and that additional samples be collected as required. In a building, this means that sampling should be conducted at least in one location on each floor that the receptor frequents and, if necessary, in more than one location on each floor. Samples should be taken in the residents’ breathing zone and should be representative of the duration and time of day during which the resident is present in that area. It is also recommended that detailed standard operating procedures be prepared for handling field equipment.Comparability: indicates whether sampling results are the same over time and space.
66

WSC POLICY #02-430
As applied to the indoor air-sampling situation, this indicator may measure whether data sets collected on different days or different sampling locations are similar. To achieve this endpoint, it is suggested that the same sampling design and similar time periods be used across sampling episodes.
The same analytical method should also be used routinely over sampling events and laboratories to increase the likelihood that analytical results will be comparable. In addition, this indicator also measures the comparability of the results with other analytical methods, etc. Comparable data will allow for the combination of data sets for evaluation.
Completeness: indicates whether the sampling and analytical data collected in the study adequately characterize the range of contaminant concentrations, the list of contaminants present and the extent of contamination. It is essentially a measure of the amount of useable data resulting from data collection and analysis activities. This indicator answers the question, “Is there enough data to make a certain decision?”
In terms of indoor air sampling, this indicator addresses the appropriateness of the sampling methods to characterize the types and concentrations of contaminants present and the adequacy of the sample size.
The number of samples that should be taken is an important factor to consider when planning a sampling study. The inherent variation among sampling measurements over both time and space may influence the decision as to the appropriate number of samples that should be taken in a sampling study. Although there are statistical techniques available for determining appropriate sample size (Sokal and Rohlf, 1981; Arkin and Colton, 1970), practical application of such information is frequently limited by resource constraints. The incorporation of replicate sampling and collocated sampling techniques into the sampling plan can address some of these variability concerns.
It is suggested that the standard operating procedures associated with the sampling methodology of choice be reviewed to determine whether the study’s objectives can be met by using these methods. In addition, it should be assured that representative samples are taken in each area of concern. In a residence, for example, this can be translated to mean that at least one sample should be taken on each floor and, if the nature of the contamination indicates that there might be additional variation in the pattern of contamination in various sections or rooms on a floor, that more than one be taken on that floor. Additional sampling may be necessary to characterize concentration variations by season or with meteorological events.
Analytical problems affecting data completeness in the analysis of indoor air samples may be related to problems occurring during sampling. For example, if sample capacity is exceeded, laboratory performance may be affected, causing data to be rejected. One instance of this might be the occurrence of sample breakthrough in the case of time-weighted sampling through adsorbent media. Some samples may be rejected due to holding time violations (consult sampling method for recommended holding time as well as Appendix 3 of this document). For a number of reasons, the number of samples analyzed may be fewer than originally planned either due to laboratory error, equipment failure or other analytical problems. Advanced planning in
67

WSC POLICY #02-430
identifying critical samples and the use of alternative sampling procedures is also necessary to ensure completeness of a data set for use in evaluating exposures.
Sensitivity: indicates the ability of an analytical method to detect contaminants at the lower end of the range of concentrations of concern. This ability is expressed by the detection limit. It is often discussed together with a closely allied concept, that of specificity. Specificity is the ability of an analytical technique to differentiate between a certain substance and other similar chemicals.
In terms of the analysis of indoor air samples, this indicator measures the ability of a method to detect environmental levels of air contaminants. In addition, it can also be used to assess whether the method detection limit is below other crucial data endpoints such as toxicity benchmark values and indoor air background information. Such information is necessary when evaluating indoor air monitoring data in terms of potential health effects. 7.2 Sampling and Analytical Quality Assurance
A Quality Assurance Project Plan (QAPP) defines the sampling and analytical quality control measures that can be used to assess the quality of the data obtained in the indoor air monitoring study. The QAPP is a critical document for any environmental data collection effort because it documents how QA/QC will be implemented for an individual project (EPA, 1998). A QAPP is meant to instill confidence in a process in advance by providing a detailed description of the planning, implementation and assessment activities. QAPPs are designed to be flexible enough to provide an essential core of quality assurance and still meet the project-specific requirements. Standard operating procedures should be used to assure consistency in the sampling and analytical procedures used and to reduce the level of error associated with data collection and analysis. Chain of custody records should also be maintained for each sample. These records establish the history and handling of each sample from collection all the way through the analytical process by generating a paper (or electronic) trail that can be used for tracking, identifying potential problems, improving quality objectives during a project, streamlining information review and identifying accountability. In addition to maintaining a chain of custody, the location of each collected sample should be identified on a site map.
7.3 Sampling Quality Control
There are several measures that should be used across the board in all indoor air sampling studies: use of replicate or collocated sampling; use of field blanks; and in the case of time-weighted sampling through adsorbent media, series sampling. Replicate Sampling: In order to improve the confidence in measured concentrations, it is recommended that at least one set of parallel samples (two or more samples collected simultaneously) be collected during each sampling event. These collocated samples should be taken at different flow rates if an adsorbent media is used. The replicate site should be designated at a location where upscale but not offscale values are expected so that small value differences would not be expected to yield large percentage differences. These samples should be collocated, (i.e., they should be located next to each other). According to guidance provided
68

WSC POLICY #02-430
in the TO methods, if agreement between parallel samples is not generally within +25%, the user should collect parallel samples on a much more frequent basis (perhaps for all sampling points). If a trend of lower apparent concentrations with increasing flow rate is observed for a set of parallel samples, one should consider using a reduced sampling rate and longer sampling interval, if possible. If this practice does not improve the reproducibility, further evaluation of the method performance for the compound of interest might be required (EPA, 1984).
Field Blanks: In each sampling study, at least one clean sampling device (i.e., cartridge or canister) should accompany the samples to the field and back to the laboratory to serve as a field blank. In the case of a cartridge sampler, the cartridge is placed in the sampler but no air is sampled. In the case of a canister, the canister is taken to the field and back to the laboratory without opening it. The field blanks should not contain any target analyte at greater than its corresponding reporting limit and should not contain additional compounds with elution characteristics and mass spectral features that would interfere with identification and measurement of a method analyte. If a blank is found to be contaminated as described above and the analyte is also found in associated samples, those sample results should be “flagged” as possibly contaminated (EPA, 1999).
Series Sampling: With cartridge sampling, a problem that must be guarded against is that of contaminant breakthrough. As described in Section 3.2.1, breakthrough occurs when the volume at which a significant amount of a constant atmosphere of an adsorbed compound drawn through a sorbent tube desorbs and appears in the tube effluent (Hodgson, 1989). Any additional VOCs that may be carried in air that is passed through the collection media “break through” the media and are lost. Since air concentration is a function of the mass of the contaminant collected per volume of air passed through the collection media, breakthrough results in an incorrect concentration estimate since volume is increasing with no accompanying rise in VOCs collected. A way to evaluate whether breakthrough has occurred is to attach two (or more) cartridges in series at one of the study site sampling locations with the highest expected concentrations. If breakthrough of the first cartridge has occurred, the second cartridge will also be contaminated with VOCs. Thus, backup cartridges (two cartridges in series) should be collected with each sampling event. The TO Methods state that backup cartridges should contain less than ten percent of the amount of components of interest found in the front cartridges, or be equivalent to the blank cartridge level, whichever is greater (EPA, 1984). Projected “safe” sampling volumes are discussed in the TO methods. However, the “safe” sampling volume for a particular project is best determined and validated by the laboratory doing the analysis as it can be tailored to the particular adsorbent type(s) and amount used and the target pollutant(s) of interest.
For single media sampling, the use of dual bed sorbent tubes may also be used. TO-1/TO-2 thermal desorption tube sampling methods are often modified for collection on a single, multi-bed tube (such as carbon molecular sieve, Carbopak B and Carbopak C). In these instances, it is understood that compound bed migration may be irreversible and result in fatal recoveries. Use of series sampling in this case may not be an effective indicator of breakthrough between multibed layers. For cases in which multi-bed sampling is used, collocated samples collected at differing flow rates are recommended where side by side samples are desired. The principles discussed here for cartridge sampling would be applicable to any sorbent sampling method.
69

WSC POLICY #02-430
Caution should always be used during sampling not to cross-contaminate sampling media, either by human hands or by using inadequately cleaned sampling equipment. For canister samplers, in addition to the above quality control measures, additional measures should be taken (as discussed in Section 3.2.1 and Appendix 4) to assure that cross-contamination does not occur between samples.
7.4 Analytical Quality Control
Analytical systems are complex and usually involve multi-step procedures. Most analytical methods prescribe quality control measures designed to monitor the performance of an analytical system at key junctures along the analytical train. Each quality control element is designed to monitor a specific activity. There are several generic measures that should be targeted and/or implemented across the board in all analytical procedures: these include selection of appropriate method detection limit; use of blanks in the analytical process; calibration of instruments; assessment of analytical accuracy; and assessment of analytical precision.
Method Detection Limits: Method Detection Limits (MDLs) must be determined for each analyte of interest, (including ranges of analytes as is the case with the carbon number ranges associated with the Air-Phase Petroleum Hydrocarbon (APH) method). As discussed in Section 2.5, MDLs are statistically derived numbers and are theoretically the lowest amount of an analyte that can be determined to be above background instrument noise with 99% confidence. The MDL is directly related to the instrument detection limit (IDL). The IDL defines the “best” or lowest concentration the instrument can detect and the MDL defines the best the instrument can detect by that method.
The most useful types of detection limits to investigators are the Practical Quantitation Limit (PQL), the reporting limit (RL) or the Sample Quantitation Limit (SQL). All represent the same type of information and all are derived by multiplying the MDL by a factor of 3-5 to ensure that under daily analytical conditions, this value can be achieved.
Determination of the MDL is usually done once per year per laboratory. Typically, a set of seven samples, each containing the analyte of interest at a concentration equal to the estimated IDL is analyzed. The standard deviation of the results is calculated and this value is multiplied by 3.14 (which represents the T-value from the Student T-test at n-1 for a sample number of seven). This statistically derived number is then multiplied as discussed above. The choice of the multiplier is based on a professional judgment or management decision. However, since detection limits are statistically derived values based on standard deviation, there is uncertainty involved without verification. For this reason it is strongly suggested that the lowest instrument calibration standard always be set at the reporting limit (see Instrument Calibration discussion below).
Blank samples: Analytical blank samples are used to monitor for the presence of non-target compounds or sample “carryover”. Carryover occurs when analytes from a highly contaminated sample remain in the system (i.e., are not fully desorbed) and compounds associated with the
70
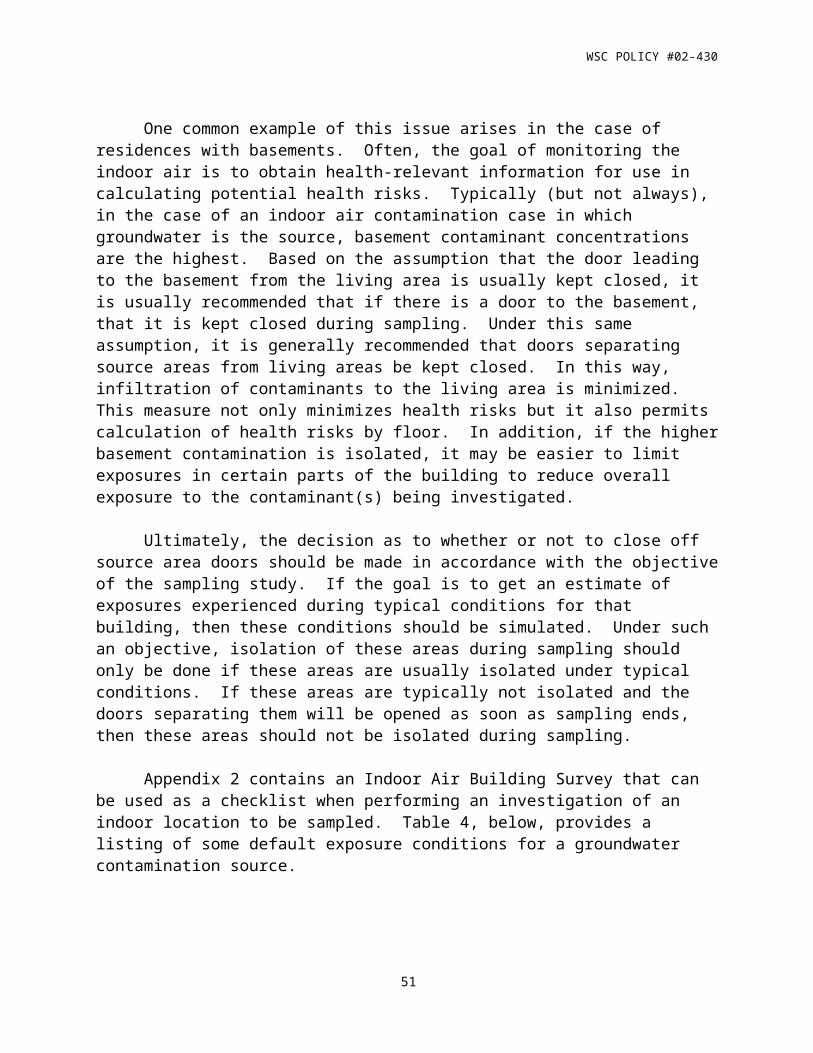
WSC POLICY #02-430
highly contaminated sample show up in the next sample. There are different types of blanks that are used for different purposes. These include method blanks and instrument blanks. Method blanks are analyte-free matrixes that are designed to assess contamination from sample processing. Instrument blanks are designed to assess baseline drift and carry-over.
Instrument Calibration: Analytical instruments must be calibrated for quantitative treatment and analysis. Calibration involves analyzing a series of standards which contain the analytes of interest at several different concentrations. Initial calibrations (ICALs) are 3-5 concentration levels of standards containing all of the analytes of interest performed at the beginning of analysis or when the continuing calibration fails. ICALs are analyzed to determine the reporting range of the instrument for the compounds of interest. As discussed above, it is highly recommended that the lowest calibration concentration be set at the RL.
Specifications for setting the lower limit of the instrument calibration range vary among methods. For example, the APH method specifically requires that the RL be evaluated as the lowest instrument calibration standard. However, under method TO-14, the MDL is designated as the RL. In such a case, due to the uncertainty of statistically derived values, it is recommended that the lowest instrument calibration standard be run at the MDL.
Continuing calibrations (CCALs) are mid-level calibration standards containing all of the compounds of interest designed to assess the accuracy of an instrument. They are usually run on an on-going (at least daily) basis.
Assessing Precision: Precision is a measure of the reproducibility of a system or how close two sample results are to each other. To determine precision, matrix spikes (MS) and matrix spike duplicates (MSD) are used. For air samples, MS and MSDs are prepared by injecting a known concentration of selected target analytes into two different sampling media of the same kind and then performing the analysis as with any other sample. The percent relative standard deviation (% RSD) is calculated for the two samples using the equation:
% RSD = ABS VAL(x2 – x1) x 100xaverage
where x1 and x2 represent the values for the MS and MSD samples, ABS VAL(x2 – x1) represents the absolute value of the difference between these two values and xaverage represents the average of the two values. Acceptable values for % RSD are generally < 25.
Assessing Accuracy: Accuracy is a measure of how close an unknown sample value is to the known or true value. One measure that can be taken to maintain a higher level of accuracy is to assure that samples are stored and analyzed within the required holding time (consult sampling method for recommended holding time as well as Appendix 3 of this document). Exceeding recommended holding times may result in the loss of analytes of interest and therefore in results which are inaccurate.
Another quality control element used to assess accuracy is the standard reference material (SRM) which consists of the matrix of interest (in this case, air) which has been spiked with
71

WSC POLICY #02-430
analytes at concentrations verified by the manufacturer of the SRM. The SRM is generally obtained from an external source (i.e., vendor-supplied) and is used to assess the accuracy of the preparation and analysis of the samples. The percent recovery of the spiked analytes, (% R), is used to determine accuracy and is calculated using the equation:
% R = Concentration Detected x 100 True Concentration
Typical values for acceptable % R are between 70-130.
7.5 Sampling and Analysis Quality Control Acceptability Criteria
Criteria for the evaluation and usability of these sampling quality control measures should be identified as part of the data quality objectives process before work commences on the project. Often, sampling and analytical methods provide a discussion of acceptability criteria for these parameters as presented in the above sections. Ultimately, these criteria must be identified by the investigator for the analysis being conducted. Information from the sampling/analysis literature as well as professional judgment may also be used to identify these criteria. To assist in this process, the investigator may use the general approach for analytical data validation and data usability contained in “Test Methods for Evaluating Solid Waste, Physical/Chemical Methods” (SW-846) (EPA,1997) as well as the EPA “Region 1, EPA-New England Data Validation Functional Guidelines for Evaluating Environmental Analyses” (EPA, 1996a).
If the identified performance criteria are not within the recommended specifications for acceptability of the method, MADEP would conclude that the validity of the data is questionable and thus the quality control results are unacceptable. In such a case, the laboratory may supply documentation as to why the data should be accepted. There may be some instances in which the performance criteria is not met for a reason that can be explained, for example based on the properties of the methods or the analysis. It is left to the investigator in such cases to highlight this (these) issue(s) and provide justification for accepting the analytical data in light of the quality control results.
72

WSC POLICY #02-430
Table 9. Selected List of Quality Control Elements
Quality Control Element Description Frequency Purpose SynonymsSamplingDuplicate Samples Two or more samples
collected simultaneously
At least one set of parallel samples per sampling event.
To improve confidence in measured concentrations.
Replicate samples; collocated samples; parallel samples.
Field Blank Clean sampling device which accompanies sample to field and back to laboratory
At least one blank per sampling event
To assess contamination from transportation of samplers to and from the field.
Blank
Series Sampling(with cartridge sampling)
Two or more cartridges attached in series
One series sampling set-up per sampling location with highest expected concentrations.
To detect “breakthrough” and loss of sample
Back-up Cartridge
AnalysisInstrument Blank Solvent spiked with
Internal Standard (if used)
At least one per analytical batch (method-dependent)
To assess baseline drift of instrument and carryover of previous samples
Blank
Method Blank Analyte-free sampling device analyzed like samples
One per analytical batch To assess contamination from sample recovery
Blank
Matrix Spike (MS) and Matrix Spike Duplicates (MSD)
Aliquots of field samples spiked with compounds of interest and analyzed like samples
One MS/MSD per analytical batch
To assess accuracy and precision of analyses relative to matrix
Laboratory Fortified Matrix Spike
Standard Reference Material
Standard Matrix (air) with analytes at verified concentrations
One per batch External source to assess accuracy of preparation and analysis
Vendor-supplied standard; material-supplied standard
73

WSC POLICY #02-430
8.0 DATA EVALUATION PROCEDURES
8.1 Overall Approach
The process for integration of data collected from and produced by a sampling program with regulatory decision criteria is an evolving process. Figure 17 gives a schematic of this process. Section 8.2 below discusses the components of the flowchart in Figure 17. The subsequent subsections contain additional detail on data quality assessment and risk assessment.
8.2 Indoor Air Evaluation and Response Under the MCP
The flowchart in Figure 17 is intended to illustrate the routine thought process that is typically followed by an investigator conducting an indoor air evaluation under the Massachusetts Contingency Plan. This evaluation process centers around four key elements including: comparison to typical “background” concentrations from the indoor air literature; investigation and identification of possible sources; determination of critical exposure pathways; and the achievement of a response action outcome. Each of these elements is discussed below as it pertains to the overall evaluation and response under the MCP.
Background – As discussed in more detail in Section 5.9 of this document, “background” in the context of this document and the MCP refers to typical concentrations of contaminants in indoor air as compiled in literature surveys of buildings. Comparison to background is used in the MCP to help in determining whether an environmental medium may have been contaminated. When doing a comparison of detected indoor air contaminant concentrations to background, a detected contaminant concentration that is higher than the typical background concentration of this chemical may indicate that there is an atypical, possibly extraneous source of this compound impacting the air.
Source Investigation – Various types of information about a contaminated site and the building being investigated can be used to help in determining whether the site may be impacting the indoor air of the building. The results of air samples taken in various parts of a building (e.g., such as a home or school) can be reviewed and compared to determine whether there are any contaminant concentration gradients or hot spots among the various floors or rooms in the building. This type of comparison is useful in trying to determine whether contaminants found in the indoor air may have originated from contamination introduced to the ambient environment. In the most common MCP indoor air contamination scenario, contamination in soil or groundwater infiltrates the foundation of a building and is released to the indoor air. Figure 16 illustrates a number of hypothetical cases for a contaminated groundwater scenario comparing relative magnitudes of basement and living area concentrations along with how they compare to background concentrations. The top half of Figure 16 addresses scenarios in which basement concentrations are greater than living space concentrations. The bottom half addresses scenarios in which living space concentrations are greater than basement concentrations. In all cases, the potential existence of multiple (i.e., site-related and/or non-site-related) indoor sources of contamination is possible. Generally speaking, if basement concentrations are elevated above background and there is a decreasing contamination gradient from the source (e.g., basement) area on up, there is a good chance that detected concentrations are due to a groundwater source
74

WSC POLICY #02-430
of contamination. However, it is also possible that other sources (e.g., stored products) may be present in the basement and possibly even in the living area, potentially confounding site-related concentration gradients. Thus, if contamination distribution is interpreted to be solely site-related, it may lead to erroneous conclusions. The importance of inspecting a building prior to conducting sampling is emphasized by such a scenario. Table 11 complements Figure 16, providing some interpretation and recommended actions for each scenario.
In addition to comparison of concentration gradients, other information about the site and the building being investigated should also be considered in evaluating a possible source. A comparison of the lists of contaminants detected in groundwater and soil gas to the lists of those detected in indoor air should be made to assess whether they are similar. An inspection of potential indoor sources of contaminants may be made to help in determining whether these may be contributing to concentrations of the contaminants detected in the indoor air. Often basements are used to store solvents, etc. and emissions from these products might confound interpretation of true contaminant gradients. Table 11 below provides some steps that can be taken to evaluate a potential site-related source of indoor air contamination.
Critical Exposure Pathways and Substantial Release Migration – As discussed in Section 1.2.2 of this document, the evaluation of an indoor air exposure scenario under the MCP in which there has been a release to groundwater should include assessment of potential Substantial Release Migration (SRM) conditions or existence of a Critical Exposure Pathway (CEP). As the flow chart indicates, a condition of SRM can be shown to exist if basement contaminant concentrations demonstrated or suspected to be source-related exceed typical background concentrations in a number of scenarios. An SRM condition for potential future contamination can also be shown to exist if groundwater monitoring and hydrogeological data indicates that plume contamination is likely to result in the discharge of vapors into school buildings or occupied residential dwellings within a year. Each of these scenarios has a 72-hour notification requirement and triggers a requirement to implement an Immediate Response Action (IRA). An IRA must be performed that is presumed to prevent, eliminate, or, at least mitigate, the exposure. A feasibility evaluation should only be done if there are no apparent alternatives that will prevent/eliminate or mitigate the CEP.
Risk Evaluations and Response Action Outcomes – All remedial actions taken at the site are implemented towards achieving a Response Action Outcome (RAO). The flow chart indicates that sampling should be done consistent with the types of risk assessment evaluation to be performed. Additional discussion on the different types of risk assessment evaluation is contained in Section 1.2.1. The results of the risk assessment will determine whether a Class A, B or C RAO has been achieved.
75

WSC POLICY #02-430
Table 10. Steps in the Evaluation of Potential Indoor Air Impacts
Compare groundwater contaminant concentrations to GW2 standards.
Make sure groundwater data is from the same aquifer and is in close proximity to the building where the indoor air is being evaluated.
Make sure soil gas data has been taken from soil gas tested for the building under investigation.
Compare list of contaminants detected in indoor air to lists of contaminants detected in groundwater and soil gas to determine if they are similar.
Make sure that the media-specific (i.e., groundwater, soil gas and air) analytical methods can detect the contaminants of concern under study.
Make sure that the detection limits of the methods are sensitive enough to detect concentrations of concern.
Compare indoor air concentration data to compound-specific background concentrations from the literature.
A comparison to a 75th percentile value or higher is recommended. Site-specific outdoor background data should not be used as an estimate of indoor background.
Compare indoor air concentration data detected in different parts of the building to evaluate presence of concentration gradients or hot spots.
It is recommended that this comparison be made using data which was all obtained on the same day and analyzed using the same method
Check for indoor sources of the chemicals under study.
Check cleaning supply and solvent storage areas, dry cleaning, household product usage, etc.
76

WSC POLICY #02-430
Figure 16. Relative Indoor Air Concentration Scenarios for a Groundwater/Soil Gas Contamination Source
[Basement] > [Living Space]
[Basement] < [Living Space]
[Basement] > [Background][Living Space] > [Background]
Basement
Living SpaceBackground
(1)
Basement
Living Space
Background
[Basement] > [Background][Living Space] < [Background]
(2)
Basement
Living Space
Background
[Basement] < [Background][Living Space] < [Background]
(3)
Basement
Living Space
Background
Basement
Living Space
Background
Basement
Living Space
Background
[Basement] > [Background][Living Space] > [Background]
[Basement] < [Background][Living Space] > [Background]
[Basement] < [Background][Living Space] < [Background]
(4) (5) (6)
77

WSC POLICY #02-430
Table 11. Some Interpretations and Recommended Actions for VariousIndoor Air Concentration Scenarios
[Basement] > [Living Space]Scenario Relative Concentrations Interpretation Action
(1) [Basement] > [Background][Living Space] > [Background]
Likely due to a groundwater source (although any possible indoor sources should also be noted in a pre-inspection)
SRM/CEP:Pursue remedial measures
(2) [Basement] > [Background][Living Space] < [Background]
Likely due to a groundwater source (although any possible indoor sources should also be noted in a pre-inspection)
SRM/CEP:Pursue remedial measures
(3) [Basement] < [Background][Living Space] < [Background]
Not immediately indicative of a groundwater source of contamination
May be due to a groundwater/soil gas source if find same pattern of contaminants in indoor air and in groundwater/soil gas
Pursue source reduction measures and conduct further investigation
[Basement] < [Living Space]Scenario Relative Concentrations Interpretation
(4) [Basement] > [Background][Living Space] > [Background]
Possible multiple sources (i.e., groundwater source and/or preferential migration pathway) and other indoor sources)
SRM/CEP:Pursue both remedial and source reduction measures
(5) [Basement] < [Background][Living Space] > [Background]
Possible multiple sources (i.e., groundwater source and/or preferential migration pathway) and other indoor sources
Pursue source reduction measures and conduct further investigation
(6) [Basement] < [Background][Living Space] < [Background]
Likely not being impacted by a groundwater source
Response Action Outcome
78

WSC POLICY #02-430
Figure 17. Indoor Air Evaluation and Response Under the MCP
Compare [indoor air] to [background]
Either [basement] or [living space] > [background]?
Compare [living space] to [basement] yes
[basement] > [living space]?
Implement IRA to addressIH or SRM and limit
exposures
Is it feasible to implement additionalresponse action requirements to eliminate,
mitigate or prevent a CEP?
yes
yes
Implement additional measures to eliminate
or prevent a CEP
no
Additional measuresnot required
Implement ongoing remedial activitiestowards achieving Response Action
Outcome
Conduct sampling in a manner consistent with riskassessment evaluation to be performed (i.e.,
imminent hazard, substantial hazard, significant risk).
Evaluate to see whether concentrationsare in the acceptable total risk range
Investigate otherpossible indoor
air sources
Resample and determine: Does a complete migration
pathway exist?
no
Review groundwater monitoring and hydrogeological datato determine whether contaminated groundwater plume
is within one year likely to result in the discharge ofvapors into school buildings or occupied residential dwellings.
yes no
Substantial ReleaseMigration
No flow predictedtowards buildings;no future impact
expected
Compare (living space] to [basement]
[basement] > [living space]
noyes
Although action not required per the MCP, if concerned, residents can
take source-reduction measures focusingon identifying and reducing use of toxic
household products.
no
72-hournotificationrequirement
72-hour notification requirement
If [basement] > [background]and [living space] > [basement]
If [basement] <[background]and [living space] > [background]
yes no
Indicative of possible multiple sources;pursue both remedial measures and
source reduction measures
72-hournotificationrequirement
(SRM)Perform Risk Assessment (i.e., imminent hazard,substantial hazard, significant risk) as appropriate.
Imminent Hazard
SubstantialHazard
SignificantRisk
yes yesno no noyes
Class A, B or C
Remedial Action
Outcome
Are the contaminants in the indoor air also detected inThe groundwater, sump water, and/or soil vapor?
no
yesBEGIN
QA/QC Checkyes
79

8.3 Conversion of Units
Air concentrations of VOCs can either be expressed as mass per unit volume or as volume of gas per volume of air (e.g., parts per million (ppm)). In the interpretation of data, it is often necessary with VOCs to convert from one type of unit to another to allow for comparisons between toxicity values or background values, for example. The equation used to calculate such a conversion for a VOC is based on the Ideal Gas Law. The long version of the equation is given as:
ppm = mg/m 3 x 22.4(T 1/273o)(P1/760 mm Hg)MW
where:
T1 = Temperature (in degrees Kelvin)
P1 = Pressure (in millimeters of mercury)
MW = Molecular weight of the compound (grams per mole)
MADEP calculates conversions assuming atmospheric pressure (one atmosphere = 760 mm Hg) and, unless site-specific information indicates otherwise, at 298oK (i.e., 25oC). This simplifies the conversion equation to:
ppm = mg/m 3 x 24.45 mg/m3 = ppm x MW MW or, alternatively: 24.45
8.4 Data Quality Evaluation
Once the indoor air data have been collected and analyzed, the results need to be evaluated in terms of how they will be used in the risk assessment process. The data should initially be screened using the data quality control parameters and data quality indicators discussed in previous sections. A Quality Assurance/Quality Control Checklist: Indoor Air Monitoring of Volatile Organic Compound is included in Appendix 3 to help with data validation. If it is concluded that the data are reliably representative of actual indoor air concentrations, interpretation of the data for use in risk assessment can begin.
There are several situations which call for further interpretation of monitoring results. These include: the treatment of Non-Detects (NDs); the treatment of contaminated laboratory or field blanks; and the treatment of tentatively identified compounds.
Non-Detects: A laboratory analysis that returns a “Non-Detect” or “ND” result indicates that the indoor air concentration of that contaminant on the day sampled was below the analytical detection capability of the method being used, or below the

WSC POLICY #02-430
reporting limit. An ND result does not necessarily mean that the concentration of the compound is zero. There are three situations which may be represented by an ND result: The first situation is that the compound is truly not present in the indoor air. Such a conclusion can be drawn if, for example, there is no evidence from site history that there has ever been a release of the contaminant at the site and that the compound has not been detected in any groundwater or soil gas samples from the site. The second situation is that the contaminant may actually be present at the site at a concentration between zero and the detection limit. The third situation (which is probably not as common with indoor air situations as it is with other media) is that the contamination may truly not be present in that sample although it may still be present at the site in a more localized way in other areas.
The literature describes several options for dealing with ND results, including log-probit analysis, maximum likelihood estimation and probability plotting procedures (Travis et al., 1990; Helsel, 1990). The level of effort and the number of data points required to effectively use these methods vary. It is recommended that the risk assessor use professional judgment in the selection of a method to treat ND results and state explicitly how NDs have been treated in the description of the study methods.
MADEP believes that, for estimating exposure point concentrations at most sites, a more straightforward approach is often appropriate (MADEP, 1995a). When a contaminant is detected or likely to be present in the area under investigation and the laboratory reports the concentration of a compound of interest in a sample as ND, the concentration of that compound in that sample should be assumed to be one-half of the detection limit.
This approach is easy to use. The benefits of using this method must be weighed against the bias which is introduced in the resulting exposure point concentration estimate. The ND method selection should also consider the often high level of uncertainty which is often inherent in environmental sampling and analysis procedures. This uncertainty may result from taking an inadequate number of samples, mistakes on the part of the sampler, the heterogeneity of the matrix being sampled, and intentional bias in the sample collection. For relatively small sites, these inherent uncertainties may overwhelm the bias introduced by using one-half the detection limit. A more statistically oriented ND method may not, in such cases, significantly reduce the uncertainty inherent in the resulting exposure point concentration. The decision as to the level of statistical sophistication appropriate to the data set is left up to the risk assessor.
There may be exceptions to this guidance, particularly when the site history and the NDs may indicate the absence of a compound of interest at the site (or areas within a site). In the latter case, the chemical may be dropped from the quantitative risk assessment or the NDs may be factored into the exposure point concentration as zero values with appropriate justification.
Treating Blanks: A set of laboratory data that is returned showing contamination in either the field or laboratory blank indicates that the results of the analysis may be
80

WSC POLICY #02-430
questionable. The blanks used for these purposes serve as negative controls. Any contamination found in a blank could be an indication of a general problem with the method. Alternatively, the blank contamination could be a one-time problem affecting only that one blank. As was discussed in Section 7.3 for field blanks, if a blank contains any target analyte above its reporting limit or contains additional compounds with elution characteristics and mass spectral features that would interfere with identification and measurement of a method analyte, it is considered contaminated and should be “flagged” as possibly contaminated. MADEP does not recommend that “blank correction” (i.e., in which the quantity of contamination in the blank sample is subtracted from the quantity found in the actual samples) be conducted. (EPA, 1984).
Tentatively Identified Compounds: Tentatively identified compounds (TICs) are compounds which are detected during sample analysis, but are not target compounds or parameters for that particular analysis. TICs are often reported when gas chromatography/mass spectrometry (GC/MS) is used to analyze organic compounds. Target compounds and parameters are those for which the instrument was calibrated, using a chemical standard, prior to analysis. The ability of the MS system to store mass spectra electronically in a library enables the analyst to compare the library spectra with the spectra produced by a non-target contaminant when one shows up in an environmental sample. Identification based on library comparison is much more uncertain, however, than one based on calibration with a standard for the target compound. Reported TICs should be accompanied by a statement by (or checking by) a mass spectrometrist.
The MADEP has no rule of thumb for whether TICs should be included in the risk assessment. Confidence in a TIC identification depends on a number of factors, including site history and the presence of similar compounds at the site. There are several ways in which the uncertainty associated with TICs may be reduced. The EPA “Data Usability Guide” gives the following suggestions: A trained analytical chemist can review the mass spectrometer results and may be able to eliminate false positive identifications; use of retention times and retention indices may confirm identifications made with the GC/MS computer; review of historical data, industry reports, past analytical reports conducted by other laboratories or other information may indicate whether the TIC has ever been present on the site; if the above steps do not help in increasing confidence in the TIC identification, the sample can be reanalyzed following a recalibration of the GC/MS with an authentic standard of the compound that the TIC is believed to be; ultimately, it may not be necessary to obtain a confirmatory identification of the TIC if it can be concluded that it is a member of a compound class from which the risk assessor may be able to make some determination of toxicity.
The identification of a TIC can be confirmed definitively only by further analysis. However, depending on the analytical and historical information available, and the potential impact of the TIC on the results of the risk assessment, confirmatory analysis may not be warranted. The risk assessor should work with the project manager and an analytical chemist to make a prudent decision about the need for follow-up analysis.
81

WSC POLICY #02-430
8.5 Data Representativeness
A review of the analytical results should be conducted in terms of whether the data are representative of the indoor air exposure situation. Although it is hoped that the representativeness of the data has already been provided for in the design of the sampling study, a review of the data should be conducted to assure that the design objectives have been met. At a minimum, the following parameters should be evaluated in terms of how they relate to the exposure situation: seasonality, duration and frequency of exposure. It should be established that the sampling scheme used has adequately targeted the range of seasonal exposure situations. For example, for a suspected groundwater source, it should be confirmed that the data was taken under a range of conditions, including during a period in which groundwater levels were at their highest and air exchange rates at their lowest. In addition, it should be determined whether the number of samples and the sample duration is adequate to obtain a representative estimate of exposure.
8.6 Determination of Possible Data Trends
A review of the data should also be done to identify any increasing or decreasing concentration patterns or trends in contamination (e.g., among various floors or different sections of a building). For example, a data set which indicates that contaminant concentrations are highest in the basement level and progressively decrease with increasing floor level, may point to a basement or groundwater source. A data set which indicates higher concentrations in the top levels or uniformity among levels may instead point to an ambient air contaminant source. Thus, in addition to providing information for a quantitative analysis, the data can be reviewed qualitatively to provide additional information on contamination patterns. The contamination trends identified in this step can also be used as one of the criteria for selecting the contaminants of concern for the evaluation.
8.7 Comparison of Data With Chemical Background ConcentrationDistributions
As discussed in Section 5.9, it is important to establish the indoor air background concentrations of the detected target compounds and parameters. This information allows for the comparison of indoor air monitoring results to levels of the same compounds that might be expected in the absence of a contaminated site. In the absence of site-specific data (i.e., data collected from the building before it was impacted by the contamination in question), literature data are the next best source of information on typical background concentrations. They are probably the most frequently used type of background data used to evaluate indoor air sampling results. Outdoor air samples should not be used as an estimate of indoor background, especially when evaluating VOCs since concentrations of many compounds (particularly VOCs, which are emitted from many indoor sources) are higher in the indoor air than they are in outdoor air. Nevertheless, the investigator should include an outdoor air sample to allow for a comparison of indoor to outdoor concentrations.
82

WSC POLICY #02-430
Under the MCP, the MADEP focuses its resources on contamination which is attributable to a release of oil or hazardous material and which has the potential to pose significant risk of harm to health, safety, public welfare or the environment. In a situation where there is no other compelling evidence of site-related contamination, chemicals which are present at levels consistent with background are not assumed to be site-related and should also be removed from the risk characterization process. They are, by definition, at a level of No Significant Risk as per 310 CMR 40.902(3). Conversely, chemicals that are present at concentrations above background are assumed to be site-related and should not be eliminated from the risk assessment process unless it can be demonstrated, based on other information collected about the site, that this assumption is not likely. Thus, information on background indoor air concentrations should be used to evaluate indoor air sampling results in the context of all the information collected about the nature of the contamination and the site and is not be used independently as a bright line indicator for making a determination about site-related impact and risk.
Indoor air measurements from a building are influenced by both indoor and outdoor non-site-related sources, in addition to possible site-related sources. In theory, there may be situations in which measured values fall within what we would call the range of background values but actual background contribution for that location is actually very low or falls on the low end of the literature distribution, the remainder being contributed by the site. There are also cases in which a sample may appear to be below background but for which comparison of concentration trends by floor in the building indicates a likely outside source of VOCs which would merit additional investigation under the MCP (See Section 8.2 for additional discussion).
It should be noted that literature background used under the MCP represents higher percentile values, generally in the 75th-95th percentile range. It is a generous estimate of background which should encompass the range of concentrations of the vast majority of structures. However, as stated above, literature background should not form the sole basis for determining site impact and other compelling evidence of contamination from a site should not be ignored in making this determination. If necessary, additional air sampling or other investigation should be conducted to obtain more information about the situation. Professional judgment should be used to systematically and logically come to a decision about impact using all available information. If the evaluation indicates that the building is being impacted by site contamination, appropriate steps can then be taken to reduce the concentrations and eliminate the exposure pathway.
Although multiple exposure points may be averaged to estimate a chronic exposure point concentration for purposes of risk assessment, average concentrations should not be used when comparing site data to indoor air background data. For the purpose of demonstrating impact from the site, data from each sampling event should be evaluated separately and should not be averaged.
83

WSC POLICY #02-430
When it is not practical to conduct indoor air monitoring (e.g., as in the case of an operating industrial workplace) and modeling of indoor air concentrations is judged to be the best alternative, it would be appropriate to compare modeled concentrations to background concentrations in this case. However, MADEP generally recommends that monitoring rather than modeling be used whenever possible to estimate exposure point concentrations.
For additional information on identifying indoor air background concentrations, see Section 5.9.
9.0 HEALTH RISK ASSESSMENT UNDER THE MCP
9.1 Comparison of Data with Applicable MCP Guidance
Under the MCP, there are three methods available by which environmental concentration data may be evaluated to determine whether they may pose a significant risk of harm to health. Methods 1 and 2 involve comparison of measured chemical concentrations to sets of media-specific (e.g., soil and groundwater) standards. There are no air standards available in the MCP. The only standards that, even indirectly, address air are the Groundwater 2 (GW-2) standards which were developed based on consideration of volatilization of contaminants from groundwater to indoor air. The derivation of the GW-2 standards involves mathematical modeling from groundwater to soil gas and from soil gas to indoor air. The derivation is based on the lowest of either 20% of an allowable daily exposure limit based on non-cancer health effects (such as an EPA inhalation Reference Concentration (RfC) or the equivalent), an excess lifetime cancer risk equal to one in one million, or a 50% odor recognition level (the 50% odor recognition level is defined as the concentration at which 50% of the population can detect a compound’s odor (MADEP, 1994b)). In addition, if a typical background concentration of the compound in indoor air is identified from the literature, the higher of either background or the lowest air concentration identified above (as discussed in the previous sentence) is selected. The derivation process next uses a model which considers the potential for the chemical to volatilize from the groundwater and migrate through the unsaturated zone (Johnson and Ettinger, 1991). The model results in the identification of a groundwater concentration associated with the indoor air concentration identified above. A value of one-half the solubility of the chemical is identified. A ceiling concentration of 0.005% (50,000 g/l) is noted. The modeled groundwater concentration, the solubility value and the ceiling concentration are compared and the lowest of these three groundwater concentrations is identified. A Practical Quantitation Limit (PQL) for an appropriately sensitive analytical method is next identified as well as a background concentration in groundwater, if available. The highest of the groundwater concentration value identified above and these two values is chosen and adopted as the MCP GW-2 standard. The Background Documentation for the Development of the MCP Numerical Standards (MADEP, 1994b) provides the rationale and methodology for the derivation of these Method 1 standards.
84

WSC POLICY #02-430
For evaluation of petroleum hydrocarbons, the MADEP has recently developed GW-2 standards for various hydrocarbon ranges. Ultimately, the GW-2 standards for petroleum hydrocarbons will also be primarily risk-based as they are for other compounds.
Because they are groundwater concentrations, GW-2 standards cannot be used to evaluate air concentration data. Thus, except in limited circumstances when air exposures at a site are expected to be relatively very minimal, the MCP requires that air data be evaluated under Method 3, using a site-specific risk assessment. Section 9.3 of this document discusses the risk assessment process under the MCP, along with the types and sources of toxicity information that should be used for this information.
9.2 Occupational Health Standards
Use of occupational health standards to evaluate residential risks is inappropriate under the MCP. Occupational standards are set to apply to a healthy worker, usually between the ages of about 18 and 65, who works eight hours per day, forty hours per week. These limits would not be protective for a member of the general public. It does not account for the fact that a member of the general public might include a child, an elderly person or a person who is ill. All of these types of people might have more severe reactions after being exposed to a chemical because their bodies typically have a lower capacity to deal with the chemical and fight illness. Also, unlike worker exposure which occurs only during working hours, the exposure of members of the general public to ambient air may be continuous.
If an indoor air evaluation is being conducted at an industrial workplace where manufacture and/or use of the same chemicals as those under investigation as being site-related is occurring, then a comparison to occupational standards should be done in addition to the Method 3 risk assessment. In this way, current workplace air concentrations can be evaluated to determine whether they are in compliance with recommendations and requirements of the occupational agencies including the Occupational Safety and Health Administration (OSHA), the National Institute for Occupational Safety and Health (NIOSH) and/or the American Conference of Governmental Industrial Hygienists (ACGIH). However, comparison to occupational health standards should not replace and is secondary to the Method 3 risk evaluation that should be conducted under the MCP.
Whether or not the occupational health standards apply to a non-industrial office workplace where use and manufacture of large quantities of chemicals does not occur is left to the occupational agencies to determine. A separate comparison to the occupational health standards can be made if it is felt that they are applicable; however, a Method 3 risk assessment is still required for quantification of health risks under the MCP. 9.3 Inhalation Risk Assessment Methodology as per the MCP:
85

WSC POLICY #02-430
Under the MCP, evaluation of air monitoring results is done using risk assessment. The risk assessment process, as described in the MCP Guidance Document (MADEP, 1995a), is performed with the objective of producing quantitative estimates of risk for threshold and non-threshold effects.
The risk assessment process consists of five general steps as it pertains to the evaluation of risks to public health. These include Hazard Identification, Dose-Response Assessment, Exposure Assessment, Risk Characterization and Uncertainty Analysis. In the Hazard Identification step, detected contaminant chemicals at a site which are known or suspected to pose adverse health effects are identified as Contaminants of Concern along with the effects they pose. In the Dose-Response Assessment step, the relationship between the level of exposure and the magnitude of the effect(s) of the contaminants of concern is described. Available toxicity values from EPA or other sources are identified which quantify the doses of chemicals associated with particular non-cancer or cancer endpoints. In the Exposure Assessment step, the Average Daily Exposure in terms of the potential routes of exposure, the populations exposed and the frequency, duration and extent of exposure to the chemicals via inhalation is calculated. In the Risk Characterization step, information from the first three steps is combined to estimate the threshold and non-threshold health risks associated with exposure to the chemicals. Finally, in the Uncertainty Analysis step, the uncertainty and variability inherent in the risk assessment due to the limitations in data quality and quantity and the variability in the range of responses associated with the human population is discussed. Each of these sections is discussed in more detail below. For more detailed information on this material, please consult the MCP Guidance Document (MADEP, 1995a)
9.3.1 Hazard Identification
In this first step of the risk assessment process, a summary of the analytical air data which have been collected, a list of the Contaminants of Concern (COC) in air and the health effects associated with each COC are identified.
As is discussed in Section 8.7, the indoor air analytical results should first be compared to background indoor air concentrations representative of typical indoor air conditions in the absence of the source of contamination. The comparison to background concentrations provides some information as to whether detected indoor air concentrations are the result of the daily activity in that building or likely due to a contamination source outside the building. ORS has historically used values corresponding to between about the seventy-fifth (upper quartile) to the ninetieth percentile of ranges of indoor air chemical concentrations compiled in literature surveys. As is stated in section 8.7, the MCP holds that chemicals which are present at levels above background are to be included in the risk characterization process. In addition, if a review of chemical concentration trends indicates that other compelling evidence for site-related contaminants exists (e.g., such as a well-defined concentration gradient and/or the discovery of a similar suite of chemicals in indoor air and groundwater/soil gas) ORS recommends that the chemicals involved in such a trend be included as COCs and evaluated.
86

WSC POLICY #02-430
The health effects summary for each COC should be presented in the form of a toxicity profile. A toxicity profile generally contains a comprehensive, in-depth account of the toxicokinetics, human and animal mechanisms of toxicity, genotoxicity, carcinogenicity and developmental/reproductive toxicity for the chemical of interest. Any information about the structure-activity relationship (SAR) of the compound should also be included. For more in-depth information about the requirements of a risk assessment under the Massachusetts Contingency Plan (MCP) as it pertains to Hazard Identification, please see Section 7.1 of the MCP Guidance Document.
9.3.2 Dose-response Assessment
The dose-response assessment involves a compilation of toxicity information on the health effects of the compound(s) in question. This information is obtained through human epidemiological or animal toxicology studies in the published literature. Dose-response information for a large number of compounds is represented in toxicity values published by the EPA and other government agencies.
Toxicologically, there is believed to be a concentration or level of a compound, below which adverse health effects do not occur. Theoretically, health effects are only possible once that particular level of exposure or threshold is exceeded. Systemic effects and developmental and reproductive effects are examples of threshold health effects. With a non-threshold effect however, it is assumed that every concentration or level of a compound, no matter how small, produces some effect. Carcinogenicity and mutagenicity are examples of non-threshold health effects. Many chemicals can produce both threshold and non-threshold health effects. The MCP requires that non-cancer health effects be evaluated for all compounds. In addition, any compound that has been designated to be a “possible” or "likely” human carcinogen by EPA should also be evaluated for carcinogenic effects.
9.3.2.1 Types of Dose-Response Values
Although the EPA publishes a large number of toxicity values for both non-cancer and cancer effects, a number of other government agencies, including the MADEP Office of Research and Standards, has also issued toxicity values. The following is a list of available types of inhalation toxicity values:
9.3.2.1.1 Threshold
Reference Concentration (RfC) - (in units of mg/m3) is the inhalation exposure concentration (with uncertainty spanning perhaps an order of magnitude or greater) to which daily exposure of a human population, including sensitive populations, is likely to be free of appreciable effects. The interim methodology for developing RfCs is contained in an EPA document (EPA, 1990) which describes the identification and adjustment of an experimental No Observed Adverse Effect Level (NOAEL)to estimate a human-equivalent concentration (NOAELHEC). The conversion is specific both to the
87

WSC POLICY #02-430
type of inhaled agent (particle or gas) and to the observed effect (respiratory or systemic) and adjusted for differences between various experimental species and humans. TheNOAELHEC is then further adjusted using a series of uncertainty factors to account for interspecies variation, exposure duration, protection of sensitive individuals and inadequacies in the toxicity database. The EPA issues separate lists of RfCs basedon chronic exposure duration and subchronic exposure duration. Conversion of an RfC to an inhalation RfD (in units of mg/kg/day) is not recommended.
9.3.2.1.2 Non-threshold
Unit Risk (UR) – ((g/m3)-1) is the upper 95% Confidence Limit of the mean incremental lifetime cancer risk estimated to result from lifetime exposure to a compound if it is in the air at a concentration of 1 μg/m3. Unit Risk values are issued from a number of different sources. Unit Risk values are multiplied by the concentration (in g/m3) to derive a unitless cancer risk estimate.
9.3.2.2 Sources of Toxicity Information
Both threshold and non-threshold toxicity criteria are available from a variety of sources. In the order of preference of use, these include:
o Integrated Risk Information System (IRIS) database - This database contains those values which represent a consensus judgment of the EPA Carcinogen Risk Assessment Verification Endeavor (CRAVE) which is composed of scientists from various EPA offices and the Office of Research and Development. It is the preferred source of toxicity information. The IRIS database is updated monthly and is available on the Internet.
Health Effects Assessment Summary Tables (HEAST) - HEAST contains values that have received some form of review by EPA, but have not been verified and are considered provisional. HEAST is prepared by EPA's Office of Health and Environmental Assessment, Environmental Criteria and Assessment Office, Cincinnati, OH. HEAST is scheduled to be updated quarterly and can be obtained by contacting the National Technical Information Service (NTIS) Subscriptions Department.
o Other Sources
Non-cancer:
- Allowable Threshold Concentration (ATC) - The "Allowable Threshold Concentrations" are similar to the EPA inhalation RfCs in intent but they are derived by ORS using a modified version of the methodology used by ORS to develop Threshold Effects Exposure Limits (TELs) (MADEP, 1990), an ambient air exposure guideline based on consideration of threshold-type health effects, developed for the MADEP’s air
88

WSC POLICY #02-430
toxics program. The ATC values are equal to five times the TEL values in that they do not include a program-specific factor of 20% to account for multi-media exposure.
- Other Toxicity Values developed by MADEP/ORS - ORS develops chronic and subchronic RfCs for some compounds for which no values are available in IRIS or HEAST. These values are based on available toxicological data and standard EPA approaches for developing reference doses for threshold effects. The list of chemicals includes a number of carcinogens for which EPA has not derived non-cancer toxicity values. These values can be accessed through the Massachusetts MADEP web site at http://www.mass.gov/dep.
- Agency for Toxic Substances and Disease Registry (ATSDR) - ATSDR produces Toxicological Profiles for 275 hazardous substances found at NPL sites. In the toxicological profiles, ATSDR develops Minimal Risk Level (MRLs) for threshold effects of some chemicals. These values are updated when the profiles are revised, if appropriate. An MRL is defined as an estimate of the daily human exposure to a substance that is likely to be free of appreciable risk of adverse non-cancer effects over a specified duration of exposure. MRLs are derived using the modified risk
assessment methodology the EPA uses to derive reference concentrations for lifetime exposure.
- Calculation of a dose-response value using toxicity information from the literature - Dose-response values may be derived by a qualified risk assessor or toxicologist if none of the above sources provides a toxicity value, but adequate toxicity studies are available, or if more recent, credible and relevant data becomes available. EPA approaches to the development of RfCs are described in Methods for Derivation of Inhalation Reference Concentrations and Application of Inhalation Dosimetry (EPA, 1994). The review and approval by MADEP of such a proposed value would depend upon the justification and documentation provided to support it. The development of an alternative value when an EPA or MADEP derived reference concentration is available is rarely justifiable and the risk assessor should contact the MADEP Office of Research and Standards early on in the site assessment process for prior approval before proceeding. Cancer:
- Toxicity Values Developed by MADEP/ORS - The Office of Research and Standards may develop unit risks for chemicals for which no values are available in IRIS or HEAST. When available, these values can be accessed through the MADEP home page at http://www.mass.gov/dep.
- California Environmental Protection Agency (Cal/EPA) - Cal/EPA's Office of Environmental Health Hazard Assessment (OEHHA), Department of Pesticide Regulation (DPR) and Department of Toxic Substances Control (DTSC) develop or approve cancer potency factors for use in risk assessments and as the basis for regulatory action. A list of available cancer potency factors is revised semiannually and can be obtained from OEHHA's Hazardous Waste Toxicology Section.
89

WSC POLICY #02-430
- Calculation of a dose-response value using toxicity information from the literature - (See discussion for "non-cancer" above.)
9.3.3 Exposure Assessment:
The exposure assessment is a critical component of the risk assessment process as it describes both qualitatively and quantitatively, the contact between the contamination and the people who are potentially affected by the contamination. The exposure assessment identifies the potential human receptors, the inhalation exposure pathway from the source of the contamination to the receptor and the exposure point concentrations.
Monitored exposure point concentrations in indoor air are modified by the appropriate exposure variables, reflecting the duration and frequency of exposure to indoor contaminants, to estimate a receptor’s Average Daily Exposure (ADE). The ADE is then used in combination with the relevant toxicity information to evaluate the risk of harm to health associated with inhalation exposures at the building under study.
The toxicity information generally used to evaluate this risk, Reference Concentrations and Units Risk values, are expressed in terms of air concentrations (g/m3). These values are intended to be used in combination with Average Daily Exposures expressed as applied concentrations, not dose (mg/kg/day). In the absence of an RfC or Unit Risk value, an oral Reference Dose or Slope Factor may be used to estimate risk either by 1.) calculating an Average Daily Dose (ADD) from the inhalation pathway or 2.) converting the Reference Dose to a Reference Concentration and the Slope Factor to a Unit Risk. Thus, the equation chosen to evaluate inhalation exposures will depend upon the availability and nature of the toxicity information.
9.3.3.1 Calculating a Weighted Average
When the results of a sampling study include multiple exposure points in various parts of a building, a weighted Average Daily Exposure may be calculated. The weighted average may be calculated by multiplying the exposure point concentration for each location by the exposure time at that location (usually expressed as hours per day), dividing it by the total number of hours exposed per day at all locations in the building and adding the results of each location-specific exposure point concentration to obtain the concentration-equivalent for that total number of hours exposed per day in the building. This weighted exposure point concentration can be entered in the above equation as the [OHM]. The corresponding exposure duration (ED) is then equal to the total of all the individual EDs corresponding to the individual exposure point concentrations. The following example illustrates the calculation of a weighted average.Example Weighted Average Calculation:
Location Concentration (g/m3) Exposure Duration (hours)Basement 10 1
90

WSC POLICY #02-430
1st floor 5 62nd floor 1 8
Total Exposure Duration 15
The weighted average is calculated using the following equation:
((10 g/m3) * 1 hr/15 hrs) + ((5 g/m3) * 6 hr/15 hrs) + ((1 g/m3) * 8 hr/15 hrs)= .67 + 2.0 + .53 = 3.2 g/m3
The weighted average is approximately 3.2g/m3 and the corresponding ED is (1 + 6 + 8) = 15
9.3.3.2 Calculation of Average Daily Exposure for Volatiles
Individual exposure from inhaling chemical contaminants in indoor air can be quantified. The MCP classifies any volatile indoor air contaminant as gaseous oil or hazardous material (OHM). The Average Daily Exposure to contaminated indoor air (ADEair) is dependent upon the frequency and duration of the assumed exposures. The equation is a simple adjustment of the exposure point concentration to account for the amount of time the receptor spends in the area with contaminated air. If the results of multiple monitoring studies (e.g., seasonal sampling over a year) are available, the results can be averaged to estimate a chronic exposure point concentration. However, as discussed previously, if the sampling results are to be used to rule out the indoor air exposure pathway from the risk assessment requirement under the MCP, then the sampling results under worst-case conditions, not a multiple-season average, should be used as a basis for this decision.
ADEair = [OHM]air * EF * ED * EP * C AP
where:
[OHM]air = Exposure point concentration of gaseous oil or hazardous material in the air at the Exposure Point during the period of exposure (dimensions: mass/volume; typical units: μg/m3)
EF = Number of exposure events (frequency) during the exposure period
divided by the number of days in the exposure period (dimensions: events/time; typical units: events/day)
ED = Duration of each exposure event (dimensions: time/event; typical units: hours/event)
EP = Duration of the exposure period (dimensions: time; typical units: years)
91

WSC POLICY #02-430
AP = Averaging Period (dimension: time; typical units: years)
C = Appropriate units conversion factor(s) (e.g., 10-6 kg/mg, 1 day/24 hours, 1 week/7days)
For receptors assumed to be exposed constantly (such as for many residential exposures), the Average Daily Exposure would be equal to the Exposure Point Concentration. For the evaluation of cancer risk, AP would be set equal to 70 years and the result would be a lifetime ADE.
9.3.3.3 Risk Assessment Exposure Durations
The choice of exposure parameters to use in indoor air risk assessment should reflect site-specific conditions/habits. If possible, such information can be obtained by interviewing the residents/occupants of the building under study as to the typical amount of time spent in that building. In a multi-story building, requested information could include the amount of time spent on various floors. In the absence of such site-specific information, realistic exposure parameters should be selected. For a multiple-story building, estimates should also be made of time spent on each floor per day. Table 12 below presents some risk assessment exposure durations that ORS often uses. However, different values can be used depending on site-specific activity patterns of the occupants.
Table 12. Some Default Risk Assessment Exposure Durations
Location/Receptor Duration
ResidenceInfant 24 hours/dayChild 20 hours/dayAdult 16 hours/day; 30 years
Homebound Adult 24 hours/day; 30 years
SchoolChild 8 hours/day; 5 days/week; 9 months/year; 7 years
Adult (staff) 8 hours/day; 5 days/week; 9 months/year; 25 years
Workplace Adult (office) 8 hours/day; 5 days/week; 25 years
9.3.3.4 Recommended Approach for Developing and Evaluating Non-cancer Exposures
To assess non-cancer risks, it is important to evaluate both subchronic and chronic exposures (and acute exposures, if appropriate) if these have been identified as exposure periods of concern in the development of exposure profiles. Many indoor air exposure situations occur in buildings where the concern is daily exposure over a long-
92
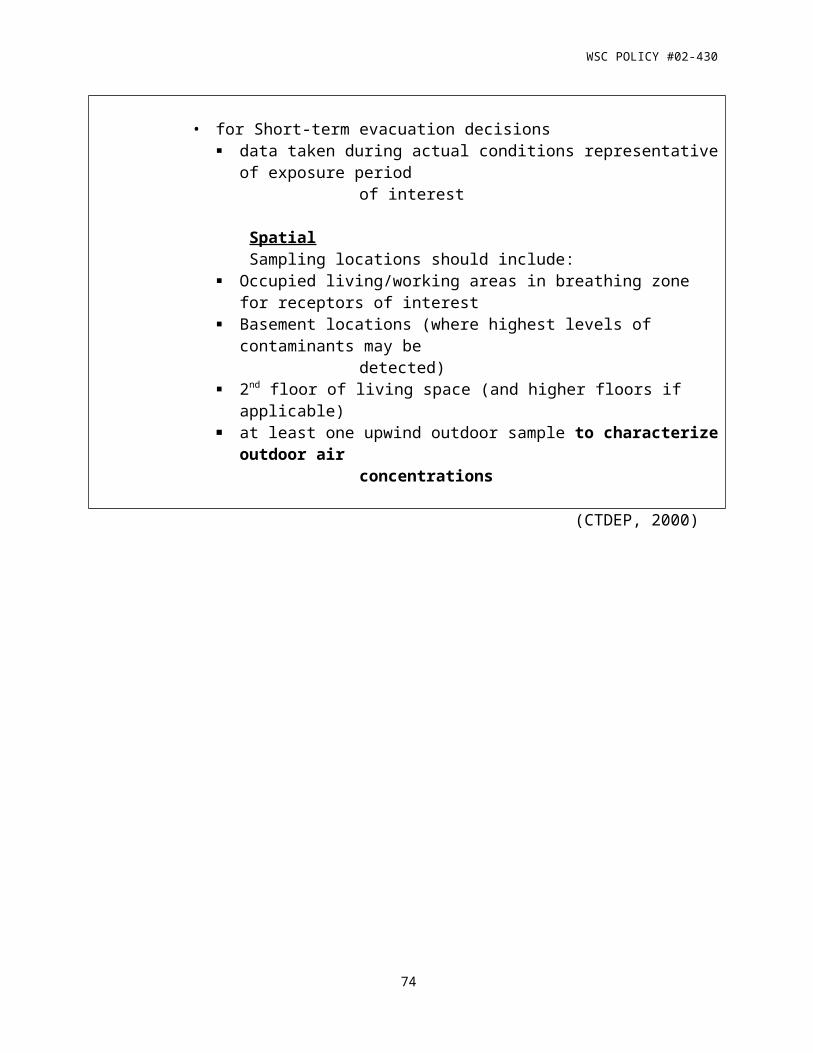
WSC POLICY #02-430
term period of time, thus indicating a chronic exposure situation. However, there are also exposure situations that occur for less than a chronic period of time and/or that involve partial year exposures.
Probably one of the most important scenarios of this type with which MADEP frequently gets involved is the evaluation of schools, daycare facilities, camps, etc., usually involving the exposure of children. It is recommended that a subchronic exposure scenario be evaluated in such cases, reflecting an exposure duration occurring for part of a year. Typically, the subchronic evaluation would assess a nine-month period (or otherwise appropriate period) of exposure occurring during a school year. This scenario should be evaluated using subchronic toxicity values, if available. In addition, a chronic exposure scenario involving a longer period of time should also be evaluated to ensure that the potential risks from both subchronic and chronic scenarios have been reviewed. When subchronic toxicity values are not available, then chronic toxicity values may be substituted.
There are other situations in which it would be appropriate to evaluate subchronic or partial year exposures. Examples of these types of exposure include renovation, construction or other short-term pollutant –generating situations which may impact the indoor air of a building. A similar approach should be taken to estimate both subchronic and chronic health risks for these scenarios.
An acute exposure evaluation should be conducted for a situation if acute exposures to high concentrations of contaminants have been identified to be of concern in a building. Acute toxicity values should be used for such an evaluation.
9.3.4 Risk Characterization:
In the risk characterization step, all of the information collected in the hazard identification, dose-response and exposure assessment steps is combined to estimate the risk at the site.
The calculated Average Daily Exposure is evaluated in terms of the available toxicity information to characterize the inhalation risks posed at the site. Non-cancer and cancer risks are assessed separately using the toxicity values identified in the dose-response step of the risk assessment.
9.3.4.1 Non-cancer Risk
The measure used to describe the potential for noncarcinogenic health effects is the Hazard Quotient (HQ). For a given chemical, the HQ is the ratio of a receptor's exposure level (or dose) for a single chemical to the "acceptable" (or allowable) exposure level for that chemical. For exposure to multiple chemicals, the chemical-specific Hazard Quotients may be summed to calculate a Hazard Index (HI).
93

WSC POLICY #02-430
A Hazard Index of 1.0 or less indicates that the receptor's exposure is equal to or less than the allowable exposure level, and it is considered unlikely that adverse health effects will occur. When the HI is less than or equal to 1.0, a conclusion that the indoor air poses an acceptable risk of harm to human health, based on non-cancer effects, is appropriate.
A HI of greater than 1.0 indicates that non-cancer health effects could occur, and cannot be ruled out. It does not mean that non-cancer effects will occur. Uncertainty inherent in most dose-response values precludes identifying a specific concentration above which adverse effects are likely and below which effects are unlikely. Accordingly, the probability of an effect cannot be quantified from a HI. For any one chemical, it is always true that the likelihood of an effect increases as the exposure level (and therefore the HI) increases.
The uncertainty inherent in dose-response values for different chemicals differs both qualitatively and quantitatively. Therefore, for different substances, the probability of an effect increases at different rates. For example, a HI of 20 for one substance may indicate a very high probability of an effect, but may represent only a moderate probability of an effect for another chemical.
In interpreting the HQ or HI, one must consider the appropriateness of the exposure assumptions and the basis of the toxicity information used to develop the dose-response values. As a general rule, the greater the HI is above 1.0, the greater the level of concern.
In its most general form, the Hazard Quotient associated with a chemical via the inhalation route of exposure is calculated as:
, or
where:
HQ = The Hazard Quotient associated with exposure to the chemical via inhalation.
[OHM]air = The Exposure Point Concentration of the Oil or Hazardous Material in air. (μg/m3)
RfC = The Reference Concentration or substitute toxicity value identified for the chemical of concern (μg/m3)
94

WSC POLICY #02-430
ADEair = The estimated Average Daily Exposure of the chemical via inhalation
(µg/m3).
The Average Daily Exposure (ADE) is calculated from the Exposure Point Concentration using exposure assumptions identified for each receptor being evaluated. Section 9.3.3 of this document (on Exposure Assessment) describes the process for calculating a receptor's ADE. The allowable dose or exposure (the denominator in the above equations) will typically be the EPA Reference Concentration (RfC) for air exposures. Selection of an appropriate "acceptable" dose is discussed in the Dose-response Section.
It is important to calculate separate HQs for acute, subchronic or chronic exposures if these have been identified as exposure periods of concern. In addition, cumulative non-cancer risks should also be calculated. A cumulative HI represents the cumulative noncarcinogenic impact that the site has on a particular receptor group. The cumulative HI accounts for exposures that a receptor may receive from multiple chemicals. Again, remember that separate cumulative HIs are calculated for acute, subchronic or chronic exposures that have been identified as exposure period of concern for the site.
As shown by the following two equations, the cumulative HI can be calculated by summing the exposure route-specific HI. Route specific HI are calculated as the sum of all chemical-specific HIs.
The documentation of the Risk Characterization must clearly present all mathematical equations used to calculate Cumulative Non-cancer Risks.
9.3.4.1.1 Screening Hazard Index
Initially, the risk assessor should use the equations above to calculate a Screening Hazard Index for a given receptor group based on all chemicals of concern at the site. A HI calculated in this way will provide a conservative estimate of the true HI because it treats as additive, different toxic effects from multiple chemicals acting on different organ systems by different mechanisms of action. In fact, in a true HI, the only endpoints which should be treated as additive are those which produce adverse effects on the same organ system by the same mechanism. Thus, the Screening HI will provide a conservative estimate of the actual HI because it reflects the sum of toxicities for multiple chemicals, regardless of the chemical's health endpoint, target organ or mechanism of action.
Recall that there may be multiple adverse health effects associated with exposure to a given chemical and it is the most sensitive adverse health effect observed in the scientific
95

WSC POLICY #02-430
data which drives estimation of the Reference Concentration and other toxicity benchmarks. Thus, for a given group of chemicals, Reference Concentrations may be based on different toxic effects on different organ systems by different mechanisms of action.
The screening HI should be compared with the Cumulative Non-cancer Risk Limit which is a HI equal to 1.0. If the screening HI is less than 1.0, then no additional effort is needed to characterize non-cancer risks. However, if the screening HI exceeds 1.0, the risk assessor may then calculate separate HIs for chemicals with similar toxic effects and mechanisms of action. (Similarly, when conducting an imminent hazard evaluation, the Cumulative Non-cancer Risk Limit is 10.)
Remember that separate screening HIs should be calculated for different exposure periods (i.e., chronic, subchronic, acute).
9.3.4.1.2 Health Endpoint-Specific Hazard Index
The procedure for segregating HIs by effect and mechanism of action is not simple and should be performed by a toxicologist. If the segregation is done improperly, an underestimate of the true hazard could result. Segregation of HIs requires identification of the major health endpoints of each chemical, including effects observed at higher doses than the critical effect on which the toxicity value is based. This is because the critical effect for one chemical may not be relevant for other chemicals and doses of other chemicals may not be additive for that effect. On the other hand, additive impacts could be important for other health endpoints that are only expected at higher doses.
Major effect categories that should be considered in segregating chemicals include neurotoxicity, developmental toxicity, reproductive toxicity and immunotoxicity. Adverse effects also should be categorized by target organ (i.e., hepatic, renal, respiratory, cardiovascular, gastrointestinal, hematological, musculoskeletal and dermal/ocular).
Once chemicals have been categorized, the Cumulative Hazard Index for chemicals with similar health endpoints and mechanisms of toxicity should be calculated. Each Cumulative HI should be compared with the Cumulative Non-cancer Risk Limit which is a HI equal to 1.0 (or 10 for an imminent hazard evaluation). If any of the HIs exceeds one, then the Risk Characterization must conclude that the proposed facility may pose a significant risk to human health based on the risk of non-cancer health effects. For additional information on the HI, please see Section 7.4.1 of the MCP guidance document (MADEP, 1995a).
9.3.4.2 Cancer Risk
The potential for carcinogenic (i.e., non-threshold) health effects is characterized as the Excess Lifetime Cancer Risk (ELCR). The ELCR represents the incremental probability of an individual developing cancer over a lifetime as a result of exposure to the potential carcinogen. For a given chemical, the estimated ELCR is the product of the receptor's quantified exposure and a measure of carcinogenic potency. The typical
96

WSC POLICY #02-430
measure of carcinogenic potency for inhalation is the EPA Cancer Unit Risk (UR). The ELCR for inhalation is calculated as:
ELCR = [ADE]air x UR
where:
ELCR = The Excess Lifetime Cancer Risk associated with exposure to thechemical via inhalation
[ADE]air = The calculated Average Daily Exposure to Oil or Hazardous Material inair (g/m3)
UR = The Unit Risk for the particular chemical of concern. (μg/m3).
The MCP requires that cumulative (or total) cancer risk be calculated to account for exposures that a receptor may receive from multiple chemicals and multiple exposure routes. The cumulative ELCR can be calculated by summing all of the contaminant-specific ELCRs. The cumulative ELCR should be compared with the MCP Cumulative Receptor Cancer Risk Limit which is an ELCR equal to one in one-hundred thousand (1 x 10⁻⁵). If the cumulative cancer risk exceeds the ELCR limit, then the risk characterization must conclude that the site poses significant risk of harm to human health based on the risk of cancer health effects. For additional information on the ELCR, please see Section 7.4.2 of the MCP guidance document (MADEP, 1995a).
9.3.5 Uncertainty Analysis
The uncertainty analysis is a critical component of the risk characterization. As described in the MCP guidance document, the uncertainty analysis should contain a narrative section which places the risk characterization (i.e., numerical risk estimates) in the overall context of decisions that the site manager will make about remediation (i.e., risk management). The uncertainty analysis does not modify the risk characterization conclusions themselves. However, a risk characterization is not considered complete unless the numerical risk estimates are accompanied by an explanation which interprets and quantifies the risk results.
Inherent in all risk assessments are many assumptions, scientific judgments and a wide variety of uncertainties, which can be introduced at each step in the risk assessment process. In addition, dose-response and exposure assessment guidance presented in this document are intended to produce conservative, consistent estimates of the potential for adverse impacts. For all of these reasons, the numerical risk estimates calculated in the risk characterization should never be interpreted as absolute, purely scientific estimates of the risk of harm to health.
97

WSC POLICY #02-430
General sources of uncertainty in the risk assessment which should be discussed in the uncertainty analysis include but are not limited to:
identification of all site-related contaminants in sampling of the environmental media at the site
modeling used to develop exposure point concentrations quantitative toxicological data used to develop cancer and non-cancer toxicity values development of exposure profiles and selection of exposure assumptions used in dose
calculations
Although the uncertainty analysis may be a qualitative evaluation of uncertainties affecting the risk estimates, the risk assessor should attempt to describe the magnitude and direction of effect that a particular area of uncertainty is likely to have on the numerical risk estimates.
9.3.6 Method 3 Risk Assessment of Petroleum Hydrocarbons Using the APH Methodology
The risk evaluation of petroleum hydrocarbons is very similar to that for individual compounds. The evaluation is actually a two-step process. In the first step, individual target analyte petroleum hydrocarbons for which there are dose-response data are quantified and evaluated separately using the risk assessment approach outlined above. These are the more well characterized chemicals including benzene, toluene, ethylbenzene, m-, o- and p- xylenes, methyl-tertiary butyl ether (MTBE), naphthalene and 2-methylnaphthalene. The second step involves compounds which have not been well characterized toxicologically and for which there are no dose-response data. These compounds are grouped into categories representing ranges of compounds defined by the number of carbon atoms in the compounds (e.g., C5 –C8 aliphatics). Each carbon-number range is then evaluated separately as a group using range-specific toxicity criteria. For a detailed discussion of the MADEP approach for evaluating petroleum hydrocarbons, please consult (MADEP, 1994a).
9.3.7 Imminent Hazard and Substantial Hazard Evaluations
The MCP defines an Imminent Hazard as a hazard that may pose a significant risk of harm to health, safety, public welfare or the environment if it were present for even a short period of time. Imminent Hazard evaluations can occur at any point in the MCP site investigation and remediation process. It is noted that in deciding whether an imminent hazard evaluation is warranted, that exposures must be actually occurring (or very likely to occur) in order for an imminent hazard to exist. The MCP risk management criteria for evaluating an Imminent Hazard is different than the risk management criteria for evaluating significant risk. The Imminent Hazard risk management criteria are described below in Section 9.4 of this document.
98

WSC POLICY #02-430
The MCP defines a Substantial Hazard as a hazard that would pose a significant risk of harm to health, safety, public welfare, or the environment if it continued to be present for several years. The time period of concern for a Substantial Hazard falls between that of an Imminent Hazard (e.g., evaluated for a “short period of time”) and a Permanent Solution (any foreseeable period of time). Substantial Hazard evaluations are typically done every five years as part of the five-year review of Class C Response Action Outcome (RAO). The MCP risk management criteria for evaluating a Substantial Hazard is the same as the risk management criteria for evaluating significant risk. The Substantial Hazard risk management criteria are described below in Section 9.4 of this document.
Additional discussion on Imminent Hazards and Substantial Hazards is found in Section 1.2.1 of this document. Section 310 CMR 40.0950 of the MCP addresses these types of evaluations in more detail.
9.3.8 Emergency Response Evaluation of BTX using Indoor AirGuidance Levels
Sometimes, the purpose of an indoor air sampling study is to determine whether the concentrations of contaminants in the indoor air may pose an immediate inhalation hazard to its inhabitants, requiring immediate action. Such a scenario would involve a sudden spill (especially of petroleum) or other such crisis as would be handled by the MADEP’s Emergency Response (ER) group. The specific action to be taken ranges from further investigation and/or mitigation (i.e., increased ventilation, source removal, etc.) to relocation of occupants.
ORS developed indoor air guidance levels in 1990 for the ER staff for benzene, toluene and xylene (BTX) for such situations (MADEP, 1991b). (Since that time, indoor air guidance levels have also been developed for trichloroethylene.) The guidelines include an acute action level, or level at which acute health effects would be expected upon acute exposure and a health-based short-term occupancy level, or level at which both acute and chronic health effects would not be expected over a sub-acute or subchronic exposure period.
The acute action level is based on acute exposures to protect against acute, non-cancer health effects. ORS defines an acute exposure for inhalation as a single exposure of any duration not to exceed twenty-four hours, with a follow-up observation period not to exceed fourteen days. If data are available for chronic health effects from acute exposure, they may also be incorporated into this value. A separate high-risk acute action level is also available for compounds for which a specific population of individuals can be identified and documented to be at higher risk from the acute exposure than the general population.
The short-term occupancy level considers both the protection of public health and the typical existing background level of a contaminant in the indoor air. Both acute and chronic toxicity are considered in terms of the protection of public health. The short term occupancy level is set as the higher of the health-based short term occupancy level
99

WSC POLICY #02-430
and the typical 50th percentile background level of the corresponding contaminant in the indoor air. This level was designed to provide guidance on how long it might be appropriate to let lower-level exposures last before an expectation of adverse health effects (i.e., time to relocate) or when it might be appropriate to allow occupants to return to a building after evacuation and initial abatement of exposure levels, while remediation is taking place. These activities should take place generally over a less than three-month period of time.
The indoor air guidance levels for a particular compound are presented within the context of a range of criteria and physical parameters to help field personnel and emergency response staff in making an informed risk management decision as to whether action is needed in a particular situation and, if so, what type of action. The criteria and parameters for a compound are presented in a fact sheet format, including the following parameters: explosivity level; occupational exposure limit; odor threshold; detection limit; practical quantitation limit; Massachusetts ambient air guidelines (i.e., 24-hour average Threshold Effects Exposure Limit (TEL) and annual average allowable ambient limit (AAL)); and information on representative percentiles (25th, 50th, 95th and 99th) of background concentrations of the compound of concern in the indoor environment.
An evaluation of detected indoor air concentrations involves comparing them to the indoor air guidance levels in the context of the rest of the parameters given in the fact sheet. The risk manager for the site must ultimately make a decision, in part based on the results of a comparison between detected levels and action levels but also considering other aspects of the site, the extent of contamination and the potential for exposure.
The applicability of the indoor air action levels is limited to situations in which there has been a fresh spill of gasoline or of any of the BTX compounds. These values are most appropriately used as screening values, when an immediate determination must be made regarding the potential for adverse health effects from exposure to the spill contaminants. In order to comply with MCP protocol regarding imminent hazards, an imminent hazard risk assessment as described above should be conducted when the potential for an imminent hazard is present.
The derivation of these values along with a discussion of their intended use is provided in the MADEP document entitled Methodology to Derive Indoor Air Guidance Levels (MADEP, 1991b). This document can be downloaded from the MADEP home page at http://www.mass.gov/dep.
9.4 Risk Management Criteria
There are three categories of risk characterizations in the MCP defined in section 1.2.1 of this document. The risk management criteria for each of these follows:
SIGNIFICANT RISK:
100

WSC POLICY #02-430
Under the MCP, a condition of “No Significant Risk” of harm to human health for a long-term period of exposure (usually defined as 30 years) exists under the following conditions:
The total Hazard Index (HI) calculated for the site is less than or equal to 1.0
The Excess Lifetime Cancer Risk (ELCR) is less than or equal to 1 in 100,000 (i.e., 1 x 10⁻⁵)
IMMINENT HAZARD
The MCP specifies that an imminent hazard evaluation shall be conducted assuming a short-term period of exposure (defined to be five years unless site conditions indicate a shorter time period is appropriate).
A condition of “No Imminent Hazard” exists if:
the Hazard Index calculated for the site is less than or equal to ten (10)
the estimated ELCR is less than or equal to one in one hundred thousand (1 x 10⁻⁵)
SUBSTANTIAL HAZARD :
The MCP specifies that a substantial hazard evaluation shall be conducted assuming an exposure period equal to or greater than the time from site notification to the date that the substantial hazard evaluation is conducted plus five years.
A condition of No Substantial Hazard exists if: total cancer and non-cancer risks meet the “No Significant Risk” criteria presented and also given below:
the total Hazard Index calculated for the site is less than or equal to1.0
the estimated ELCR is less than or equal to one in one hundred thousand (1 x 10⁻⁵).
101

WSC POLICY #02-430
REFERENCES
Arkin, Herbert and Raymond R. Colton. 1970. Statistical Methods. 5th edition. Barnes and Noble Books. New York.
Cohen, M.A., P.B. Ryan, Y. Yanagisawa, J.D. Spengler, H. Ozkaynak and P. Epstein. 1989. “Indoor/outdoor measurements of volatile organic compounds in the Kanawha Valley of West Virginia”. JAPCA 39:1086-1093.
CTDEP (Connecticut Department of Environmental Protection). June 12, 2000. Appendix I. List of DRAFT Detailed Guidance Topics. (Indoor Air Monitoring). Connecticut Department of Environmental Protection. Bureau of Water Management. Permitting, Enforcement and Remediation Division.
EPA (Environmental Protection Agency). April, 1984. Compendium of Methods for the Determination of Toxic Organic Compounds in Ambient Air. compiled by R.M. Riggin of Battelle-Columbus Laboratories, Columbus, Ohio for Environmental Monitoring System Laboratory, EPA, Research Triangle Park, North Carolina.
EPA (Environmental Protection Agency). February, 1988. EPA Guidance for Quality Assurance Project Plans. (EPA/600/R-E8/018)
EPA (Environmental Protection Agency). September, 1988a. The Inside Story: A Guide to Indoor Air Quality. Office of Air and Radiation/Consumer Product Safety Commission.
EPA (Environmental Protection Agency). December, 1988b. Methods for the Determination of Organic Compounds in Drinking Water. Environmental Monitoring Systems Laboratory. EPA/600/4-88/039.
EPA (Environmental Protection Agency). February, 1988c. National Ambient Volatile Organic Compounds (VOCs) DataBase Update. (EPA/600/3-88/010(a)) Atmospheric Sciences Research Laboratory. Research Triangle Park. North Carolina.
EPA (Environmental Protection Agency). April, 1990. Compendium of Methods for the Determination of Air Pollutants in Indoor Air. by staff of Engineering Science for Atmospheric Research and Exposure Assessment Laboratory, Office of Research and Development, EPA. Research Triangle Park, North Carolina.
EPA (Environmental Protection Agency). September, 1992a. Air/Superfund National Technical Guidance Series: Assessing Potential Indoor Air Impacts for Superfund Sites. Office of Air Quality Planning and Standards. Research Triangle Park. North Carolina.
EPA (Environmental Protection Agency). April, 1992b. Guidance for Data Usability in Risk Assessment (Part A) Final. (Publication 9285.7-09A PB92-963356) Office of Emergency and Remedial Response.
102

WSC POLICY #02-430
EPA (Environmental Protection Agency). October, 1994. Methods for Derivation of Inhalation Reference Concentrations and Application of Inhalation Dosimetry. EPA/600/8-90/066F. Office of Research and Development.
EPA (Environmental Protection Agency). July, 1996. Guidelines and Format for Method to be Proposed at 40 CFR Part 136 or Part 141.
EPA (Environmental Protection Agency). December, 1996a. (revised from July, 1996) Region I, EPA-New England Data Validation Functional Guidelines for Evaluating Environmental Analyses. U.S. EPA-New England, Region I. Quality Assurance Unit Staff. Office of Environmental Measurement and Evaluation.
EPA (Environmental Protection Agency). June, 1997. Test Methods for Evaluating Solid Waste – Physical and Chemical Methods – Integrated Manual. (SW-846; final update III). Office of Solid Waste and Emergency Response. EPA (Environmental Protection Agency). January, 1999. Compendium of Methods for the Determination of Toxic Organic Compounds in Ambient Air – Second Edition. (EPA/625/R-96/010b) Center for Environmental Research Information.
Helsel, Dennis R. 1990. “Less than obvious”. Environ Sci Technol. 24(12):1766-1774.
Hutcheson, Michael S., Dana Pedersen, Nicholas D. Anastas, John Fitzgerald and Diane Silverman. 1996. “Beyond TPH: health-based evaluation of petroleum hydrocarbon exposures”. Regulatory Toxicology and Pharmacology. 24:85-101. Johnson, P.C. and R.A. Ettinger. 1991. “Heuristic Model for Predicting the Intrusion Rate of Contaminant Vapors into Buildings”. Environ Sci Technol. 25:1445-1452.
MADEP (Massachusetts Department of Environmental Protection). May, 1990. The Chemical Health Effects Assessment Methodology and the Method to Derive Allowable Ambient Limits (CHEM/AAL). Office of Research and Standards.
MADEP (Massachusetts Department of Environmental Protection). 1991a. Policy for the Investigation, Assessment, and Remediation of Petroleum Releases: Interim Site Investigation Protocol Document. DEP Publication #WSC-401-91.
MADEP (Massachusetts Department of Environmental Protection). 1991b. Methodology to Derive Indoor Air Guidance Levels. Massachusetts Department of Environmental Protection. Office of Research and Standards. Boston, MA.
MADEP (Massachusetts Department of Environmental Protection). August, 1994a. Interim Final Petroleum Report: Development of Health-Based Alternative to the Total Petroleum Hydrocarbon (TPH) Parameter. Office of Research and Standards, MADEP and ABB Environmental Services, Inc.
103

WSC POLICY #02-430
MADEP (Massachusetts Department of Environmental Protection). April, 1994b. Background Documentation for the Development of the MCP Numerical Standards. Bureau of Waste Site Cleanup and Office of Research and Standards.
MADEP (Massachusetts Department of Environmental Protection). July, 1995a. Guidance for Disposal Site Risk Characterization in Support of the Massachusetts Contingency Plan. Bureau of Waste Site Cleanup and Office of Research and Standards.
MADEP (Massachusetts Department of Environmental Protection). 1995b. Guidelines for the Design, Installation and Operation of Sub-Slab Depressurization Systems. Prepared by Thomas Dipersio and John Fitzgerald, Northeast Regional Office.
MADEP (Massachusetts Department of Environmental Protection). 1999. Petroleum Report: Development of Health-Based Alternative to the Total Petroleum Hydrocarbon (TPH) Parameter – Final Report. Office of Research and Standards, MADEP. MADEP (Massachusetts Department of Environmental Protection). 2000. Method for the Determination of Air-Phase Petroleum Hydrocarbons (APH) – Public Comment Draft 1.0. Office of Research and Standards and Bureau of Waste Site Cleanup.
MADEP (Massachusetts Department of Environmental Protection). June, 2001. Characterizing Risks posed by Petroleum Contaminated Sites: Implementation of MADEP VPH/EPH Approach – Public Comment Draft. Bureau of Waste Site Cleanup.
McGrath, Thomas. 1999. Department of Environmental Protection. Air Assessment Branch. (personal communication).
Hodgson, Alfred T. and Girman, John R.. March, 1989. “Application of a Multisorbent Sampling Technique for Investigations of Volatile Organic Compounds in Buildings” in Design and Protocol for Monitoring Indoor Air Quality. 1988. Nagda, N.L. and J.P. Harper, Eds. American Society for Testing and Materials. Philadelphia. pp. 246.
NHDES (New Hampshire Department of Environmental Services. October, 1998. “Residential Indoor Air Sampling Form.” Draft Residential Indoor Air Assessment Guidance Document. Waste Management Division. Site Remediation Programs.
NYSDOH (New York State Department of Health). 1997. “Indoor Air Quality Questionnaire and Building Inventory.” Division of Environmental Health Assessment. Bureau of Toxic Substance Assessment. ORS (Office of Research and Standards). November, 1991. Methodology to Derive Indoor Air Guidance Levels. Massachusetts Department of Environmental Protection. Samet, Jonathan M., M.D., M.S. and John D. Spengler. 1991. Indoor Air Pollution - A Health Perspective. The Johns Hopkins University Press. Baltimore.
104

WSC POLICY #02-430
Sexton, Ken and Steven B. Harvard. 1987. “Source apportionment of indoor air pollution” Atmospheric Environment. 21(2):407-418.
Sheldon, Linda S., Charles M. Sparacin and Edo D. Pellizzari. 1983. “Review of analytical methods for volatile organic compounds in the indoor environment” in Indoor Air and Human Health. ed. by R. Gammage and S. Kaye. Lewis Publishers. Chelsea, Michigan.
Shields, H.C., and C.J. Weschler. 1987. “Analysis of ambient concentrations of organic vapors with a passive sampler”. JAPCA 37:1086-1093.
Sokal, Robert R. and James F. Rohlf. 1981. Biometry: The Principles and Practices of Statistics in Biological Research. 2nd edition. W.H. Freeman and Co. San Francisco.
Stolwijk, Jan, A.J. 1990. “Assessment of population exposure and carcinogenic risk posed by volatile organic compounds in indoor air”. Risk Analysis. 10:1. 49-57.3M. 1982. Organic Vapor Monitor Sampling Guide for Organic Vapor Monitor #3500/3510. Organic Vapor Monitor with Back-up Section #3250. Occupational Health and Safety Products Division/3M. 220-7W 3M Center St. Paul, MN 55144.
Travis, Curtis C. and Miriam L. Land. 1990. “Estimating the mean of data sets with non-detectable values”. Environ Sci Technol. 24(7):961-962.
VDOH (Vermont Department of Health). June, 1993. “Indoor Air Study Questionnaire.” Toxicology and Risk Assessment Program.
105

GLOSSARY OF MONITORING TERMS
Adsorbent Media Trap - Device used to collect (usually time weighted) VOC samples, which is packed with a thermally desorbed and cryogenically preconcentrated adsorbent media and is capable of adsorbing many nonpolar volatile organic compounds. Examples of such media include Tenax GC (a granular polymer), activated carbon sorbents and carbonaceous polymeric sorbents (carbon-molecule sieve). The use of Tenax and carbon molecular sieves for VOC sampling is prescribed by Method TO-1 and TO-2 of the EPA’s “Compendium of Methods for the Determination of Toxic Organic Compounds in Ambient Air”.
Alkanes/Alkenes - Alkanes are simple hydrocarbons where carbons are linked together exclusively with single bonds (e.g., ethane, hexane). Alkenes are similar hydrocarbons where one or more pairs of carbons is linked with a double bond (e.g., ethene, hexene).
Aromatic Hydrocarbons - Hydrocarbons containing a benzene ring such as benzene, toluene, xylene and ethylbenzene. Background - A sample or measurement taken in any area where the air quality is expected to be comparable to the study area without the potential impact of an emission source of the target air pollutant.
Chromatogram - The response versus time stripchart output from a gas chromatograph analysis. Each chemical compound yields a unique response or peak on a chromatogram based on retention time in the chromatographic column. The size of the peak corresponds to the concentration of the compound. A chromatogram can show a collection of peaks which can “fingerprint” a mixture such as gasoline.
Column - The component of a gas chromatograph which separates a mixture of organic compounds into discrete individual chemicals. Most columns accomplish this using weak chemical interactions. Columns used for analyzing gasoline are usually inert and separated by molecular weight, molecular size and chemical bonds.
Detector - Component of gas chromatograph or hand held continuous monitor used to produce a response to chemicals under study. The detector is placed at the outlet of the column in a gas chromatograph. Each type of detector has distinctive categories of compounds to which it is sensitive or appropriate for measuring. The photoionization detector, flame ionization detector and mass spectrometer are detectors which can be used to measure gasoline. These detectors are more specific in their detection capability whereas the flame ionization detector is more general.
Electron Capture Detector (ECD) – Laboratory detector which exploits the ability of electrophilic compounds to capture electrons and uses this attribute to provide selectivity and sensitivity.

WSC POLICY #02-430
Flame Ionization Detector (FID) – Detector which uses a hydrogen-supported flame to fully combust chemicals for their analysis. It is sensitive to hydrocarbons (including methane) and less sensitive to chlorinated compounds. The FID) is less selective to aromatic compounds than the photoionization detector. The FID) is a universal detector.
Gas Chromatograph (GC) - Instrument used to separate organic chemicals qualitatively and quantitatively. A sample is initially swept on to a column where it is separated into discrete compounds. The detector located at the outlet of the column then selectively responds to these compounds and produces an output (the chromatogram). Individual compounds are identified by comparing their column retention times with those of a standard calibration mix and quantified by comparing the intensity of the response to the known calibration concentration response.
Mass Spectrometer (MS) - Laboratory detector used independently or in series with gas chromatograph which can conclusively identify organic compounds by mass distributions produced when molecules are fragmented.
Nitrogen-Phosphorus Detector (NPD) - Laboratory detector that has been optimized to respond to compounds containing nitrogen and phosphorous.
Organic Vapor Analyzer (OVA) - A portable continuous field instrument which measures organic vapors using a flame ionization detector. This instrument can be used as a field survey instrument or a portable gas chromatograph. The OVA contains an onboard supply of hydrogen which is the fuel for the flame and the sweep gas for the gas chromatograph.
Passivated Canister - Machined, stainless steel vessels (usually 6 or 15 liters) used under almost complete vacuum to take whole air samples for laboratory analysis (usually VOCs). Internal surfaces are specially treated to minimize chemical interaction with collected samples and stored calibration standards. Integrated air samples can be taken under pressure using an external pump or with a regulator using the vacuum as the driving force. Instantaneous grab samples are taken by opening the canister valve and eliminating the vacuum. Personal Sampling Pump - Battery powered vacuum pump which can be programmed for sampling period duration and flow rate.
Photoionization Detector (PID) - Continuous field survey instrument generally used to screen for potentially health relevant nonmethane organic compounds.
107

WSC POLICY #02-430
Programmed Thermal Desorber - Laboratory unit used to remove organic compounds from adsorbent trap samples and inject them into the analytical equipment (gas chromatograph). Heated carrier gas (helium) is passed through the desorber. This gas is then passed through a cryogenic trap, cooled with liquid nitrogen, where VOCs are condensed. The trap is then flash heated and contents are transferred to the inlet of the gas chromatographic column.
Total Petroleum Hydrocarbons - The aggregate amount of petroleum hydrocarbons within the carbon range C4-C12 including aliphatics and aromatics in a sample measured using any of a number of analytical methodologies. This parameter is most often user-defined depending upon the ultimate use of the data.
108

INDEX
AAL............................................................................................................................................. 100, 103Accuracy............................................................................................10, 15, 16, 17, 64, 65, 69, 70, 71, 72Activated carbon.................................................................................................................................. 106Active sampling............................................................................................................................... 17, 26Acute action level........................................................................................................................... 99, 100Acute exposures............................................................................................................. xi, 41, 42, 93, 100ADE................................................................................................................................ 90, 91, 92, 95, 97Adsorbent tube.................................................................................................................See Sorbent tubeAir exchange..............................................................................................8, 30, 31, 32, 36, 43, 44, 53, 82Air-phase petroleum hydrocarbon................................................................................................See APHAlkanes/alkenes.................................................................................................................................... 106Allowable threshold concentration.........................................................................................................88Ambient air....................1, 12, 19, 23, 26, 30, 31, 33, 37, 43, 49, 50, 52, 53, 57, 82, 85, 89, 100, 102, 106Analytical methods........................................viii, 7, 13, 17, 19, 23, 58, 59, 65, 66, 67, 69, 71, 75, 84, 108APH......................................................................................viii, xii, 7, 13, 26, 28, 29, 55, 69, 70, 98, 104Aromatic hydrocarbons.......................................................................................................19, 28, 98, 106ATC....................................................................................................................................................... 88Average daily exposure...................................................................................................86, 90, 91, 92, 93Background xii, xiv, xv, 5, 8, 14, 15, 16, 18, 19, 48, 49, 50, 55, 56, 57, 58, 65, 67, 69, 73, 74, 75, 79, 82,
83, 84, 86, 100, 104, 106Bioaerosols.............................................................................................................................................. 8Blank.............................................................................................................xii, 16, 26, 48, 68, 70, 72, 81Breakthrough...........................................................................................16, 20, 23, 24, 27, 67, 68, 69, 72Cancer risk.................................................................................................................. 2, 42, 84, 88, 93, 97Carbon dioxide................................................................................................................................... 8, 19Carbon molecular sieve............................................................................................................. 28, 69, 106Carbon monoxide............................................................................................................................... 8, 19Carbonaceous polymeric sorbents......................................................................................................... 106Cartridge............................................................................................................. xii, 17, 23, 27, 68, 69, 72CCALs................................................................................................................................................... 70Chain of custody records.................................................................................................................. xii, 67Chromatogram.................................................................................................................. 58, 60, 106, 107Chronic exposures.........................................................................................36, 42, 48, 83, 88, 91, 93, 95COC.............................................................................................................See Contaminants of concernCollection methods............................................................................11, 13, 17, 18, 19, 20, 21, 25, 27, 29Column....................................................................................................58, 59, 60, 61, 62, 106, 107, 108Comparability................................................................................................................................... 64, 66Completeness............................................................................................................................. 64, 66, 67Confirmatory sampling........................................................................................................................... 45Contaminants of concern.....................................................................................10, 13, 17, 65, 75, 82, 86Continuing calibrations.......................................................................................................................... 70Critical exposure pathway.........................................................................................xv, 3, 4, 6, 11, 73, 74Data quality indicators...................................................................................................................... 64, 79Data quality objectives............................................................................................................... 11, 64, 71Detection limit..............................................14, 15, 18, 23, 49, 50, 52, 58, 59, 65, 67, 69, 70, 75, 80, 100Detector........................................................................xii, 18, 19, 20, 23, 51, 58, 59, 60, 61, 62, 106, 107Dose-response assessment...................................................................................................................... 87DQI........................................................................................................................................................ 64DQO...................................................................................................................................................... 64ECD.............................................................................................................See Electron capture detectorELCR..................................................................................................................................... 3, 4, 97, 101Electron capture detector.......................................................................................................... 22, 61, 106

WSC POLICY #02-430
Emergency response..................................................................................................................... 5, 14, 99Evacuated canister.......................................................................................................... 11, 20, 25, 27, 29Excess lifetime cancer risk.....................................................................................84, 97, 101. See ELCRExposure assessment...........................................................................................21, 57, 86, 90, 93, 95, 98FID..............................................................................................................See Flame ionization detectorField blanks............................................................................................................... 24, 48, 67, 68, 79, 81Flame ionization detector....................................................18, 22, 23, 28, 51, 52, 60, 61, 62, 63, 106, 107Gas chromatograph............................................................................20, 21, 23, 27, 49, 63, 106, 107, 108Gas chromatography.......................................................11, 18, 19, 22, 23, 24, 25, 28, 52, 58, 62, 81, 106GC....................................................................................................................... See Gas chromatographyGroundwater. xi, xiv, 1, 3, 4, 5, 7, 9, 12, 16, 17, 30, 31, 33, 34, 35, 36, 37, 39, 40, 41, 43, 44, 47, 49, 50,
51, 54, 55, 73, 74, 75, 77, 80, 82, 84, 85, 87Groundwater 2 Standards....................................................................................................................... 84Hazard identification........................................................................................................................ 86, 87High performance liquid chromatography.........................................................................................58, 59Holding time......................................................................................................................... 25, 49, 67, 71HPLC................................................................................ . See High performance liquid chromatographyICAL...................................................................................................................................................... 70IDL............................................................................................................................................. 15, 16, 69Immediate response action................................................................................................................. 3, 74Imminent hazard...................................................................................................2, 3, 4, 96, 99, 100, 101Infrared spectroscopy............................................................................................................................. 59Initial calibrations.................................................................................................................................. 70Instrument detection limit................................................................................................................. 15, 69IP methods.......................................................................................................... xii, 23, 26, 27, 28, 52, 64IRA.................................................................................................................................................... 4, 74Mass spectrometer.....................................................................................19, 20, 23, 62, 63, 81, 106, 107Mass spectrometry................................................................11, 13, 19, 23, 24, 28, 60, 61, 62, 63, 81, 107Massachusetts Contingency Plan.. .viii, ix, 1, 2, 3, 4, 5, 7, 8, 10, 12, 13, 36, 45, 57, 73, 74, 78, 83, 84, 85,
86, 87, 91, 97, 99, 100, 101, 104Matrix spike duplicates............................................................................................................... 65, 70, 72Matrix spikes.................................................................................................................................... 65, 70MCP..................................................................................................See Massachusetts Contingency PlanMDL................................................................................................................ See Method detection limitMethod detection limit........................................................................................15, 16, 23, 65, 67, 69, 70ND................................................................................................................................................... 79, 80Nitrogen-phosphorus detector......................................................................................................... 61, 107Non-cancer risk........................................................................................xv, 2, 42, 84, 93, 94, 95, 96, 101Non-detects............................................................................................................................................ 79NPD............................................................................................................................................... 61, 107Occupational............................................................................................................viii, 9, 16, 42, 85, 100Organic vapor analyzer...........................................................................................xii, 11, 12, 18, 19, 107OVA............................................................................................................... See Organic vapor analyzerParticulates..................................................................................................................................... 7, 8, 31Passive diffusion badges................................................................................................................... 17, 26Passive sampling.............................................................................................................................. 17, 26Percent relative standard deviation.........................................................................................................70Personal sampling pump....................................................................................................................... 107Petroleum....................................viii, xi, xii, 5, 7, 9, 13, 26, 28, 29, 34, 35, 50, 55, 61, 69, 85, 98, 99, 108Photoionization detector...........................................................12, 18, 19, 22, 23, 51, 52, 61, 62, 106, 107PID................................................................................................................ See Photoionization detectorPQL...........................................................................................................See Practical quantitation limitPractical quantitation limit............................................................................................xii, 15, 69, 84, 100Precision.................................................................................10, 15, 16, 17, 26, 27, 49, 64, 65, 69, 70, 72Preferential migration pathway...................................................................................................31, 34, 77Programmed thermal desorber.............................................................................................................. 108
110

WSC POLICY #02-430
QA/QC........................................................................................................................... xii, 27, 45, 64, 67QAPP....................................................................................................See Quality assurance project planQuality assurance...................................................................................................viii, 45, 64, 67, 79, 102Quality assurance project plan................................................................................................................ 67Quality control...............................................viii, 16, 18, 19, 24, 25, 45, 52, 55, 64, 65, 67, 69, 71, 72, 79RAPS.......................................................................................See Response action performance standardReference concentration................................................................................44, 84, 87, 88, 89, 90, 95, 96Relative humidity............................................................................................................................... 8, 31Replicate sampling........................................................................................................................... 66, 68Representativeness................................................................................................................ 18, 64, 65, 82Response action outcome..................................................................................................2, 73, 74, 77, 99Response action performance standard........................................................................................10, 12, 13RfC................................................................................................................ See Reference concentrationRisk assessment ix, 2, 3, 4, 11, 14, 15, 21, 42, 45, 64, 73, 74, 79, 80, 81, 83, 84, 85, 86, 87, 88, 90, 91, 92,
93, 98, 100, 103, 105Risk management criteria........................................................................................................... 3, 99, 101RSD................................................................................................................................................. 70, 71Sample quantitation limit....................................................................................................................... 69Sampling duration..................................................................................viii, 10, 13, 14, 15, 17, 24, 41, 42Significant risk.........................................................................................1, 2, 3, 4, 10, 83, 84, 97, 99, 101Soil gas. xi, xiv, 5, 7, 9, 10, 12, 16, 25, 30, 31, 32, 33, 34, 36, 43, 49, 50, 51, 52, 54, 74, 75, 77, 80, 84, 87Sorbent tube.................................................................................................................... 23, 27, 28, 68, 69SQL....................................................................................................................................................... 69Standard reference material........................................................................................................ xii, 71, 72Subchronic exposure.......................................................................................................38, 42, 88, 93, 99Substantial hazard................................................................................................................... 2, 3, 99, 101Substantial release migration.............................................................................................xiv, xv, 3, 6, 74Tedlar bag.................................................................................................................................. 11, 20, 25TEL................................................................................................................................................ 89, 100Temperature...........................................................xiv, 8, 14, 31, 32, 34, 35, 36, 37, 39, 40, 43, 44, 54, 79Tenax....................................................................................................................................... 16, 28, 106Tentatively identified compounds.....................................................................................................79, 81TIC..................................................................................................See Tentatively identified compoundsTime-weighted samples...................................................................................................11, 19, 21, 23, 26TO methods............................................................................................................... 13, 26, 28, 52, 64, 68Total petroleum hydrocarbons.............................................................................................................. 108Ultraviolet spectroscopy......................................................................................................................... 59Uncertainty analysis.................................................................................................................... 86, 97, 98Unit conversion................................................................................................................................ 32, 79Unit risk..................................................................................................................................... 88, 90, 97Ventilation rate................................................................................................................................... 8, 14VOC..........................................................................................................See Volatile organic compoundVolatile organic compound...xiii, 7, 8, 9, 10, 14, 17, 18, 23, 26, 28, 30, 31, 32, 48, 49, 51, 52, 56, 57, 68,
79, 82, 106, 107, 108Weighted average....................................................................................................................... 47, 90, 91
111

APPENDIX 1
Summaries of EPA Toxic Organic Methods
Appendix 1

Method Desig.
Types of Compounds Determined'
Sampling and Analysis Approach
Detection Limit Advantages Disadvantages
TO-1(See also Methods TO-14A, TO-15, andTO-17)
VOCs[e.g., (80° to
200°C)
[e.g., benzene, toluene, xylenes]
TENAX-GC ADSORPTION AND GC/MS OR GC/FID ANALYSISAmbient air is drawn throughorganic polymer sorbentwhere certain compoundsare trapped. The cartridgeis transferred to thelaboratory, thermallydesorbed and analyzedusing GC/MS or GC/FID.
0.01-100 ppbv • Good data base.• Large volume of air can be sampled.• Water vapor is not collected.• Wide variety of compounds collected.• Low detection limits.• Standard procedures available.• Practical for field use.
• Highly volatile compounds and certain polar compounds are not collected. • Rigorous clean-up of adsorbent required. • No possibility of multiple analysis. • Low breakthrough volumes for some compounds. • Desorption of some compounds difficult. • Structural isomers are the most common interferences. • Contamination of adsorbent and blank contaminants may be a problem. • Artifact formation
TO-2
(See also Methods TO-14A, TO-15, andTO-17)
Highly volatileVOCs
(-15°to+120°C)
[e.g., vinyl chloride,
chloroform, chlorobenzene]
CARBON MOLECULARSIEVE ADSORPTION ANDGC/MS OR GC/FID ANALYSIS Selected volatile organic compounds are captured on carbon molecular sieve adsorbents. Compounds are thermally desorbed and analyzed by GC/MS or GC/FID techniques.
0.1-200 ppbv • Trace levels of volatile organic compounds are collected and concentrated on sorbent material.• Efficient collection of polar compounds.• Wide range of application.• Highly volatile compounds are adsorbed.• Easy to use in field.
• Some trace levels of organic species are difficult to recover from the sorbent.• Structural isomers are common interferences.• Water is collected and can de-activate adsorption sites.• Thermal desorption of some compounds may be difficult.
TO-3
(See also Methods TO-14A, TO-15, and TO-17)
VOCs nonpolar(-10° to +200°C)
[e.g., vinyl chloride,
methylene chloride,
acrylonitrile]
CRYOGENIC PRECONCENTRATION AND GC/FID/ECD ANALYSISVapor phase organics are condensed in a cryogenic trap. Carrier gas transfers the condensed sample to a GC column. Adsorbed compounds are eluted from the GC column and measured by FID or ECD.
0.1-200 ppbv • Collects wide variety of volatile organic compounds.• Standard procedures are available.• Contaminants common to adsorbent materials are avoided.• Low blanks.• Consistent recoveries.• Large data base.
• Moisture levels in air can cause freezing problems with cryogenic trap.• Difficult to use in field.• Expensive.• Integrated sampling is difficult.• Compounds with similar retention times will interfere.
TO-4
(See also Method TO-10A)
Pesticides/PCBs
[e.g., PCBs, 4,4-DDE, DDT,
DDD]
HIGH VOL FILTER AND PUF ADSORBENT FOLLOWED BY GC/FID/ECD OR GC/MS DETECTIONPesticides/PCBs trap on filter and PUF adsorbent trap. Trap returned to lab, solvent extracted and analyzed by GC/FID/ECD or GC/MS.
0.2pg/m3 -200 ng/m3
• Low detection limits.• Effective for broad range of pesticides/PCBs• PUF reusable.• Low blanks.• Excellent collection and retention efficiencies for common pesticides and PCBs.
• Breakdown of PUF adsorbent may occur with polar extraction solvents.• Contamination of glassware may limit detection limits.• Loss of some semi-volatile organics during storage.• Extraneous organics may interfere.• Difficult in identifying individual pesticides and PCBs if using ECD.
Method Types of Sampling and Analysis Detection Limit Advantages Disadvantages
1 - 1

Desig. Compounds Determined'
Approach
TO-5
(See also Method TO-11A)
Aldehydes and ketones
[e.g., formaldehyde, acetaldehyde,
acrolein]
DNPH LIQUID IMPINGER AND HPLC/UV ANALYSISAir sample is drawn through dinitrophenylhydrazine (DNPH) impinger solution using a low volume pump. The solution is analyzed using HPLC with a UV detector.
1-50 ppbv • Specific for aldehydes and ketones.• Good stability for derivative compounds formed in the impingers.• Low detection limits.
• Sensitivity limited by reagent purity.• Potential for evaporation of liquid over long term sampling.• Isomeric aldehydes and ketones may be unresolved by the HPLC system.
TO-6 Phosgene ANILINE/TOLUENE LIQUID IMPINGER AND HPLC/UV ANALYSISAmbient air is drawn through a midget impinger containing 10 mL of 2/98 aniline/toluene (v/v). The phosgene reacts with aniline to form 1,3-diphenylurae and is analyzed using reverse-phase HPLC with a UV absorbance detector operating at 254 nm.
1-50 ppbv • Good specificity.• Good stability for derivative compounds formed in the impingers.• Low detection limits.
• Chloroformates and acidic materials may interfere.• Contamination of aniline reagents may be a source of interference.• Use of midget impingers in field application may not be practical.
TO-7 N-Nitroso dimethylamine
THERMOSORB/N CARTRIDGE WITH GC\MS ANALYSISAmbient air is drawn through a cartridge containing Thermosorb/N adsorbent to trap N-nitrosodimethylamine. The cartridge is returned to the lab and eluted with 5 mL of dichloromethane. The cartridge is then eluted in reverse direction with 2 mL of acetone. The N-nitrosodimethylamine is then determined by GC/MS.
1-50 ppbv • Good specificity.• Good stability for derivative compounds formed on the cartridge.• Low detection limit for n- nitrosodimethylamine.• Placement of sorbent as first component in sample train minimizes contamination.• Sampling system portable and lightweight.
• Compounds with similar GC retention times and detectable MS ions may interfere.• Specificity is a limiting factor if looking for other organic amines.
TO-8 Cresol/phenol SODIUM HYDROXIDE LIQUID IMPINGER AND HPLC/UV DETECTIONAmbient air is drawn through two midget impingers. Phenols are trapped as phenolates in NAOH solution which is returned to the lab and analyzed by HPLC.
1-250 ppb • 4,6-dinitro-2-methylphenol specific to class of compounds.• Good stability.• Detects non-volatile as well as volatile phenol compounds.
• Compounds having the same HPLC retention times will interfere with this method.• Phenolic compounds of interest may be oxidized during sampling. • Limited sensitivity.
Method Types of Sampling and Analysis Detection Advantages Disadvantages
1 - 2

Desig. Compounds Determined'
Approach Limit
TO-9A Dioxin/Furan/PCBs PUF ADSORBENTCARTRIDGE AND HRGC/HRMS ANALYSISAmbient air is drawn througha glass fiber filter and apolyurethane foam (PUF)adsorbent cartridge bymeans of a high volumesampler. The filter and PUFcartridge are returned to thelaboratory and extractedusing toluene. The extract isconcentrated using theKuderna-Danish technique,diluted with hexane, andcleaned up using columnchromatography. Thecleaned extract is thenanalyzed by high resolutiongas chromatography/highresolution mass spectrometry(HRGC/HRMS).
0.25-5000pg/m3
• Cartridge is reusable.• Excellent detection limits.• Easy to preclean and extract.• Excellent collection and retention efficiencies.• Broad database.• Proven methodology.
• Analytical interferences may occur from PCBs, methoxybiphenyls, chlorinated hydroxydiphenylethers, naphthalenes, DDE, and DDT with similar retention times and mass fractions.• Inaccurate measurement Ds/Fs are retained on particulate matter and may chemically change during sampling and storage.• Analytical equipment required (HRGC/HRMS) is expensive and not readily available.• Operator skill level important.• Complex preparation and analysis process.• Can't separate particles from gaseous phase.
TO-10A Pesticides[e.g., heptachlor,
chlordane, dieldrin,aldrin]
PUF ADSORBENT CARTRIDGE ANDGC/ECD/PID/FID ANALYSISA low-volume sample (1-5 L/min) is pulled through a polyurethane foam (PUF) plug to trap organochlorine pesticides. After sampling, the plug is returned to the laboratory, extracted and analyzed by GC coupled to multi-detectors (ECD, PID, FID, etc.).
1-100ng/m3
• Easy field use.• Proven methodology.• Easy to clean.• Effective for broad range of compounds.• Portability.• Good retention of compounds.
• ECD and other detectors (except the MS) are subject to responses from a variety of compounds other than target analytes.• PCBs, dioxins and furans may interfere.• Certain organochlorine pesticides (e.g., chlordane) are complex mixtures and can make accurate quantitation difficult.• May not be sensitive enough for all target analytes in ambient air.
1 - 3

Method Desig.
Types of Compounds Determined'
Sampling and Analysis Approach
Detection Limit Advantages Disadvantages
TO-11 A Formaldehyde(other aldehydes/
ketones)(e.g.,
formaldehyde, acetaldehyde,
acrolein]
DNPH-CARTRIDGE AND HPLC/UV DETENTIONAn ambient air sample is drawn through a commercially-coated DNPH cartridge at a rate of 500-1200mL/minute. Thecartridges are returned to the laboratory in screw-cap glass vials. The cartridges are then removed from the vials and washed with acetonitrile by gravity feed elution. The eluate is diluted volumetrically and an aliquot is removed fordetermination of the DNPH-formaldehyde derivative by isocratic reverse phase HPLC with UV detection at350 nm.
0.5-100ppbv
• Placement of sorbent as first element in the sampling train minimizes contamination.• Large data base.• Proven technology.• Large data base.• Sampling system is portable and light weight.
• Isometric aldehydes and ketones and other compounds with the same HPLC retention time as formaldehyde may interfere.• Carbonyls on the DNPH cartridge may degrade if an ozone denuder is not employed.• Liquid water captured on the DNPH cartridge during sampling may interfere.• O3 and UV light deteriorates trapped carbonyls on cartridge.
TO-12 NMOC (non-methane organic
compounds)
CANISTER SAMPLING-CRYOGENIC PRECONCEN-TRATION AND FIDDETECTIONAmbient air is drawn into acryogenic trap where thenon-methane organiccompounds (NMOCs) areconcentrated. The trap isheated to move the NMOCsto the FID. Concentration ofNMOCs is determined byintegrating under the broadpeak. Water correction isnecessary.
0.1-200ppmvC
• Standard procedures are available.• Contaminants common to adsorbent materials are avoided.• Low blanks.• Consistent recoveries.• Large data base.• Good sensitivity.• Useful for screening areas or samples.• Analysis much faster than GC.
• Moisture levels in air can cause freezing problems.• Non-speciated measurement.• Precision is limited.
1 - 4

Method Desig.
Types of Compounds Determined'
Sampling and Analysis Approach
Detection Limit
Advantages Disadvantages
TO-13A PAHs (e.g., benzo(a)pyrene,
naphthalene, fluorene]
PUF OR XAD-2 ADSORBENTCARTRIDGE AND GC/MS ANALYSISAmbient air is drawn through a glass fiber filter and a polyurethane foam (PUF) or XAD-2 adsorbent cartridge by means of a high volume sampler. The filter and PUF cartridge are extracted using 10% diethyl ether. The extract is concentrated using Kuderna-Danish technique, diluted and cleaned up using column chromatography. The cleaned extract is then analyzed by gas chromatography mass spectrometry (GC/MS).
0.5-500 ng/m3
• Allows for sample dilution if concentration is too high during analysis.• Repeated analysis is possible.• High-volume sampling provides for lower detection limits.• Filter and PUF are low cost.
• Method has interferences due to contamination of solvents, reagents, glassware, and sampling hardware.• Coeluting contaminants may cause interference with target analytes.• Heat, ozone, NO2 and ultraviolet light may cause sample degradation.
TO-14A VOCs (non-polar)
[e.g., toluene, benzene,
chlorobenzene]
SPECIALLY-PREPARED CANISTER AND GC/FID/ECD OR GC/MS DETECTIONWhole air samples are collected in an evacuated stainless steel canister. VOCs are concentrated in the laboratory with cryogen trap. VOCs are revolatilized, separated on a GC column, and passed to one or more detectors for identification and quantitation.
0.2-25 ppbv • Best method for broad speciation of unknown trace volatile organics.• Simple sampling approach.• Good QA/QC database.• Proven field and analytical technology.
• Limited to non-polar compounds due to use of permeation type dryer.• Sample components may be adsorbed or decompose through interaction with container walls.• Water condensation at high humidity may be a problem at high concentrations (ppm).• Complex equipment preparation required.• Expensive analytical equipment.
TO-15 VOCs (polar/non-polar)
[e.g., methanol, benzene, xylene,
nitrobenzene]
SPECIALLY-PREPARED CANISTER AND GC/MS ANALYSISWhole air samples are collected in a specially-prepared canister. VOCs are concentrated on a solid sorbent trap or other arrangement, refocused on a second trap, separated on a GC column, and passed to an MS detector for identification and quantification.
0.2-25 ppbv • Incorporates a multisorbent/ dry purge technique or equivalent for water management thereby addressing a more extensive set of compounds.• Establishes method performance criteria for acceptance of data.• Provides enhanced provisions for quality control.• Unique water management approach allows analysis for polar VOCs.
• Expensive analytical equipment.• Operator skill level important.
1 - 5

Method Desig.
Types of Compounds Determined'
Sampling and Analysis Approach
Detection Limit Advantages Disadvantages
TO-16 VOCs(polar/nonpolar)
[e.g., alcohols, ketones, benzene,
toluene, o-xylene,
chlorobenzene]
FTIR OPEN PATH SPECTROSCOPY
VOCs are monitored using real-time long-path open-
path fourier transform infrared spectroscopy
(FTIR).
25-500 ppbv • Open path analysis maintainsintegrity of samples.• Multi-gas analysis saves moneyand time.• Path-integrated pollutantconcentration measurementminimizes possible samplecontamination, and provides real-time pollutant concentration.• Applicability for special surveymonitoring.• Monitoring at inaccessible areaspossible using open-path FTIR.
• High level of operator skill level required.• Requires spectra interpretation.• Limited spectra library available.• Higher detection limits than most alternatives.• Must be skilled in computer operation.• Substantial limitations from ambient CO2 and humidity levels associated with spectral analysis.
TO-17 VOCs(polar/non-polar)
[e.g., alcohols, ketones, benzene,
toluene, o-xylene,
chlorobenzene]
MULTI-BED ADSORBENT TUBE FOLLOWED BY
GC/MSAmbient air is drawn through
a multi-bed sorbent tube where VOCs are trapped.
The cartridge is returned to the laboratory, thermally
desorbed and analyzed by GC/MS or other methods.
0.2-25 ppbv • Placement of the sorbent as thefirst element minimizescontamination from other sampletrain components.• Large selection of sorbents tomatch with target analyte list.• Includes polar VOCs.• Better water management usinghydrophobic sorbents thanCompendium Method TO-14A.• Large database, proventechnology.• Size and cost advantages insampling equipment.
• Distributed volume pairs required for quality assurance.• Rigorous clean-up of sorbent required.• No possibility of multiple analysis.• Must purchase thermal desorption unit for analysis.• Desorption of some VOCs is difficult.• Contamination of adsorbent can be a problem.
'Number in parenthesis is the boiling point range of the organics applicable to that Compendium Method.
1 - 6

APPENDIX 2
(a) Indoor Air Quality Building Surveyand
(b) Instructions for Residents of Homes to Be Sampled
Appendix 2

INDOOR AIR QUALITY BUILDING SURVEY
Date: ___________________ ID#: _________Address: _____________________________________________________________________________
_____________________________________________________________________________ _____________________________________________________________________________
Residential Contact: ___________________________________________________________________Phone: home: ( )____________ work: ( )____________ List of Current Occupants/Occupation:
AGE (IF UNDER 18)
SEX (M/F)
OCCUPATION
Building Construction Characteristics:
What type of building do you have? (Circle appropriate response)
Single Family Multiple Family School Commercial
Ranch 2-FamilyRaised Ranch DuplexCape Apartment HouseColonial # of units ____Split Level CondominiumColonial # of units ____Mobile Home Other (specify) _______Other (specify) _______
General Description of Building Construction Materials: ________________________________________ ______________________________________________________________________________________
How many occupied stories does the building have? _____
Has the building been weatherized with any of the following? (Circle all that apply)Insulation Storm Windows Energy-Efficient Windows Other (specify) _______
What type of basement does the building have? (Circle all that apply)Full basement Crawlspace Slab-on-Grade Other (specify) __________
What are the characteristics of the basement? (Circle all that apply)Finished Basement Floor: Foundation Walls: Moisture:Unfinished Concrete Poured Concrete Wet
Dirt Block DampOther (specify) _______ Layed Up Stone Dry
Is a basement sump present? (Y/N) ____
2 - 1

Does the basement have any of the following characteristics (i.e., preferential pathways into the building) that might permit soil vapor entry? (Circle all that apply)
Cracks Pipes/Utility Conduits Other (specify) __________Foundation/slab drainage Sump pumps
Heating and Ventilation System(s) Present:
What type of heating system(s) are used in this building? (Circle all that apply)Hot Air Circulation Heat Pump Steam Radiation Wood StoveHot Air Radiation Unvented Kerosene heater Electric Baseboard Other (specify): _____
What type (s) of fuel(s) are used in this building? (Circle all that apply)Natural Gas Electric Coal Other (specify): __________Fuel Oil Wood Solar
What type of mechanical ventilation systems are present and/or currently operating in the building? (Circle all that apply)Central Air Conditioning Mechanical Fans Bathroom Ventilation FanIndividual Air Conditioning Units Kitchen Range Hood Air-to-Air Heat Exchanger
Open windows Other (specify): __________Sources of Chemical Contaminants:
Which of these items are present in the building? (Check all that apply)
Potential VOC Source Location of Source Removed 48 hours prior to sampling
(Yes/No/NA)Paints or paint thinnersGas-powered equipmentGasoline storage cansCleaning solventsAir freshenersOven cleanersCarpet/upholstery cleanersHairsprayNail polish/polish removerBathroom cleanerAppliance cleanerFurniture/floor polishMoth ballsFuel tankWood stoveFireplacePerfume/colognesHobby supplies (e.g., solvents, paints, lacquers, glues, photographic darkroom chemicals) Scented trees, wreaths, potpourri, etc.OtherOther
2 - 2
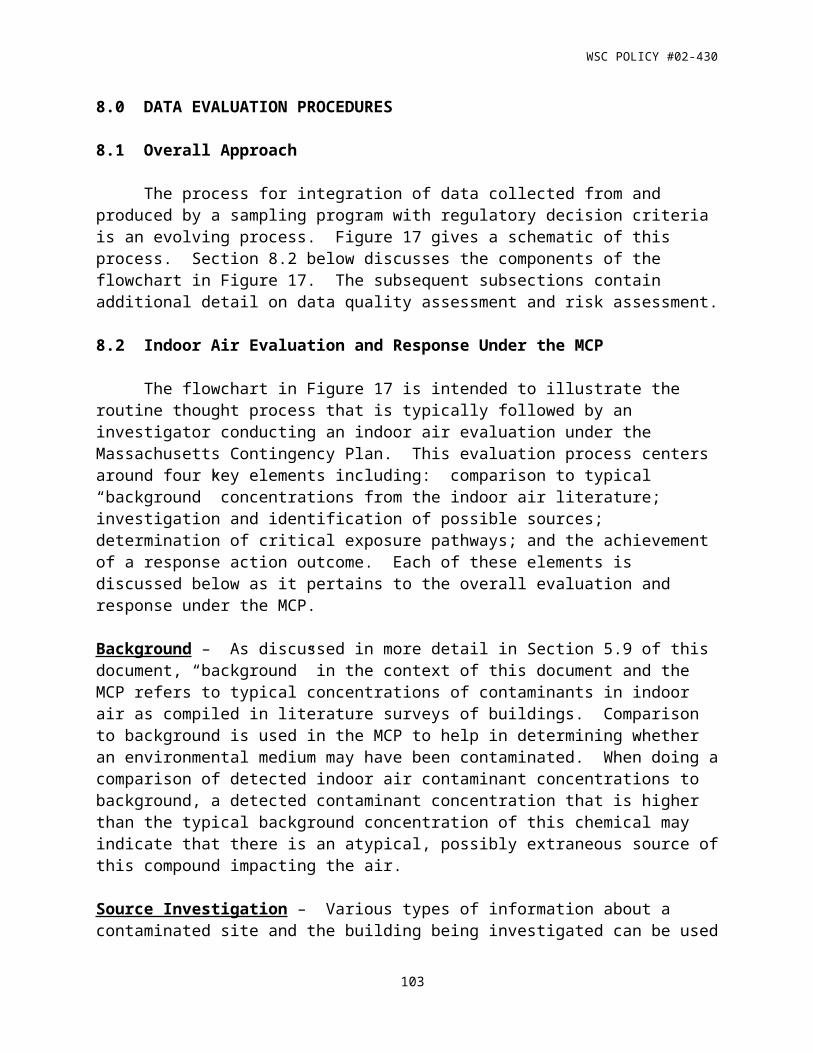
Do one or more smokers occupy this building on a regular basis?Has anybody smoked in the building in the last 48 hours?Does the building have an attached garage?If so, is a car usually parked in the garage?
Do the occupants of the building frequently have their clothes dry-cleaned?
Was there any recent remodeling or painting done in the building?
Are there any pressed wood products in the building (e.g., hardwood plywood wall paneling, particleboard, fiberboard)?
Are there any new upholstery, drapes or other textiles in the building?
Has the building been treated with any insecticides/pesticides? If so, what chemicals are used and how often are they applied?__________________________________________________________________________________________________________________________________________________________________________________________________________________________________________________________________
Do any of the occupants apply pesticides/herbicides in the yard or garden? If so, what chemicals are used and how often are they applied?__________________________________________________________________________________________________________________________________________________________________________________________________________________________________________________________________
Outdoor Sources of Contamination:
Is there any stationary emission source in the vicinity of the building? ___________________________ ______________________________________________________________________________________
Are there any mobile emission sources (e.g., highway; bus stop; high-traffic area) in the vicinity of the building?____________________________________________________________________________________________________________________________________________________________________________
Weather Conditions During Sampling:
Outside Temperature (oF): Prevailing wind direction: _________________________Describe the general weather conditions (e.g., sunny, cloudy, rain): _______________________________Was there any significant precipitation (0.1 inches) within 12 hours preceding the sampling event? ______Type of ground cover (e.g., grass, pavement, etc.) outside the building: ____________________________
General Comments
Is there any other information about the structural features of this building, the habits of its occupants or potential sources of chemical contaminants to the indoor air that may be of importance in facilitating the evaluation of the indoor air quality of the building?__________________________________________________________________________________________________________________________________________________________________________________________________________________________________________________________________
(NHDES, 1998; NYDOH, 1997; VDOH, 1993)
2 - 3

Instructions for Residents(to be followed starting at least 48 hours prior to and during the sampling event)
Do not open windows, fireplace openings or vents.
Do not keep doors open.
Do not operate ventilation fans or air conditioning.
Do not use air fresheners or odor eliminators.
Do not smoke in the house.
Do not use wood stoves, fireplace or auxiliary heating equipment (e.g., kerosene heater).
Do not use paints or varnishes.
Do not use cleaning products (e.g., bathroom cleaners, furniture polish, appliance cleaners, all-purpose cleaners, floor cleaners).
Do not use cosmetics, including hair spray, nail polish, nail polish remover, perfume, etc.
Do not partake in indoor hobbies that use solvents.
Do not apply pesticides.
Do not store containers of gasoline, oil or petroleum–based or other solvents within the house or attached garage (except for fuel oil tanks).
Do not operate or store automobiles in an attached garage.(NHDES, 1998)
2 - 4

APPENDIX 3
Quality Assurance/Quality Control Checklist:Indoor Air Quality Monitoring of Volatile Organic Compounds (LEVEL I REVIEW)
Appendix 3

Quality Assurance/Quality Control Checklist:Indoor Air Quality Monitoring of Volatile Organic Compounds (Level I Review)
Quality Assurance Project Plan or Scope of Work Available
Narrative of Sampling and Analytical Procedures Included
Standard Operating Procedures Present/Used and/or Analytical Method Cited
Site Map Supplied With Sampling Locations Noted
Detection Limit□ Method Detection Limit determined for each analyte of interest
□ Reporting Limits adequate to address study objective (if no, explain below)
Recommended Holding Times Met for Samples□ Summa Canisters: 28 days
□ Tedlar Bags: 12-48 hours (recommended)
□ Sorbent Tubes: 10-14 days (recommended)
□ Passive Sampler Badges (as recommended by manufacturer)
Pressure Readings (for canister sampling)□ Pre-sampling, post-sampling and pre-analysis pressures noted
□ Post-sampling pressures equivalent to pre-analysis pressures
□ Dilutions done on samples with low pre-analysis pressures (will be dependent upon laboratory equipment when dilution is required?)□ Initial Canister Vacuum(s) satisfy(ies) method criteria (e.g., vacuum should be less
than -30 inches Hg) □ Final Vacuum Pressure(s) satisfy(ies) method criteria (e.g., vacuum should be less
than 0 inches Hg for sub-ambient samples)
Chain of Custody Record□ DEP □ Client-Specific
□ Present
□ Complete
□ Samples Clearly Identified
□ Date/Time Sampled Recorded
□ Transfer Signatures Completed
□ Name of Person Collecting Samples Listed
Appropriate Blanks Available
Appendix 4

□ Field Blank
□ Trip Blank (if appropriate)
□ Instrument Blank
□ Method Blank
□ Other Blank(s)
□ Blank Levels found Within Acceptable Criteria for Method (if no, explain below)
Results□ Correct method reference
□ Method modifications noted
□ Units noted and correct (g/m3 and ppbV)
□ Date of analysis listed for each sample
□ Dilution factors noted
□ Reporting limits and results corrected for dilution factor
□ Reason for dilution clear
□ Reporting limits reasonable
□ Data quality objectives met
□ Reporting limits elevated with appropriate dilution factor noted
□ Media listed
□ Laboratory identification number listed
The Results of at Least One Set of Duplicate Samples Available:□ At different flow rates (if concentration decreases as flow rate increases, should try reduced sampling rate and longer sampling interval in absorbent media)□ Agreement Between Duplicates Within + 25-30% (if agreement is not within 25-30%, should collect duplicates on a more frequent basis and investigate)
(With cartridge sampling), at least one site where series sampling is conducted□ (Blank cartridges should contain <25% of component of interest in front cartridge or be equivalent to the amount in the blank cartridges level, whichever is greater)
Tune (e.g., bromofluorobenzene) criteria□ Included
□ Satisfied (in accordance with method criteria)
Instrument Calibration□ ICAL criteria satisfied (in accordance with method criteria)
□ CCAL Criteria Satisfied (in accordance with method criteria)
Matrix Spikes/Spike Duplicates□ Percent Relative Standard Deviation estimated using matrix spikes/matrix spike duplicates
□ % RSD Criteria Satisfied (Acceptable %RSD Values Should Generally Be < 25.) Percent Recovery
□ Percent Recovery estimated using Standard Reference material (from an external source)
Appendix 4

□ %R Criteria Satisfied (Acceptable %R should be between 70-130.)
Other Quality Control Results□ Any nonconformances noted and clearly explained
□ Method blank below reporting limit
□ Calibration criteria met or discussed
□ Certification that canisters have been cleaned
APPENDIX 4
Recommended Standard Operating Procedure (SOP) for the Collection of Air Samples
Appendix 4

Recommended Standard Operating Procedure (SOP) for the Collection of Air Samples
1.0. SCOPE AND APPLICATION
1.1 The purpose of this Standard Operating Procedure is to identify and describe recommended sampling and associated quality control procedures for use with the MADEP Air-Phase Petroleum Hydrocarbons (APH) method.
1.2 This SOP describes procedures for obtaining instantaneous grab air samples, subatmospheric time-integrated air samples and pressurized time-integrated air samples. These procedures have been consolidated to allow for user discretion and applicability to APH analysis.
1.3 Sampling procedures included in EPA Methods TO14A and TO15 may also be used with the APH Method. [see “Compendium of Methods for the Determination of Toxic Organic Compounds in Ambient Air” (EPA/625/R-96-010b) and Method IP-1A of the “Compendium of Methods for the Determination of Air Pollutants in Indoor Air”(PB90-200288]. However, the basic procedures published in these methods specify equipment not commonly used by air sampling firms and public agencies. Nonetheless, the basic quality control requirements of these methods apply to all sampling procedures and approaches, regardless of equipment used.
1.4 Although the specific procedures recommended in this SOP are not mandatory, adequate quality control measures must be instituted in all cases to ensure and document the integrity of collected samples. These measures must include, at a minimum, steps that provide assurance of the original cleanliness and non-contamination of sample containers and any hardware touching the sample, the assurance of accurate flow measurements and sample volumes and the assurance that a sample as delivered for analysis is not altered physically or chemically from when it was taken in the field.
1.5 This SOP is based upon the U.S. Environmental Protection Agency (USEPA) Region 1 Laboratory’s “Standard Operating Procedure – Sampling Volatile Organic Compounds Using SUMMA Polished Stainless Steel Canisters”.
2.0 GRAB CANISTER SAMPLES
2.1 Canister Grab Sampling Equipment
2.1.1 Sample Inlet Line - Chromatographic-grade stainless steel tubing.
2.1.2 Sample Canister(s)- Certified clean and leak free stainless steel SUMMA polished or silica lined passivated air sampling canisters, typically available in 6 and 15 liter sizes.
2.1.3 Vacuum/Pressure Gauge – Configured with appropriate fitting to attach to canister to measure vacuum before and pressure (or vacuum) after the sampling event.
2.1.4 Particulate Matter Filter – 2 micrometer pore size in-line stainless steel filter to be attached to sample inlet line.
4 - 1

2.2 Canister Grab Sampling Procedures
2.2.1 Collect grab samples from the breathing zone(s) of potentially impacted structures, from areas were point-source emissions of volatile contaminants are suspected (e.g., basement sumps, cracks, annular spaces around utility lines), from soil gas probes, or in a manner otherwise consistent with sampling and data quality objectives.
2.2.2 Connect the Vacuum/Pressure Gauge tightly to the canister inlet and open the canister bellows valve to verify the vacuum (should be –30 inches Hg or 0 mm Hg). Close valve and remove gauge.
2.2.3 Connect the particulate filter and sample inlet in-series to the canister inlet.
2.2.4 To take a sample, open the canister valve slightly and allow ambient air to enter the canister. Leave valve open for 1 minute to allow the canister pressure to reach ambient (0 psig/760 mm Hg).
2.2.5 Verify final pressure with the gauge and close valve.
2.2.6 In a field log notebook or sampling event form, record project name, sample date, sampling location, canister serial number, initial vacuum reading, final pressure reading and sampling time.
2.2.7 Complete appropriate Chain of Custody Form to transfer for sample analysis.
2.2.8 Ensure that all ambient pressure canister samples are pressurized to at least 5 psig (1020 mm Hg) with humidified clean nitrogen or ultra zero air for analysis. The initial and final pressures associated with this procedure must be accurately measured and documented so that the dilution effect can be adequately compensated for during final concentration calculations
3.0 SUBATMOSPHERIC TIME-INTEGRATED CANISTER SAMPLES
3.1 Equipment
3.1.1 Sample Inlet Line - Chromatographic-grade stainless steel tubing.
3.1.2 Sample Canister(s)- Certified clean and leak free stainless steel SUMMA polished or silica lined passivated air sampling canisters, typically available in 6 and 15 liter sizes.
3.1.3 Vacuum/Pressure Gauge – Configured with appropriate fitting to attach to canister to measure vacuum before and pressure (or vacuum) after the sampling event.
3.1.4 Particulate Matter Filter – 2 micrometer pore size in-line stainless steel filter to be attached to sample inlet line.
3.1.5 Flow Controller – Adjustable mechanical flow controller, fixed orifice flow controller or electronic flow controller capable of reliably controlling flowrate under vacuum (-30 inches Hg [0 mm Hg] to -5 inches Hg [633 mm Hg)]) and under flowrates between 5 and 100 cubic centimeters per minute depending on the designated event duration. Flow controlling device must be constructed of non-contaminating materials.
3.1.6 Calibrated Flow Measuring Device – Mass flowmeter or calibrated rotameter accurate in the 0 to 100 cubic centimeters per minute range. Must be constructed of non-contaminating materials, especially if used for mid-event flow verifications.
4 - 2

3.2 Flow Measurement
3.2.1 Average flowrate throughout the sampling event can be determined using equation 4-1
Equation 4-1.
where:
F = average flowrate (cubic centimeters [cc]/minute)P = final canister pressure in atmospheres absolute (maximum 0.83 for
subatmospheric sample)V = Canister Volume (cc); [6 Liter Canister = 6000 cc]T = Time (minutes)
and where:
P = - 30 in - Final Vacuum (in Hg) for subambient samples -30 in
P = Gauge Pressure (psig) + 14.7 psia for pressurized samples14.7 psia
P = Final Pressure (mm Hg) for either type760 mm Hg
3.2.2 Flowrate measurements must be made before and after the sampling event (and during if necessary) to verify that the average flowrate is consistent throughout the sampling interval.
3.2.3 Target flowrates for subatmospheric time-integrated samples should be projected and set based on an initial canister vacuum of –30 inches Hg and a final vacuum of -5 inches Hg. The residual vacuum is required to provide a flow driving force until the end of the sampling event.
3.2.4 The following are target flowrates for several event times using a 6 liter canister as calculated from the formula above.
2 Hours = 41.7 cc/min8 Hours = 10.4 cc/min24 Hours = 3.5 cc/min
3.2.5 Adjustable mechanical flow controllers are not likely to be stable below 10 cc/minute. Fixed orifice or low range electronic mass flow controllers would perform better for this application. Fifteen (15) liter stainless steel canisters allow higher flowrates and may be preferable for longer sampling events.
3.2.6 Flow controllers should be functionally checked and calibrated with a certified flow measuring device prior to the sampling event and rechecked in the same manner after
4 - 3
F = P x V
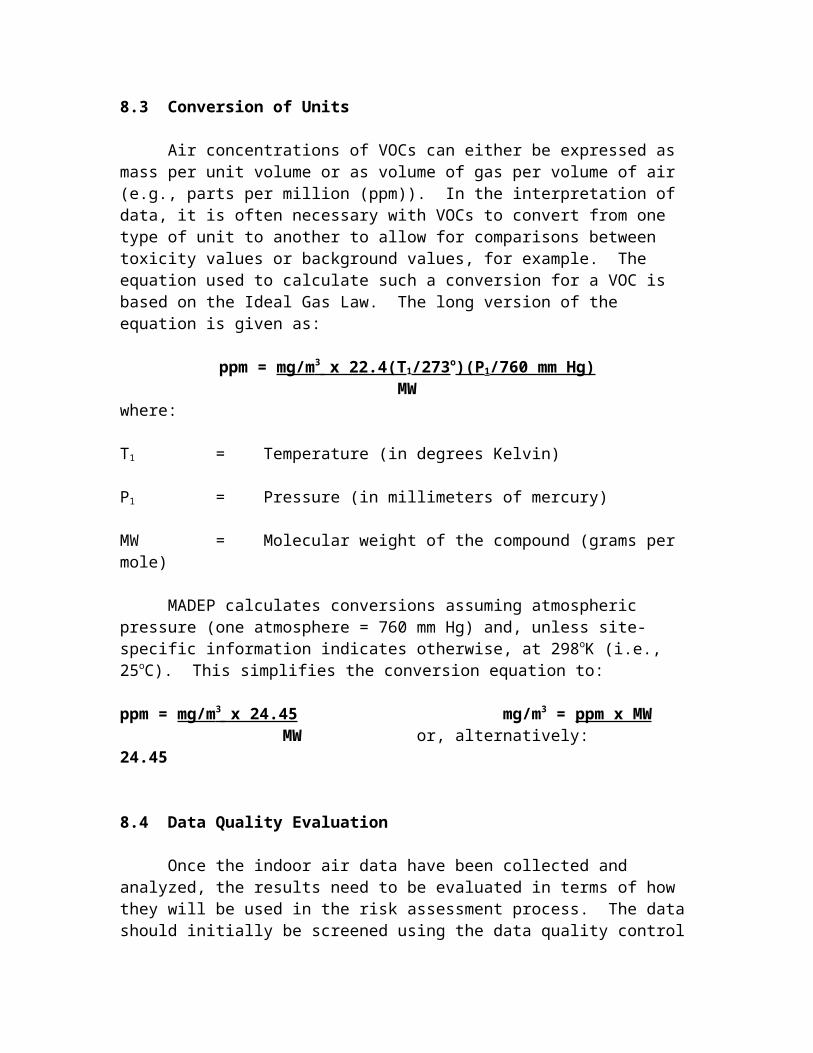
the event. Flowrates are checked before and after sampling events using non-project evacuated canisters. Periodic flowrate checks (minimally once per hour) should be made using a non-contaminating certified rotameter or mass flowmeter during the sampling event when adjustable mechanical flow controllers are used. These measurements should be recorded and the flowrate should be adjusted up to the original set point if a significant drop is observed.
3.3 Subatmospheric Time-Integrated Sampling Procedures
3.3.1 Collect time-integrated samples from the breathing zone(s) of potentially impacted structures, or in a manner otherwise consistent with sampling and data quality objectives.
3.3.2 To start the sampling event:
3.3.2.1 Properly site the canister and verify the vacuum (–30 inches Hg or 0 mm Hg) with a vacuum gauge.
3.3.2.2 Attach the flow controller device (with filter in line), open the canister bellows valve and note the start time. Start co-located canisters at the same time if possible. Immediately check the flowrate and adjust to set point, if necessary. Note the initial flowrate.
3.3.3 To complete the sampling event:
3.3.3.1 Check and note the final flowrate. Close canister bellows valve and note the final time.
3.3.3.2 Detach the flow controller and check the remaining vacuum with the gauge. Vacuum and flowrate should be observed at the end of the event. Ambient pressure (0 psig or 760 mm Hg) indicates an excessively high flowrate set point or a leak. This observation compromises the time - integrated aspect of the sample.
3.3.4 If an automatic timer (with an electronic solenoid) is employed to time the sampling event (i.e., unattended operations), all procedures above are valid. However, extra care must be taken to ensure the accuracy of the average flowrate during the event and that the event occurred during the designated time. An elapsed time recorder/indicator should be employed with such a set up.
3.3.5 All subambient pressure canister samples should be pressurized to at least 5 psig (1020 mm Hg) with humidified clean nitrogen or ultra zero air for analysis. The initial and final pressures associated with this procedure must be accurately measured and documented so that the dilution effect can be adequately compensated for during final concentration calculations.
4 - 4

4.0 PRESSURIZED TIME-INTEGRATED CANISTER SAMPLES
4.1 Equipment
4.1.1 Sample Inlet Line - Chromatographic-grade stainless steel tubing. All tubing connecting inlet to sample pump and sample pump to canister should be constructed of stainless steel or a similarly inert material.
4.1.2 Sample Canister- Certified clean and leak free stainless steel SUMMA polished or silica lined passivated air sampling canisters, typically available in 6 and 15 liter sizes.
4.1.3 Vacuum/Pressure Gauge – Configured with appropriate fitting to attach to canister to measure vacuum before and pressure (or vacuum) after the sampling event.
4.1.4 Particulate Matter Filter – 2 micrometer pore size in-line stainless steel filter to be attached to sample inlet line. This filter may be integral to manufactured sampling units.
4.1.5 Flow Controller - Adjustable mechanical flow controller, fixed orifice flow controller or electronic flow controller capable of reliably controlling flowrate under vacuum (to -30 inches Hg or 0 mm Hg) and under pressure (up to 15 psig or 1520 mm Hg) at flowrates between 5 and 200 cubic centimeters per minute, depending on the designated event duration. Flow controlling device and associated plumbing must be constructed of non-contaminating materials. Commercially manufactured samplers and shop assembled samplers can be equipped with adjustable electronic mass flow controllers/flow meters which measure and control flowrates. These devices come with digital LCD/LED flowrate displays which change with adjustment.
4.1.6 Sample Pump – Non-contaminating diaphragm or metal bellows air sampling pump capable of pressurizing an air sampling canister to a minimum of 15 psig (1520 mm Hg).
4.1.7 Calibrated Flow Measuring Device – Mass flowmeter or calibrated rotameter accurate in the 0 to 200 cubic centimeters per minute range. Must be constructed of non-contaminating materials, especially if used for mid-event flow verifications. Mass flow controller/meters must be calibrated to certified flow measuring device (soap film or equivalent) in the same manner.
4.1.8 Programmable Sampler – Programmable samplers used for unattended operation should have the following equipment.
4.1.8.1 Pump Pressure Regulator/Indicator – Used (with bypass plumbing) to adjust delivery pressure from the pump. Setting should not be less than the anticipated canister pressure, based on flowrate and sampling time.
4.1.8.2 Electronic Timeclock – For programming “On” and “Off” times for the sampling event. Timeclock should direct power to the sampling pump and outlet solenoid.
4.1.8.3 Outlet Solenoid – Electronic valve which prevents leakage of air into the sample canister before the commencement of the event and leakage out after the conclusion of the event.
4.1.8.4 Elapsed Time Indicator – Verifies the time period (in minutes) that the sample was collected.
4 - 5

4.1.8.5 Electrical Power Supply - In contrast to the subambient sampling procedure, all pressurized canister samplers must have access to a DC or AC electric power source.
4.2 Flow Measurement
4.2.1 All flow indicating/measuring devices used to measure the flowrate associated with the use of pressurized canister samplers must be certified to a NIST traceable device such as a soap film meter or equivalent. This includes flow controlling/measuring devices integral to the sampler and external devices.
4.2.2 All pressurized canister samplers must be flushed with clean nitrogen or ultra zero air between projects and a test canister containing humidified nitrogen or ultra zero air must be analyzed to ensure that the sampler is contamination free.
4.2.3 The projected sample flowrate should be calculated on the basis of a final canister pressure of approximately 15 psig (1520 mm Hg). A minimum of 5 psig (1020 mm Hg) is typically needed for direct analysis. The following are examples of target flowrates for typical time integrated sampling periods based on 15 psig (1520 mm Hg) final pressure for a 6 liter canister.
2 Hours = 100 cc/minute8 Hours = 25 cc/minute
24 Hours = 8.5 cc/minute
4.2.4 For commercial samplers with pump output gauges, while running the sampler to set the flow, adjust the output pressure to 5 psig greater than the anticipated final canister pressure. This will prevent the pump and canister from reaching flow/pressure equilibrium before the end of the sampling event. A pressure equilibrium between the canister and the pump would prevent any new air flow from getting into the canister.
4.3 Pressurized Canister Time-Integrated Sampling Procedures
4.3.1 Collect time-integrated samples from the breathing zone(s) of potentially impacted structures, or in a manner otherwise consistent with sampling and data quality objectives.
4.3.2 To start the sampling event, position the sampler in a location with access to power. Turn on the sampler to check pump pressure and to measure and adjust flowrate (using the certified flow measurement device). Running the sampler at this time will also purge sampler plumbing with ambient air. Note the initial flowrate on field sheet and/or notebook.
4.3.3 Turn off the sampler and connect the evacuated canister. Take an initial vacuum reading with a gauge prior to connecting or note reading on integral sampler gauge to make sure canister vacuum is at –30 inches Hg.
4.3.4 Open canister bellows valve and start sampler at the designated start time. Note start
time on the field sheet or notebook.
4.3.5 Periodically check sampler to make sure that it is operating correctly. If sampler has an integral vacuum/pressure gauge, check pressure to verify that the current reading is consistent with the flowrate and the elapsed time.
4.3.6 At the end of the sampling interval, close the canister and detach from the sampler. Take a final flowrate measurement and note it on the field sheet. Note the final time on the field sheet or notebook.
4 - 6

4.3.7 Check the final pressure on the canister sample and note on field sheet or notebook. Note whether final pressure equaled the projected final pressure.
4.3.8 For programmed sampling intervals, check initial flows and pressures as discussed above (turn on sampler manually). Follow manufacturer procedures for programming time clock. Delete any inappropriate timer programs from the clock’s memory and recheck the current sampling interval program to make sure that sampler will turn on and off at the correct designated times (and correct day).
4.3.9 Reset Elapsed Time Indicator and make sure time clock is in the “Automatic “ mode for timed events (not manual “On” or “Off”).
4.3.10 After completion of the timed event, close bellows valve on the canister and detach. Check pressure on canister and note on field sheet or notebook. Verify that the final pressure is approximately at the original projected final pressure. A low or zero final pressure indicates that the canister leaked after sampling or that the flowrate dropped during the event.
4.3.11 Note the elapsed time and verify that it is equal to the programmed sampling interval.
4.3.12 Manually turn on sampler and check final flowrate and pump pressure. Note final flowrate on the field sheet or notebook.
5.0 ADDITIONAL QUALITY CONTROL PROCEDURES
5.1 Specifications in EPA Method TO14A describe a “clean” canister as having a pressure of 0.05 mm Hg or about 50 millitorrs. Practically, the pressure could be 2 or 3 times the 50 millitorr value if the contamination standard is met.
5.2 One evacuated canister per sampling event should be submitted for analysis as a field blank.
This canister should be filled to a minimum of 10 psig (1267 mm Hg) with humidified ultra zero air or clean nitrogen used to dilute underpressurized field samples.
5.3 Side by side duplicate samples should be taken at least one location per each sampling event for precision. Preferably, they should sample at a location where moderately high (but not excessively high) concentrations of analytes of concern could potentially be found.
5.4 Care should be taken to separate each sampling zone while sampling is occurring (e.g., keep doors between floors shut).
5.5 Carefully note conditions under which the sample is taken which might affect the interpretation of the results including unusual weather conditions, air temperature, current building ventilation status and the presence of petroleum related products on site.
6.0 SAMPLE CATEGORIES AND NOMENCLATURE
6.1 Below are definitions of sample location zone categories which should be used to help identify and codify the type, source, and relevance of reported APH data.
6.1.1 Zone A – Samples are obtained at vapor entry points into a building (e.g., breach in foundation, sump hole). Samples are used to identify areas of point-source vapor emissions into impacted structures and/or for investigative/health screening purposes. Typically, an instantaneous grab samples, though sample volume may need to be metered to avoid overwhelming the analytical system.
6.1.2 Zone A-1 – Soil gas samples. Samples are obtained from temporary or permanent subsurface probes. Typically an instantaneous grab sample, though sample volume may need to be metered to avoid overwhelming the analytical system. Care must be exercised to avoid short-circuiting the sample pathway by the use of a high sampling
4 - 7

vacuum or flowrate. Care must also be exercised to avoid or prevent entrapment of groundwater.
6.1.3 Zone B – Samples taken in unoccupied (and unfinished) areas on building levels in contact with the soil. Little personal exposure is expected. This sample could be an instantaneous grab or time integrated sample
6.1.4 Zone C – Samples taken in occupied, finished part of the building level in contact with the soil. Some personal exposure could be expected, depending on the extent of the area’s use. This should be a time-integrated sample.
6.1.5 Zone D – First floor living area. Personal exposure level depends on percentage of time occupied and whether sleeping quarters are located on this level. Time-integrated samples are appropriate.
6.1.6 Zone E – Second or higher floors. Occupied during sleeping or other hours. This zone needs to be considered if there is a major contamination situation, there is a direct air connection with the level of entry or if it is occupied by an unusually sensitive receptor. Time-integrated samples are appropriate.
6.1.7 Outside/Ambient – Used to assess the influence and impacts of outdoor air quality on indoor air quality. Also can be used as an additional quality control sample because background ambient air concentrations of volatile petroleum hydrocarbons are at well documented average levels at most locations. Time-integrated samples are appropriate.
7.0 REFERENCES
Standard Operating Procedure Sampling Volatile Organic Compounds Using SUMMA Polished Stainless Steel Canisters, EPA-REG1-ESD/CAN-SAM-SOP, March 1994. US Environmental Protection Agency, New England Regional Laboratory, Environmental Services Division, 60 Westview Street, Lexington, MA 02173.
4 - 8

APPENDIX 5
Recommended Real-Time Soil Gas Sampling Procedures
Appendix 5

RECOMMENDED REAL-TIME SOIL GAS SAMPLING PROCEDURES
RECOMMENDED MATERIALS
Heavy-Gauge Steel Probe - Approx 0.5 inches in diameter, usually in 2-4 ft length sections that screw together. Some have fixed points (Drawing A), others are designed to be fitted with a detachable slotted point that can be used to establish a permanent soil gas monitoring station (B & C). Bottom probe section slotted in temporary probes such as (A); detachable points slotted in (B) and (C). Soil gas sampled through slotted areas.
Flexible Tubing - Usually 1/16 - 1/4" in diameter, polypropylene or teflon. In temporary/permanent installations (B) and (C), tubing is inserted inside steel probe, attached to a slotted point. PVC Protective Cap - In permanent installation (C), a 1-1.5" diameter PVC sleeve (Sch 40, 2-12" in length) with a screw-cap lid (often electrical conduit-type) is inserted at grade around protruding tubing, which was cut to allow several inches excess above grade level. Excess tubing is wound inside PVC cap for withdrawal during sampling.
RECOMMENDED INSTALLATION PROCEDURES
The Steel probe is driven into the ground by a hammer, slam-bar, or vibratory hammer. Additional section lengths are added as needed, until desired depth is reached. In temporary installation (A), a tee is screwed into the end section, and flexible tubing is attached for sampling. In installation (B), the tubing inside of steel probe is sampled. Withdrawal of steel probe accomplished with a jack, if necessary. Permanent installation (C) accomplished by detaching tubing/slotted point from leading edge of steel probe (rod sometimes inserted to facilitate this action). Steel probe is removed, leaving in tubing/slotted point. Annulus space around slotted point backfilled with 6-8 inches of coarse (Ottawa) sand. 3-5 inch bentonite seal placed above sand backing, followed by common fill to just below grade. Protective PVC sleeve and screw cap inserted at or slightly above grade; sometimes set in bentonite or grout.
CONTINUED5 - 1

RECOMMENDED SAMPLING PROCEDURES
The "basic" or "optional" setup in (C) above is recommended:
(1) Under "basic" procedure, extract soil gas by connecting PID meter and/or FID meter (with positive displacement pumps) to tubing from probe installation. If PID/FID meters unavailable, industrial hygiene-type personal sampling pump may be substituted. Usual pumping rate between 100 - 500 ml/min.
(NOTE: Some PID meters do not have a positive displacement sampling pump, and will not be able to extract a soil gas sample nor be able to produce meaningful Total Organic Vapor data).
(2) Where appropriate (i.e. elevated PID/FID meter readings and/or critical sampling location) extract a 10 uL to 500 uL soil gas sample with a gas-tight syringe upstream of meter/pump, from an in-line tee/septum or by piercing last inch of connected tubing (which is cut off for next sampling).
(3) Withdraw syringe sample 30 - 120 seconds after initiation of pumping, and/or upon stabilization of PID/FID meter value. The PID/FID meter concentration reading(s) should be used to determine the appropriate volume of soil gas to withdraw in the syringe and inject into the GC, in order to stay within the linear response range of the instrument.
(4) Inject syringe sample into on-site portable gas chromatograph. Alternatively, pump to sample bag or through sorbent tube for laboratory GC or GC/MS.
The "optional" dashed-lined boxed components in (C) are recommended. After tee/septum and before PID meter, 2 gas-flow gauges (rotameters) up and downstream of a valved inlet tee device are used to measure and adjust flow rate from probe and to meter. Depending on soil permeability, flow rate to meter may be reduced to a degree that may significantly impact meter responses (substantially reduced PID readings; extinguishing of flame in FID meters). A proportioning valve will optimize split. Ratio of soil gas/make-up air may be used to adjust PID/FID data, allowing comparison between sampling locations.
DECONTAMINATION
Decontaminate steel probes between sampling locations with brushes, methanol/water or equivalent solution, and/or surfactant/water. Rinse with distilled water. Attach PID/FID meter to record reading; re-clean or continue to pump clean air to reduce to background concentration.
Tubing and flow meters, if used, are particularly susceptible to contamination. For tubing, clean with methanol/water solution, pump clean air until background achieved, or discard. For flow meters, utilize contaminant-resistant construction materials and/or pump clean air to achieve background.
CALIBRATION
Follow manufacturer's recommendations for the operation and calibration of PID and FID meters and GC. PID meters should be calibrated to a benzene response standard, FID meters to a methane or benzene response standard. Calibration of PID and FID meters should be check every 10 sample analyses.
A recommended calibration procedure for GC/FID or GC/PID field units is as follows:
(1) Using pesticide-grade Methanol or other appropriate solvent, prepare a stock solution containing compounds of interest (i.e. BTEX). Calculate concentration of compounds of interest in ug/ml. (2) prepare daily gaseous calibration standard by dispensing a small volume of the stock solution into a 40-ml VOA vial. Assume stock solution totally volatilizes; calculate gaseous concentration of compounds of interest in ug/ml. Where appropriate, convert to ppm (v/v).
CONTINUED
5 - 2

OPTIMIZATION OF SAMPLING PROGRAM
Utilization of PID/FID meters and soil-gas flow rotameters can optimize sampling efficiency and effectiveness. Total organic vapor (TOV) measurements from PID/FID meters can be used to help select and screen sampling points for a more time-intensive GC analysis, and provide guidance on the optimum volume of GC sample injection. Moreover, in the first graph below, a low PID reading (<50ppm) combined with a high FID reading (>1000ppm) is usually indicative of the presence of methane. In the middle graph, a decline in TOV readings could indicate "short-circuiting"; in the last graph, a sharp decline in flow measurement may indicate a leak in the sampling system.
Due to detector selectivities, for gasoline, a PID/FID response ratio "as benzene" below 1.0 usually indicates a relatively "fresh" residual, above 2.0, a weathered product. It should be noted that PID meter suppression may occur above 150 PPM (v/v).
5 - 3

APPENDIX 6
Special Considerations of Industrial and Occupational Buildings
(this section reserved)
Appendix 6