10-1. 10-2 chapter ten comparing proportions and chi-square tests mcgraw-hill/irwin copyright ©...
Post on 19-Dec-2015
213 views
TRANSCRIPT

10-10-11

10-10-22
Chapter Ten
Comparing Proportions and Chi-Square Tests
McGraw-Hill/Irwin Copyright © 2004 by The McGraw-Hill Companies, Inc. All rights reserved.

10-10-33
Comparing Proportions and Chi-Square tests
10.1 Comparing Two Population Proportions
10.2 The Chi-Square Distribution
10.3 Chi-Square Goodness of Fit Tests
10.4A Chi-Square Test for Independence

10-10-44
Large Sample Interval for the Difference in Proportions
1n
)p̂1(p̂
1n
)p̂1(p̂)p̂p̂(
2
22
1
112/21
z
If two independent samples are both large, a
100(1 - )% confidence interval for p1 - p2 is
10.1 Comparing Two Population Proportions

10-10-55
Large Sample Test for Difference in Proportions
Test Statistics
If two sampled populations are both large, we can reject H0: p1 - p2 = D0 at the level of significance if and only if the appropriate rejection point condition holds or, equivalently, if the corresponding p-value is less than .
021
021
021
:
:
:
DppH
DppH
DppH
a
a
a
2/2/
2/
or
isthat,
zzzz
zz
zz
zz
Alternative Reject H0 if: p-Value
zofrightcurve normalstdunderarea Twice
zofleftcurvenormalstdunderArea
zofrightcurvenormalstdunderArea
1)ˆ1(ˆ
1)ˆ1(ˆ
D)ˆˆ(z
2
22
1
11
021
npp
npp
pp
0D0
21
021
11)ˆ1(ˆ
D)ˆˆ(z
nnpp
pp
0D0

10-10-66
Example: Difference Between Proportions: Interval and Test
]1281.0,2059.0[0389.0167.01-1000
).2021(.798
1-1000
).3691(.63196.1).798(.631
Test H0: p1 - p2 = 0 versus Ha: p1 - p2 0
001.0)2673.8(2,29.32673.8
10001
10001
)7145.01(7145.0
0)798.0631.0(
11)ˆ1(ˆ
D)ˆˆ(z
0005.0
21
021
zPvaluepz
nnpp
pp
Example 10.2 Advertising Media 10001000
798631p̂,
1000
798p̂,
1000
631p̂ 21
95% Confidence Interval for p1 - p2

10-10-77
10.2 The Chi-Square Distribution
The chi-square distribution depends on the number of degrees of freedom.
A chi-square point is the point under a chi-square distribution that gives right-hand tail area .
2

10-10-88
10.3 Chi-Square Goodness of Fit Test
Example 10.4 The Microwave Oven Preference Case
Are consumer preferences for microwave ovens in Milwaukee the same as those historically observed in Cleveland?
Cleveland MilwaukeeBrand Market Share Frequency
1 20% 1022 35% 1213 30% 1204 15% 57
Goodness of Fit Test
observed expected O - E (O - E)² / E % of chisq102 80.000 22.000 6.050 68.92121 140.000 -19.000 2.579 29.37120 120.000 0.000 0.000 0.00
57 60.000 -3.000 0.150 1.71400 400.000 0.000 8.779 100.00
8.78 chi-square3 df
.0324 p-value
MegaStat Output

10-10-99
A Goodness of Fit Test for Multinomial Probabilities
Consider the outcome of a multinomial experiment where each of n randomly selected items is classified into one of k groups and let
fi = number of items classified into group i (ith observed frequency)Ei = npi = expected number in ith group if pi is probability of being in group
i (ith expected frequency)
H0: multinomial probabilities are p1, p2, … , pk
Ha: at least one of the probabilities differs from p1, p2, … , pk
Test Statistic:
k
i i
ii
E
Ef=
1
22 )(
Reject H0 if
> or if p-value <
To Test:
2 and the p-value are based on p-1 degrees of freedom. Values of 2 are given in Table A.17.

10-10-1010
Example: Chi-Square Goodness of Fit Test
Example 10.4 The Microwave Oven Preference Case
H0: p1 = .20, p2 = .35, p3 = .30, p4 = .15
Ha: H0 fails to holdCleveland Milwaukee Expected
Brand Market Share Frequency Frequency ChiSqi
1 20% 102 80 6.05002 35% 121 140 2.57863 30% 120 120 0.00004 15% 57 60 0.1500
8.7786
0324.0)7786.8(
8147.77786.8
1500.00000.05786.20500.660
)6057(
120
)120120(
140
)140121(
80
)80102(
2
205.
2
2222
1
22
Pvaluep
E
)E(f=χ
k
i i
ii
8.7786
80)20.0(4001
E
pfnpE iii

10-10-1111
Chi-Square Goodness of Fit for Normal Distribution
Example 10.5 The Car Mileage Case
H0: car mileage data are random sample from normal population
Ha: data not from a normal population
907.0)5525.0(
8147.75525.0
8.0,55.31
2
205.
2
Pvaluep
sx
and the p-value are based on k-1-m = 6-1-2 = 3 degrees of freedom.
Observed ExpectedLower Upper Frequency Frequency (f - E)2/E
29.75 30.35 3 3.2732 0.022830.35 30.95 9 7.8302 0.174830.95 31.55 12 13.3966 0.145631.55 32.15 13 13.3966 0.011732.15 32.75 9 7.8302 0.174832.75 33.35 3 3.2732 0.0228
Chi-Square 0.5525
Interval
0
2
4
6
8
10
12
14
16
30.05 30.65 31.25 31.85 32.45 33.05
Mileage (midpoints)
Fre
qu
en
cy
Observed Expected
10-10-1212
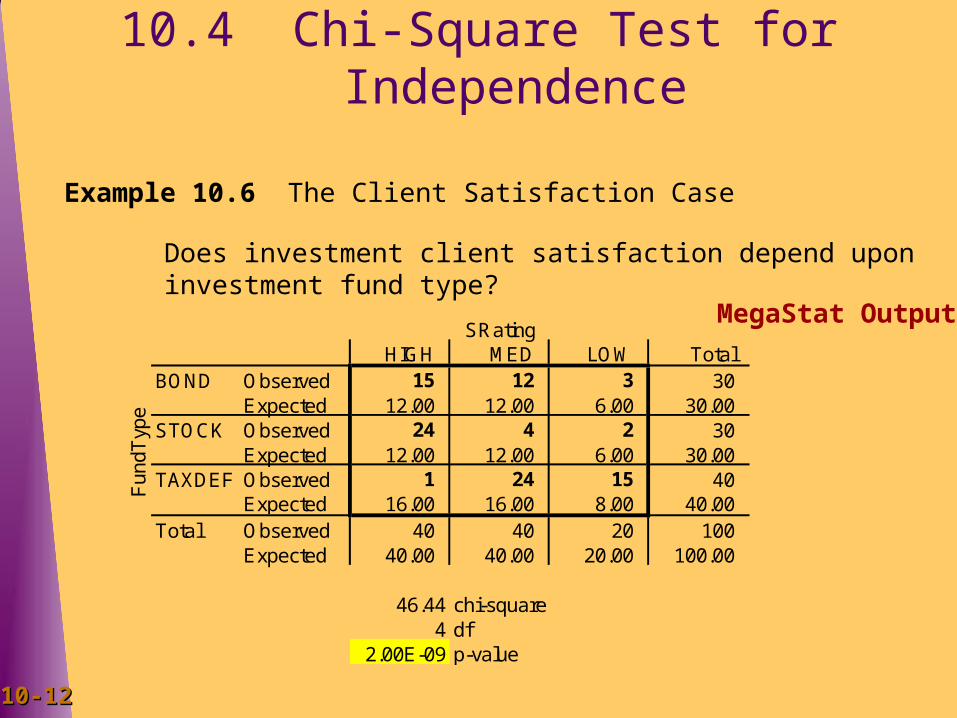
10.4 Chi-Square Test for Independence
Example 10.6 The Client Satisfaction Case
Does investment client satisfaction depend upon investment fund type?
MegaStat OutputSRating
HIGH MED LOW Total BOND Observed 15 12 3 30
Expected 12.00 12.00 6.00 30.00 STOCK Observed 24 4 2 30
Expected 12.00 12.00 6.00 30.00 TAXDEF Observed 1 24 15 40
Expected 16.00 16.00 8.00 40.00 Total Observed 40 40 20 100
Expected 40.00 40.00 20.00 100.00
46.44 chi-square4 df
2.00E-09 p-value
Fun
dTyp
e

10-10-1313
A Chi-Square Test for Independence
Test Statistic:
cellsall
22
ˆ)ˆ(
ij
ijij
E
Ef=
Reject H0 if
> or if p-value <
and the p-value are based on (r-1)(c-1) degrees of freedom. Values
of are given in Table A.17.
H0: the two classifications statistically independent
Ha: the two classifications statistically dependent
To Test:
Each of n randomly selected items is classified on two dimensions into a contingency table with r rows an c columns and let
fij = observed cell frequency for ith row and jth column
ri = ith row total, cj = jth column totalexpected cell frequency for ith row and jth column under independence
n
crE ji
ijˆ

10-10-1414
Example: Chi-Square Test for Independence
0000.0)4375.46(
4877.94375.46
0000.4...5000.17500.016
)1624(...
6
)63(
12
)1215(
16100
)40)(40(,...,12
100
)40)(30(;
ˆ
ˆ
2
205.
2
222
cellsall
22
Pvaluep
n
crE
n
crE
E
)E(f=χ MT
TMHB
BH
ij
ijij
46.4375
Example 10.6 The Client Satisfaction Case
H0: client satisfaction is independent of fund type
Ha: client satisfaction depends upon fund type
Client Satisfaction Fund High Low Med All Bond 15 3 12 30 12 6 12 Stock 24 2 4 30 12 6 12 TaxDef 1 15 24 40 16 8 16 All 40 20 40 100

10-10-1515
Example: Analysis of Classification Dependencies
0000.0)4375.46(
4877.94375.462
205.
2
Pvaluep
Example 10.7 The Client Satisfaction Case
Client Satisfaction Fund High Low Med AllBond 15 3 12 30 50.00 10.00 40.00 100.00 Stock 24 2 4 30 80.00 6.67 13.33 100.00TaxDef 1 15 24 40 2.50 37.50 60.00 100.00
Row Percentages
Row Percentages versus Investment Type for each Satisfaction Level

10-10-1616
Comparing Proportions and Chi-Square tests
Summary:
10.1 Comparing Two Population Proportions
10.2 The Chi-Square Distribution
10.3 Chi-Square Goodness of Fit Tests
10.4 A Chi-Square Test for Independence