1 (w/w). the mixture was poured on top of the photoresist mold and degassed. after curing at 75 ......
TRANSCRIPT
Supporting information
Experimental
Materials
SU-8 50 photoresist and developer were purchased from MicroChem (MicroChem Corp., USA).
PDMS Sylgard 184 was obtained from Dow Corning Corp (Dow Corning Silicones Co., Ltd,
USA). Trimethylchlorosilane (TMCS), 3-Aminopropyltriethoxysilane (APTES),
tris (hydroxymethyl) minomethane hydrochloride (Tris-HCl), ammonium bicarbonate
(NH4HCO3), acetonitrile (ACN), trifluoroacetic acid (TFA) were obtained from Alfa Aesar.
Dopamine (DA), 2, 5-dihydroxybenzoic acid (2, 5-DHB), myoglobin from equine heart (MYO),
cytochrome C (cty-C), bovine serum albumin (BSA), and trypsin (from bovine pancreas, TPCK
treated) were purchased from Sigma-Aldrich (St. Louis, MO, USA).
Fabrication of the microchip
The microfluidic device was made by conventional soft lithographic techniques.1, 2 Briefly, the
layout (Fig. S1) was designed with AutoCAD and transferred to high-resolution photomasks
fabricated on polymer film. The negative photoresist SU-8 50 was spin-coated on a clean silicon
wafer, and followed by patterning using a mask aligner (Karl Suss MA6). Subsequently, the
development was accomplished by immersion into SU-8 developer to form the photoresist mold.
The photoresist mold was exposed to the TMCS vapor for 2 minutes before using, and the PDMS
kit containing the pre-polymer and a cross-linker was well mixed in the recommended ratio of
10:1 (w/w). The mixture was poured on top of the photoresist mold and degassed. After curing at
75 oC for 4 hours, the cured PDMS was peeled off and punched with a blunt needle for inlets and
outlets. The microfluidic chip was assembled by bonding the PDMS cast to a glass slide after air
plasma treatment.
Electronic Supplementary Material (ESI) for Lab on a Chip.This journal is © The Royal Society of Chemistry 2014
Construction of microfluidic digestion system
The microfluidic chip with microchannel was first cleaned with 1 M NaOH solution, and then
infused with 10% (v/v) APTES solution to introduce the amino group to the microchannel surface.
The APTES-treated microfluidic chip was then rinsed with ethanol, dried, and baked at 125 ºC for
30 min. Then, 1 mg mL-1 dopamine solution (in 10 mM Tris-HCl buffer; pH=8.5) was injected in
to the microfluidic chip under the flow rate of 2.5 μL min-1 on a hot plate of 50 ºC for 6 hours to
form the functional polydopamine layer via the self-polymerization process. The microfluidic
chip was further rinsed with Tris-HCl buffer. Then, 1 mg mL-1 trypsin solution was injected in to
the microfluidic chip with the flow rate of 5 μL min-1 for 1 hour, and followed by washing with
50 mM NH4HCO3 buffer. The microfluidic chip was ready to use.
Rapid digestion of proteins using the microfluidic digestion system
Myoglobin (MYO), cytochrome C (Cyt-c) and bovine serum albumin (BSA) were used to
evaluate the efficiency of the protein digestion. The proteins were dissolved into NH4HCO3
buffer to form protein solutions (100 μg mL-1). The protein solution was injected in to the
microfluidic digestion system by a syringe pump with the flow rate of 2 μL min-1 and the
microfluidic system was heated with the hotplate and maintained at 37 ºC. The effluent was
collected from the outlet and quenched with 1% HCl in 50%ACN solution. For regeneration, the
used microfluidic system were rinsed with the NH4HCO3 buffer for 1 min with the flow rate of 20
μL min-1. The conventional in-solution digestion with free trypsin was also conducted for
comparison. Trypsin was added into the protein solution with an optimized enzyme/substrate
ratio of 1:50 (w/w),3-5 and then the solution was incubated at 37 oC for 30 minutes or 12 hours.
Human cells (MDA-MB-231) were cultured according the standard method for protein
extraction. To extract the protein, cultured cells were first washed with 5 mL of DPBS for twice,
and then 1.5 mL ice cold RIPA buffer containing protease inhibitor cocktail and phosphatase
inhibitor cocktails was added and followed by incubation in a 4 °C refrigerator for 5 minutes.
After that, the treated cells were collected using a cell scraper and transferred in to a tube on ice
for 5 min incubation. The obtained cell lysate was centrifuged at 8000 g under 4 °C for 10
minutes. The supernatant was collected and the final protein concentration was determined. The
extracted proteins were purified, denatured and reduced via a universal sample preparation
method.6 The digestion process is similar to that of standard proteins.
Theoretical simulation
To explore the relationship between enzymatic digestion efficiency and the flow rate of the
substrates flowing into the microfluidic channel, finite element simulation (FEM) was performed
based on the actual 3D geometry of the microfluidic device using the commercial software
COMSOL Multiphysics 4.4, and the physics-controlled mesh was employed. The universal
width and height of the meandering channel was 500 µm and 40 µm, respectively. The total
length of the channel was 94.5 mm. Three modules (Surface Reaction, Laminar Flow and
Transport of Diluted Species) were employed in the simulations.
Surface Reaction module (from Reaction Engineering module) was used to describe the
enzymatic catalysis of protein hydrolysis. Due to the high computational demand, we simplify the
enzymatic digestion reaction into the following irreversible chemical reaction equation:
AB AB
where AB denotes the protein substrates before hydrolysis while A and B denote the digested
peptides. The initial concentration of AB, A and B are CAB = 6 µM, CA = CB = 0 M. The rate
constant k is described by the Arrhenius equation:
k AeEa RT
where T denotes the absolute temperature (310 K), A denotes the pre-exponential
factor, Ea denotes the activation energy, and R denotes the universal gas constant. Here we set the
A and Ea of the enzymatic digestion as 10e8 and 89.5 kJ/mol, respectively. 7
Laminar Flow Module was used to model the incompressible laminar flow domain, by the
following Navier-Stokes equations:
ut u u pI u u T
F
u 0
where ρ denoted the fluid density, which was the water density of 1,000 kg/m3, u denoted the
fluid velocity (m/s), t the time (s), µ the dynamic viscosity (0.001 Pa·s), p the pressure (Pa), and F
the force (N/m3). No-slip wall boundary condition was applied. We set the inlet fluid mass flow
rate as 3.3e-8 kg/s, 8.3e-8 kg/s, 1.7e-7 kg/s, 3.3e-7 kg/s and 5e-7 kg/s, respectively,
corresponding to the volumetric flow rate of 2 µL/min, 5 µL/min, 10 µL/min, 20 µL/min and 30
µL/min. The outlet pressure was maintained at 0 Pa.
Transport of Diluted Species Module was used to model the mass transfer, by the following
equations:
ci
t Dici u ci Ri
Ni Dici uci
where ci denoted the concentration of chemical species i, which was calculated by the Surface
Reaction module, Di denoted the diffusivity, which was 10e-9 m2/s for all three species, and u the
velocity, which was defined by the velocity field calculated by the Laminar Flow module. The
entire inner surface of the microfluidic channel including top, bottom, side wall, was set as the
catalytic surface. The flux condition was automatically computed from the Surface Reaction
module.
MS analysis
Matrix-assisted laser desorption/ionization time-of-flight mass spectrometry (MALDI-TOF MS)
analysis. 1 μL of proteolytic digest was mixed with 1 μL of matrix solution containing 20 mg mL-
1 DHB (in 50% acetonitrile aqueous solution, v/v) and 1% (v/v) H3PO4 aqueous solution by
pipetting and 0.5 μL of mixture was deposited onto the MALDI target. MALDI-TOF mass
spectrometry analysis was performed on an MALDI-TOF/TOF mass spectrometer (AB SCIEX
5800, Foster City, CA, USA) in positive ion mode with a 355 nm Nd:YAG laser, 200 Hz
repetition rate, and 20 kV acceleration voltage. Search parameters of fragment ion spectra were
submitted to MASCOT (http://www.matrixscience.com/) for a database search and identification
of corresponding peptides.
Liquid chromatography mass spectrometry (LC-MS) analysis. An AB SCIEX TripleTOF 5600
System (Foster City, CA, USA) equipped with an Eksigent nanoLC Ultra and ChiPLC-nanoflex
(Eksigent, Dublin, CA) in Trap Elute configuration was employed for LC-MS measurement. The
acquired mass spectrometric raw data was processed using ProteinPilot 5.0 software (AB SCIEX)
with the Paragon search mode. The ProteinPilot Descriptive Statistics Template (PDST, AB
SCIEX) was used for alignment of multiple results and evaluation of false discovery rate (FDR).
Characterization
Microscopy images were obtained on a fluorescence microscopy (Olympus IX71). Scanning
electron microscopy (SEM) images were obtained on a field emission scanning electron
microscope (FESEM; NanoSEM 630, NOVA). Raman spectra were recorded on a WITec
Confocal Raman instrument with a 514 nm laser wavelength. Surface morphology and roughness
was evaluated using an atomic force microscope (AFM, Bruker Icon). Fourier transform infrared
spectra were determined on a Bruker Vertex V70 FTIR spectrometer and scanned from 400 to
4000 cm-1 at a resolution of 6 cm-1.
Figures
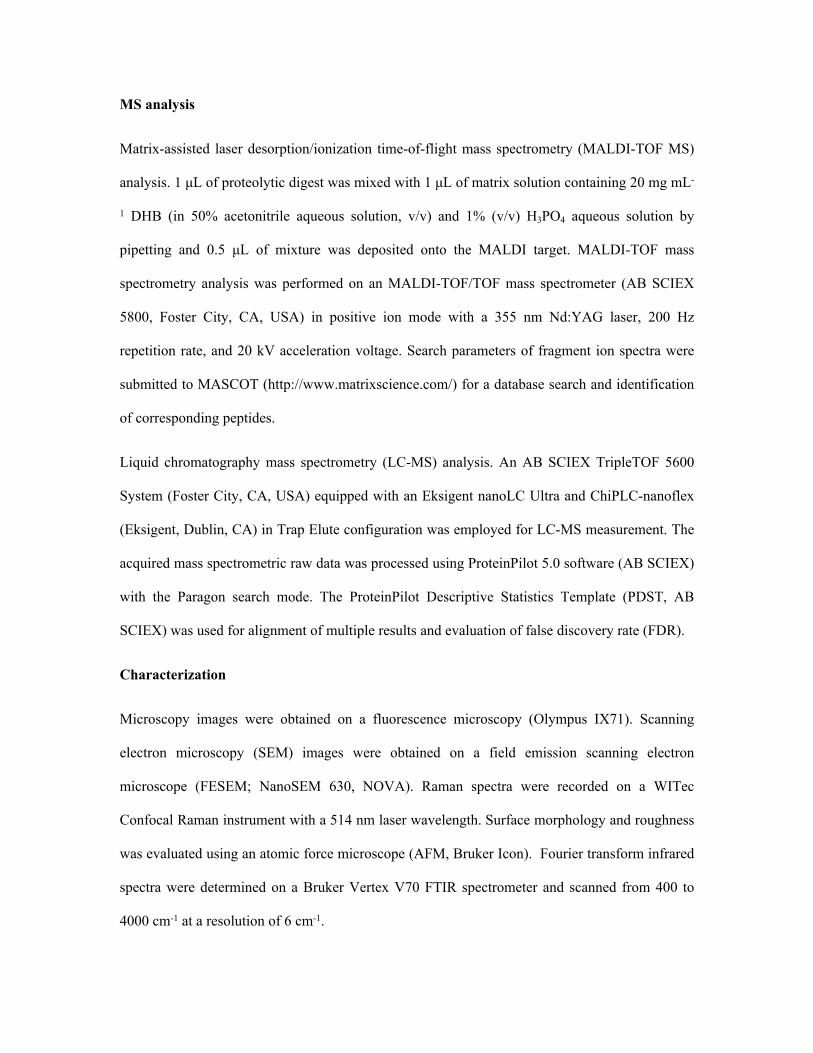
Fig. S1 The design layout and dimensions of the microfluidic chip.
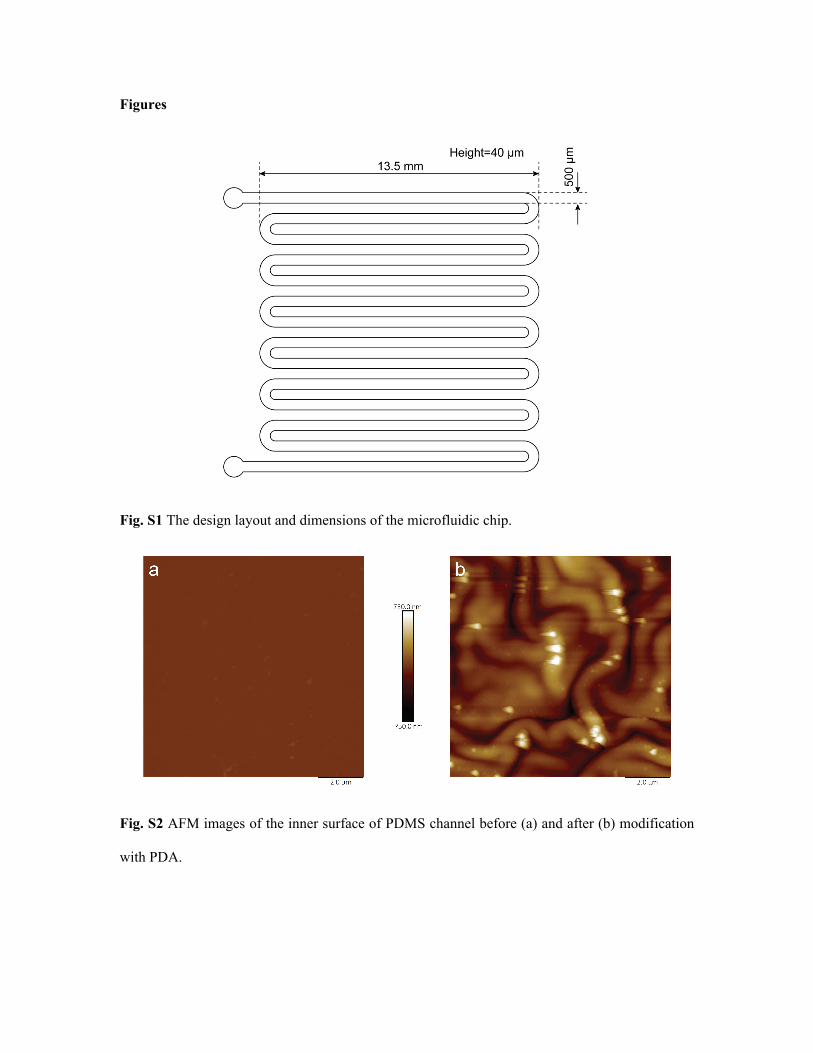
Fig. S2 AFM images of the inner surface of PDMS channel before (a) and after (b) modification
with PDA.
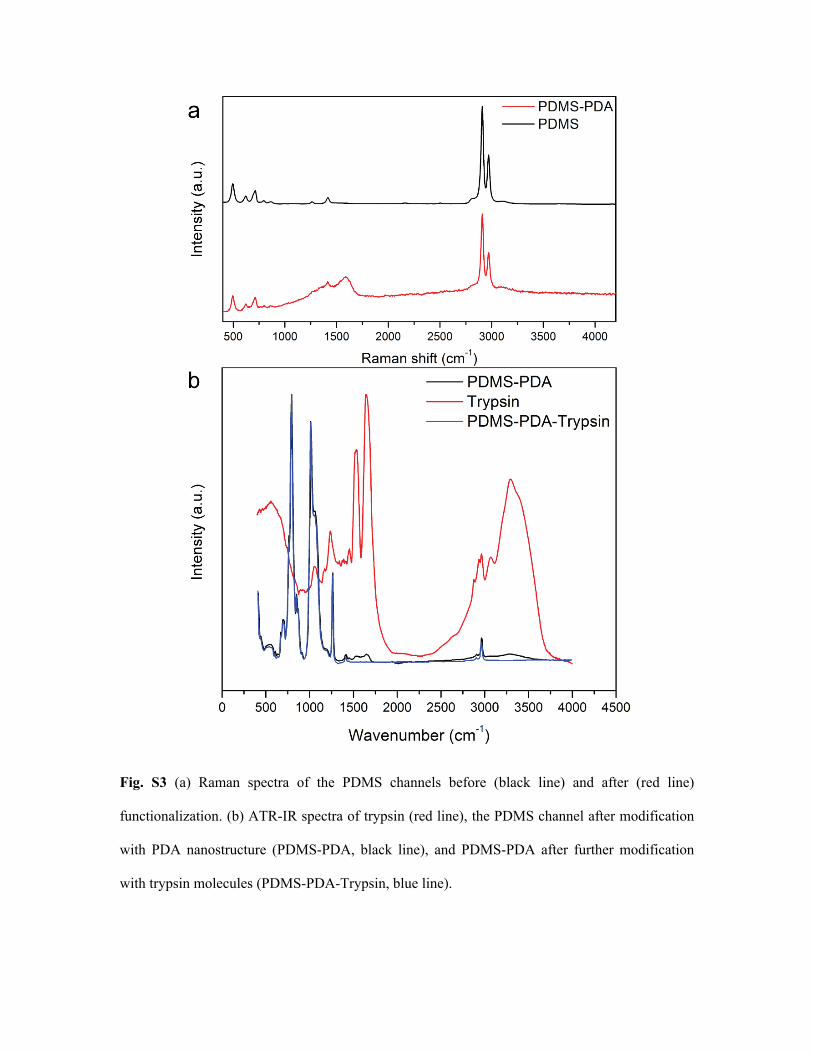
Fig. S3 (a) Raman spectra of the PDMS channels before (black line) and after (red line)
functionalization. (b) ATR-IR spectra of trypsin (red line), the PDMS channel after modification
with PDA nanostructure (PDMS-PDA, black line), and PDMS-PDA after further modification
with trypsin molecules (PDMS-PDA-Trypsin, blue line).
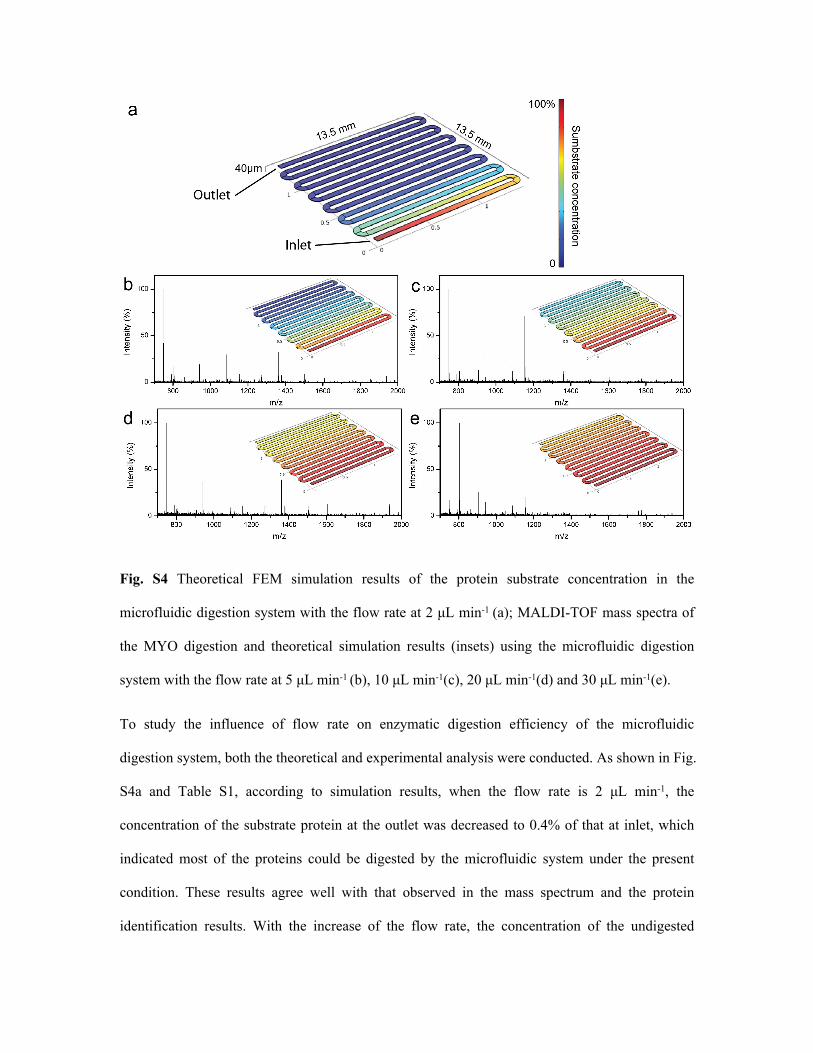
Fig. S4 Theoretical FEM simulation results of the protein substrate concentration in the
microfluidic digestion system with the flow rate at 2 μL min-1 (a); MALDI-TOF mass spectra of
the MYO digestion and theoretical simulation results (insets) using the microfluidic digestion
system with the flow rate at 5 μL min-1 (b), 10 μL min-1(c), 20 μL min-1(d) and 30 μL min-1(e).
To study the influence of flow rate on enzymatic digestion efficiency of the microfluidic
digestion system, both the theoretical and experimental analysis were conducted. As shown in Fig.
S4a and Table S1, according to simulation results, when the flow rate is 2 μL min-1, the
concentration of the substrate protein at the outlet was decreased to 0.4% of that at inlet, which
indicated most of the proteins could be digested by the microfluidic system under the present
condition. These results agree well with that observed in the mass spectrum and the protein
identification results. With the increase of the flow rate, the concentration of the undigested
proteins at outlets would also increase according to the simulation, while the quality of the related
mass spectrum deteriorated and the number of identified peptide and sequence coverage reduced
from the experimental perspective. Notably, although the mixing might be enhanced by the
increase of the flow rate, the protein substrates have fewer chances to contact with the
functionalized inner surface of the microfluidic digestion system, which would result in the poor
digestion efficiency.
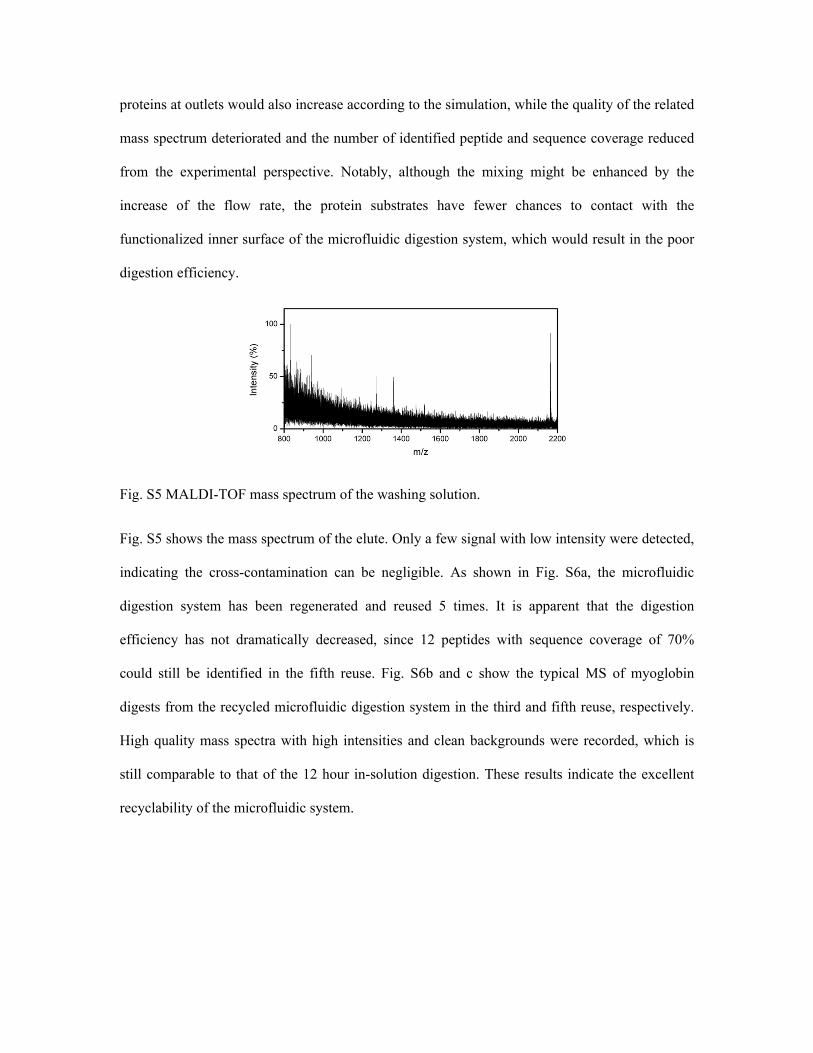
Fig. S5 MALDI-TOF mass spectrum of the washing solution.
Fig. S5 shows the mass spectrum of the elute. Only a few signal with low intensity were detected,
indicating the cross-contamination can be negligible. As shown in Fig. S6a, the microfluidic
digestion system has been regenerated and reused 5 times. It is apparent that the digestion
efficiency has not dramatically decreased, since 12 peptides with sequence coverage of 70%
could still be identified in the fifth reuse. Fig. S6b and c show the typical MS of myoglobin
digests from the recycled microfluidic digestion system in the third and fifth reuse, respectively.
High quality mass spectra with high intensities and clean backgrounds were recorded, which is
still comparable to that of the 12 hour in-solution digestion. These results indicate the excellent
recyclability of the microfluidic system.
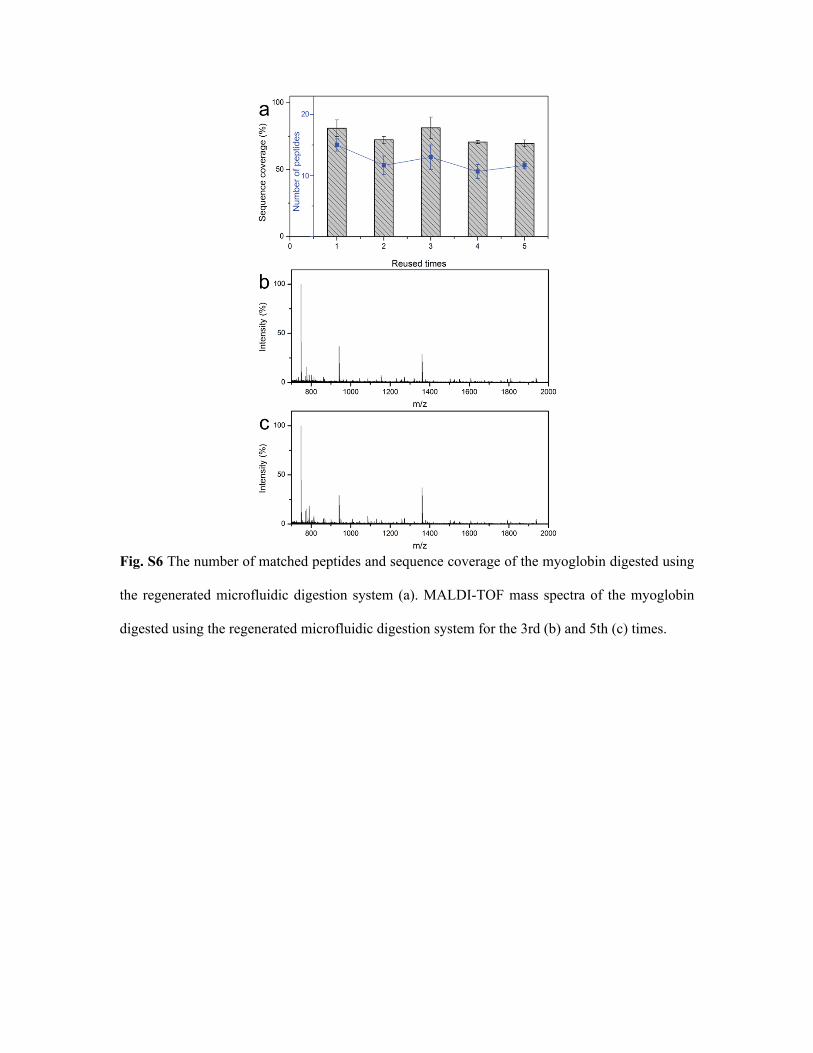
Fig. S6 The number of matched peptides and sequence coverage of the myoglobin digested using
the regenerated microfluidic digestion system (a). MALDI-TOF mass spectra of the myoglobin
digested using the regenerated microfluidic digestion system for the 3rd (b) and 5th (c) times.
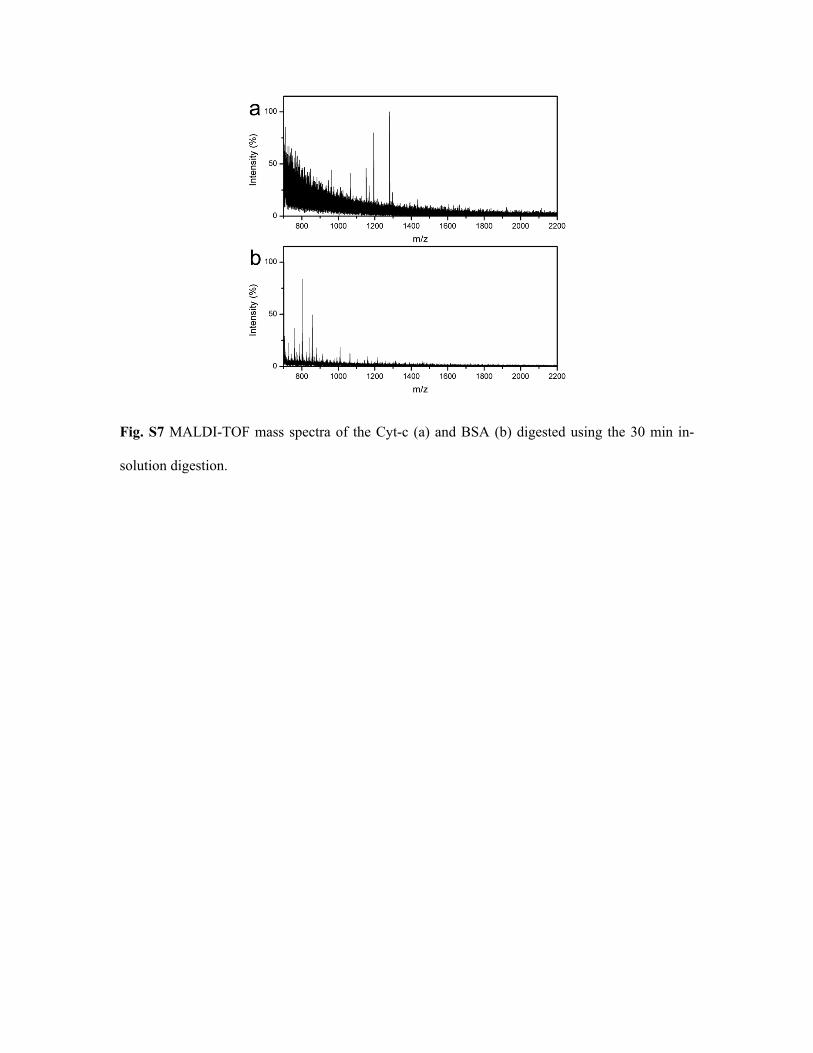
Fig. S7 MALDI-TOF mass spectra of the Cyt-c (a) and BSA (b) digested using the 30 min in-
solution digestion.
Tables
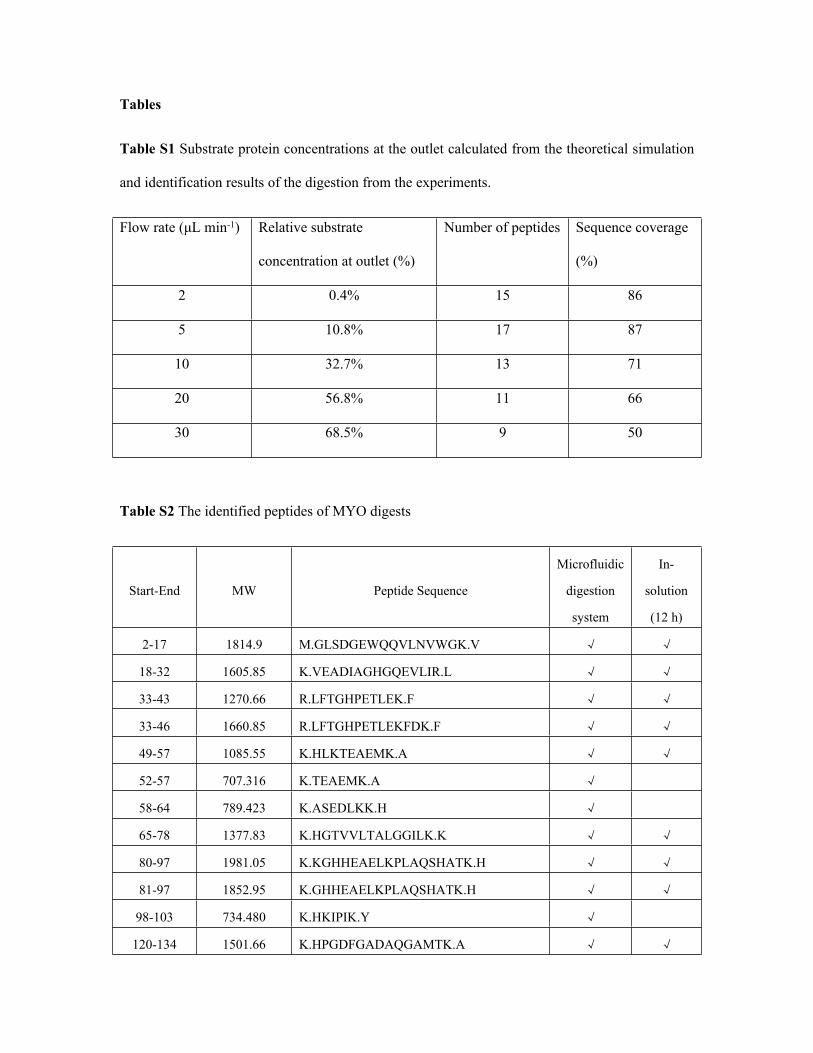
Table S1 Substrate protein concentrations at the outlet calculated from the theoretical simulation
and identification results of the digestion from the experiments.
Flow rate (μL min-1) Relative substrate
concentration at outlet (%)
Number of peptides Sequence coverage
(%)
2 0.4% 15 86
5 10.8% 17 87
10 32.7% 13 71
20 56.8% 11 66
30 68.5% 9 50
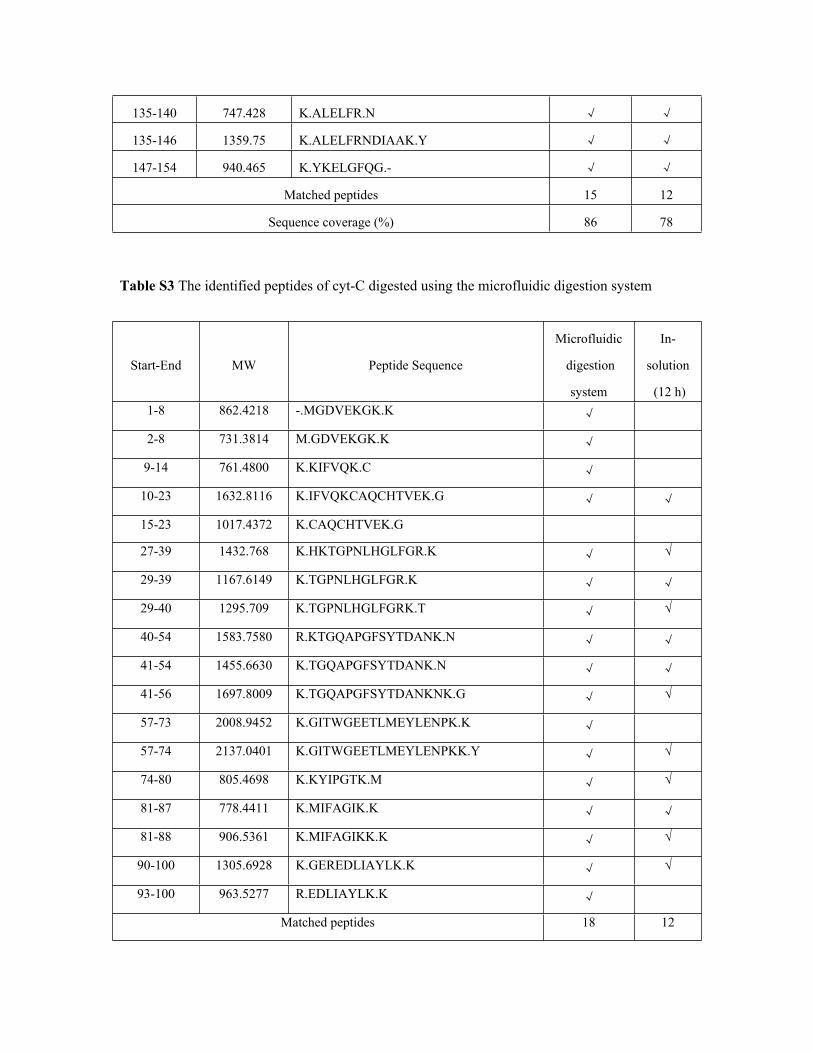
Table S2 The identified peptides of MYO digests
Start-End MW Peptide Sequence
Microfluidic
digestion
system
In-
solution
(12 h)
2-17 1814.9 M.GLSDGEWQQVLNVWGK.V √ √
18-32 1605.85 K.VEADIAGHGQEVLIR.L √ √
33-43 1270.66 R.LFTGHPETLEK.F √ √
33-46 1660.85 R.LFTGHPETLEKFDK.F √ √
49-57 1085.55 K.HLKTEAEMK.A √ √
52-57 707.316 K.TEAEMK.A √
58-64 789.423 K.ASEDLKK.H √
65-78 1377.83 K.HGTVVLTALGGILK.K √ √
80-97 1981.05 K.KGHHEAELKPLAQSHATK.H √ √
81-97 1852.95 K.GHHEAELKPLAQSHATK.H √ √
98-103 734.480 K.HKIPIK.Y √
120-134 1501.66 K.HPGDFGADAQGAMTK.A √ √
135-140 747.428 K.ALELFR.N √ √
135-146 1359.75 K.ALELFRNDIAAK.Y √ √
147-154 940.465 K.YKELGFQG.- √ √
Matched peptides 15 12
Sequence coverage (%) 86 78
Table S3 The identified peptides of cyt-C digested using the microfluidic digestion system
Start-End MW Peptide Sequence
Microfluidic
digestion
system
In-
solution
(12 h)1-8 862.4218 -.MGDVEKGK.K √
2-8 731.3814 M.GDVEKGK.K √
9-14 761.4800 K.KIFVQK.C √
10-23 1632.8116 K.IFVQKCAQCHTVEK.G √ √
15-23 1017.4372 K.CAQCHTVEK.G
27-39 1432.768 K.HKTGPNLHGLFGR.K √ √
29-39 1167.6149 K.TGPNLHGLFGR.K √ √
29-40 1295.709 K.TGPNLHGLFGRK.T √ √
40-54 1583.7580 R.KTGQAPGFSYTDANK.N √ √
41-54 1455.6630 K.TGQAPGFSYTDANK.N √ √
41-56 1697.8009 K.TGQAPGFSYTDANKNK.G √ √
57-73 2008.9452 K.GITWGEETLMEYLENPK.K √
57-74 2137.0401 K.GITWGEETLMEYLENPKK.Y √ √
74-80 805.4698 K.KYIPGTK.M √ √
81-87 778.4411 K.MIFAGIK.K √ √
81-88 906.5361 K.MIFAGIKK.K √ √
90-100 1305.6928 K.GEREDLIAYLK.K √ √
93-100 963.5277 R.EDLIAYLK.K √
Matched peptides 18 12
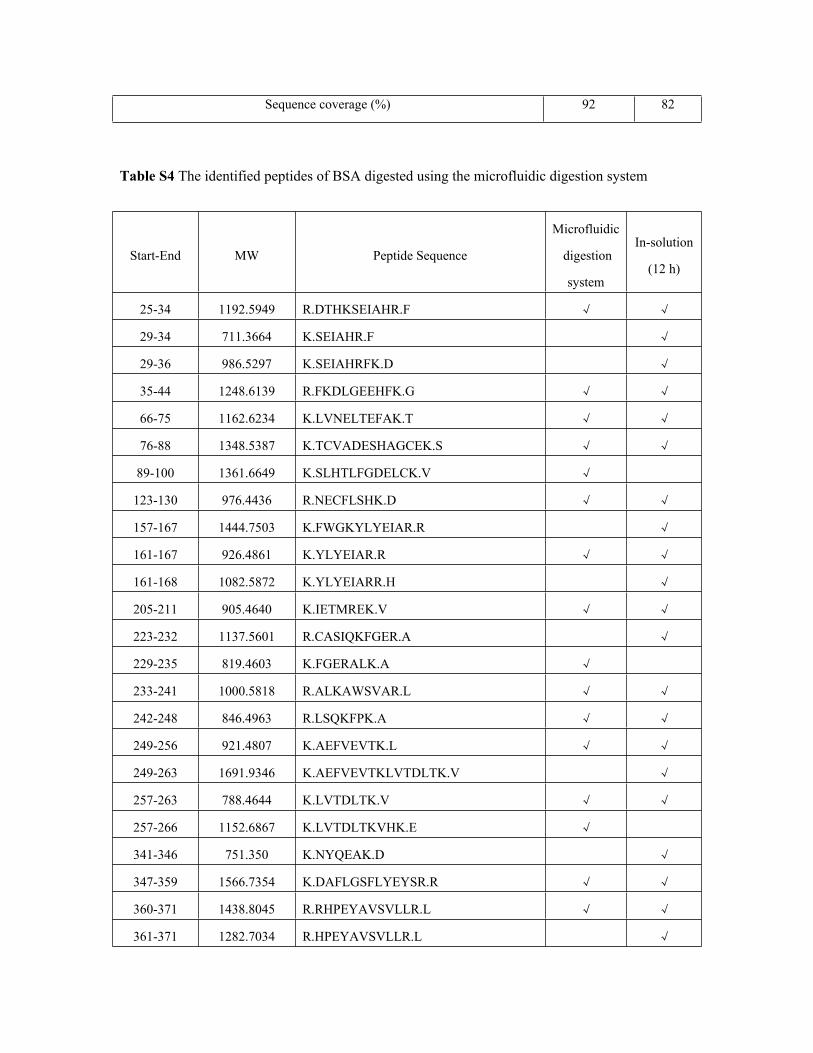
Sequence coverage (%) 92 82
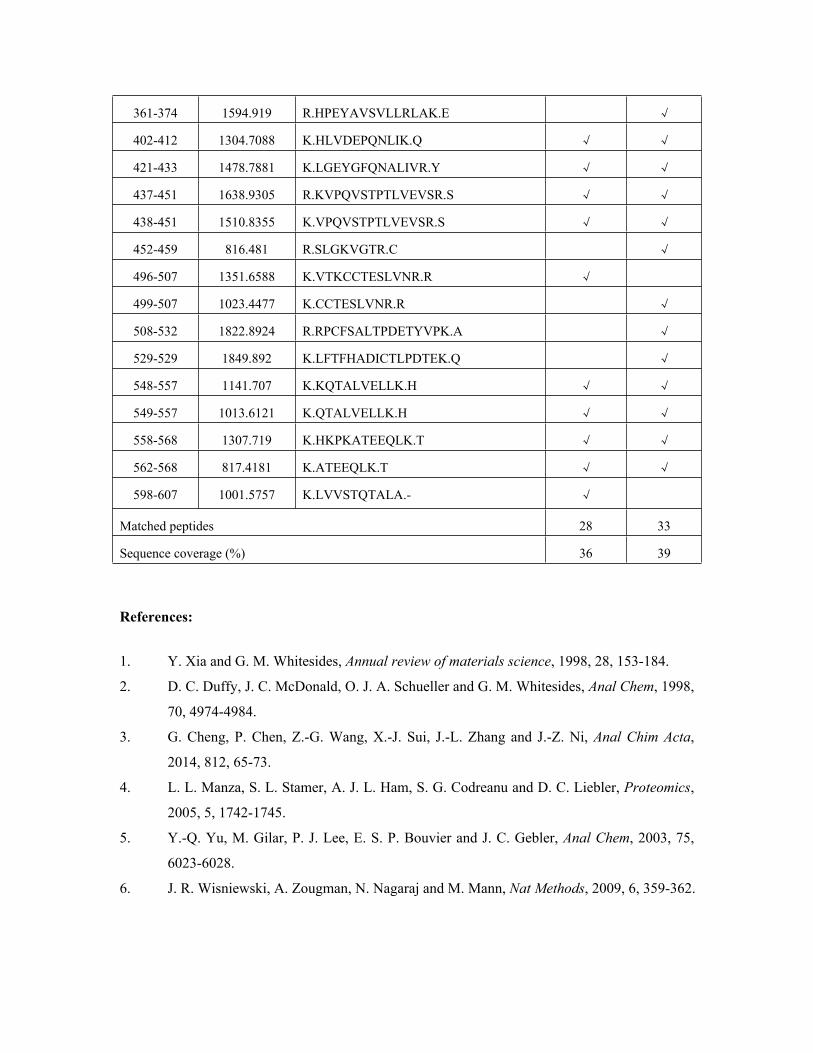
Table S4 The identified peptides of BSA digested using the microfluidic digestion system
Start-End MW Peptide Sequence
Microfluidic
digestion
system
In-solution
(12 h)
25-34 1192.5949 R.DTHKSEIAHR.F √ √
29-34 711.3664 K.SEIAHR.F √
29-36 986.5297 K.SEIAHRFK.D √
35-44 1248.6139 R.FKDLGEEHFK.G √ √
66-75 1162.6234 K.LVNELTEFAK.T √ √
76-88 1348.5387 K.TCVADESHAGCEK.S √ √
89-100 1361.6649 K.SLHTLFGDELCK.V √
123-130 976.4436 R.NECFLSHK.D √ √
157-167 1444.7503 K.FWGKYLYEIAR.R √
161-167 926.4861 K.YLYEIAR.R √ √
161-168 1082.5872 K.YLYEIARR.H √
205-211 905.4640 K.IETMREK.V √ √
223-232 1137.5601 R.CASIQKFGER.A √
229-235 819.4603 K.FGERALK.A √
233-241 1000.5818 R.ALKAWSVAR.L √ √
242-248 846.4963 R.LSQKFPK.A √ √
249-256 921.4807 K.AEFVEVTK.L √ √
249-263 1691.9346 K.AEFVEVTKLVTDLTK.V √
257-263 788.4644 K.LVTDLTK.V √ √
257-266 1152.6867 K.LVTDLTKVHK.E √
341-346 751.350 K.NYQEAK.D √
347-359 1566.7354 K.DAFLGSFLYEYSR.R √ √
360-371 1438.8045 R.RHPEYAVSVLLR.L √ √
361-371 1282.7034 R.HPEYAVSVLLR.L √
361-374 1594.919 R.HPEYAVSVLLRLAK.E √
402-412 1304.7088 K.HLVDEPQNLIK.Q √ √
421-433 1478.7881 K.LGEYGFQNALIVR.Y √ √
437-451 1638.9305 R.KVPQVSTPTLVEVSR.S √ √
438-451 1510.8355 K.VPQVSTPTLVEVSR.S √ √
452-459 816.481 R.SLGKVGTR.C √
496-507 1351.6588 K.VTKCCTESLVNR.R √
499-507 1023.4477 K.CCTESLVNR.R √
508-532 1822.8924 R.RPCFSALTPDETYVPK.A √
529-529 1849.892 K.LFTFHADICTLPDTEK.Q √
548-557 1141.707 K.KQTALVELLK.H √ √
549-557 1013.6121 K.QTALVELLK.H √ √
558-568 1307.719 K.HKPKATEEQLK.T √ √
562-568 817.4181 K.ATEEQLK.T √ √
598-607 1001.5757 K.LVVSTQTALA.- √
Matched peptides 28 33
Sequence coverage (%) 36 39
References:
1. Y. Xia and G. M. Whitesides, Annual review of materials science, 1998, 28, 153-184.
2. D. C. Duffy, J. C. McDonald, O. J. A. Schueller and G. M. Whitesides, Anal Chem, 1998,
70, 4974-4984.
3. G. Cheng, P. Chen, Z.-G. Wang, X.-J. Sui, J.-L. Zhang and J.-Z. Ni, Anal Chim Acta,
2014, 812, 65-73.
4. L. L. Manza, S. L. Stamer, A. J. L. Ham, S. G. Codreanu and D. C. Liebler, Proteomics,
2005, 5, 1742-1745.
5. Y.-Q. Yu, M. Gilar, P. J. Lee, E. S. P. Bouvier and J. C. Gebler, Anal Chem, 2003, 75,
6023-6028.
6. J. R. Wisniewski, A. Zougman, N. Nagaraj and M. Mann, Nat Methods, 2009, 6, 359-362.

7. J. Tóth, Z. Simon, P. Medveczky, L. Gombos, B. Jelinek, L. Szilágyi, L. Gráf and A.
Málnási-Csizmadia, Proteins: Structure, Function, and Bioinformatics, 2007, 67, 1119-
1127.