1 wireless networks ivan marsic rutgers university
Post on 20-Dec-2015
230 views
TRANSCRIPT
1
Wireless Networks
Ivan Marsic
Rutgers University
2
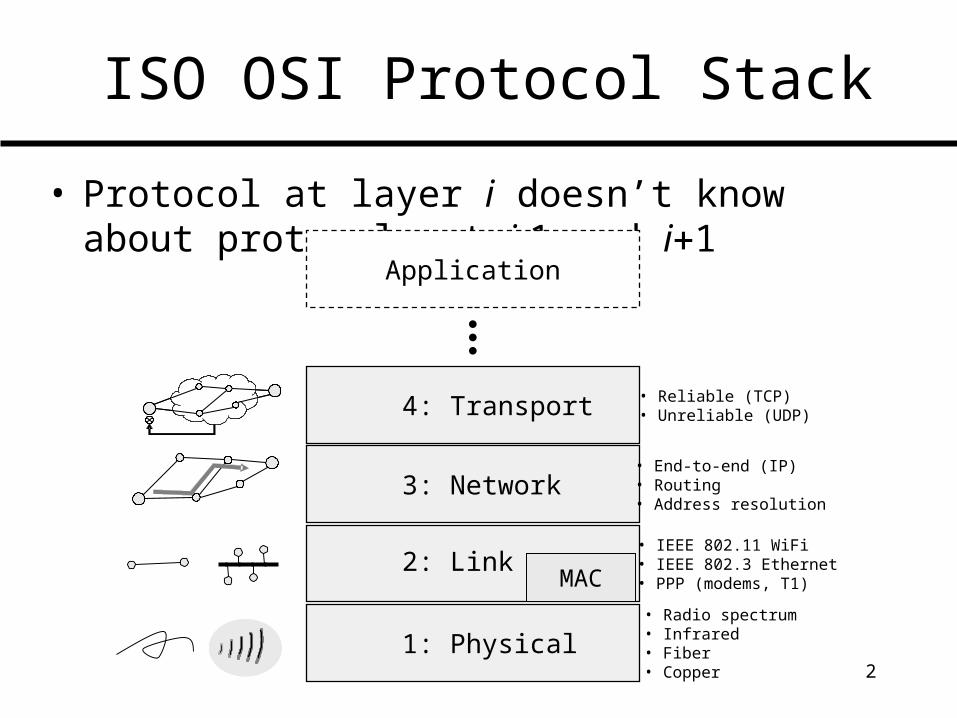
ISO OSI Protocol Stack
• Protocol at layer i doesn’t know about protocols at i1 and i1
1: Physical
2: LinkMAC
3: Network
4: Transport
• Radio spectrum• Infrared• Fiber• Copper
• IEEE 802.11 WiFi• IEEE 802.3 Ethernet• PPP (modems, T1)
• End-to-end (IP)• Routing• Address resolution
• Reliable (TCP)• Unreliable (UDP)
Application
3
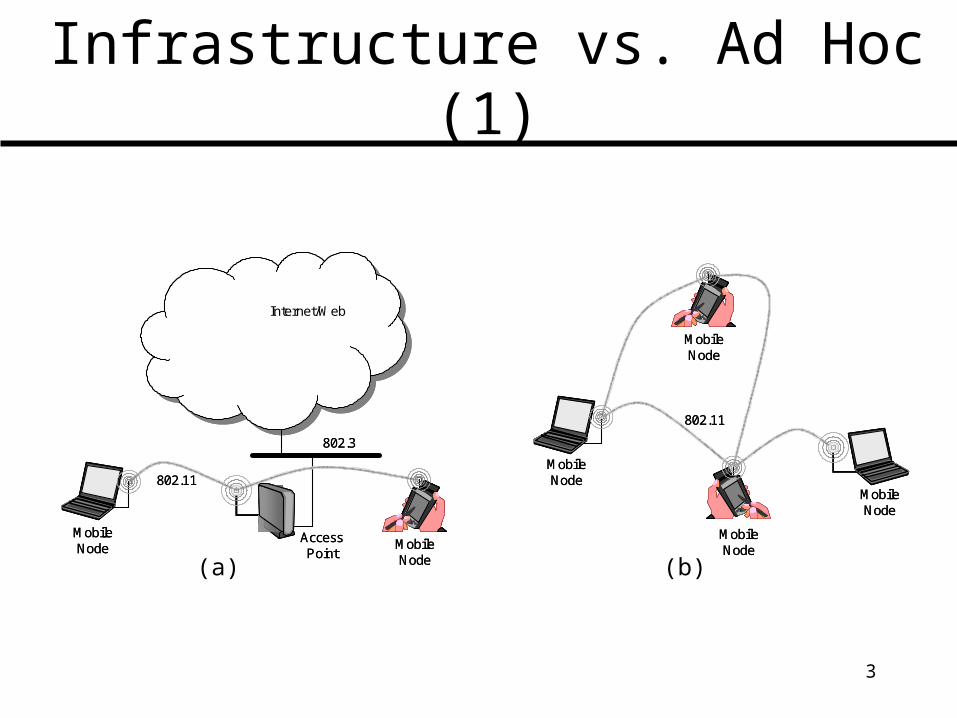
Infrastructure vs. Ad Hoc (1)
(a) (b)
Internet/WebInternet/Web
802.11
802.3
Mobile Node
Access Point
Mobile Node
Internet/WebInternet/Web
802.11
802.3
Mobile Node
Access Point
Mobile Node
802.11
Mobile Node
Mobile Node
Mobile Node
Mobile Node
802.11
Mobile Node
Mobile Node
Mobile Node
Mobile Node
4
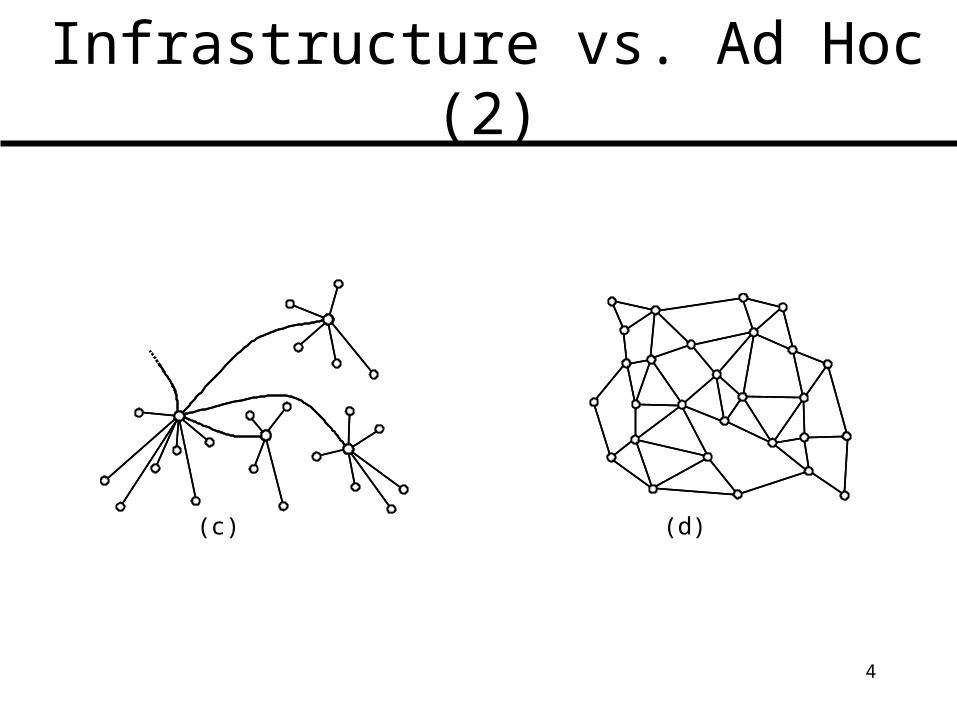
Infrastructure vs. Ad Hoc (2)
(c) (d)
5
Waves
6
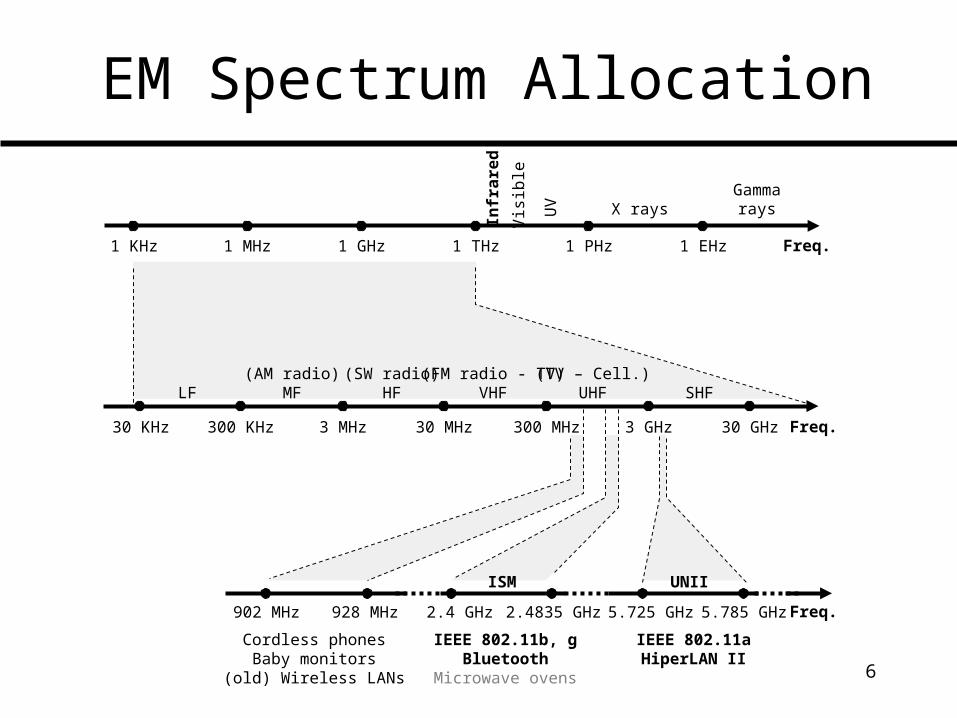
EM Spectrum Allocation
Freq.
Freq.
Freq.902 MHz 928 MHz 2.4 GHz 2.4835 GHz 5.725 GHz 5.785 GHz
(AM radio)MF
(SW radio)HF
(FM radio - TV)VHF
(TV – Cell.)UHF SHFLF
30 KHz 300 KHz 3 MHz 30 MHz 300 MHz 3 GHz 30 GHz
Vis
ible
Infr
are
d
X raysUV
Gammarays
1 KHz 1 MHz 1 GHz 1 THz 1 PHz 1 EHz
IEEE 802.11aHiperLAN II
IEEE 802.11b, gBluetooth
Microwave ovens
Cordless phonesBaby monitors
(old) Wireless LANs
ISM UNII

7
Communication Process
Information Source
Information Source TransmitterTransmitter ReceiverReceiver
NoiseSource
NoiseSource
DestinationDestinationCommunication
Channel
0 1 0 0 1 1 0 0 1 0
InputSignal:
SourceData:
Noise:
OutputSignal:
SamplingTimes:
0 1 0 0 1 1 0 0 1 0SourceData:
1 1 0 0 1 1 1 0 1 0DataReceived:
Bits in error
S
N
S+N
Decisionthreshold
8
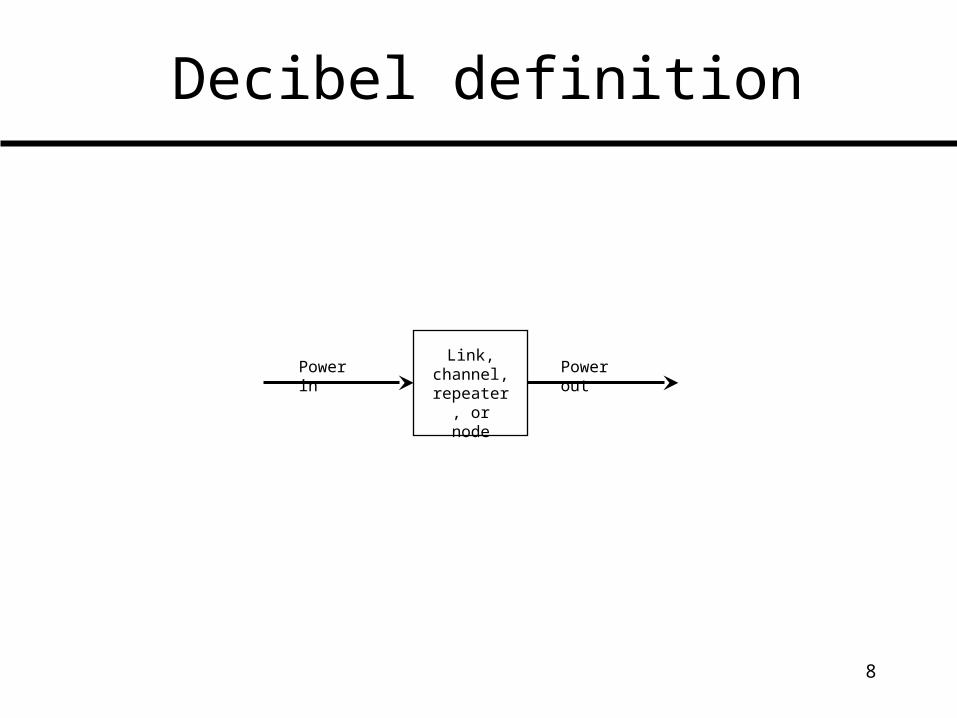
Decibel definition
Link, channel,
repeater, or node
Power in Power out
9
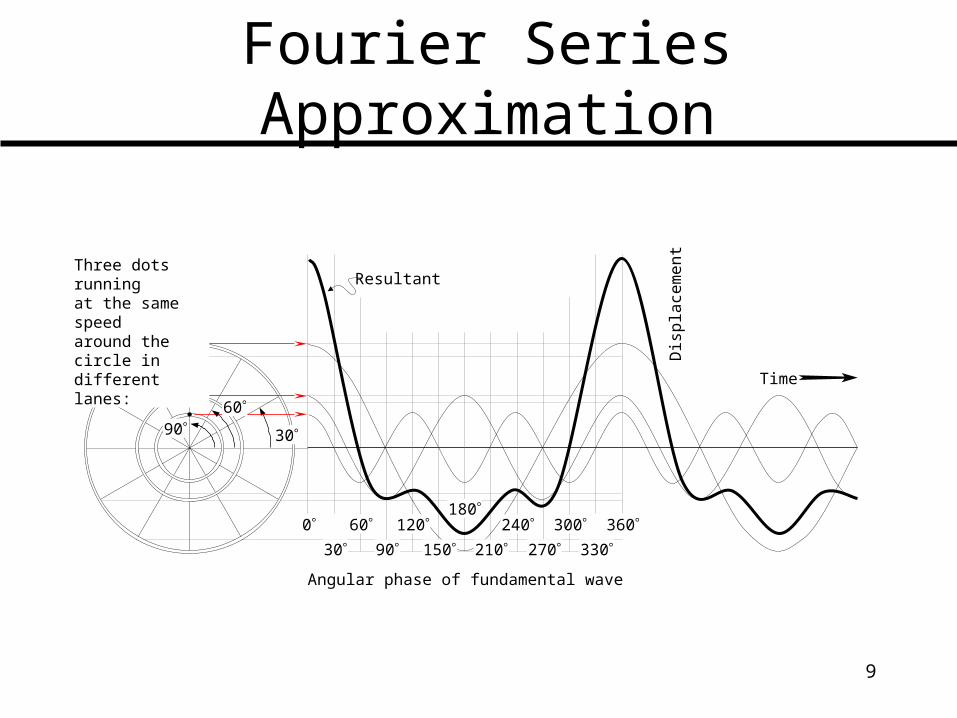
Fourier Series Approximation
0
30
60 360180
90
120
150 210
240
270
300
330
30
6090
Angular phase of fundamental wave
Time
Resultant
Dis
pla
cem
en
t
Three dots runningat the same speedaround the circle indifferent lanes:
10
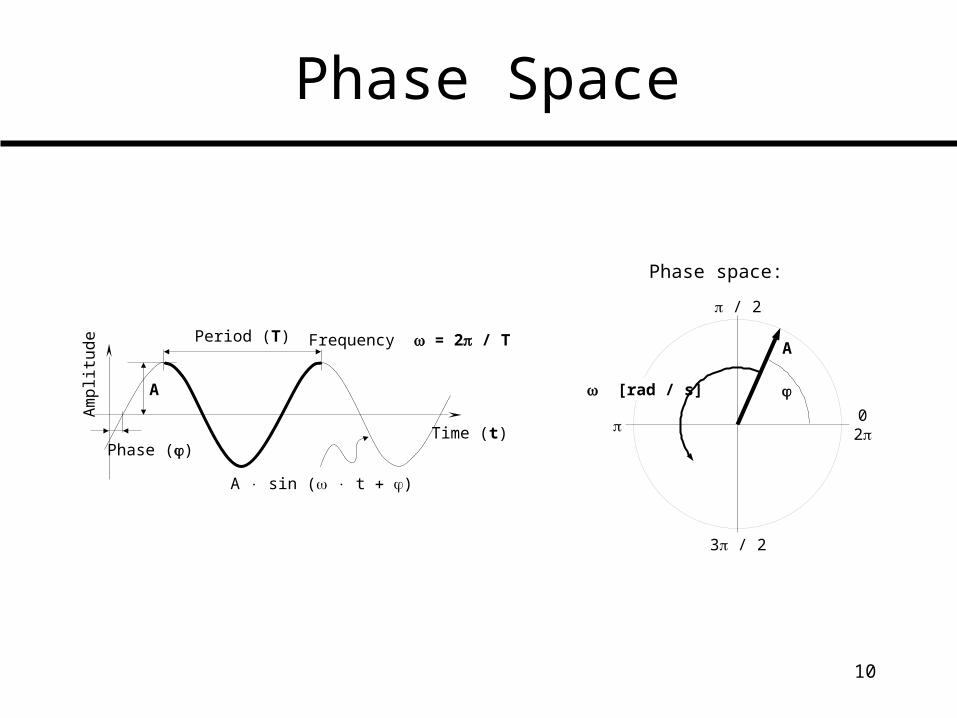
Phase Space
Time (t)
Am
plit
ud
e Period (T)
A
Phase ()
Frequency = 2 / T
A sin ( t )
Phase space:
A
02
/ 2
3 / 2
[rad / s]
11
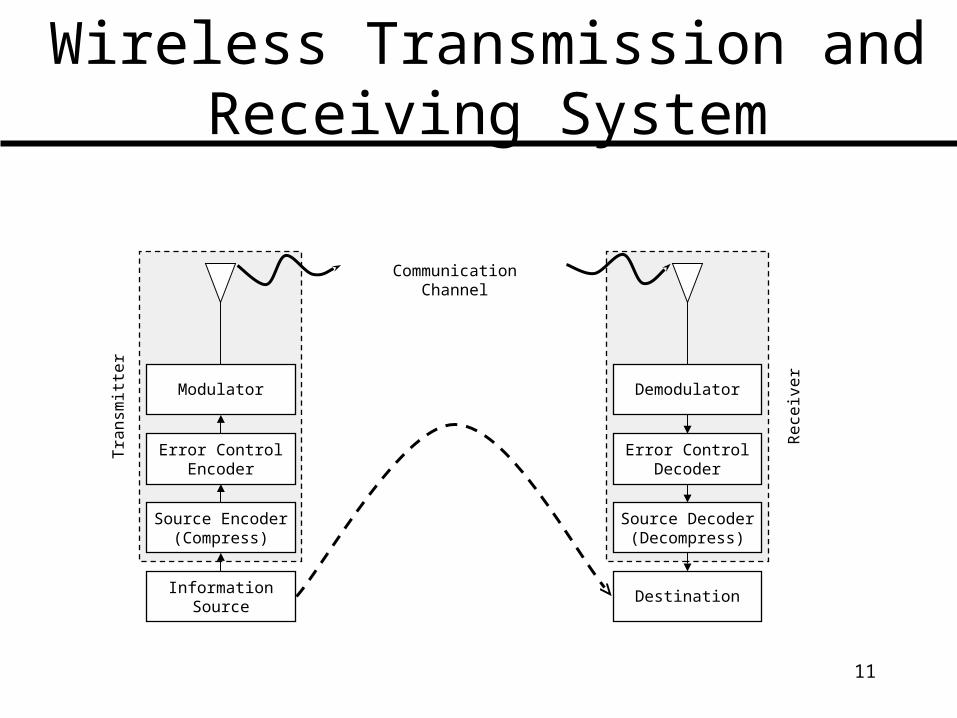
Wireless Transmission and Receiving System
Modulator
Destination
Error Control Encoder
Source Decoder (Decompress)
Source Encoder (Compress)
Error Control Decoder
InformationSource
Demodulator
Tra
nsm
itte
r
Re
ceiv
er
CommunicationChannel
12
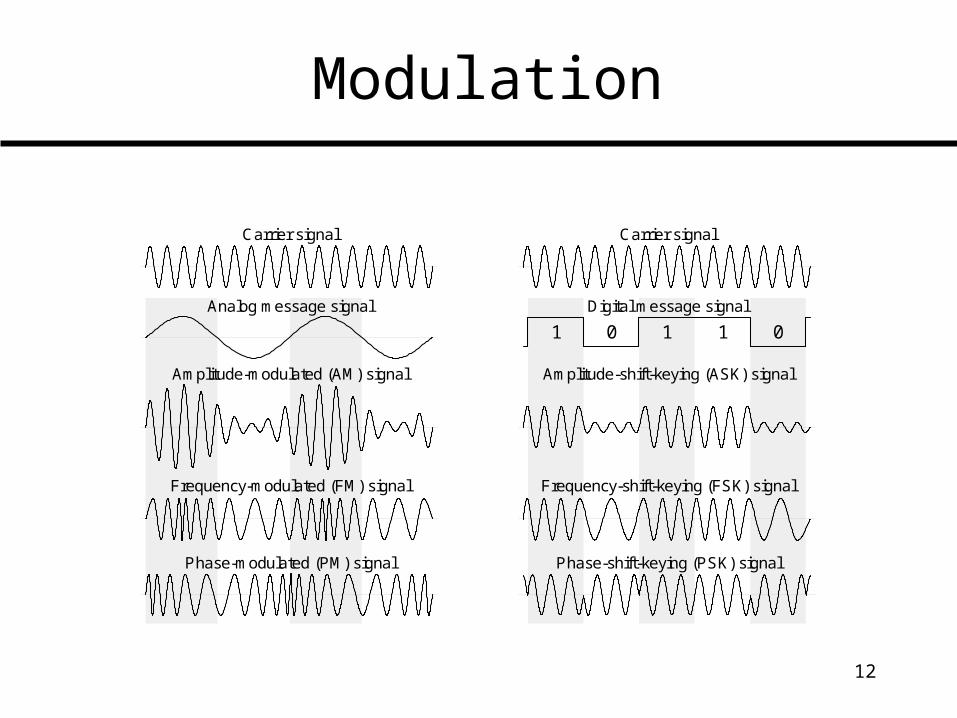
Modulation
Carrier signal
Analog message signal
Amplitude-modulated (AM) signal
Frequency-modulated (FM) signal
Phase-modulated (PM) signal
Carrier signal
Digital message signal
Frequency-shift-keying (FSK) signal
Amplitude-shift-keying (ASK) signal
Phase-shift-keying (PSK) signal
1 0 1 1 0
13
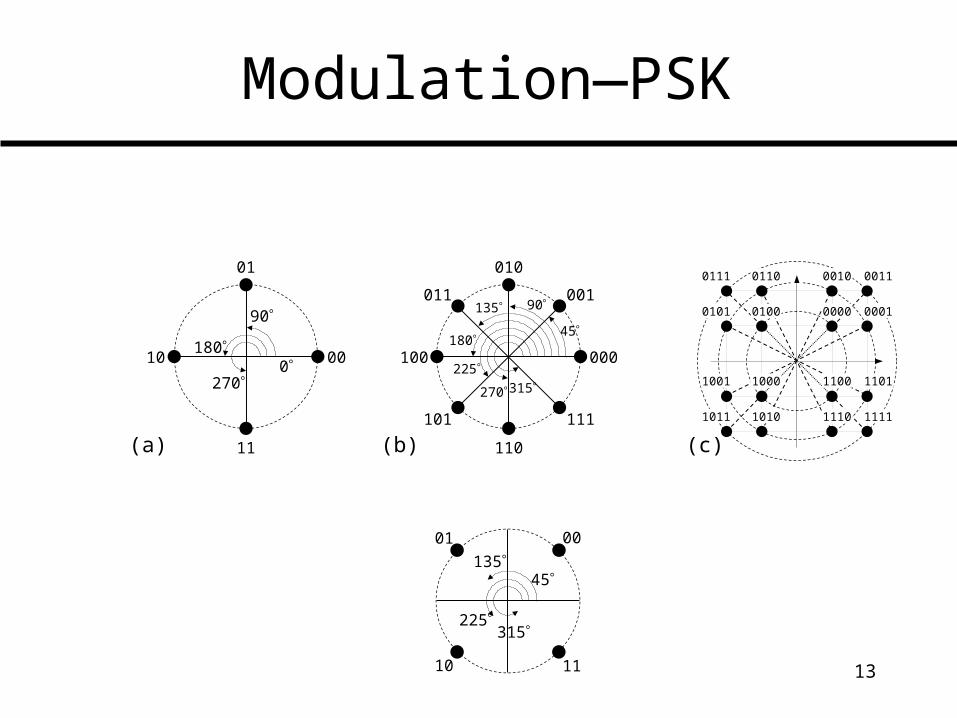
Modulation—PSK
135
225315
45
0001
10 11
90
180
2700 00
01
10
11
270
000
010
100
110
315225
180
135 90
45
111
001011
101
(a) (b) (c)
0000
0010
0100
0110
1000
1010
1100
1110
0001
0011
0101
0111
1001
1011
1101
1111
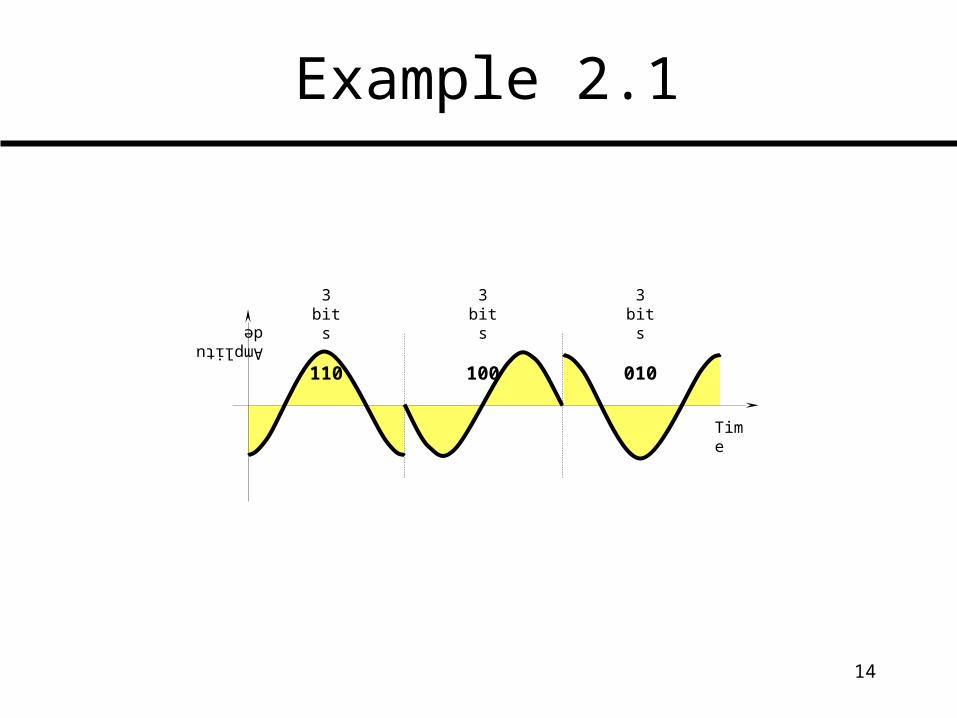
14
Example 2.1
3 bits
110
3 bits
100
3 bits
010Amplitude
Time
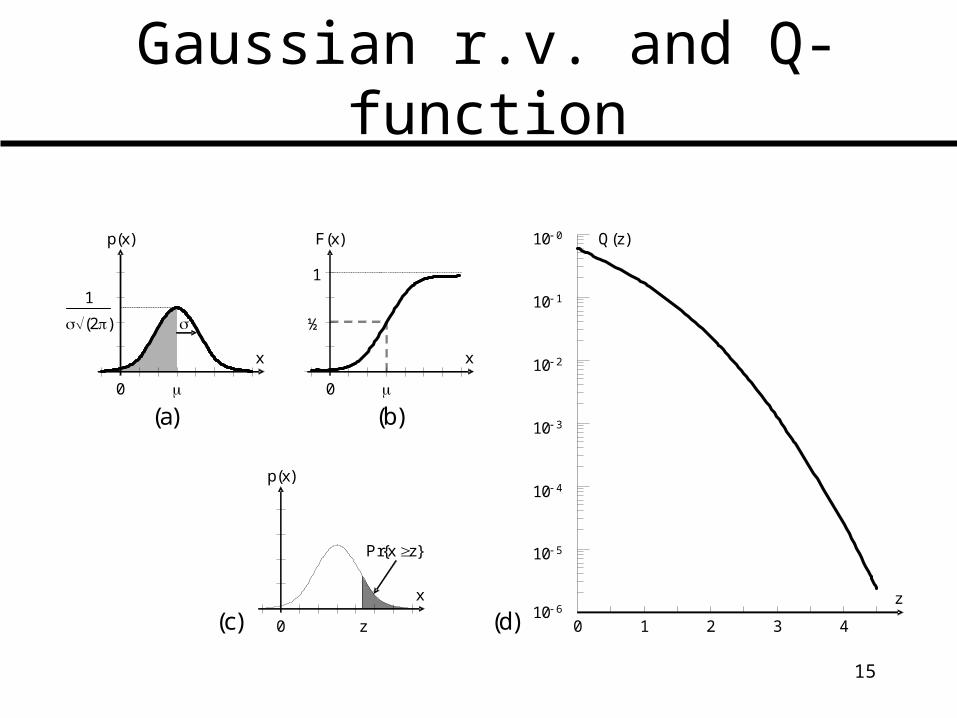
15
Gaussian r.v. and Q-function
x
p(x)
(2)
1
0
x
½
1
F(x)
0
(a) (b)
x
p(x)
0 z
Pr{x z}
(c) (d) 1 2010 6
10 5
10 4
10 3
10 2
10 1
10 0
3 4
z
Q(z)
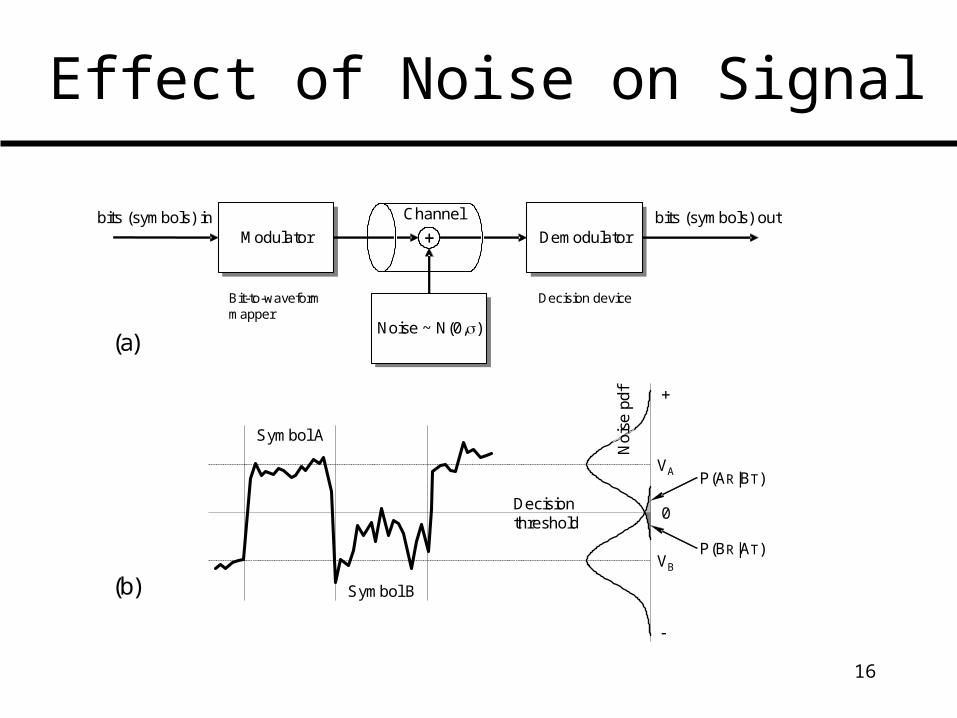
16
Effect of Noise on Signal
Decisionthreshold
0
VA
VB
Symbol A
Symbol B
ModulatorModulator DemodulatorDemodulatorbits (symbols) in bits (symbols) out
Noise ~ N(0,)Noise ~ N(0,)
Bit-to-waveform mapper
Decision device
++
(a)
(b)
Noi
se p
df
P(AR|BT)
P(BR|AT)
Channel
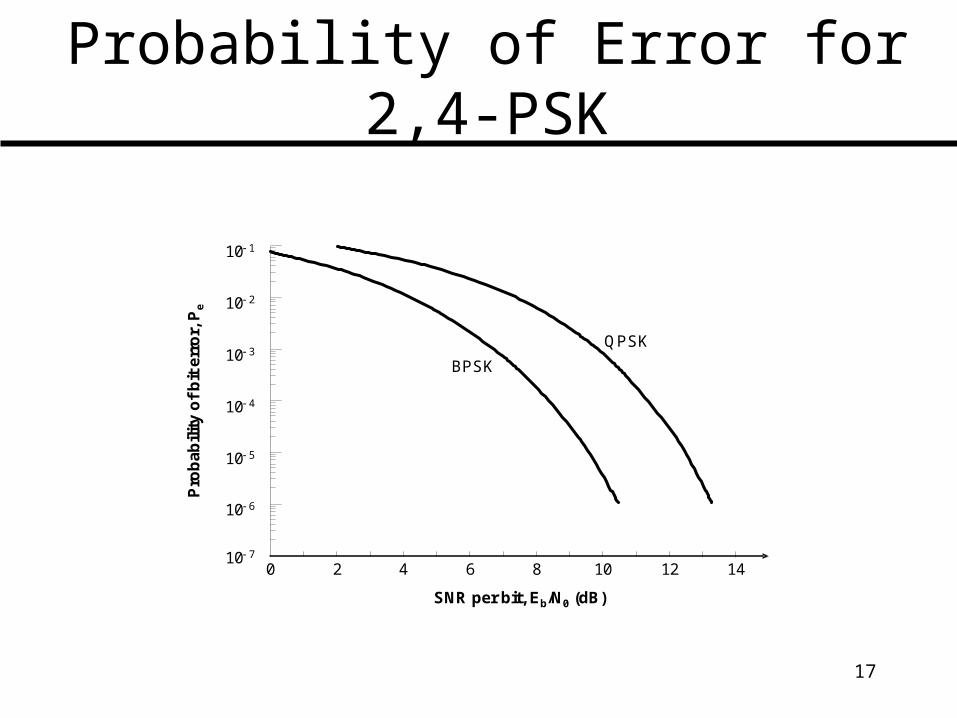
17
Probability of Error for2,4-PSK
2 4010 7
10 6
10 5
10 4
10 3
10 2
10 1
6 8
SNR per bit, Eb/N0 (dB)
Pro
ba
bil
ity
of
bit
err
or,
Pe
10
BPSK
QPSK
12 14
18
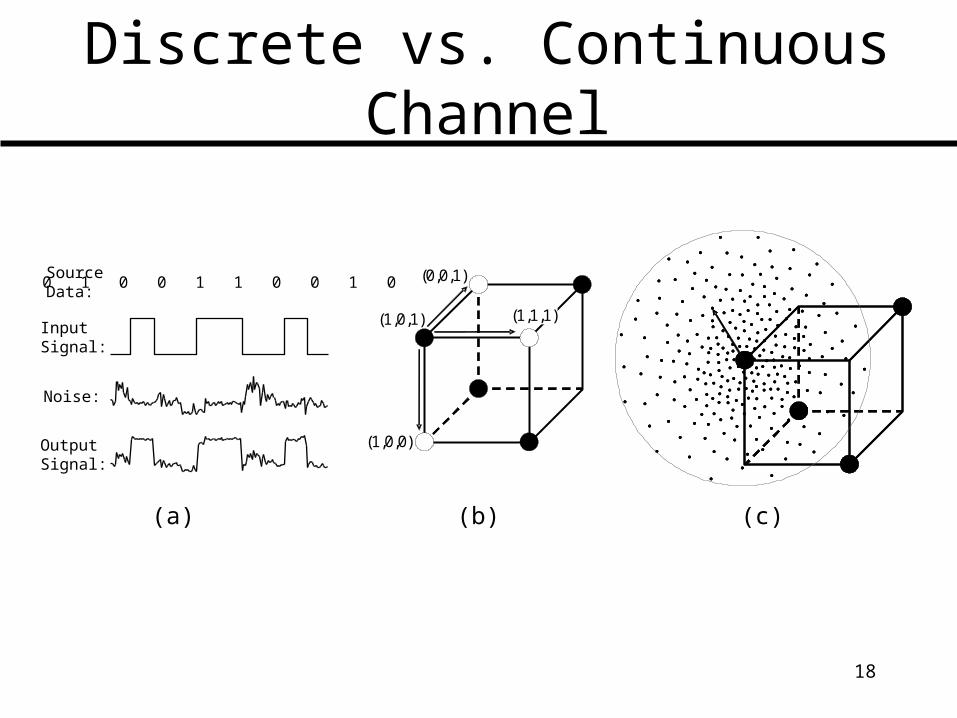
Discrete vs. Continuous Channel
(b) (c)
0 1 0 0 1 1 0 0 1 0
InputSignal:
SourceData:
Noise:
OutputSignal:
(a)
(1,0,1) (1,1,1)
(0,0,1)
(1,0,0)
19
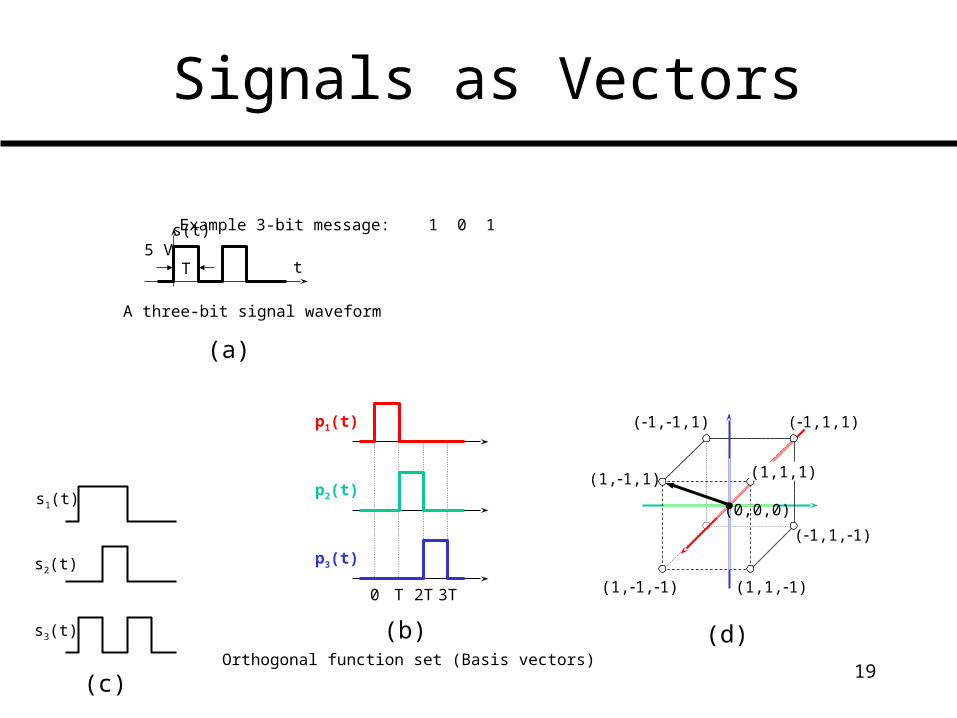
Signals as Vectors
s(t)
t5 V
T
Example 3-bit message: 1 0 1
A three-bit signal waveform
0 T 2T 3T
p1(t)
p2(t)
p3(t)
Orthogonal function set (Basis vectors)
s1(t)
s2(t)
s3(t)
(0,0,0)
(1,1,1) (1,1,1)
(1,1,1)
(1,1,1) (1,1,1)
(1,1,1)
(1,1,1)
(b)
(a)
(c)
(d)
20
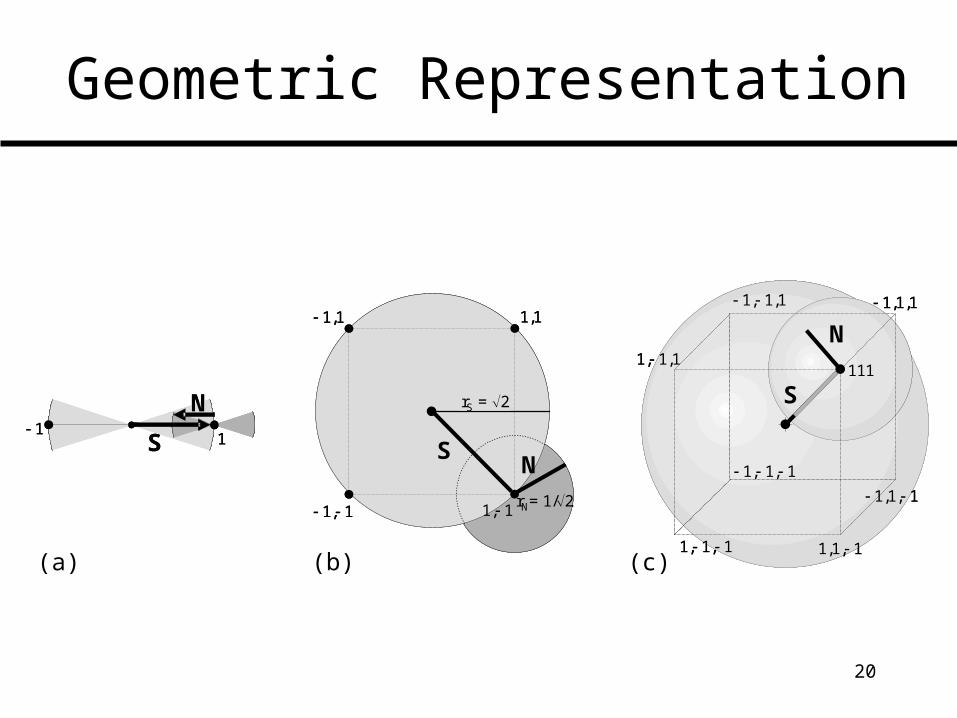
11S
N 1
1S
N rS = 2
1,1 1,1
S
rN= 1/2 1, 1 1, 1
N
rS = 2
1,1 1,1
S
rN= 1/2 1, 1 1, 1
N
1, 1,1
1, 1,1
1, 1, 1
1, 1, 1
1,1, 1
1,1, 1
111
S
N
1,1,1
1, 1,1
1, 1,1
1, 1, 1
1, 1, 1
1,1, 1
1,1, 1
111
S
N
1,1,1
Geometric Representation
(c)(a) (b)
21
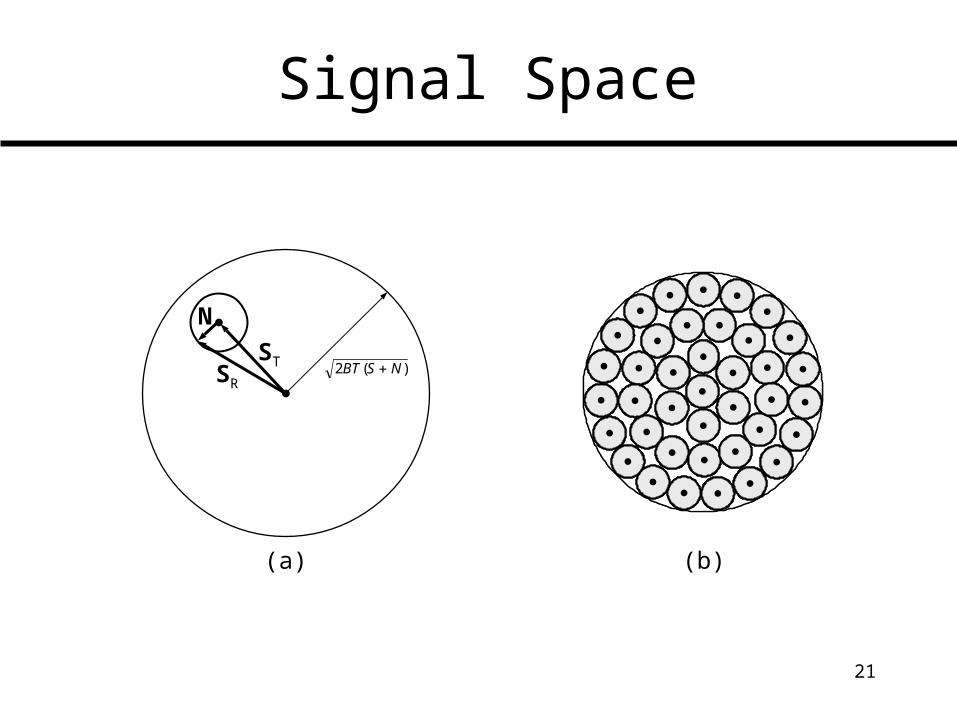
Signal Space
ST
N
SR)(2 NSBT
(b)(a)
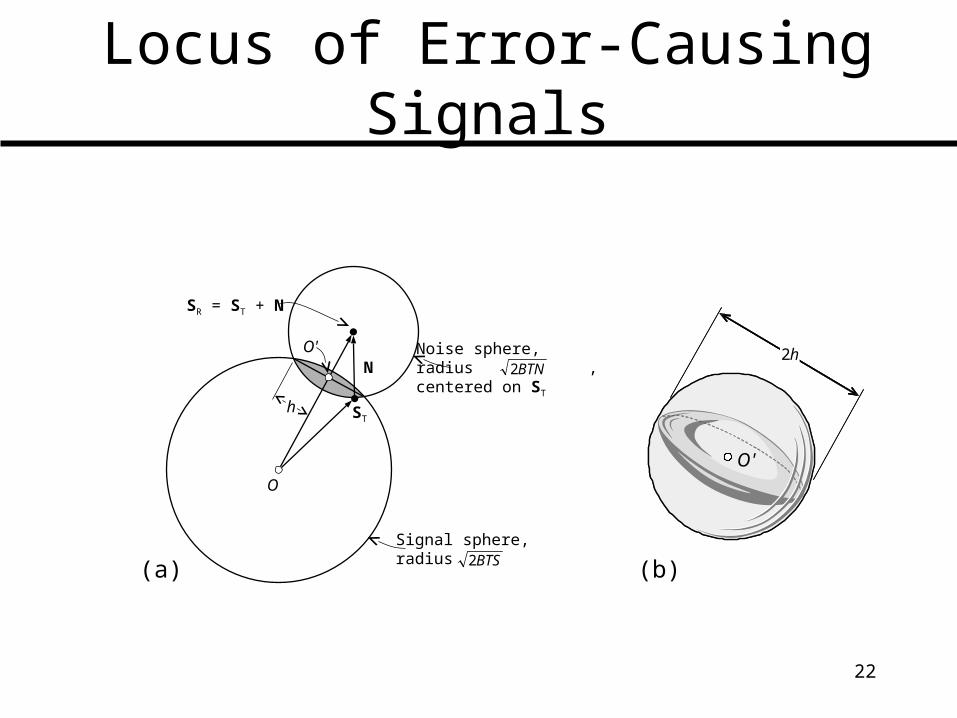
22
Locus of Error-Causing Signals
(b)(a)
h
O'N
ST
Noise sphere,radius ,centered on ST
O
Signal sphere,radius
SR = ST + N
BTS2
BTN22h
O'
2h
O'
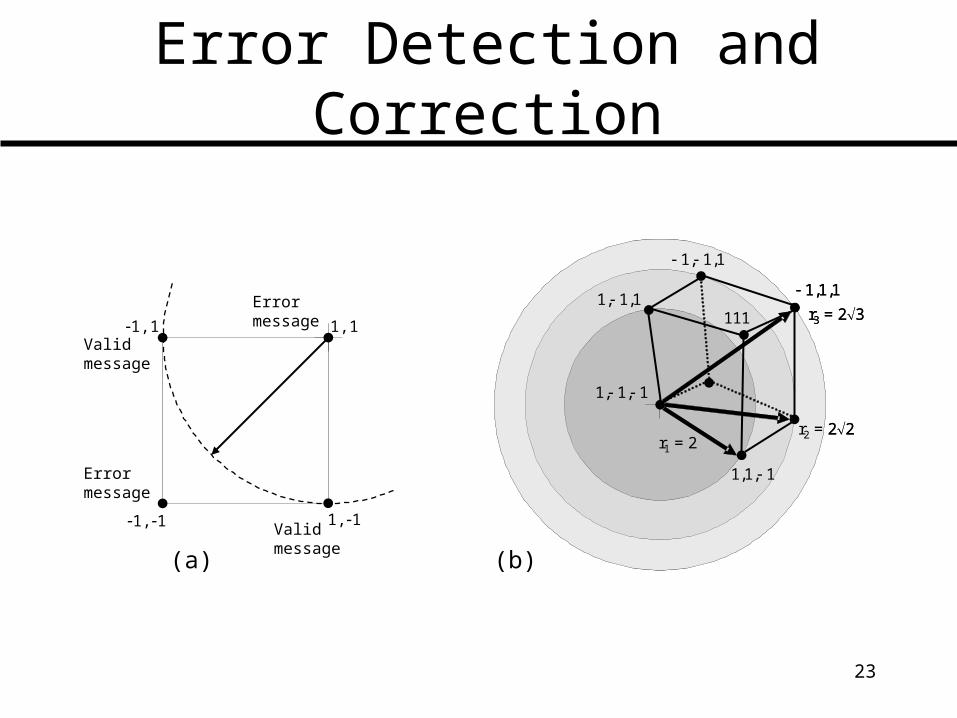
23
Error Detection and Correction
(a) (b)
1,1 1,1
1,1 1,1Validmessage
Validmessage
Errormessage
Errormessage
r2 = 22r1 = 2
r3 = 23
1, 1, 1
1,1,11, 1,1
1, 1,1
1,1, 1
111
r2 = 22r1 = 2
r3 = 23
1, 1, 1
1,1,11, 1,1
1, 1,1
1,1, 1
111
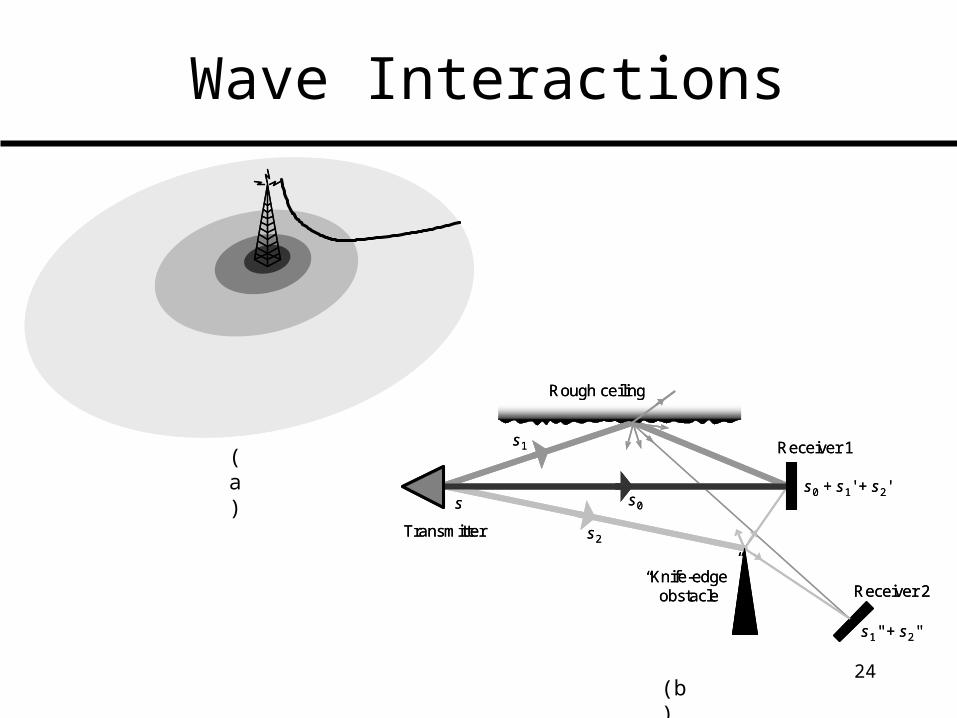
24
Wave Interactions
(a)
(b)
Rough ceiling
Transmitter
“Knife-edge”obstacle
Receiver 1
s
s1
s0 + s1' + s2'
Receiver 2
s1'' + s2''
s0
s2
Rough ceiling
Transmitter
“Knife-edge”obstacle
Receiver 1
s
s1
s0 + s1' + s2'
Receiver 2
s1'' + s2''
s0
s2
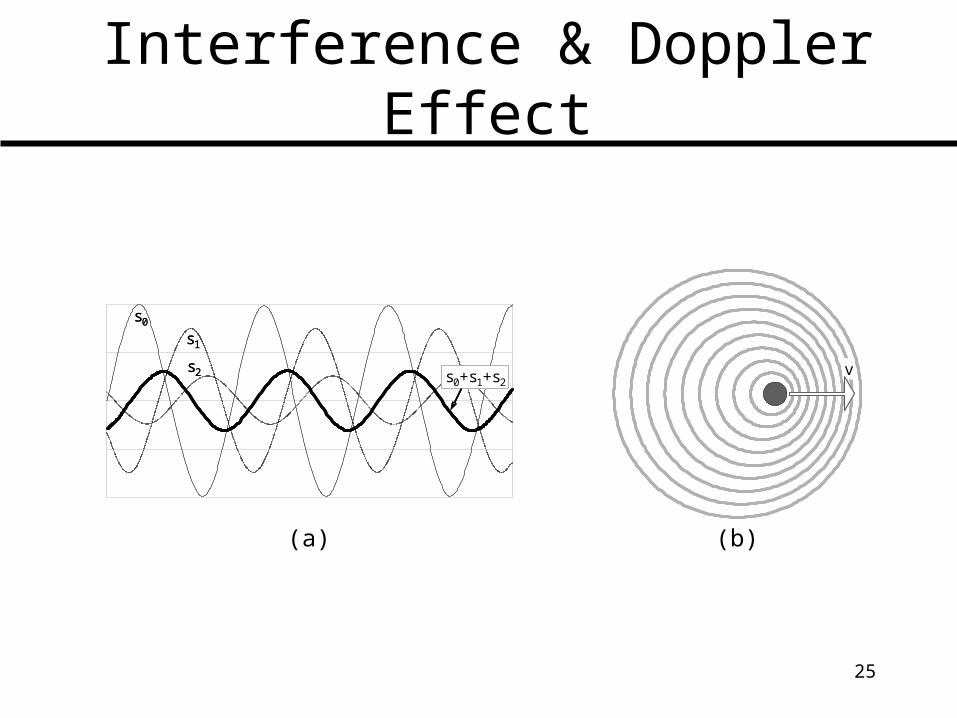
25
Interference & Doppler Effect
(a) (b)
s0
s1
s2 s0+s1+s2
s0
s1
s2 s0+s1+s2vv
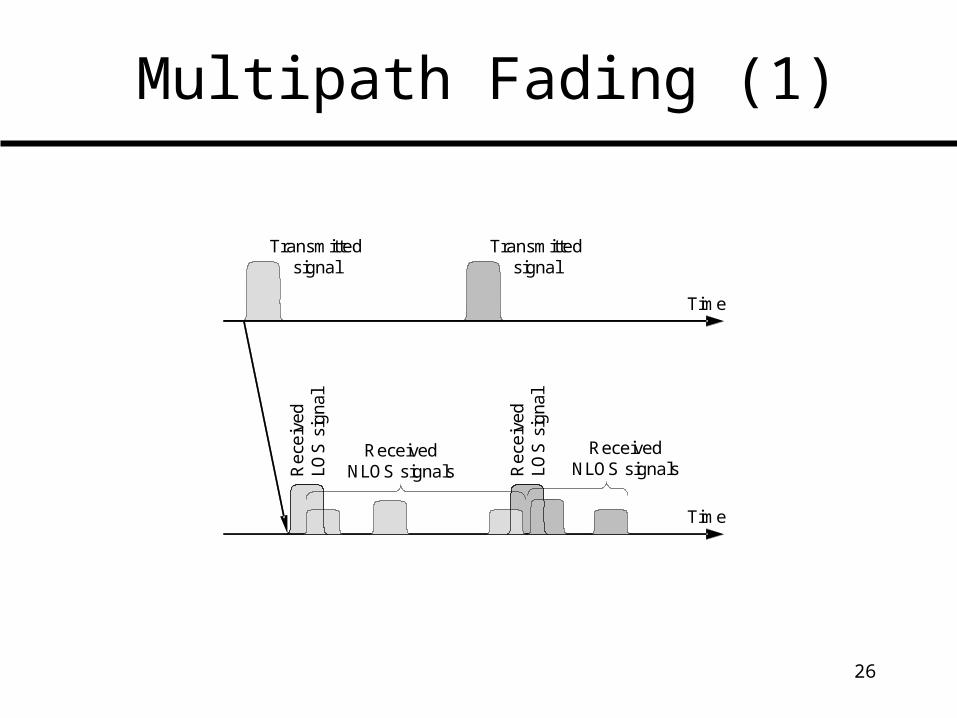
26
Multipath Fading (1)
Transmittedsignal
Transmittedsignal
Rec
eiv
edLO
S s
igna
l
Rec
eiv
edLO
S s
igna
l
ReceivedNLOS signals
ReceivedNLOS signals
Time
Time
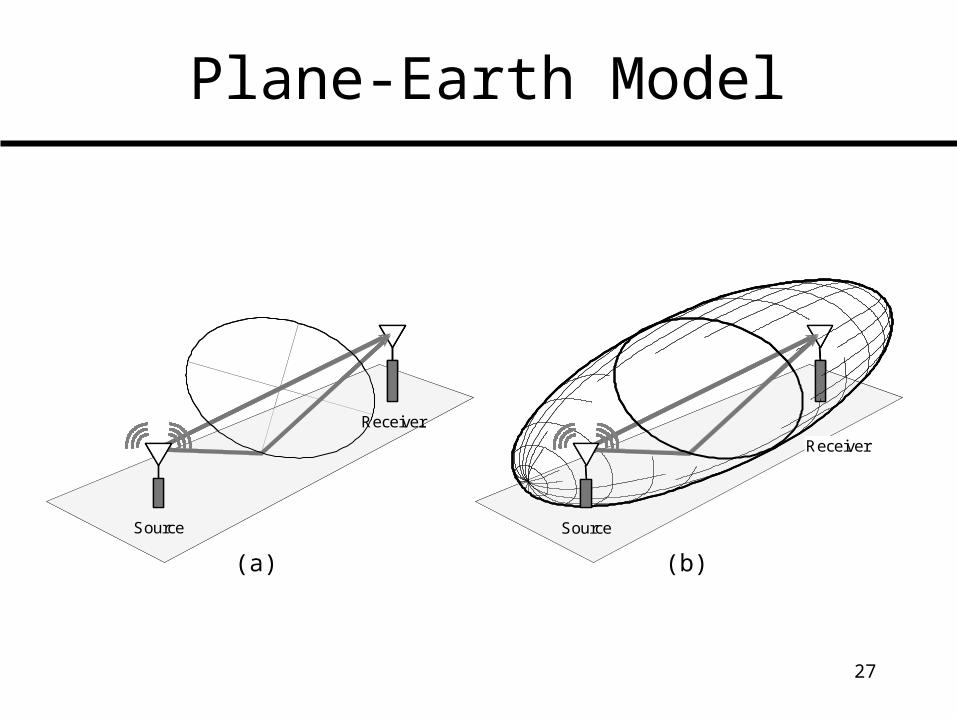
27
(b)(a)
Plane-Earth Model
Receiver
Source
Receiver
Source
Receiver
Source
Receiver
Source
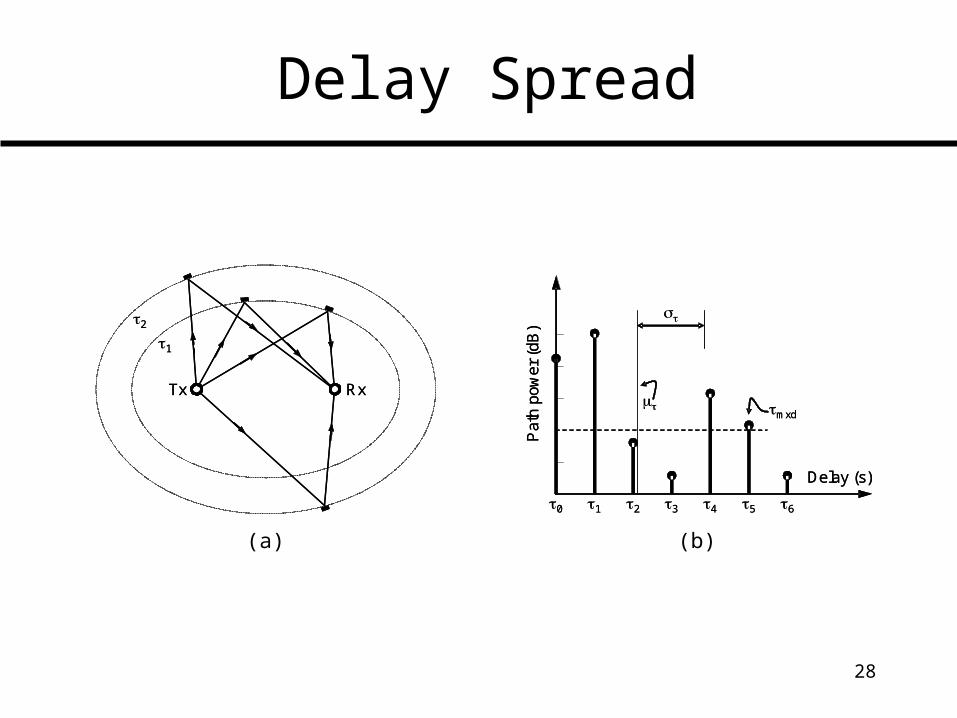
28
Delay Spread
(a) (b)
Tx Rx
2
1
Tx Rx
2
1
Delay (s)
Pat
h po
wer
(dB
)
0 1 2 3 4 5 6
mxd
Delay (s)
Pat
h po
wer
(dB
)
0 1 2 3 4 5 6
mxd
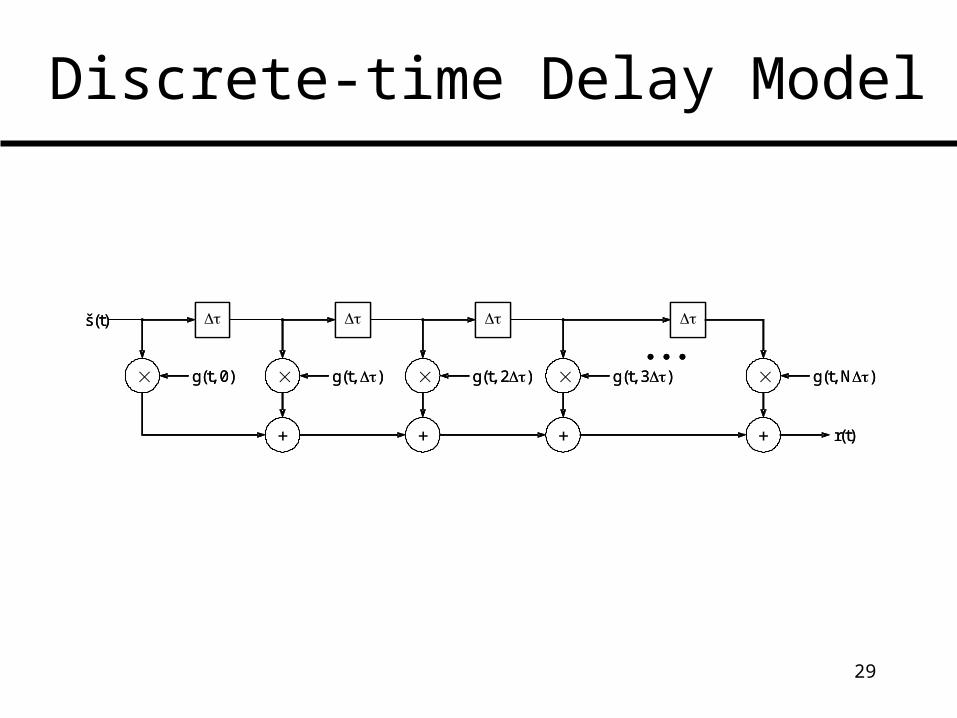
29
Discrete-time Delay Model
g(t, 0) g(t, ) g(t, 2) g(t, 3) g(t, N)
r(t)
š(t)
g(t, 0) g(t, ) g(t, 2) g(t, 3) g(t, N)
r(t)
š(t)
30
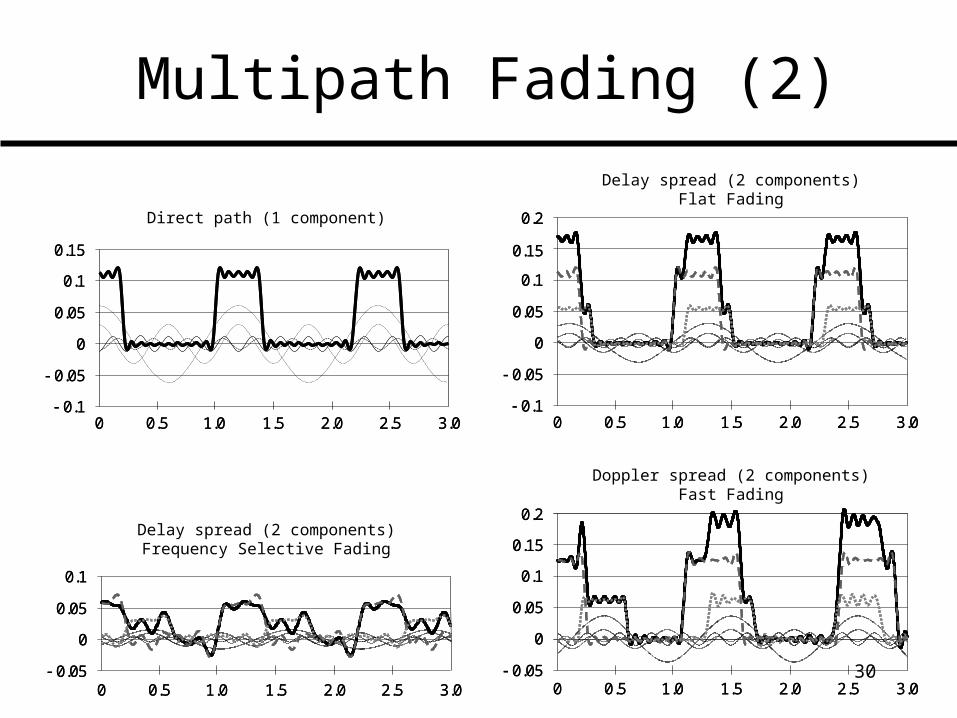
Multipath Fading (2)
Direct path (1 component)
Delay spread (2 components)Flat Fading
Delay spread (2 components)Frequency Selective Fading
Doppler spread (2 components)Fast Fading
0
0.05
0.05
0.1
0.1
0.5 1.0 1.5 2.0 2.5 3.00
0.15
0
0.05
0.05
0.1
0.1
0.5 1.0 1.5 2.0 2.5 3.00
0.15
0
0.05
0.05
0.1
0.1
0.15
3.00 0.5 1.0 1.5 2.0 2.5
0.2
0
0.05
0.05
0.1
0.1
0.15
3.00 0.5 1.0 1.5 2.0 2.5
0.2
0.5 1.0 1.5 2.0 2.5 3.00
0
0.05
0.05
0.1
0.5 1.0 1.5 2.0 2.5 3.00
0
0.05
0.05
0.1
0.05
0.05
0.2
0.5 1.0 1.5 2.0 2.5
0.15
3.00
0
0.1
0.05
0.05
0.2
0.5 1.0 1.5 2.0 2.5
0.15
3.00
0
0.1
31
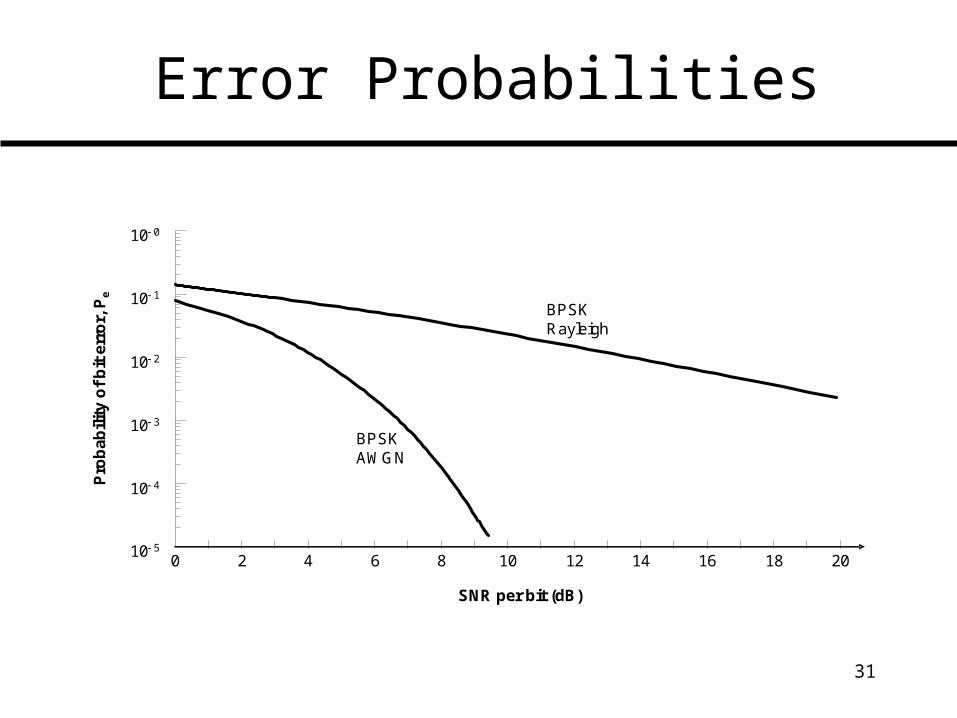
Error Probabilities
2 40 6 8
SNR per bit (dB)
Pro
ba
bil
ity
of
bit
err
or,
Pe
10
BPSKAWGN
12 1410 5
10 4
10 3
10 2
10 1
10 0
BPSKRayleigh
16 18 20
32
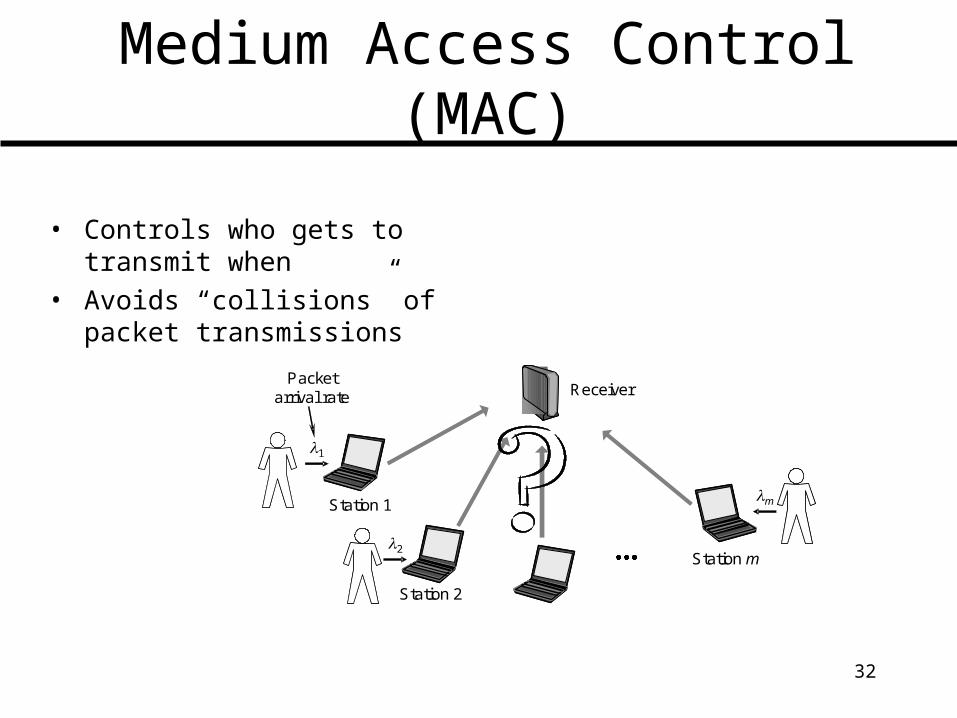
Medium Access Control (MAC)
• Controls who gets to transmit when• Avoids “collisions” of packet
transmissions
Station 1
Station m
1
2
Station 2
m
Packetarrival rate Receiver
33
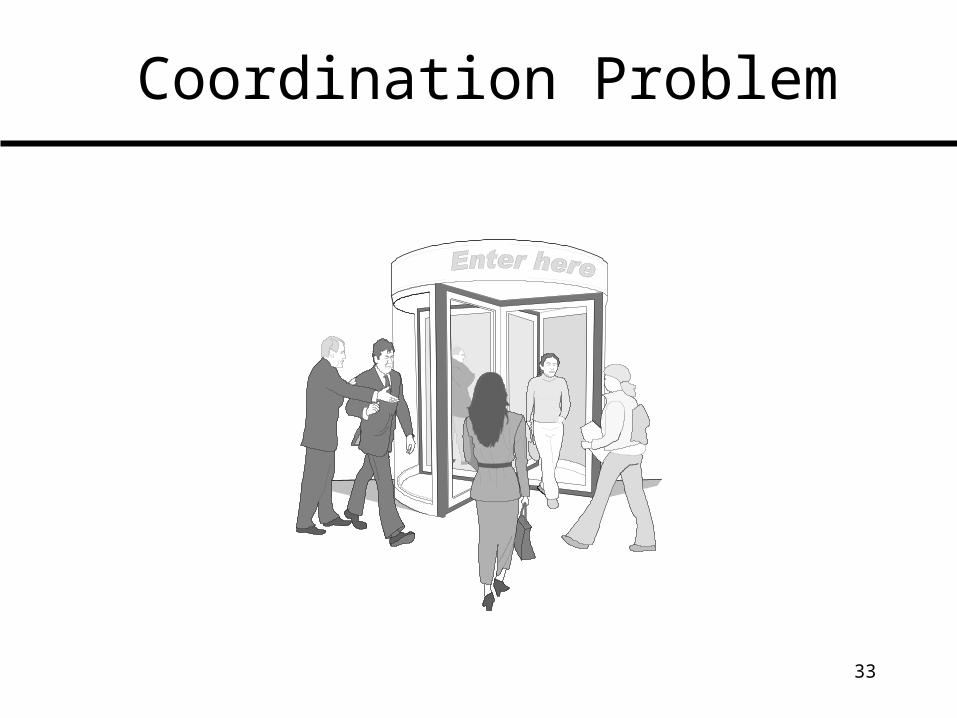
Coordination Problem
34
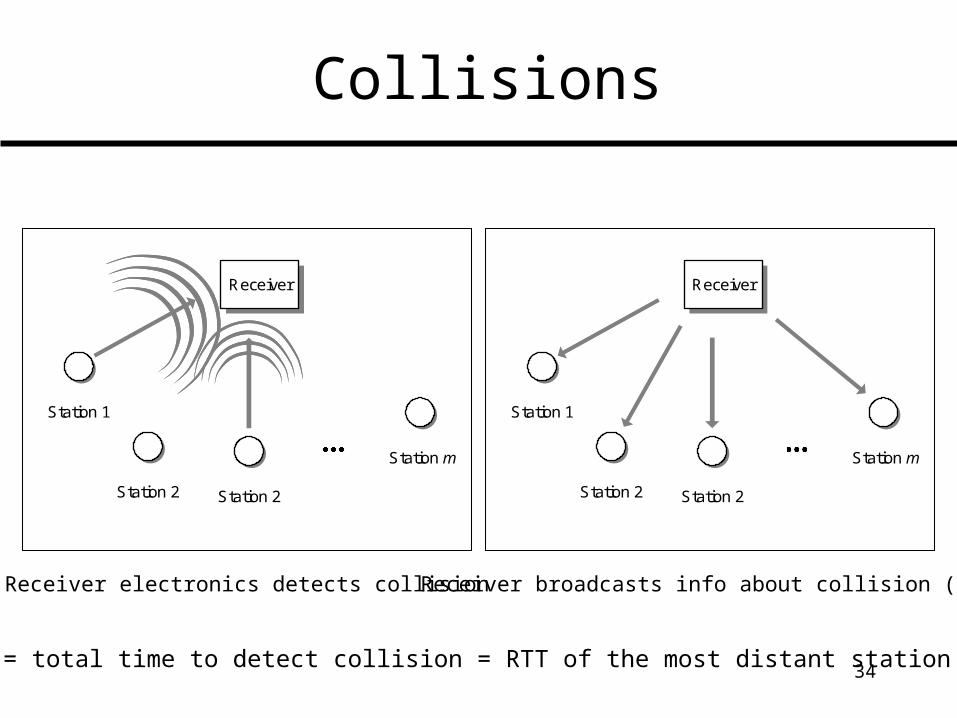
Collisions
Receiver electronics detects collision Receiver broadcasts info about collision (jam)
= total time to detect collision = RTT of the most distant station
ReceiverReceiver
Station 1
Station m
Station 2 Station 2
ReceiverReceiver
Station 1
Station m
Station 2 Station 2
35
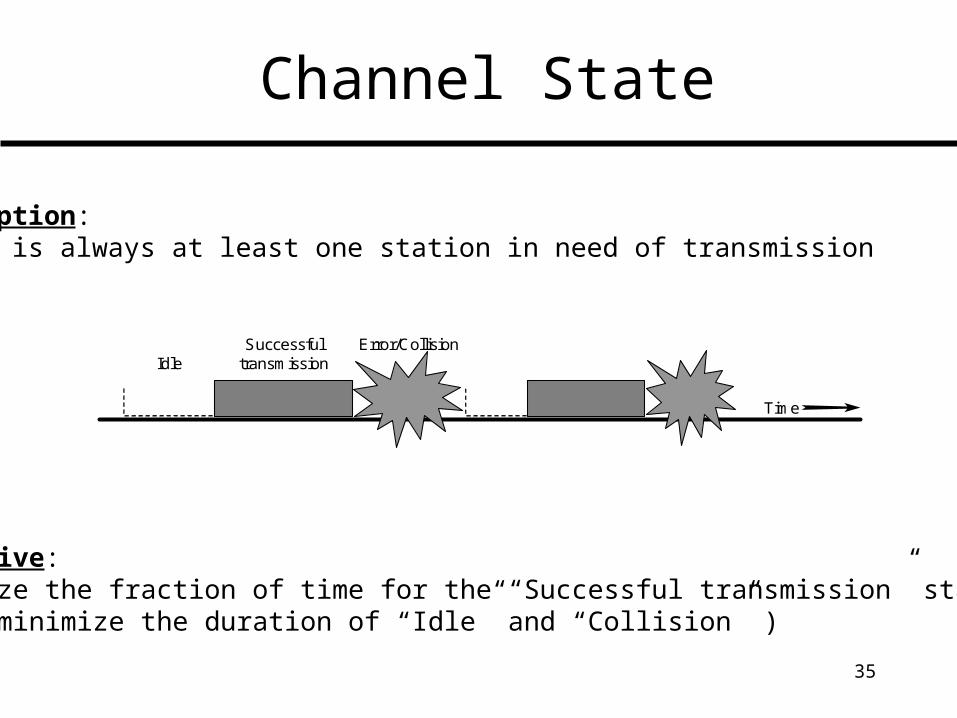
Channel State
Assumption:There is always at least one station in need of transmission
Objective:Maximize the fraction of time for the “Successful transmission” state( or: minimize the duration of “Idle” and “Collision” )
Time
SuccessfultransmissionIdle
Error/Collision
36
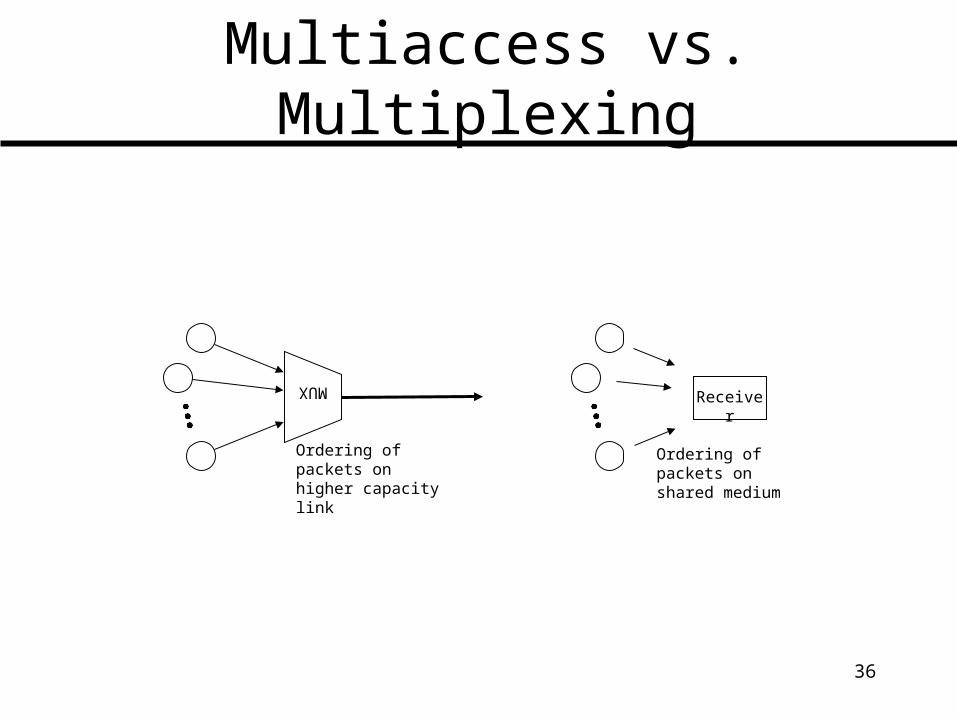
Multiaccess vs. Multiplexing
MUX
Ordering of packets on higher capacity link
Receiver
Ordering of packets on shared medium
37
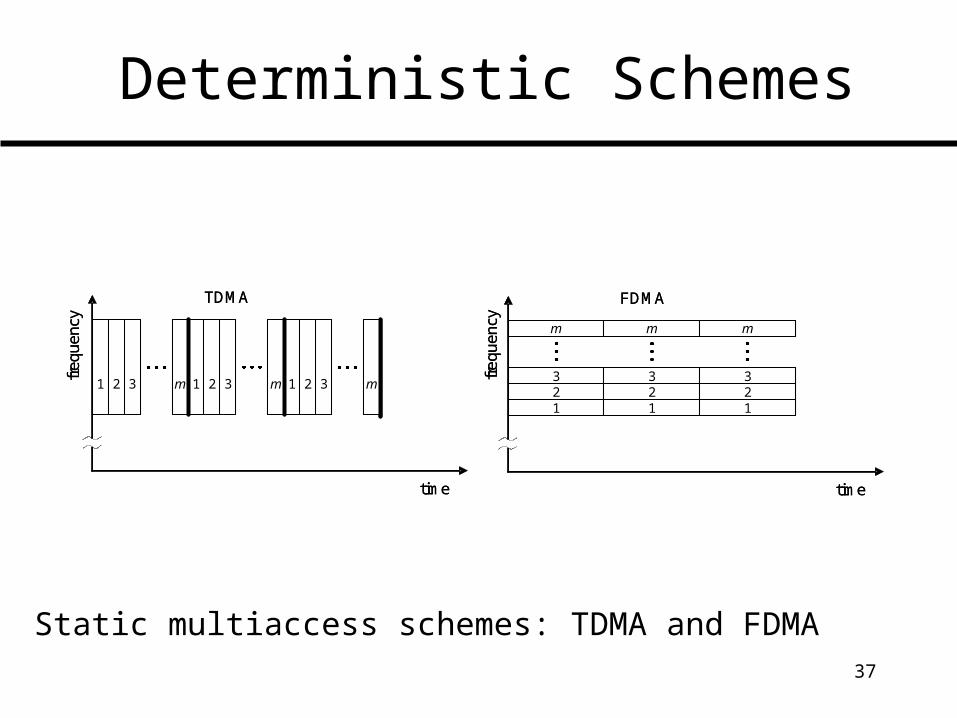
Static multiaccess schemes: TDMA and FDMA
Deterministic Schemes
m1 3
time
2 m1 32 m1 32
TDMA
freq
uenc
y
m1 3
time
2 m1 32 m1 32
TDMA
freq
uenc
y
m
321
time
m
321
m
321
FDMA
freq
uenc
y
m
321
time
m
321
m
321
FDMA
freq
uenc
y
38
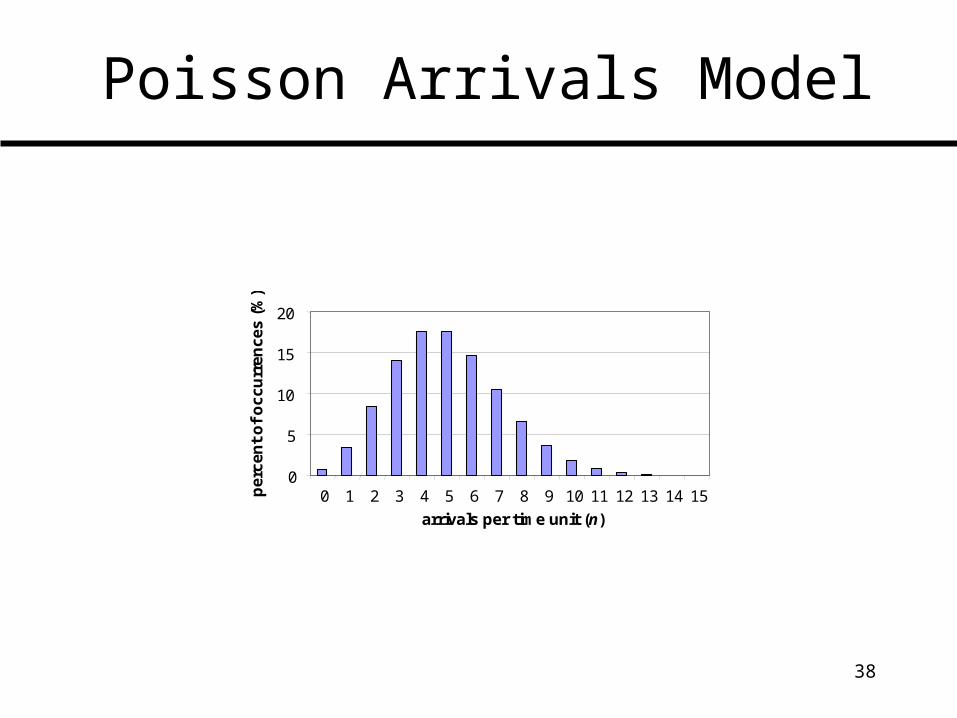
Poisson Arrivals Model
0
5
10
15
20
0 1 2 3 4 5 6 7 8 9 10 11 12 13 14 15
arrivals per time unit (n)
per
cen
t o
f o
ccu
rren
ces
(%)
39
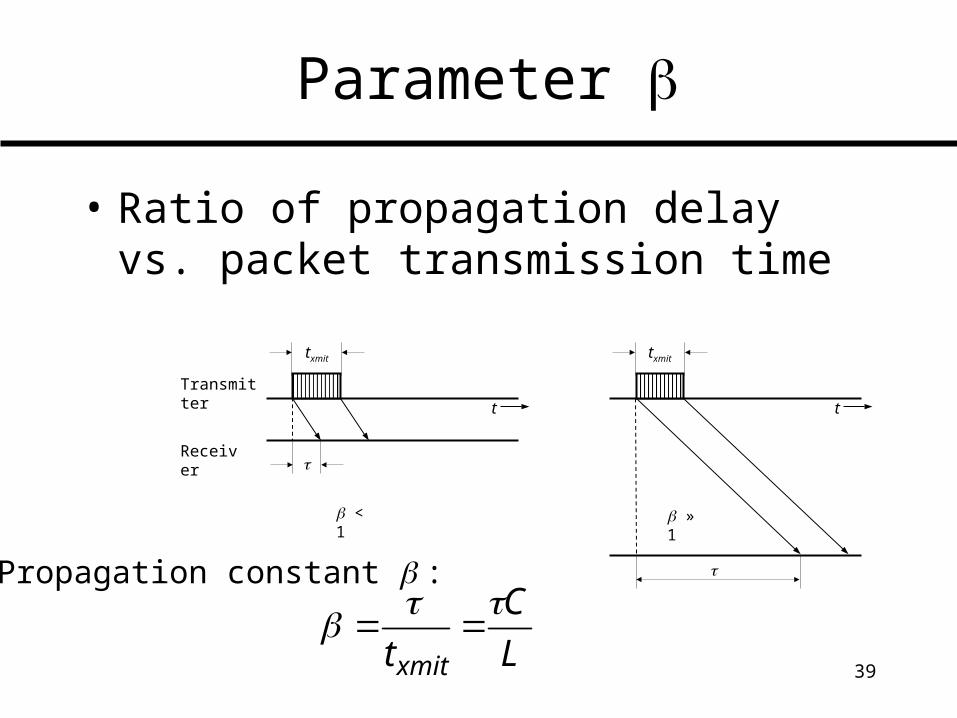
Parameter
t
txmit
Transmitter
Receiver
< 1
t
txmit
» 1
L
C
txmit
Propagation constant :
• Ratio of propagation delay vs. packet transmission time
40
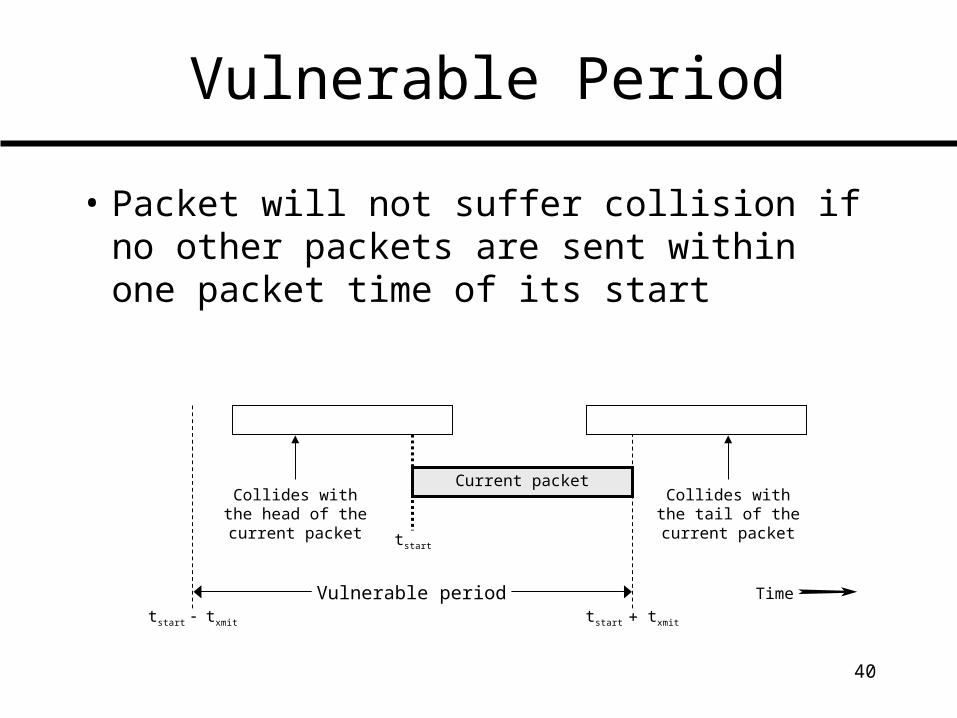
Vulnerable Period
• Packet will not suffer collision if no other packets are sent within one packet time of its start
tstart
tstart txmit
Vulnerable periodtstart txmit
Current packetCollides with
the head of thecurrent packet
Collides withthe tail of the
current packet
Time
41
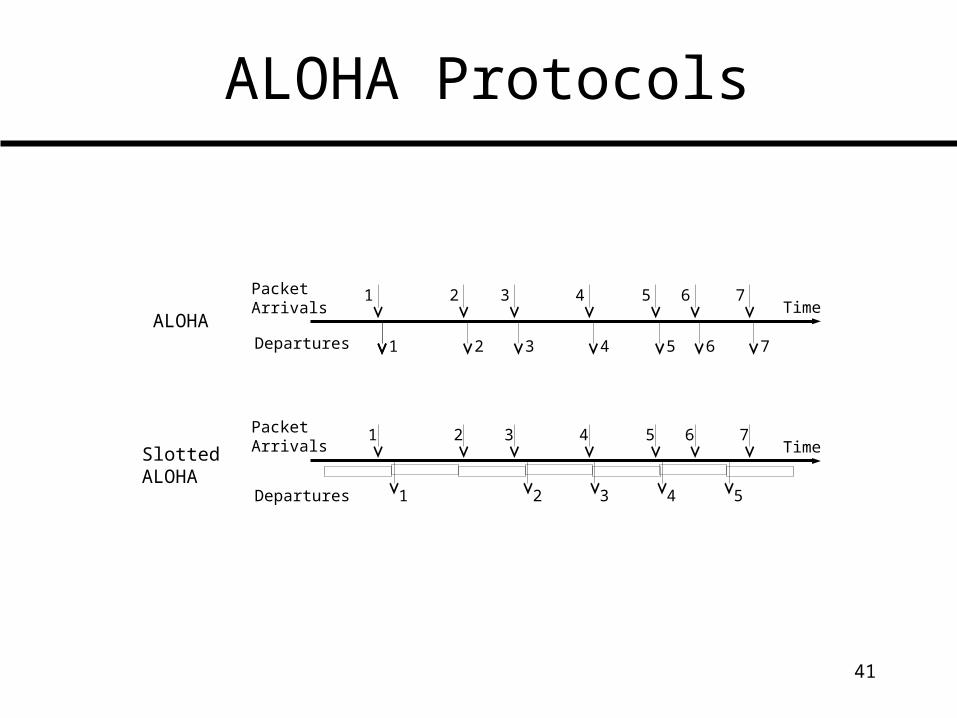
ALOHA Protocols
TimePacketArrivals
Departures
1 2 3 4 5 6 7
1 2 3 4 5 6 7
Time
Departures
1 2 3 4 5 6 7
1 2 3 4 5
ALOHA
SlottedALOHA
PacketArrivals
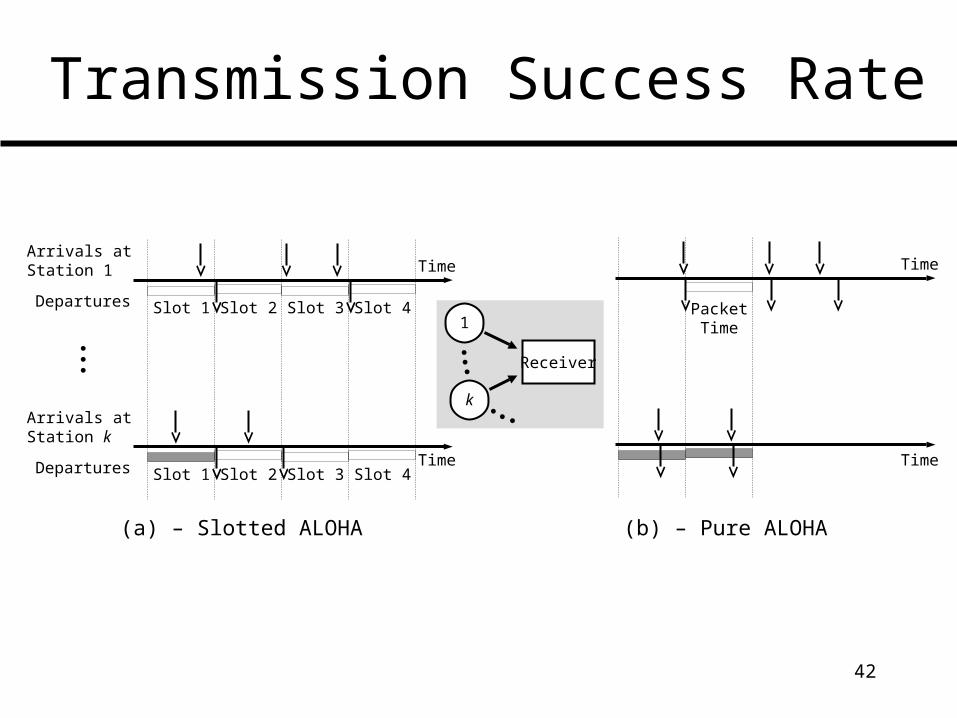
42
Transmission Success Rate
Time
Departures Slot 1
Arrivals atStation 1
Slot 2 Slot 3 Slot 4
Departures Slot 1
Arrivals atStation k
Slot 2 Slot 3 Slot 4
Time
Time
(a) – Slotted ALOHA (b) – Pure ALOHA
PacketTime
Time
Receiver
1
k
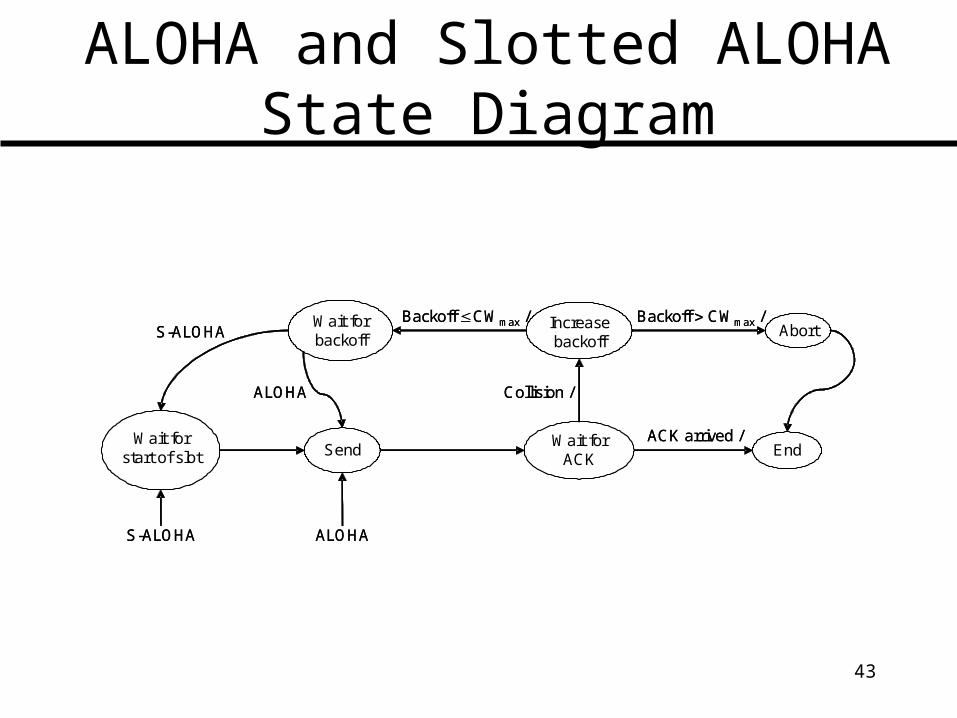
43
ALOHA and Slotted ALOHA State Diagram
SendWait for
start of slot
ALOHA
Abort
ACK arrived /
Collision /
End
Backoff CWmax /Backoff CWmax /
S-ALOHA
Wait for backoffS-ALOHA
Wait for ACK
Increase backoff
ALOHA
SendWait for
start of slot
ALOHA
Abort
ACK arrived /
Collision /
End
Backoff CWmax /Backoff CWmax /
S-ALOHA
Wait for backoffS-ALOHA
Wait for ACK
Increase backoff
ALOHA
44
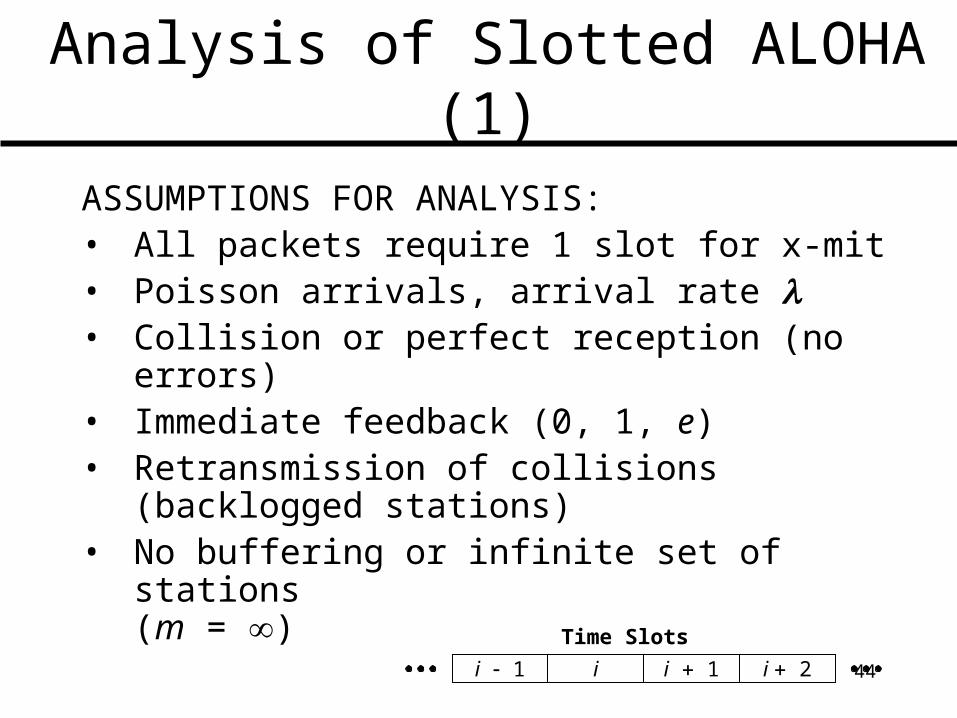
Analysis of Slotted ALOHA (1)
ASSUMPTIONS FOR ANALYSIS:• All packets require 1 slot for x-mit• Poisson arrivals, arrival rate • Collision or perfect reception (no errors)• Immediate feedback (0, 1, e)• Retransmission of collisions
(backlogged stations)• No buffering or infinite set of stations
(m = )i 1 i i 1 i 2
Time Slots
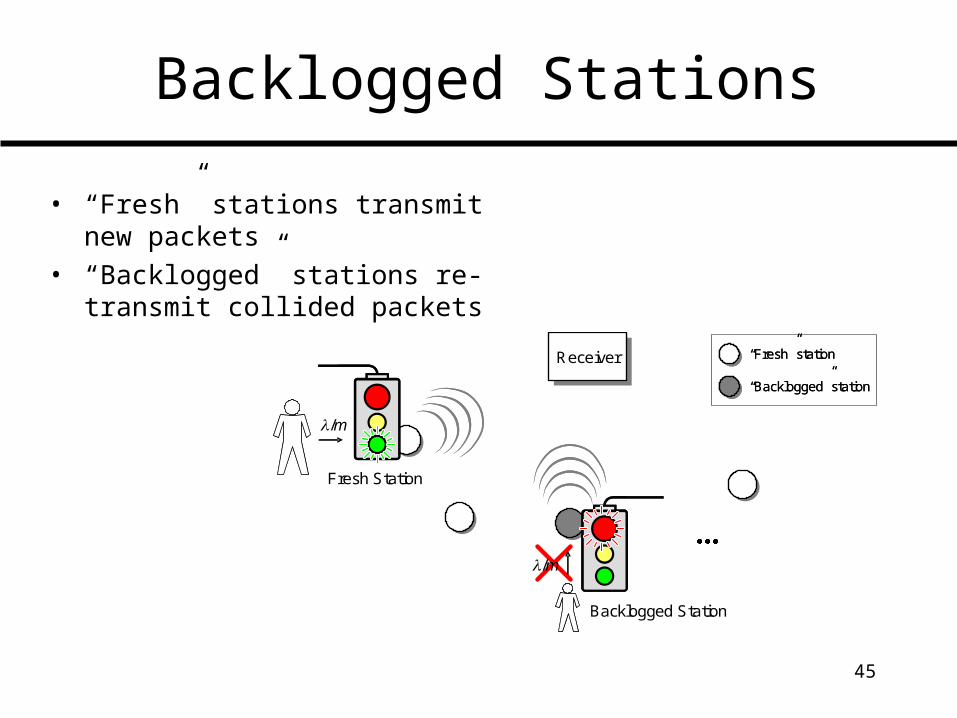
45
Backlogged Stations
• “Fresh” stations transmit new packets
• “Backlogged” stations re-transmit collided packets
ReceiverReceiver
Fresh Station
Backlogged Station
/m
/m
“Fresh” station
“Backlogged” station
“Fresh” station
“Backlogged” station
46
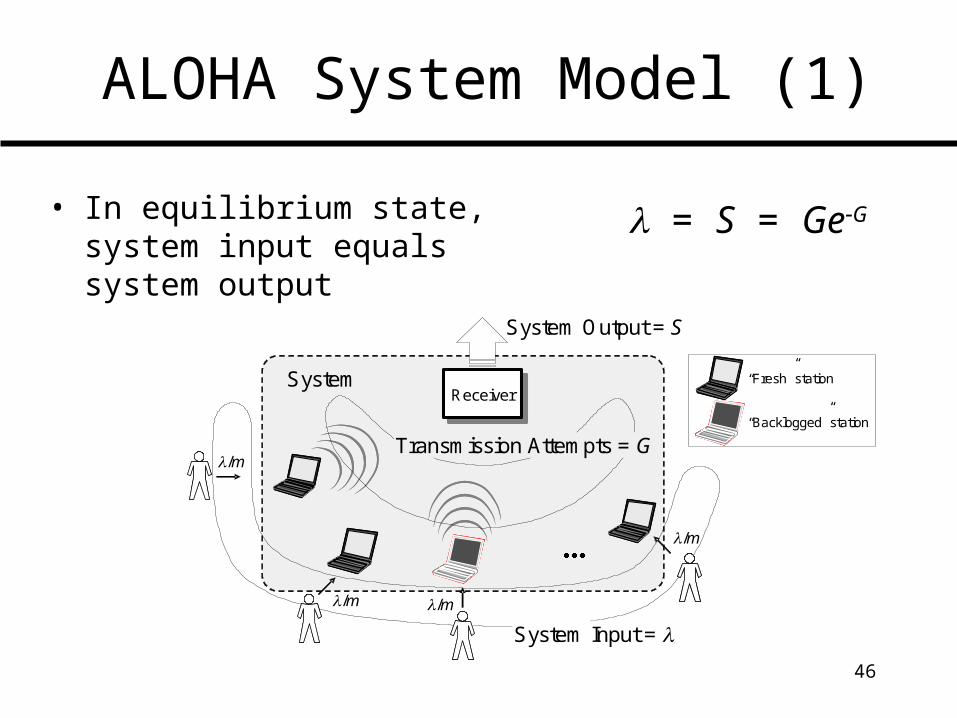
ALOHA System Model (1)
• In equilibrium state, system input equals system output
= S = GeG
SystemReceiverReceiver
/m
/m/m
/m
System Input =
System Output = S
Transmission Attempts = G
“Fresh” station
“Backlogged” station
47
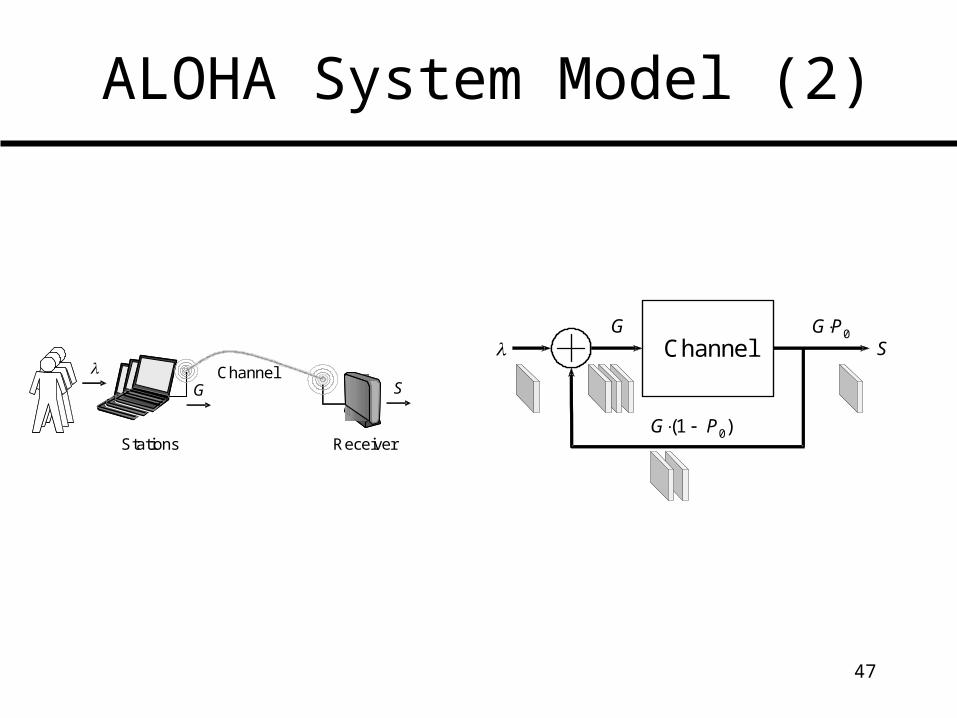
ALOHA System Model (2)
Channel
Stations Receiver
G S
ChannelG
SGP0
G(1 P0)
48
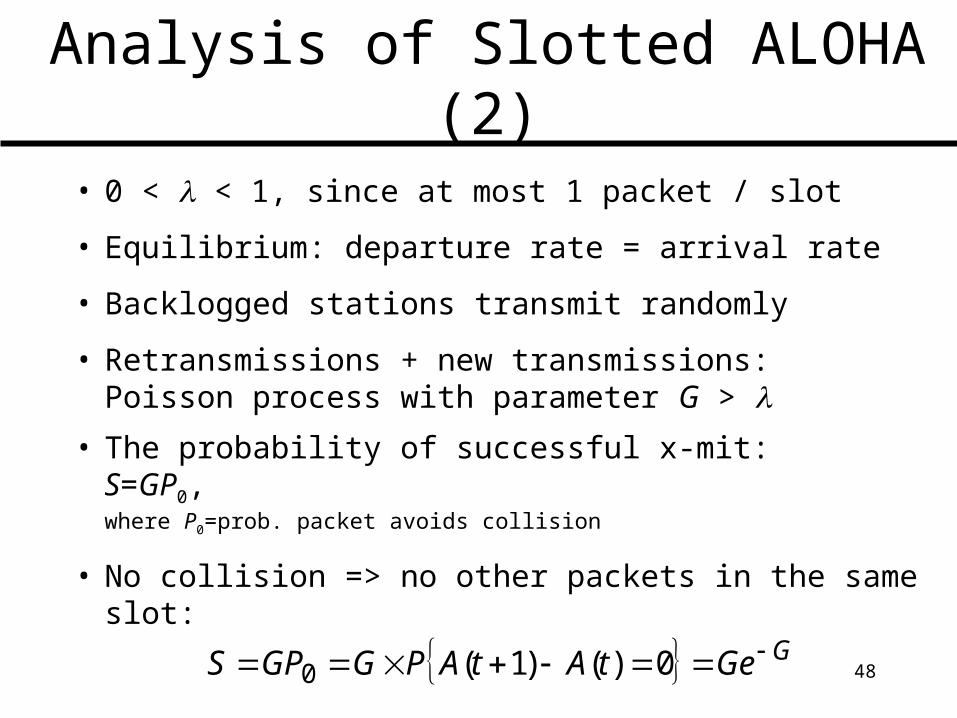
Analysis of Slotted ALOHA (2)
• 0 < < 1, since at most 1 packet / slot
• Equilibrium: departure rate = arrival rate
• Backlogged stations transmit randomly
• Retransmissions + new transmissions:Poisson process with parameter G >
• The probability of successful x-mit: S=GP0,where P0=prob. packet avoids collision
• No collision => no other packets in the same slot: GGetAtAPGGPS 0)()1(0
49
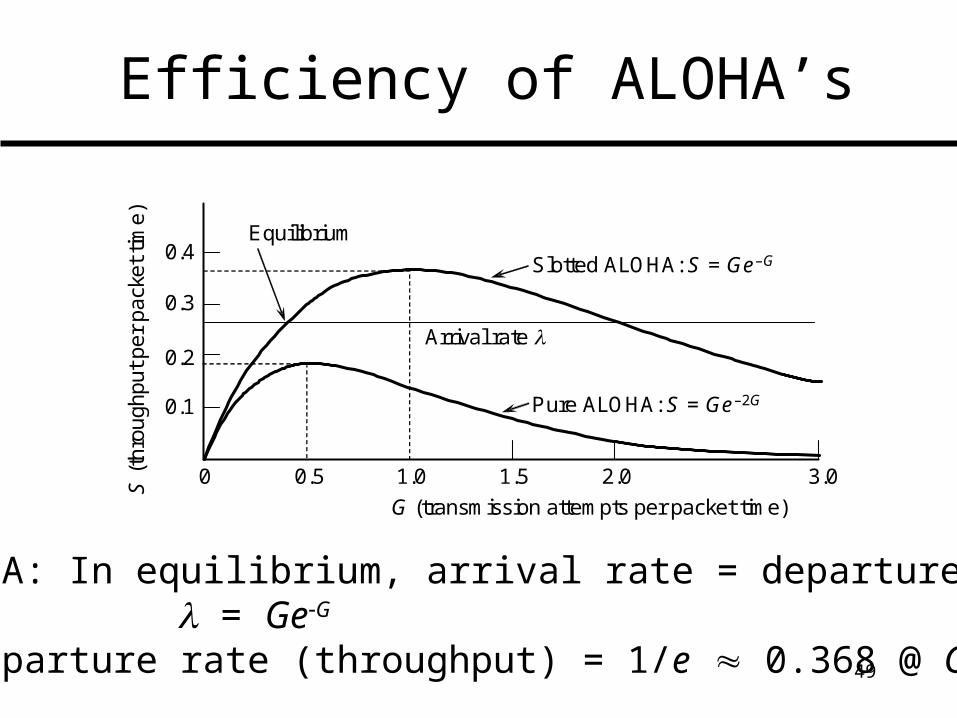
Efficiency of ALOHA’s
S-ALOHA: In equilibrium, arrival rate = departure rate: = GeG
Max departure rate (throughput) = 1/e 0.368 @ G = 1
0 0.5 1.0 1.5 2.0 3.0
0.1
0.2
0.3
0.4Slotted ALOHA: S = Ge–G
Pure ALOHA: S = Ge–2G
G (transmission attempts per packet time)
Arrival rate
Equilibrium
S(t
hrou
ghpu
t p
er p
acke
t tim
e)
50
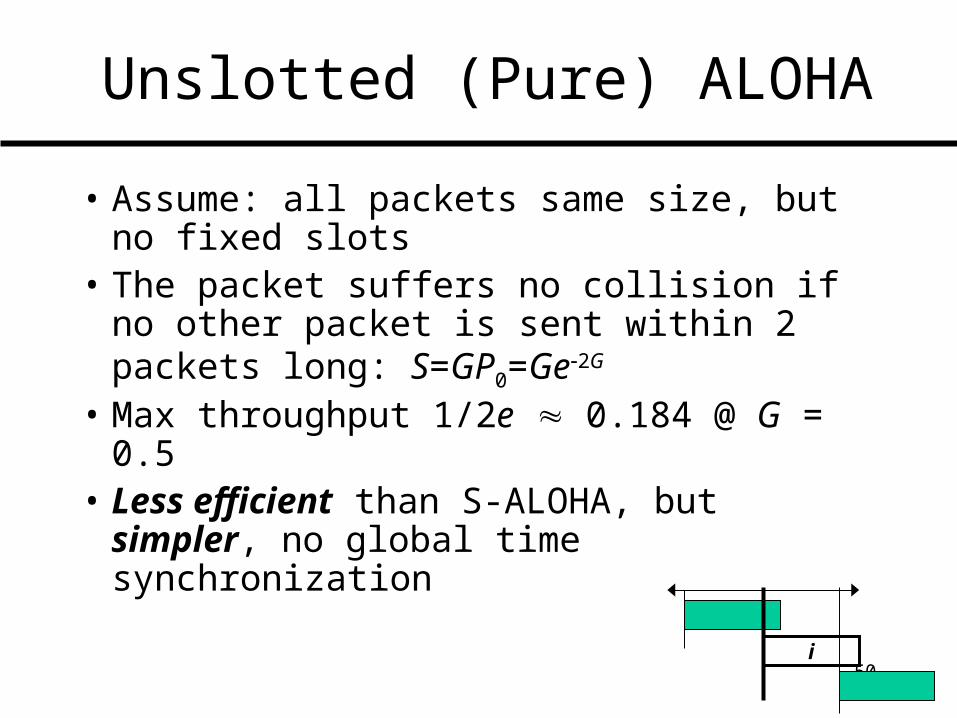
Unslotted (Pure) ALOHA
• Assume: all packets same size, but no fixed slots
• The packet suffers no collision if no other packet is sent within 2 packets long: S=GP0=Ge2G
• Max throughput 1/2e 0.184 @ G = 0.5• Less efficient than S-ALOHA, but
simpler, no global time synchronization
i
51
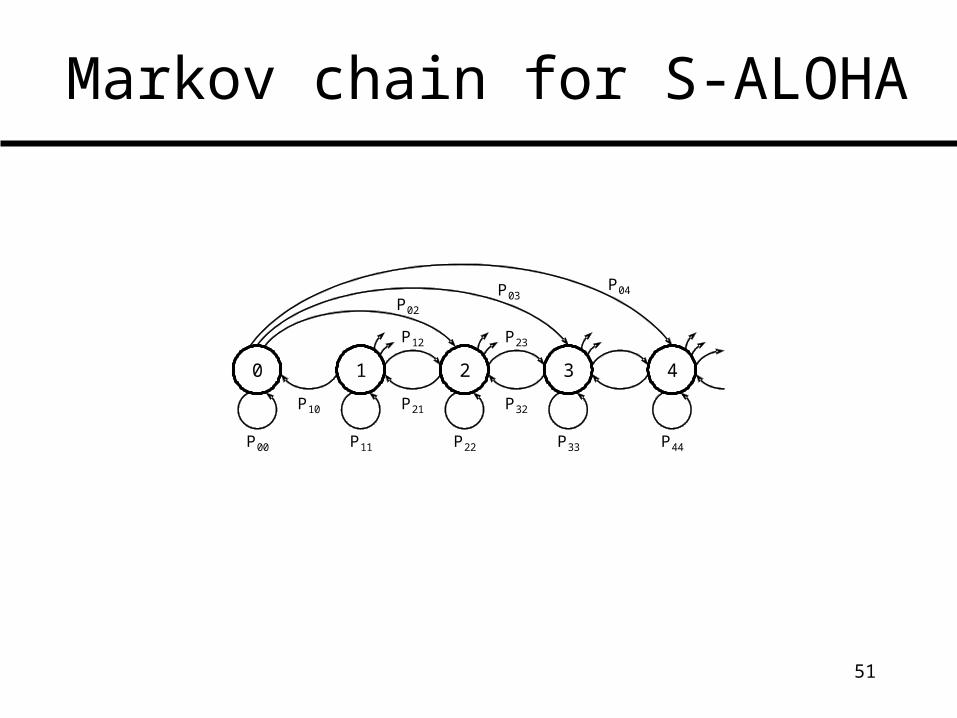
Markov chain for S-ALOHA
P10
0 1 2 3 4
P21
P12
P00 P11 P22
P02
P03P04
P33 P44
P32
P23
52
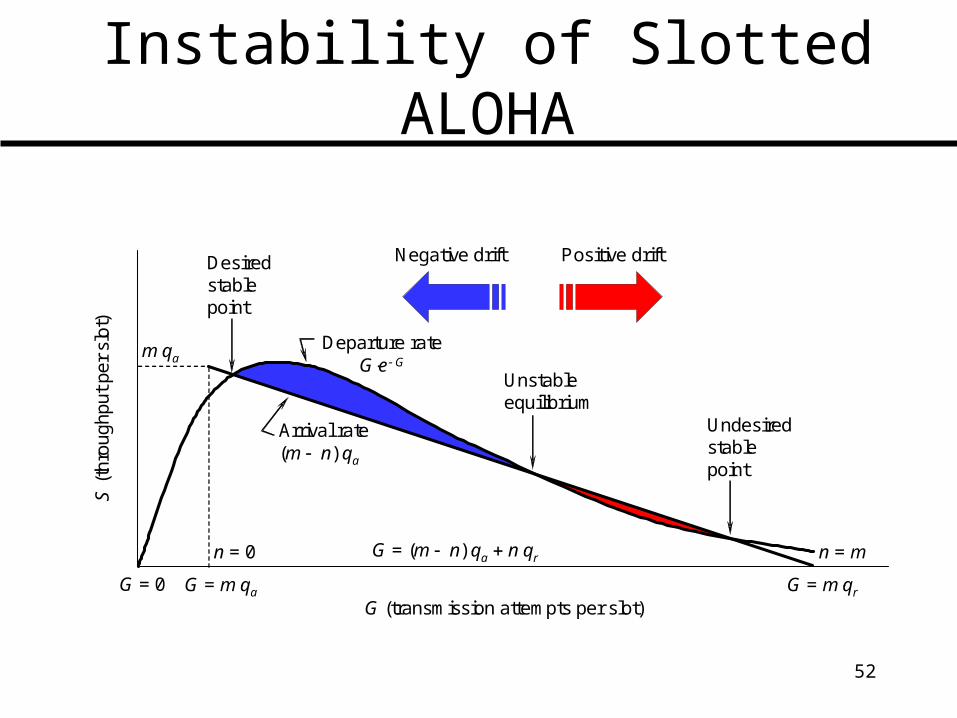
Instability of Slotted ALOHA
Desiredstablepoint
Departure rateGe G
Unstableequilibrium
Undesiredstablepoint
mqa
G = (m n)qa nqr
G = mqrG = mqa
Arrival rate(m n)qa
n = mn = 0
G = 0
S(t
hrou
ghpu
t per
slo
t)
G (transmission attempts per slot)
Negative drift Positive drift
53
Carrier Sensing (CSMA)
• Listen before talk (unlike ALOHA, where talk when you need to)
54
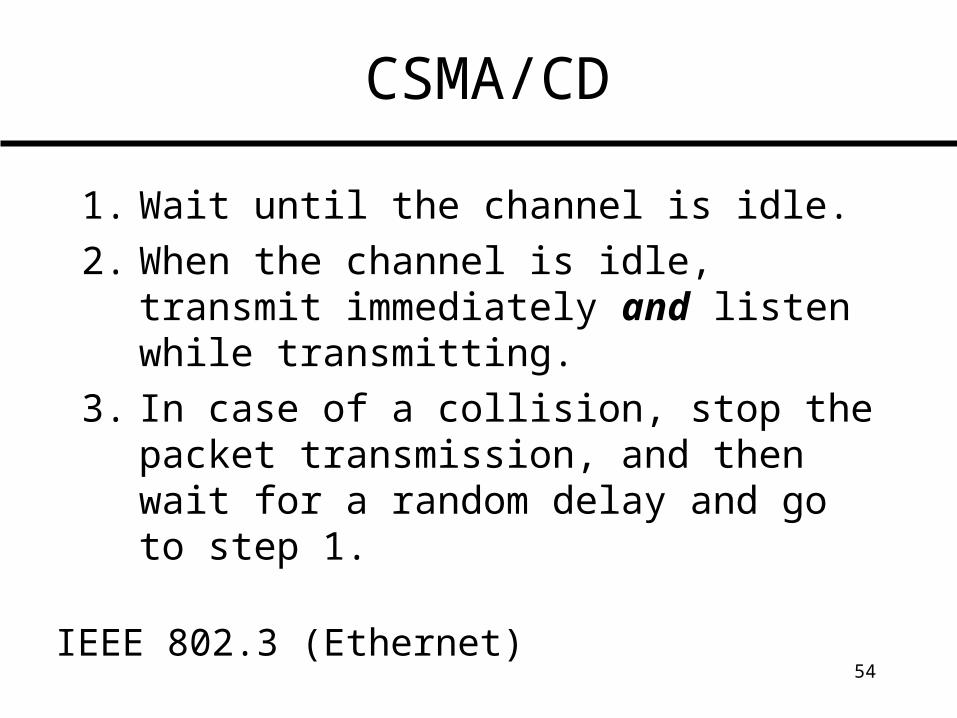
CSMA/CD
1. Wait until the channel is idle.
2. When the channel is idle, transmit immediately and listen while transmitting.
3. In case of a collision, stop the packet transmission, and then wait for a random delay and go to step 1.
IEEE 802.3 (Ethernet)
55
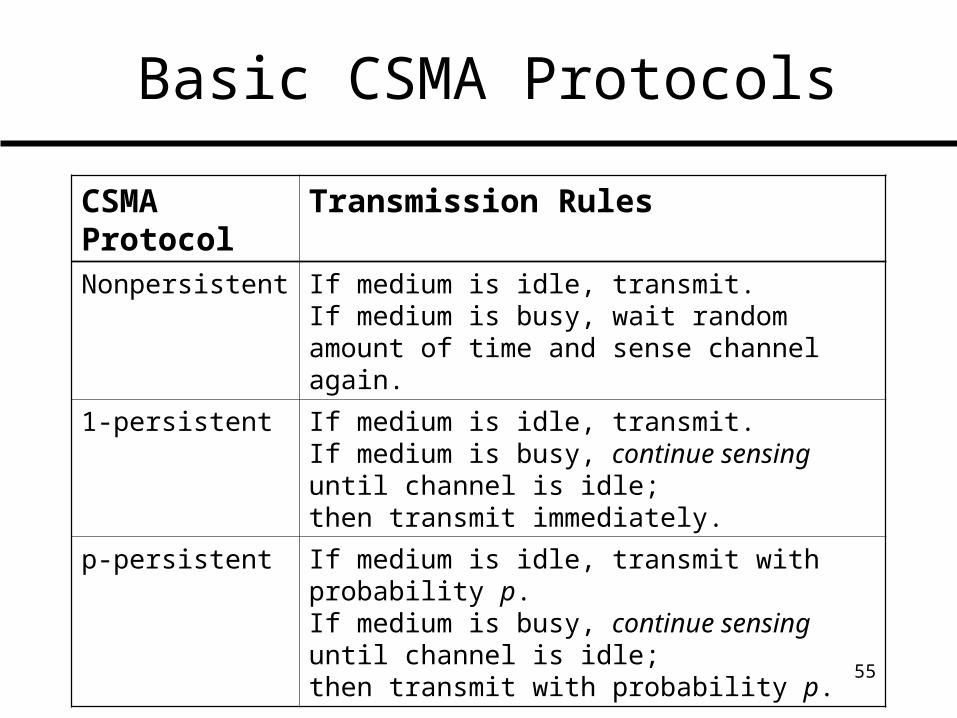
Basic CSMA Protocols
CSMA Protocol
Transmission Rules
Nonpersistent If medium is idle, transmit.If medium is busy, wait random amount of time and sense channel again.
1-persistent If medium is idle, transmit.If medium is busy, continue sensing until channel is idle;then transmit immediately.
p-persistent If medium is idle, transmit with probability p.If medium is busy, continue sensing until channel is idle;then transmit with probability p.
56
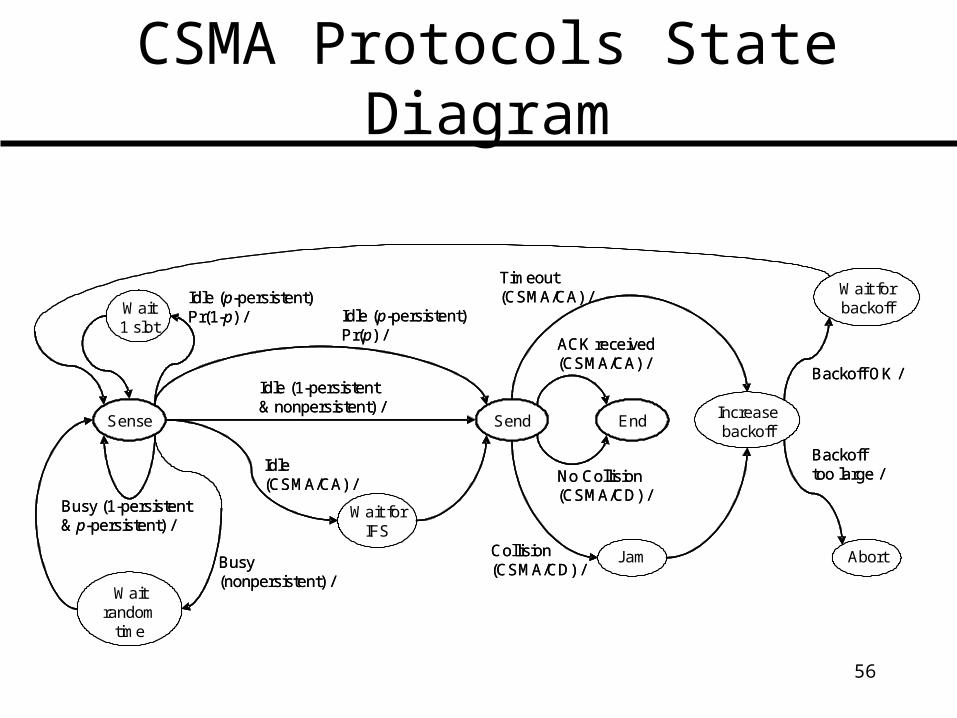
CSMA Protocols State Diagram
Sense Send End Increase backoff
Wait random
time
Wait for IFS
Wait 1 slot
Idle (p-persistent)Pr(1-p) / Idle (p-persistent)
Pr(p) /
No Collision(CSMA/CD) /
ACK received(CSMA/CA) /
Abort
Wait for backoff
Backofftoo large /
Jam
Idle(CSMA/CA) /
Busy(nonpersistent) /
Busy (1-persistent& p-persistent) /
Idle (1-persistent& nonpersistent) /
Timeout(CSMA/CA) /
Collision(CSMA/CD) /
Backoff OK /
57
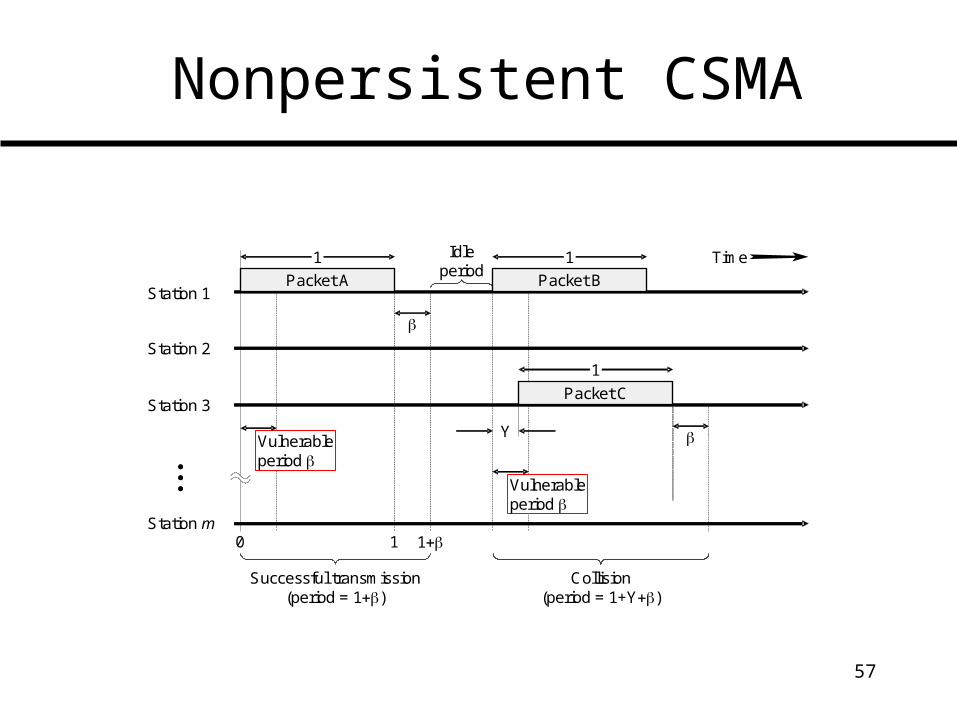
Nonpersistent CSMA
Station 1
Time
Station 2
Station 3
Station m
Vulnerableperiod
Packet A Packet B
Packet C
Idleperiod
Vulnerableperiod
1 1
1
0 1 1
Successful transmission(period = 1)
Collision(period = 1+Y)
Y
58
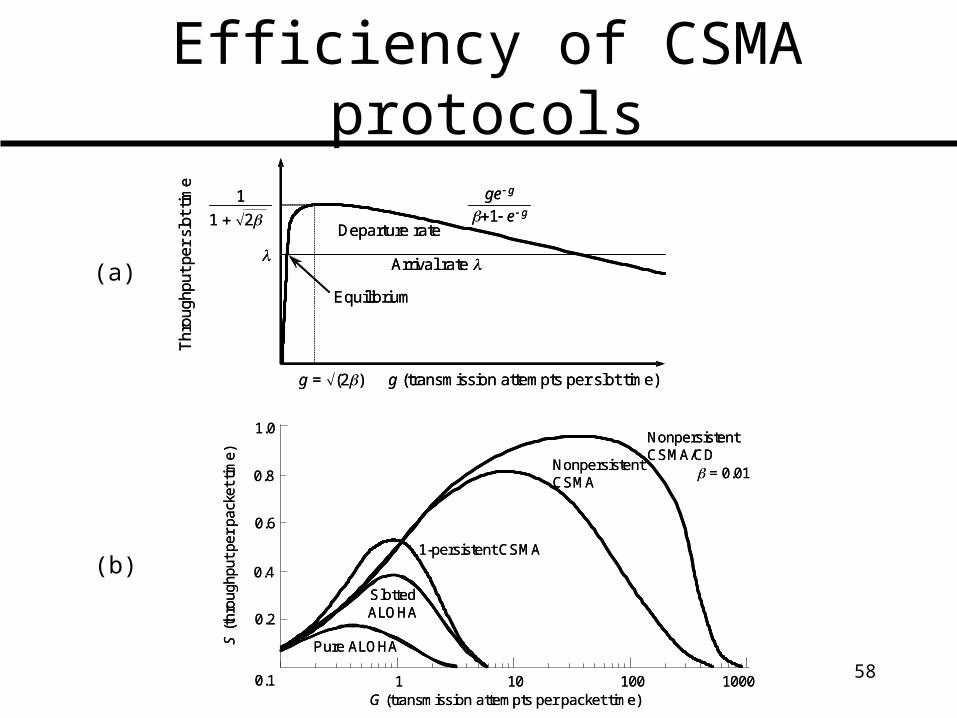
Efficiency of CSMA protocols
(a)
(b)SlottedALOHA
Pure ALOHA
1-persistent CSMA
NonpersistentCSMA
NonpersistentCSMA/CD
S(t
hrou
ghpu
t per
pac
ket t
ime)
G (transmission attempts per packet time)0.1
0.2
0.4
0.6
0.8
1.0
1 10 100 1000
= 0.01
SlottedALOHA
Pure ALOHA
1-persistent CSMA
NonpersistentCSMA
NonpersistentCSMA/CD
S(t
hrou
ghpu
t per
pac
ket t
ime)
G (transmission attempts per packet time)0.1
0.2
0.4
0.6
0.8
1.0
1 10 100 1000
= 0.01
g = (2)
g (transmission attempts per slot time)
1 2
Arrival rate
Equilibrium
Departure rate
1 ge g
1 e g
Thr
ough
put p
er s
lot
time
g = (2)
g (transmission attempts per slot time)
1 2
Arrival rate
Equilibrium
Departure rate
1 ge g
1 e g
Thr
ough
put p
er s
lot
time
59
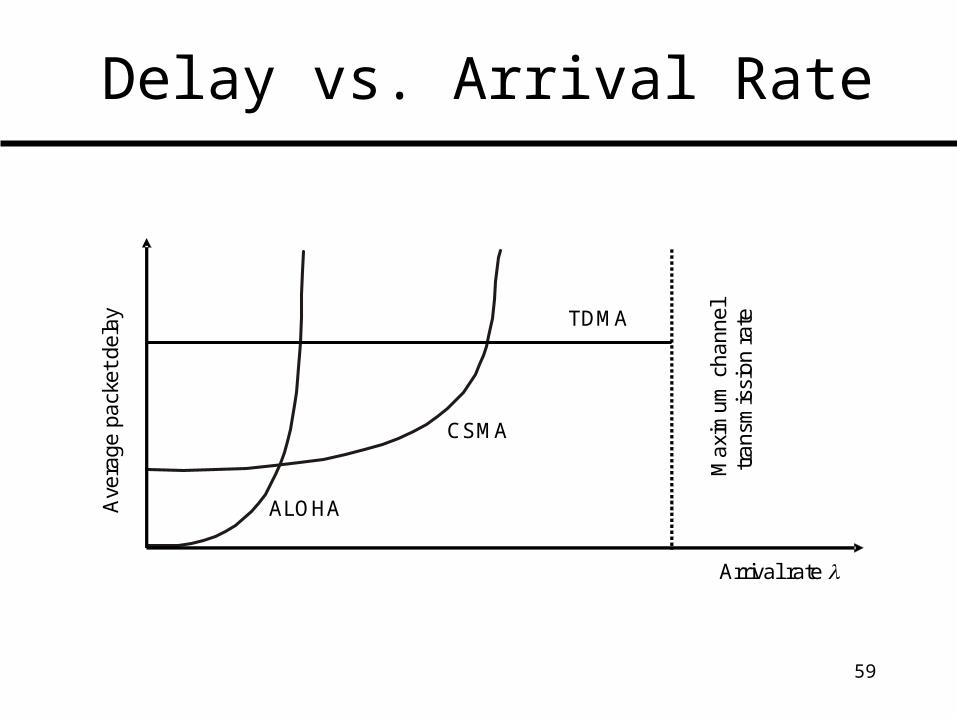
Delay vs. Arrival Rate
Arrival rate
Ave
rage
pac
ket
dela
y
ALOHA
CSMA
TDMA
Max
imum
cha
nnel
tran
smis
sion
rat
e
60
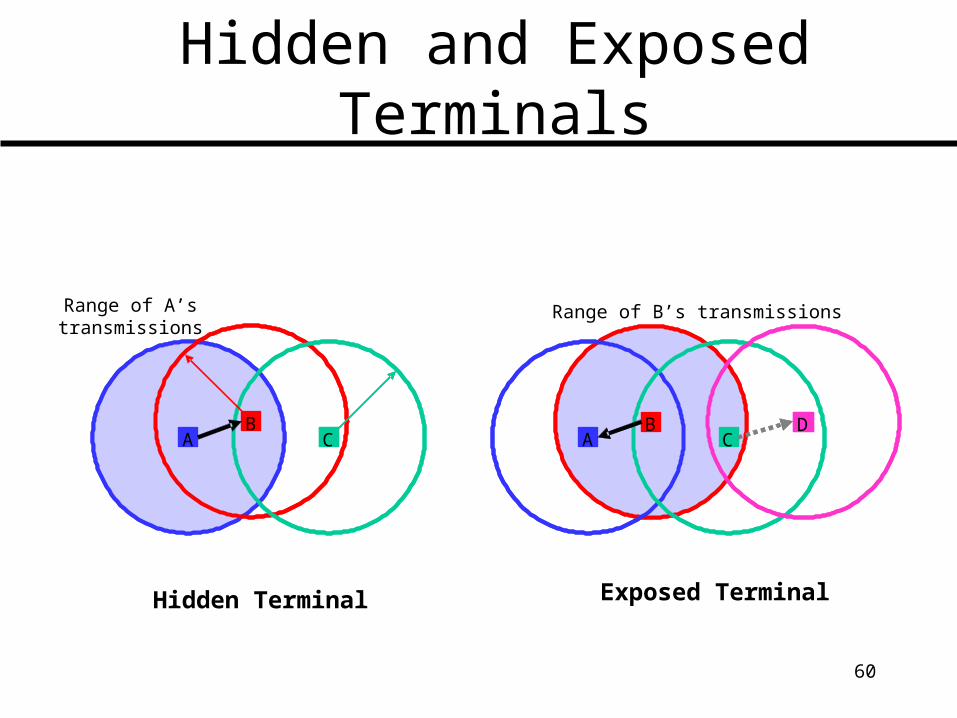
Hidden and Exposed Terminals
Range of B’s transmissionsRange of A’stransmissions
Hidden Terminal Exposed Terminal
CAB
CAB
AB
CD
AB
CD
61
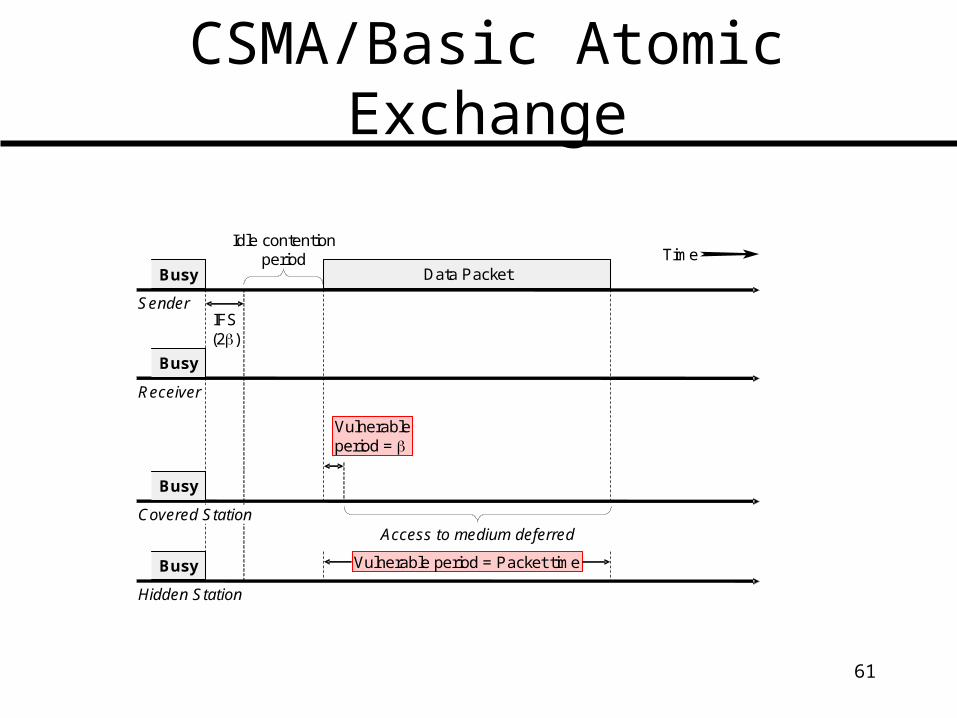
CSMA/Basic Atomic Exchange
Data Packet
Receiver
Sender
Covered Station
Busy
Busy
Busy
Hidden Station
Busy
Access to medium deferred
Time
IFS(2)
Idle contentionperiod
Vulnerableperiod =
Vulnerable period = Packet time
62
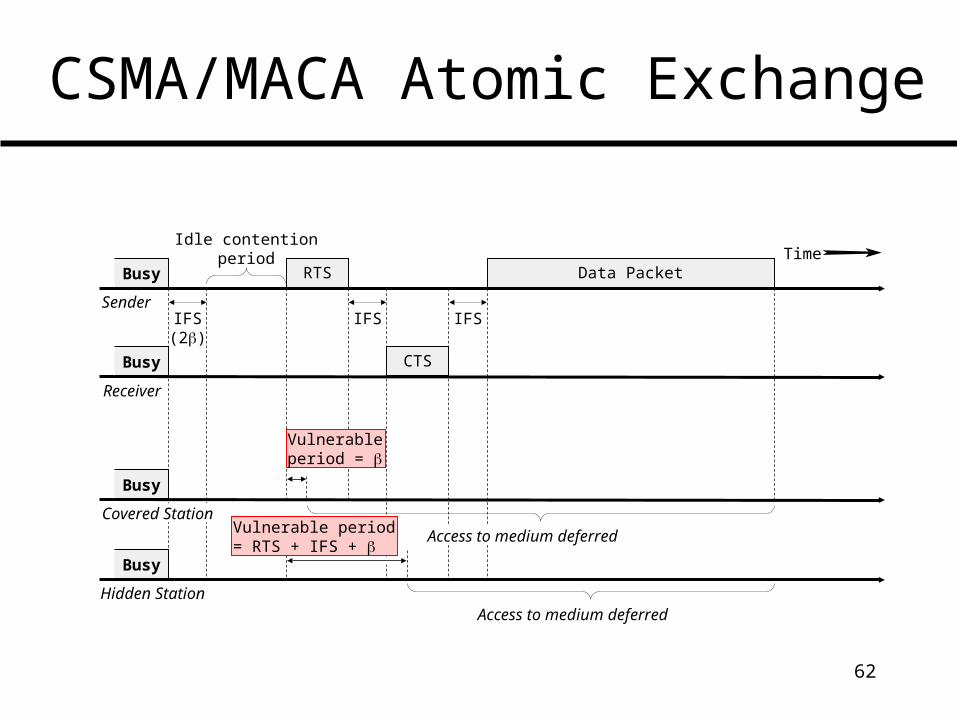
CSMA/MACA Atomic Exchange
RTS Data Packet
CTS
Access to medium deferred
Receiver
Sender
Covered Station
Busy
Busy
Busy
Hidden Station
Busy
Access to medium deferred
Time
IFS(2)
Idle contentionperiod
IFS IFS
Vulnerableperiod =
Vulnerable period= RTS + IFS +
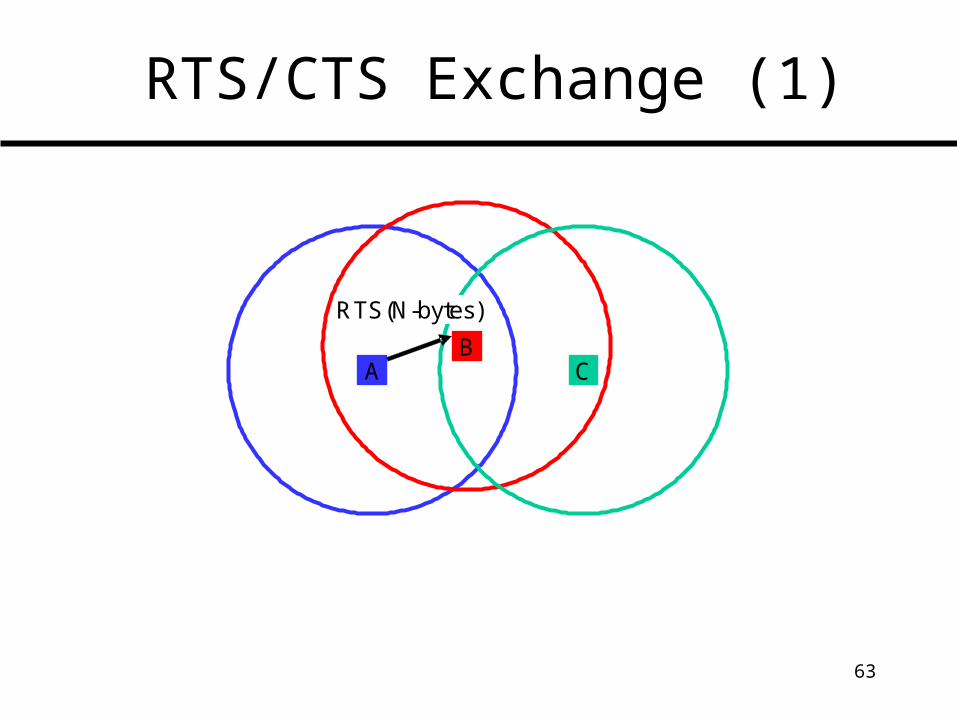
63
RTS/CTS Exchange (1)
CAB
RTS(N-bytes)
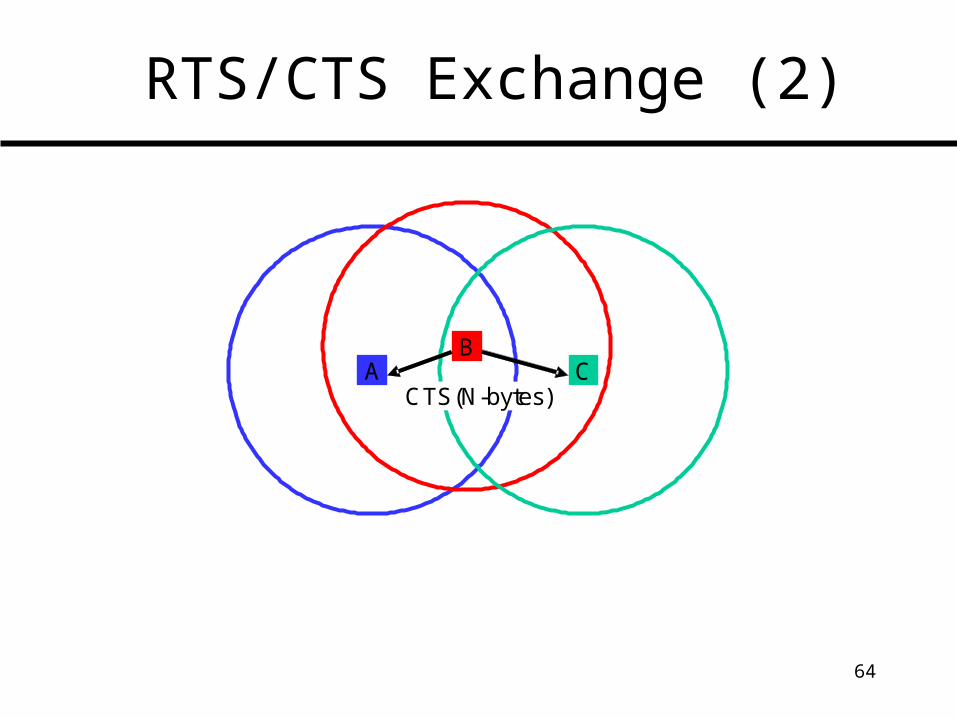
64
RTS/CTS Exchange (2)
CAB
CTS(N-bytes)
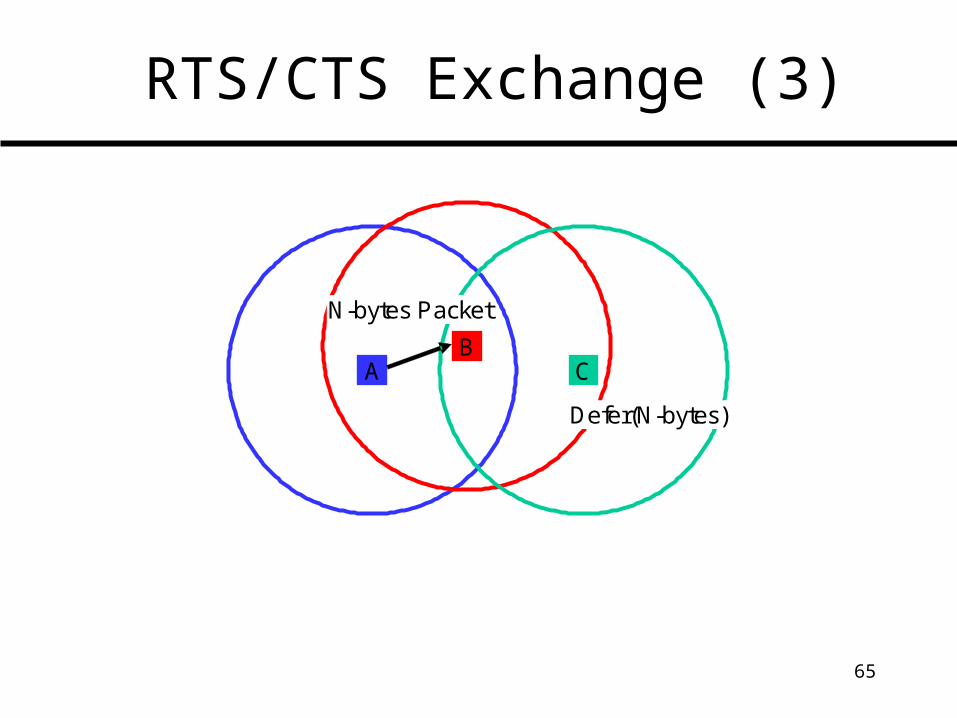
65
RTS/CTS Exchange (3)
CAB
N-bytes Packet
Defer(N-bytes)
66
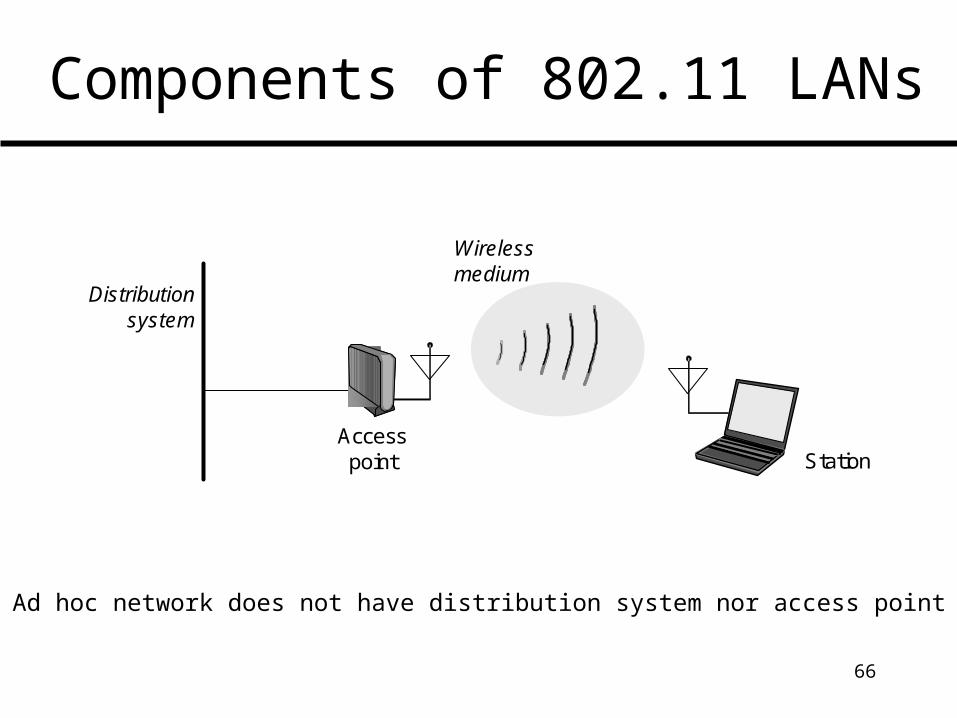
Components of 802.11 LANs
Ad hoc network does not have distribution system nor access point
Distribution system
Station
Wireless medium
Access point
67
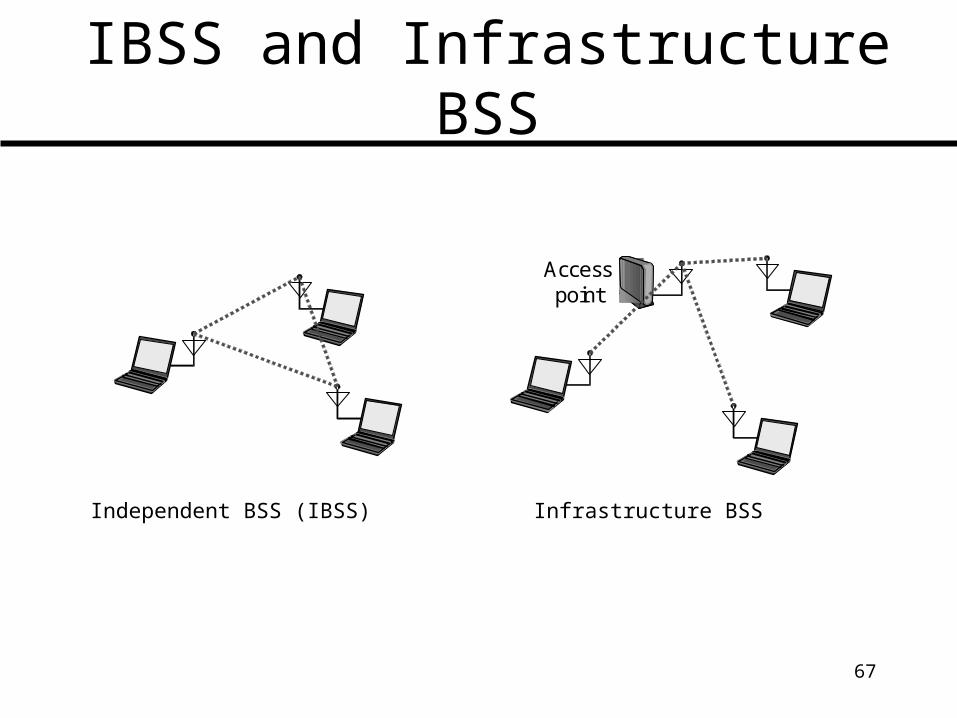
IBSS and Infrastructure BSS
Independent BSS (IBSS) Infrastructure BSS
Access point
68
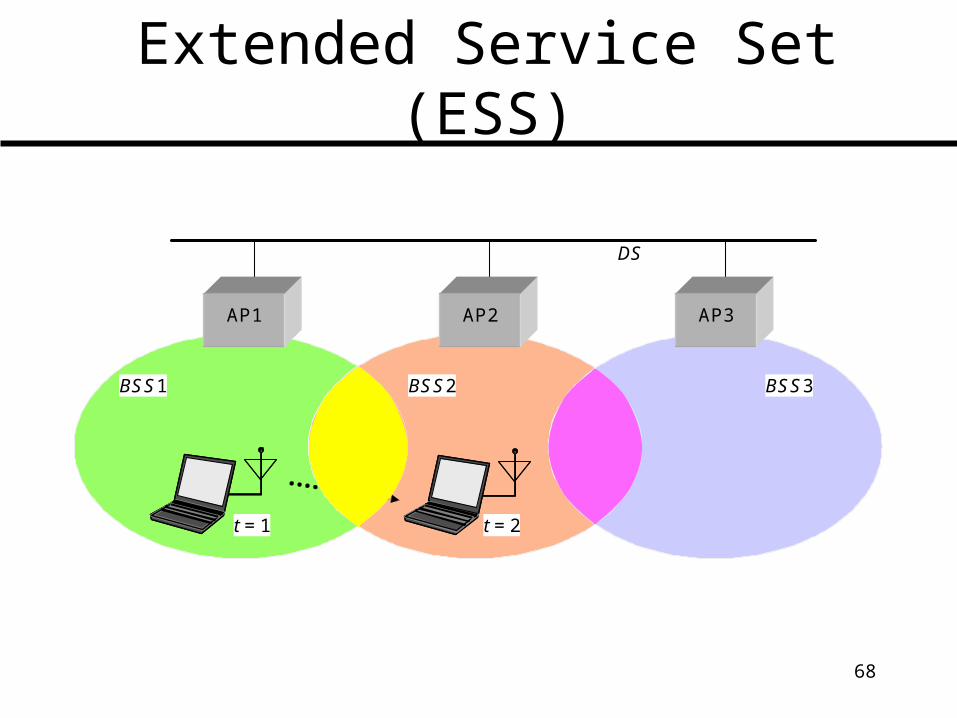
Extended Service Set (ESS)
DS
t = 1 t = 2
BSS1 BSS2 BSS3
AP3AP2AP1
69
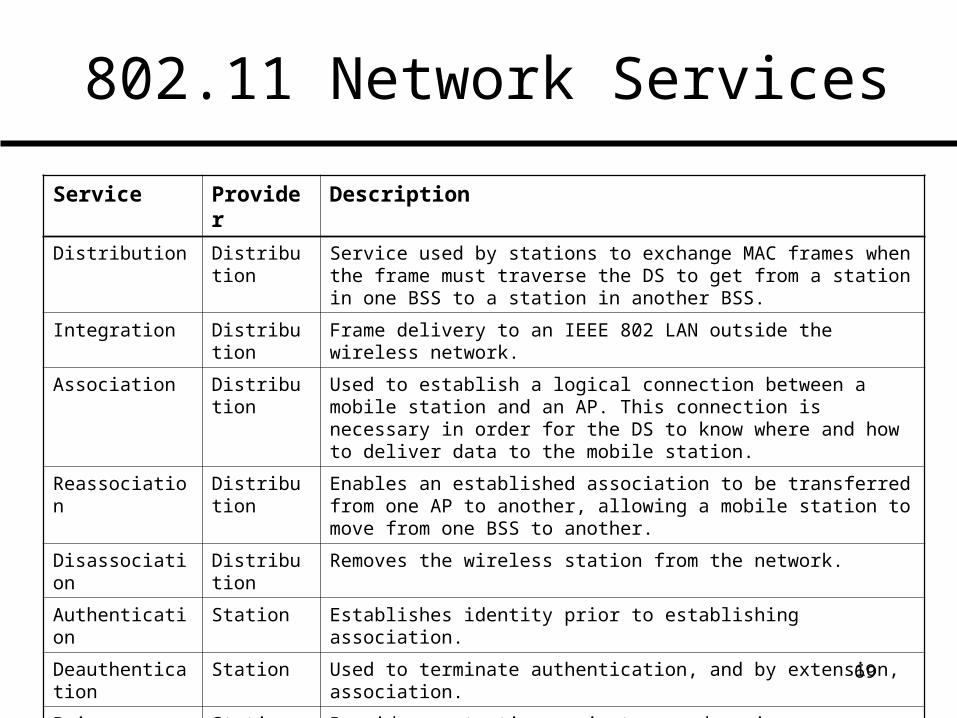
802.11 Network Services
Service Provider Description
Distribution Distribution Service used by stations to exchange MAC frames when the frame must traverse the DS to get from a station in one BSS to a station in another BSS.
Integration Distribution Frame delivery to an IEEE 802 LAN outside the wireless network.
Association Distribution Used to establish a logical connection between a mobile station and an AP. This connection is necessary in order for the DS to know where and how to deliver data to the mobile station.
Reassociation Distribution Enables an established association to be transferred from one AP to another, allowing a mobile station to move from one BSS to another.
Disassociation Distribution Removes the wireless station from the network.
Authentication Station Establishes identity prior to establishing association.
Deauthentication
Station Used to terminate authentication, and by extension, association.
Privacy Station Provides protection against eavesdropping.
MSDU delivery Station Delivers data to the recipient.
70
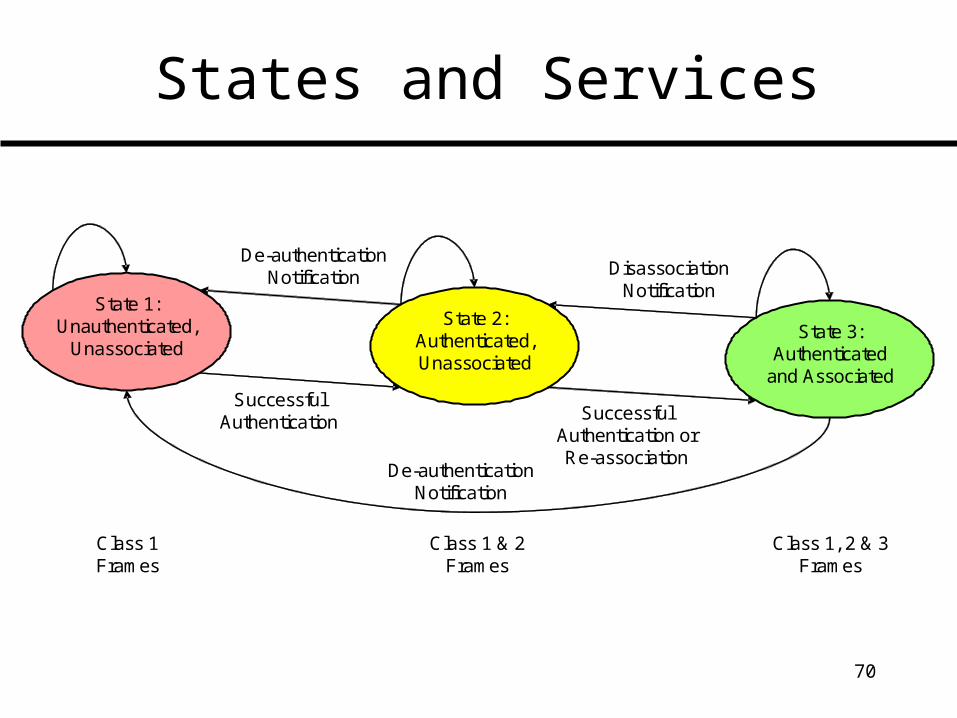
States and Services
State 1:Unauthenticated,
Unassociated
Class 1Frames
SuccessfulAuthentication
State 2:Authenticated,Unassociated
State 3:Authenticated
and Associated
De-authenticationNotification Disassociation
Notification
SuccessfulAuthentication orRe-association
De-authenticationNotification
Class 1 & 2Frames
Class 1, 2 & 3Frames
71
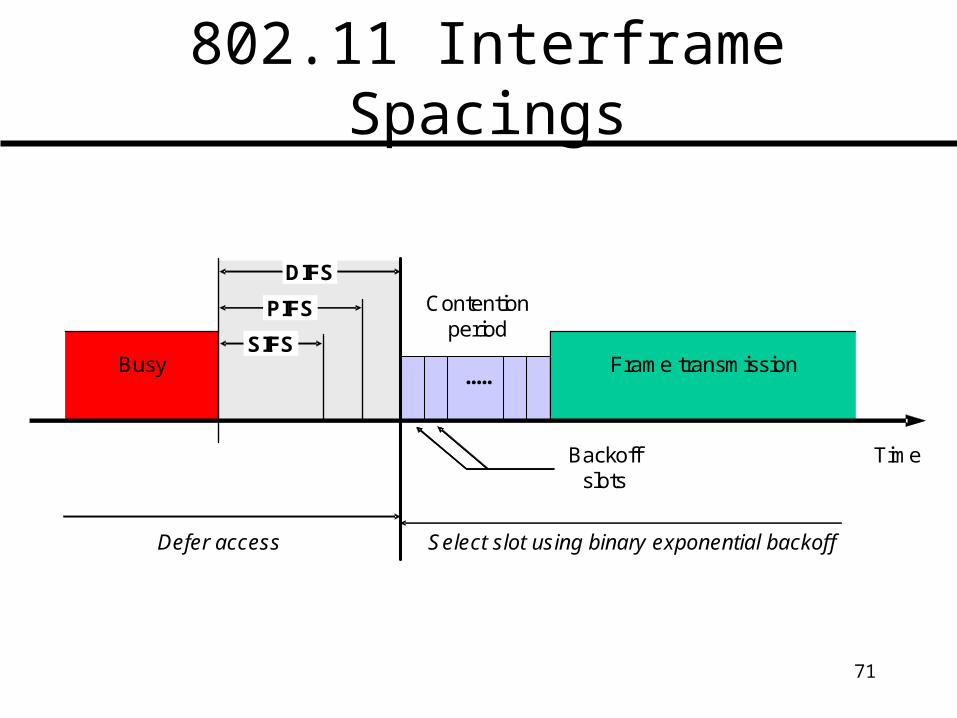
802.11 Interframe Spacings
Busy Frame transmission.....
Contention period
Backoff slots
DIFS
PIFS
SIFS
Time
Defer access Select slot using binary exponential backoff
72
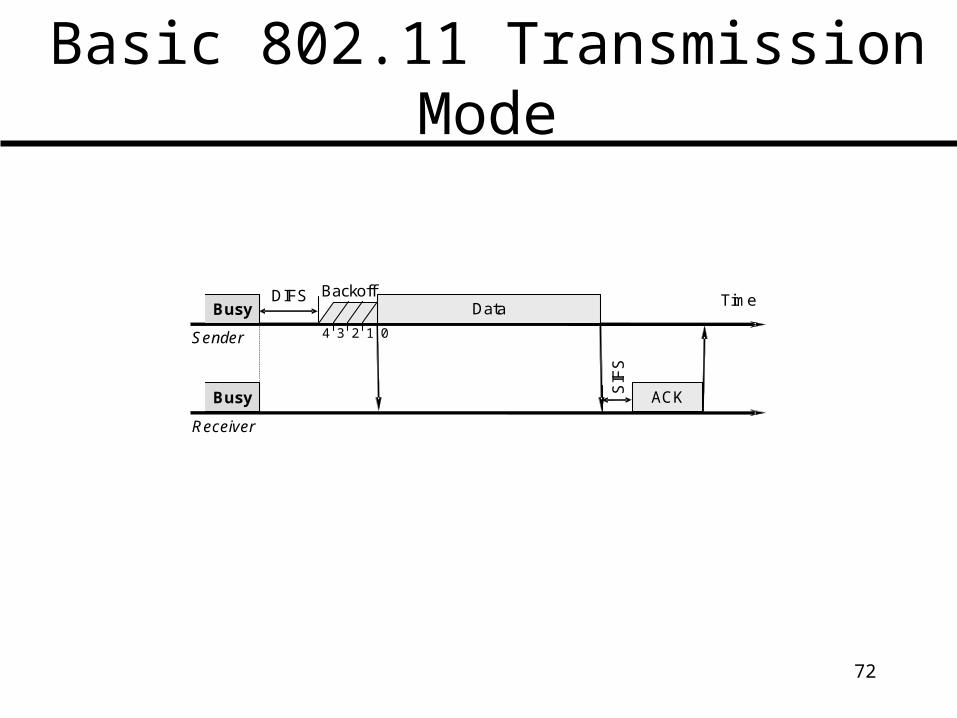
Basic 802.11 Transmission Mode
TimeDIFS
Receiver
Sender
Data
SIF
S
ACK
4 3 2 1 0
BackoffBusyBusy
BusyBusy
73
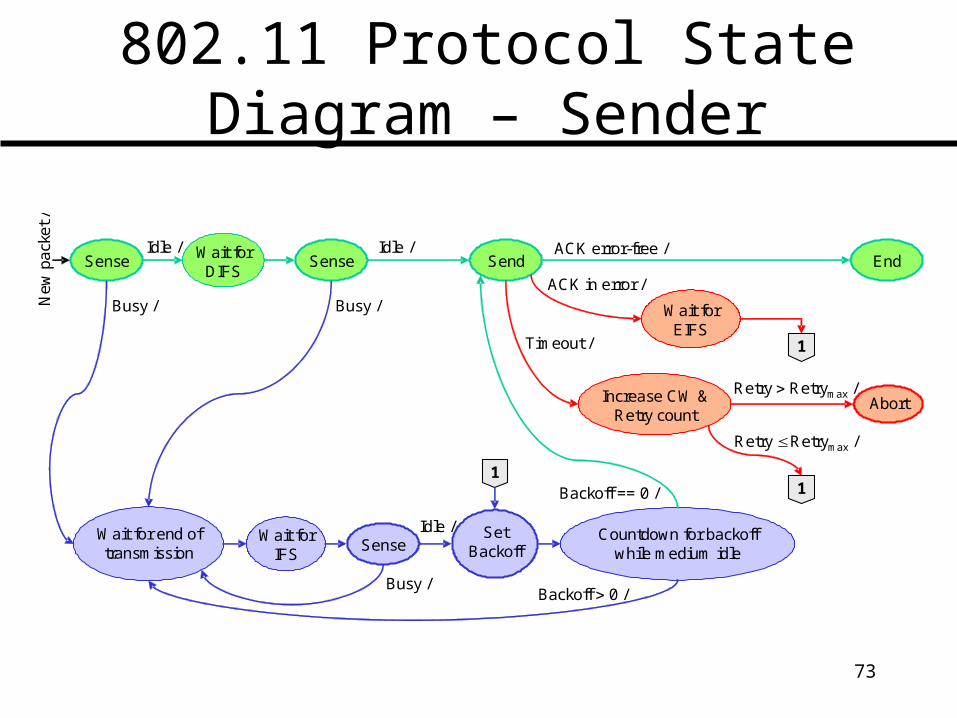
802.11 Protocol State Diagram – Sender
Sense Send End
Increase CW & Retry count
Wait for end of transmission
Wait for DIFS
ACK error-free /
Abort
Wait for IFS
Sense
SenseCountdown for backoff
while medium idle
Busy /
Idle /
Busy /
Idle /
Busy /
Backoff == 0 /
Timeout /
Backoff 0 /
Retry Retrymax /
New
pac
ket
/
Retry Retrymax /
Wait for EIFS
1
SetBackoff
Idle /
1
1
ACK in error /
74
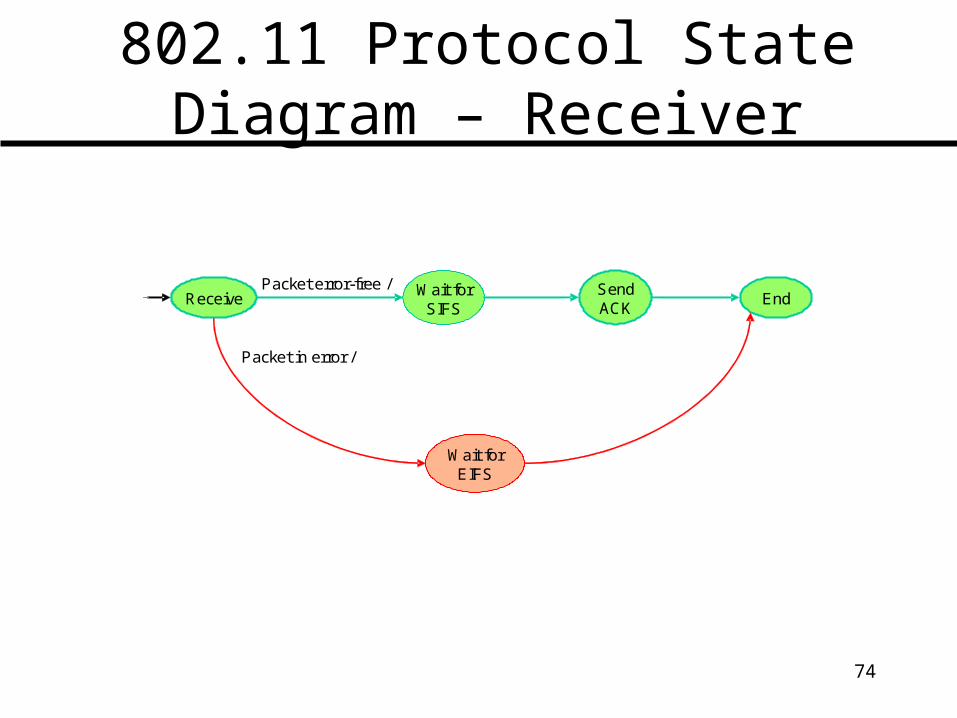
802.11 Protocol State Diagram – Receiver
ReceiveSend ACK
EndWait for
SIFS
Wait for EIFS
Packet in error /
Packet error-free /
75
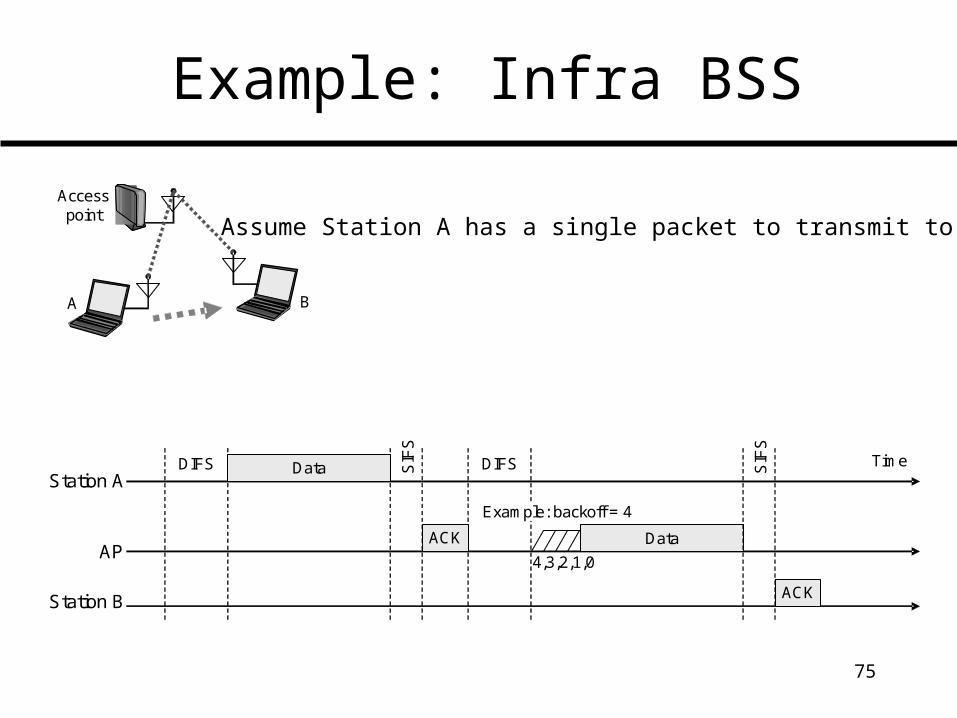
Example: Infra BSS
Assume Station A has a single packet to transmit to B
A B
Accesspoint
DIFSStation A
AP
Station B
DIFS Data SIF
S
ACK
Example: backoff = 4
4,3,2,1,0
Data
SIF
S
ACK
Time
76
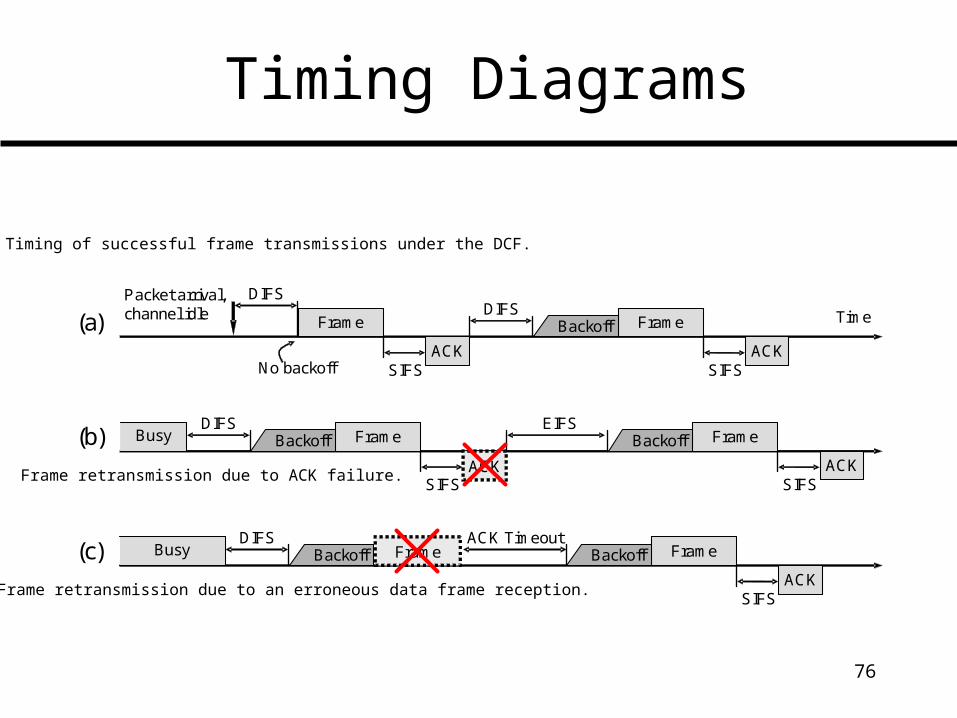
Timing Diagrams
Timing of successful frame transmissions under the DCF.
Frame retransmission due to ACK failure.
Frame retransmission due to an erroneous data frame reception.
Frame
DIFS
SIFSACK
FrameDIFS
Backoff
SIFSACK
Busy FrameDIFS
Backoff
SIFSACK
FrameEIFS
Backoff
SIFSACK
Busy FrameDIFS
Backoff FrameACK Timeout
Backoff
SIFSACK
(a) Time
(b)
(c)
Packet arrival,channel idle
No backoff
77
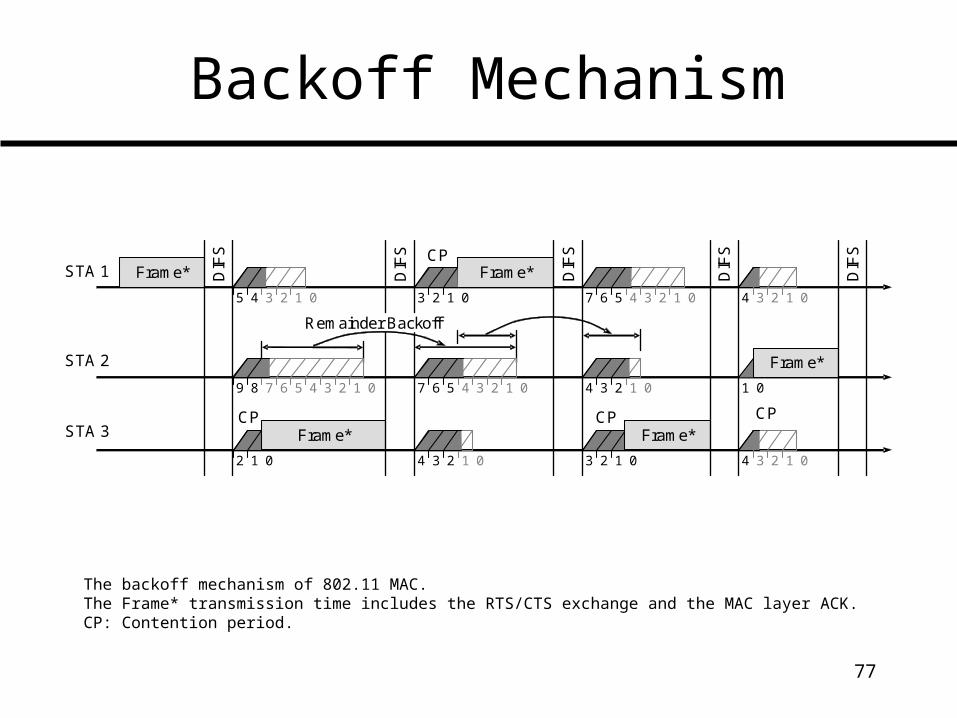
Backoff Mechanism
The backoff mechanism of 802.11 MAC.The Frame* transmission time includes the RTS/CTS exchange and the MAC layer ACK.CP: Contention period.
DIF
S
Frame*
Frame*CP
CP CPCP
STA 1
STA 2
STA 3
5 4 3 2 1 0
2 1 0
9 8 7 6 5 4 3 2 1 0
Frame*
3 2 1 0
7 6 5 4 3 2 1 0
4 3 2 1 0
4 3 2 1 0
3 2 1 0
DIF
S
DIF
S
DIF
S
DIF
S
7 6 5 4 3 2 1 0
Frame*
Remainder Backoff
1 0
Frame*
4 3 2 1 0
4 3 2 1 0
78
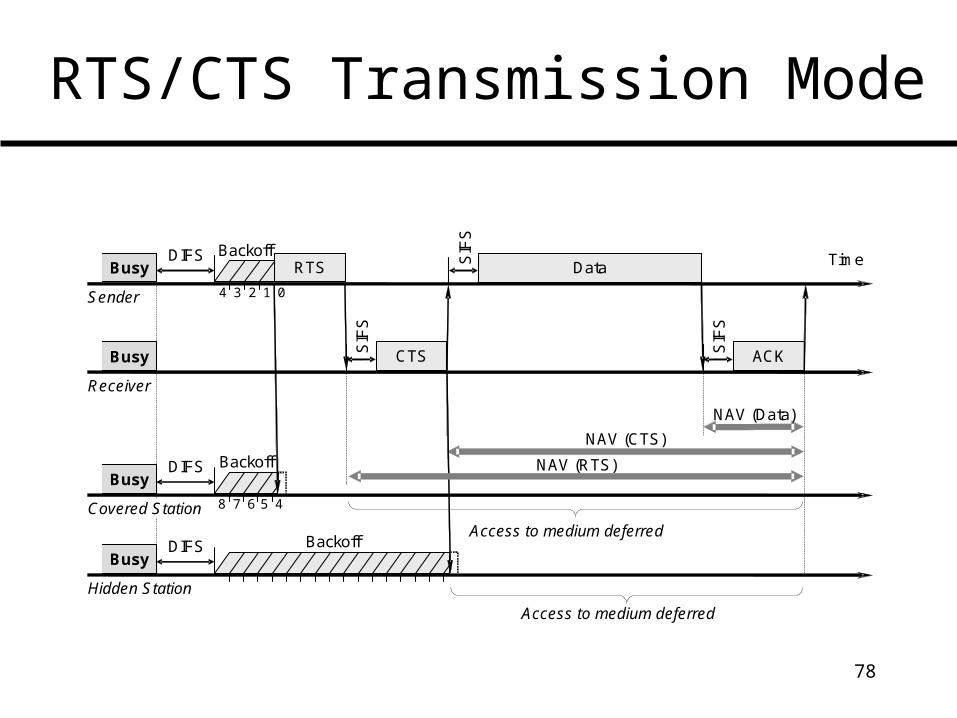
RTS/CTS Transmission Mode
RTS
SIF
S
TimeData
CTS
SIF
S
SIF
S
ACK
DIFS
Access to medium deferred
Receiver
Sender 4 3 2 1 0
Backoff
DIFS
Covered Station
BusyBusy
BusyBusy
BusyBusyNAV (RTS)
NAV (CTS)
NAV (Data)
8 7 6
Backoff
5 4
DIFS
Hidden Station
BusyBusyBackoff
Access to medium deferred
79
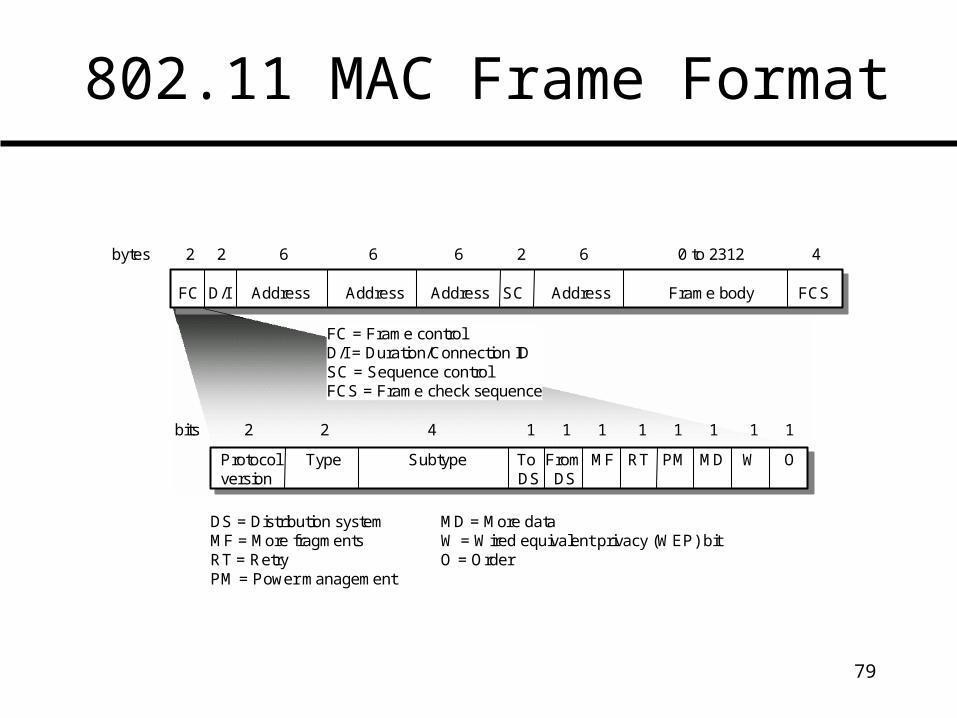
802.11 MAC Frame Format
FC D/I Address Address Address SC Address Frame body FCS FC D/I Address Address Address SC Address Frame body FCS
Protocol Type Subtype To From MF RT PM MD W Oversion DS DS
Protocol Type Subtype To From MF RT PM MD W Oversion DS DS
bits 2 2 4 1 1 1 1 1 1 1 1
bytes 2 2 6 6 6 2 6 0 to 2312 4
FC = Frame controlD/I = Duration/Connection IDSC = Sequence controlFCS = Frame check sequence
DS = Distribution systemMF = More fragmentsRT = RetryPM = Power management
MD = More dataW = Wired equivalent privacy (WEP) bitO = Order
80
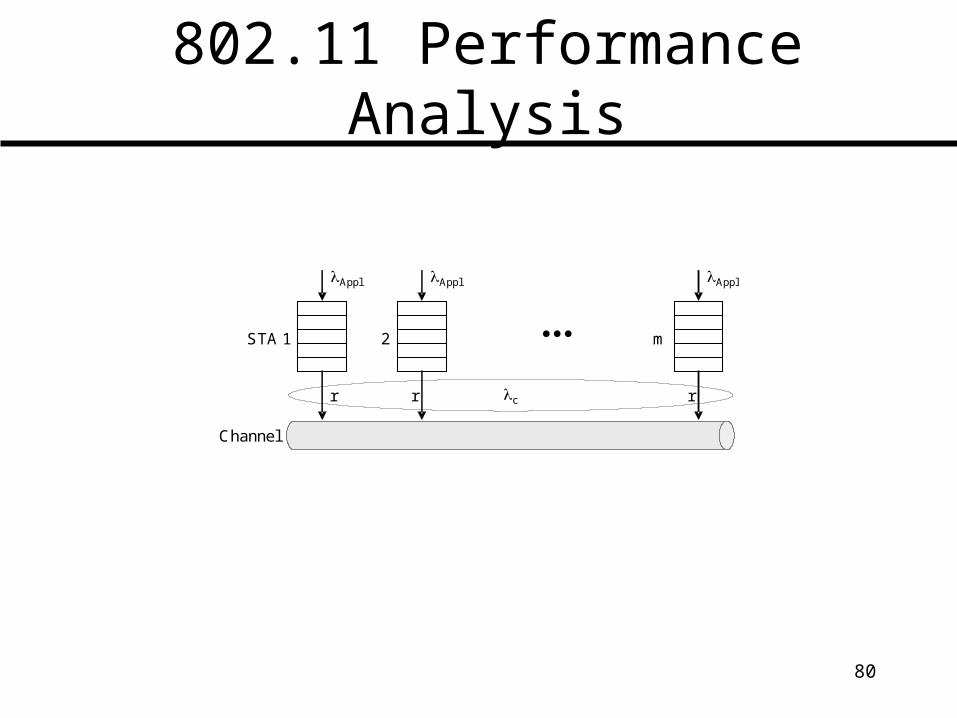
802.11 Performance Analysis
Appl
STA 1
Appl
2
Appl
m
Channel
cr r r
81
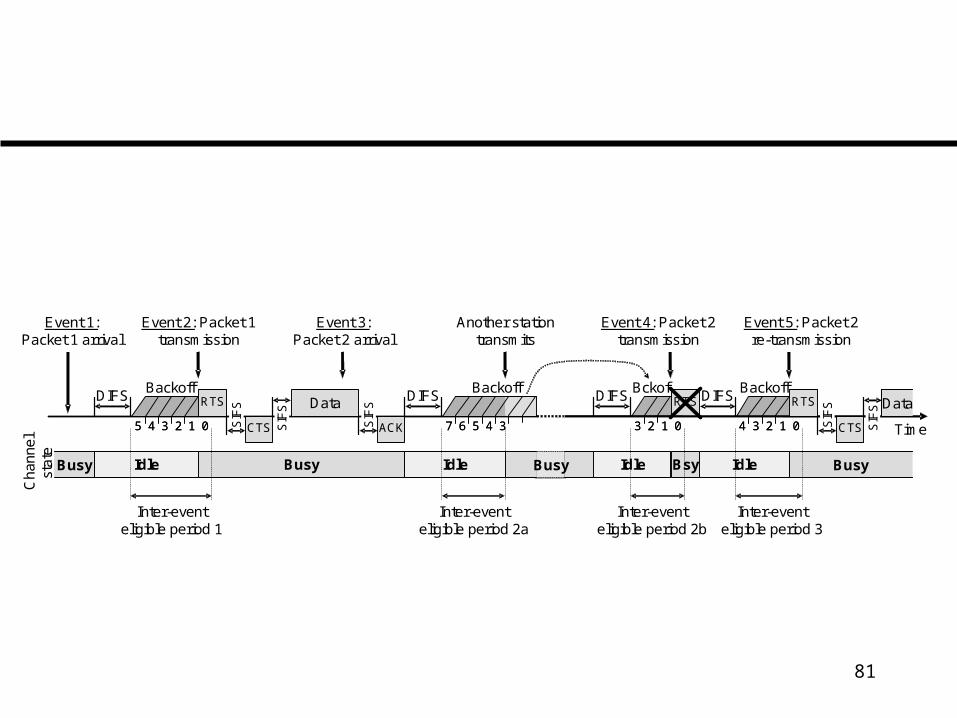
3 2 1 03 2 1 07 6 5 4 37 6 5 4 35 4 3 2 1 05 4 3 2 1 0
Idle
DIFSBckof
Inter-eventeligible period 2b
Event 4: Packet 2transmission
RTSBackoff
Idle
Inter-eventeligible period 3
Event 5: Packet 2re-transmission
Bsy
DIFS
Cha
nnel
stat
e
Event 1:Packet 1 arrival
IdleBusyBusy Busy
DIFSBackoff
Inter-eventeligible period 1
RTS
SIF
S
CTS
Data
SIF
S
SIF
S
ACK
DIFS
Idle
Inter-eventeligible period 2a
Event 2: Packet 1transmission
Another stationtransmits
Event 3:Packet 2 arrival
Busy
Time
RTS
CTSSIF
S
SIF
S
BusyBusy
DataDataBackoff
4 3 2 1 04 3 2 1 0
82
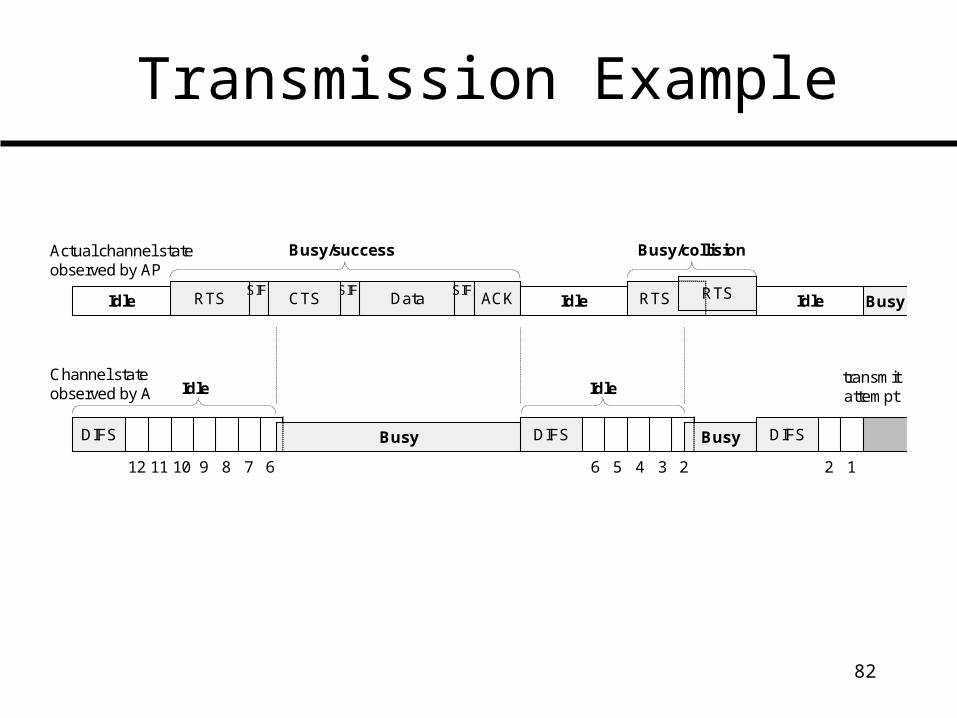
Transmission Example
Busy
6
Busy/success
Idle
DIFS
Actual channel stateobserved by AP
12
transmitattempt
Idle BusyBusy
789101112
Channel stateobserved by A
RTSSIFS SIFS
DataSIFS
ACK
DIFS
CTS Idle
Busy
RTS RTS
DIFS
23456
Idle
Idle
Busy/collision
83
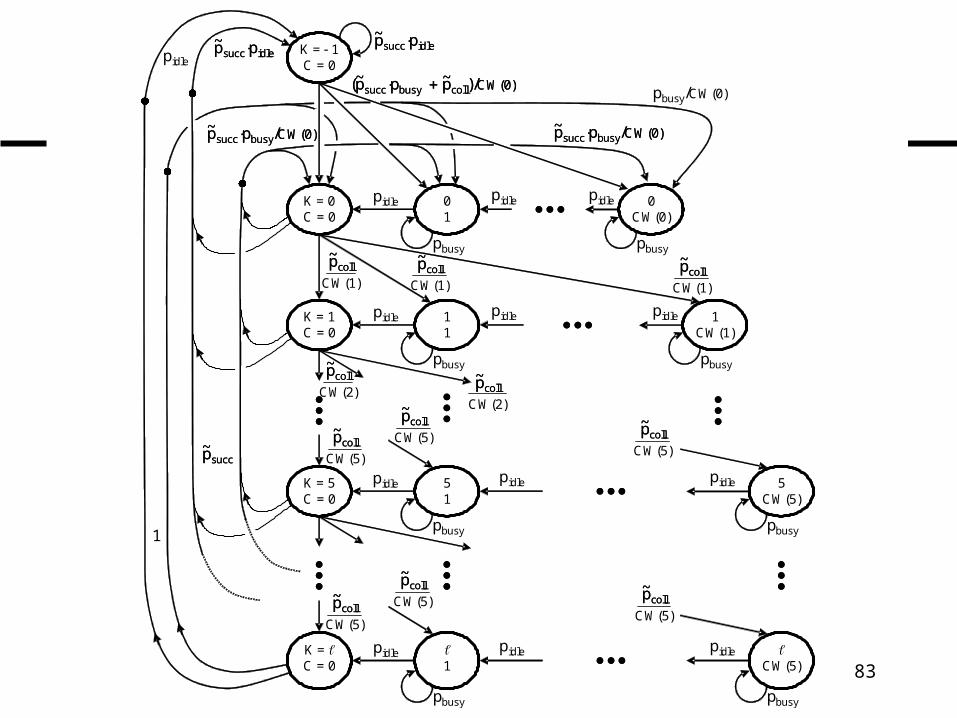
0CW(0)
K = 1C = 0
K = 0C = 0
K = 5C = 0
K = C = 0
K = 1C = 0
01
11
51
1
pbusy
pidle
pbusy
pidle
pbusy
pidle
pbusy
pidle
pidle pidle
pbusy
1CW(1)
pidle pidle
pbusy
5CW(5)
pidle pidle
pbusy
CW(5)
pidle pidle
pbusy
CW(1)
pcoll~pcoll~
CW(1)
pcoll~pcoll~
CW(1)
pcoll~pcoll~
CW(2)
pcoll~pcoll~
CW(2)
pcoll~pcoll~
CW(5)
pcoll~pcoll~
CW(5)
pcoll~pcoll~
CW(5)
pcoll~pcoll~
CW(5)
pcoll~pcoll~
CW(5)
pcoll~pcoll~
psuccpidle~psuccpidle~ psuccpidle
~psuccpidle~
psuccpbusy/CW(0)~psuccpbusy/CW(0)~
(psuccpbusy pcoll)/CW(0)~ ~(psuccpbusy pcoll)/CW(0)~ ~
psuccpbusy/CW(0)~psuccpbusy/CW(0)~
CW(5)
pcoll~pcoll~
pbusy/CW(0)
pidle
psucc~psucc~
1
84
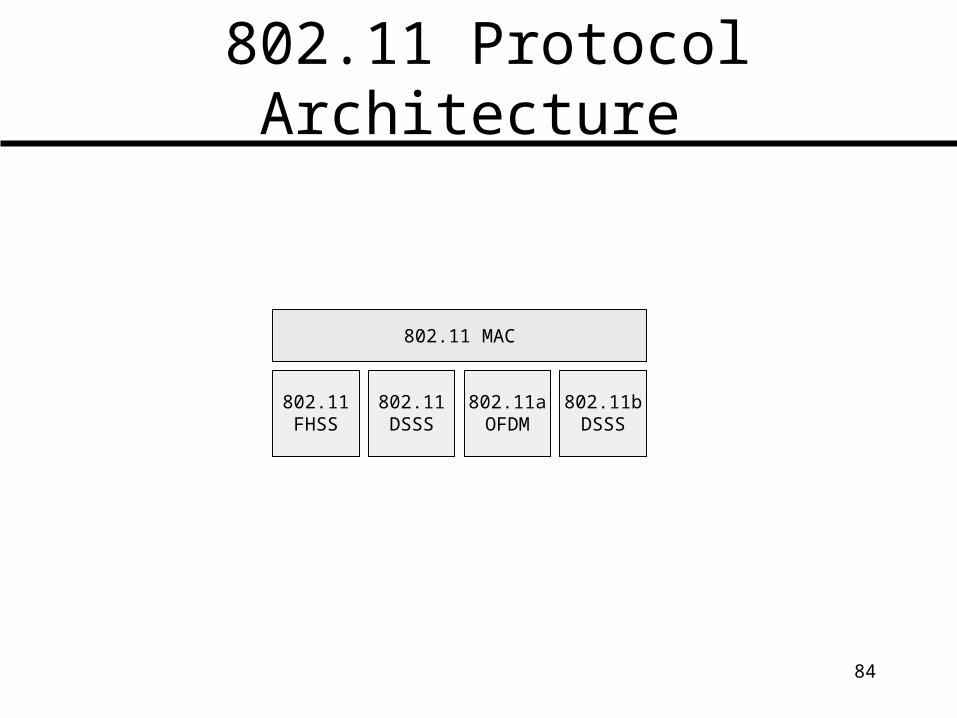
802.11 Protocol Architecture
802.11 MAC
802.11bDSSS
802.11aOFDM
802.11DSSS
802.11FHSS
85
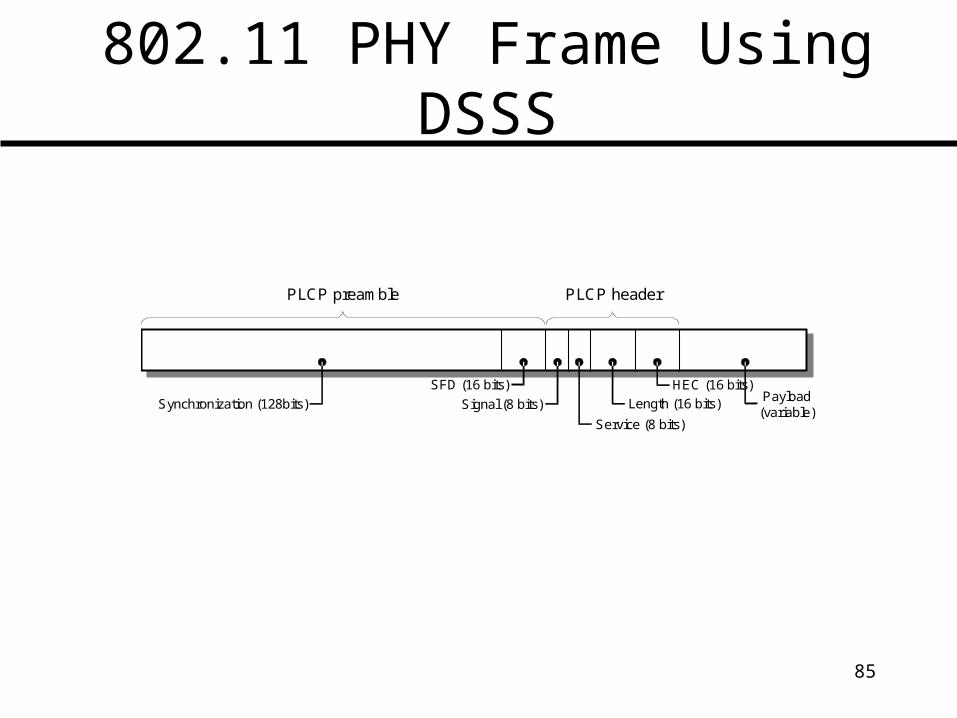
802.11 PHY Frame Using DSSS
PLCP headerPLCP preamble
Payload(variable)
Synchronization (128bits)
SFD (16 bits)
Signal (8 bits)
Service (8 bits)
Length (16 bits)
HEC (16 bits)
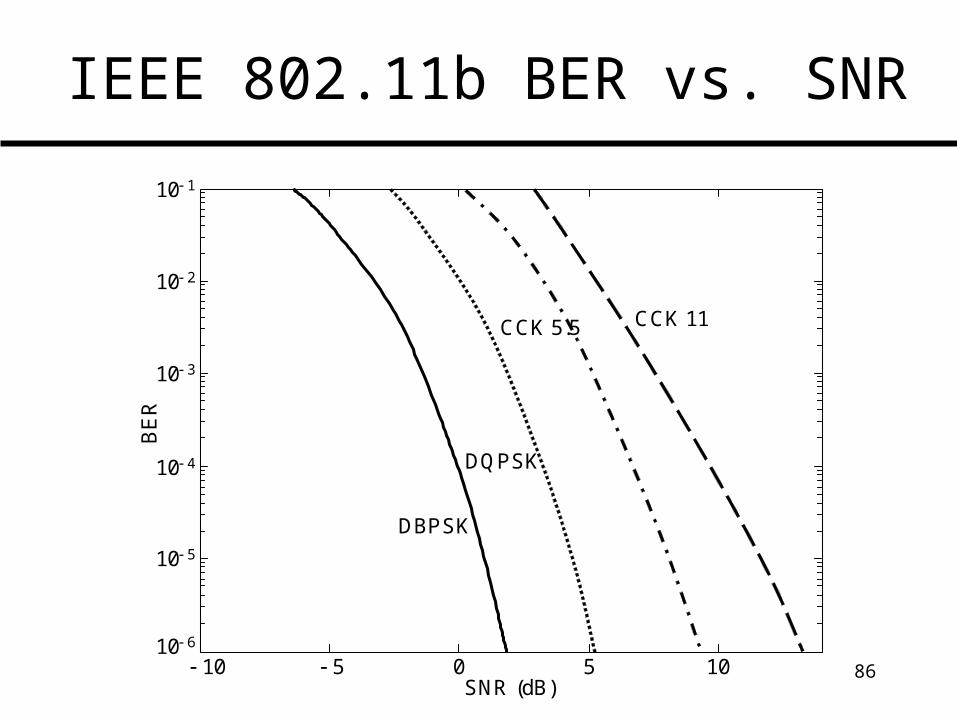
86
IEEE 802.11b BER vs. SNR
SNR (dB) 5 0 5 10 10
10 6
10 5
10 4
10 3
10 2
10 1
BE
R
DBPSK
DQPSK
CCK 5.5 CCK 11
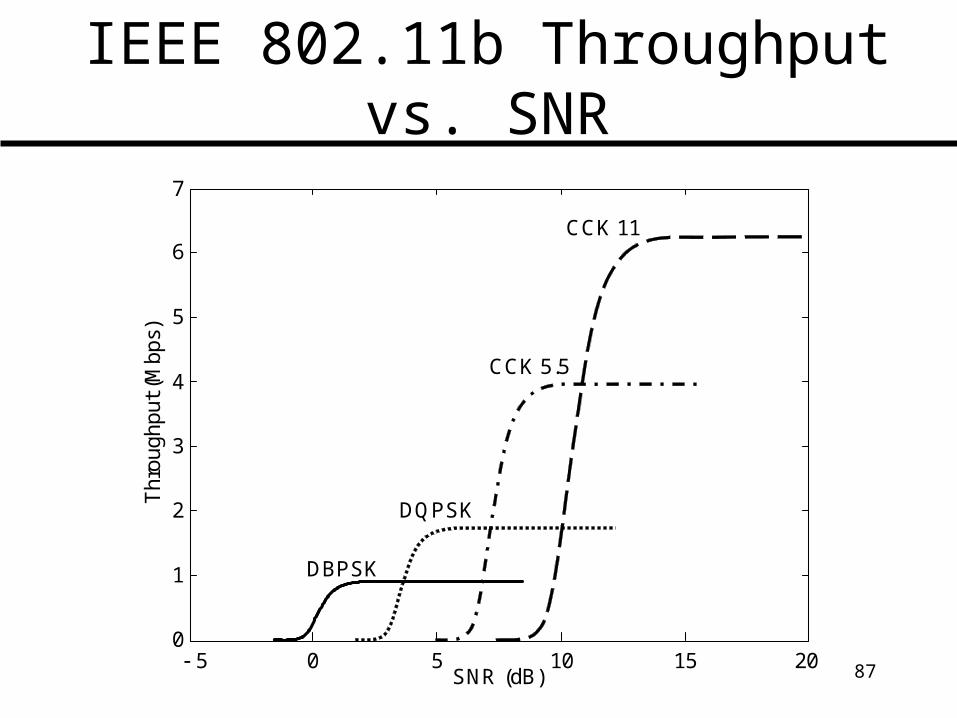
87
IEEE 802.11b Throughput vs. SNR
1
2
3
4
5
6
7
0
SNR (dB)
Thr
ough
put
(Mb
ps)
DBPSK
DQPSK
CCK 5.5
CCK 11
0 5 10 15 5 20
88
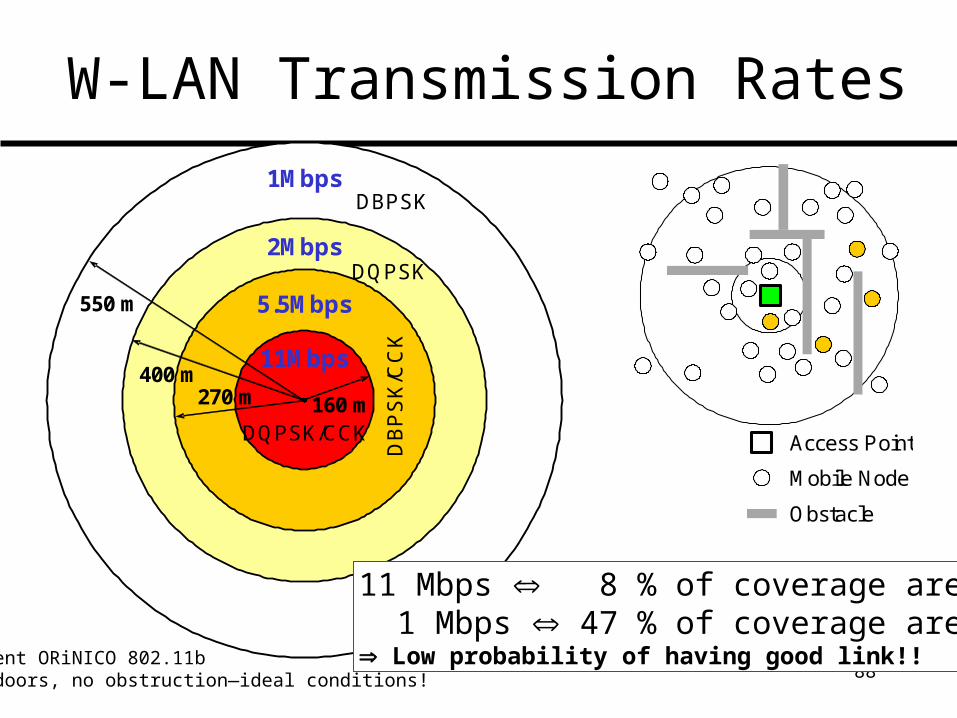
11Mbps
5.5Mbps
2Mbps
1MbpsDBPSK
DQPSK
DQPSK/CCK
DB
PS
K/C
CK
160 m270 m400 m
550 m
W-LAN Transmission Rates
11 Mbps 8 % of coverage area 1 Mbps 47 % of coverage area Low probability of having good link!!Lucent ORiNICO 802.11b
outdoors, no obstruction—ideal conditions!
Access Point
Mobile Node
Obstacle
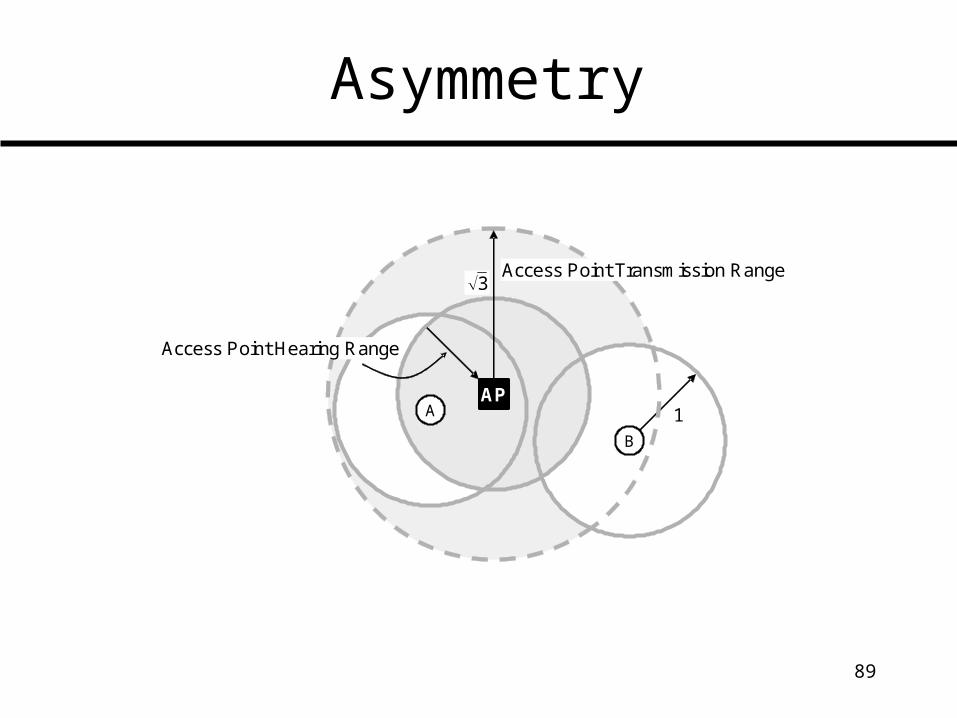
89
Asymmetry
B
A
Access Point Hearing Range
Access Point Transmission Range
AP1
3
90
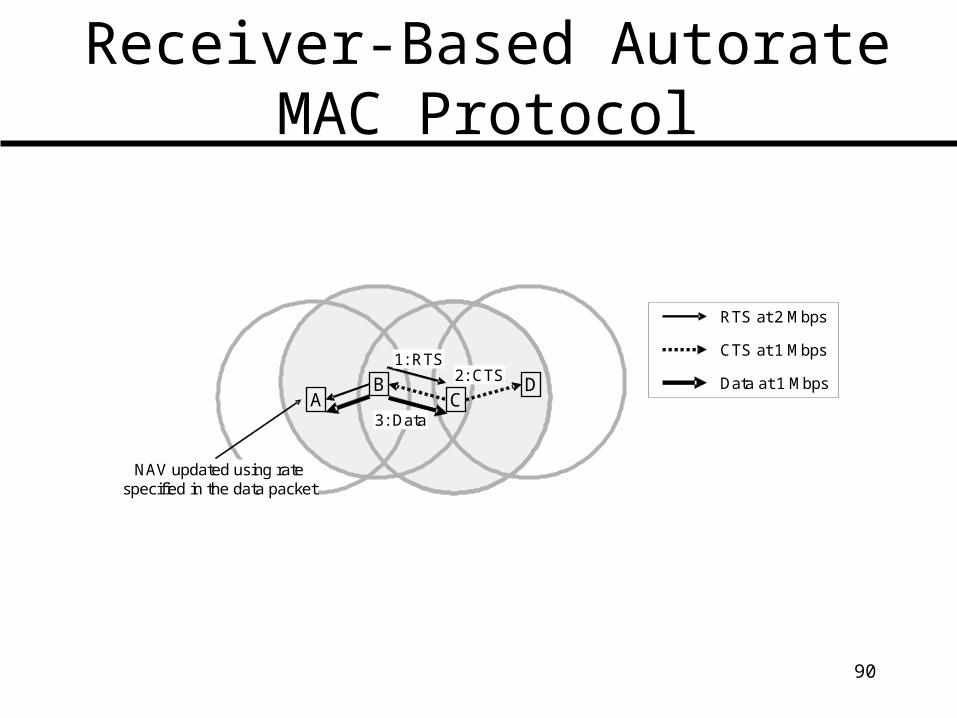
Receiver-Based Autorate MAC Protocol
NAV updated using ratespecified in the data packet
AB
CD
1: RTS2: CTS
3: Data
CTS at 1 Mbps
RTS at 2 Mbps
Data at 1 Mbps

91
IEEE 802.11b Channels
NOTE: The 12 channels in 802.11a do NOT overlap
1:2.
412
2:2.
417
3:2.
422
4:2.
427
5:2.
432
6:2.
437
7:2.
442
8:2.
447
9:2.
452
10:
2.45
7
11:
2.46
2
22 MHz
5 MHz
2.4 GHz 2.483 GHz
92
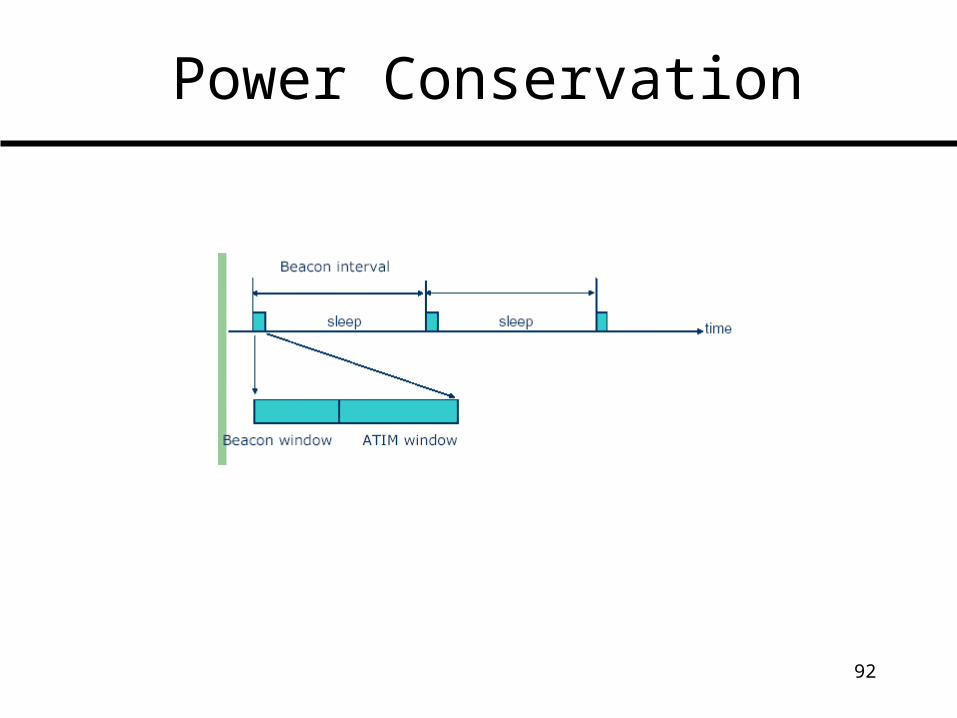
Power Conservation
93
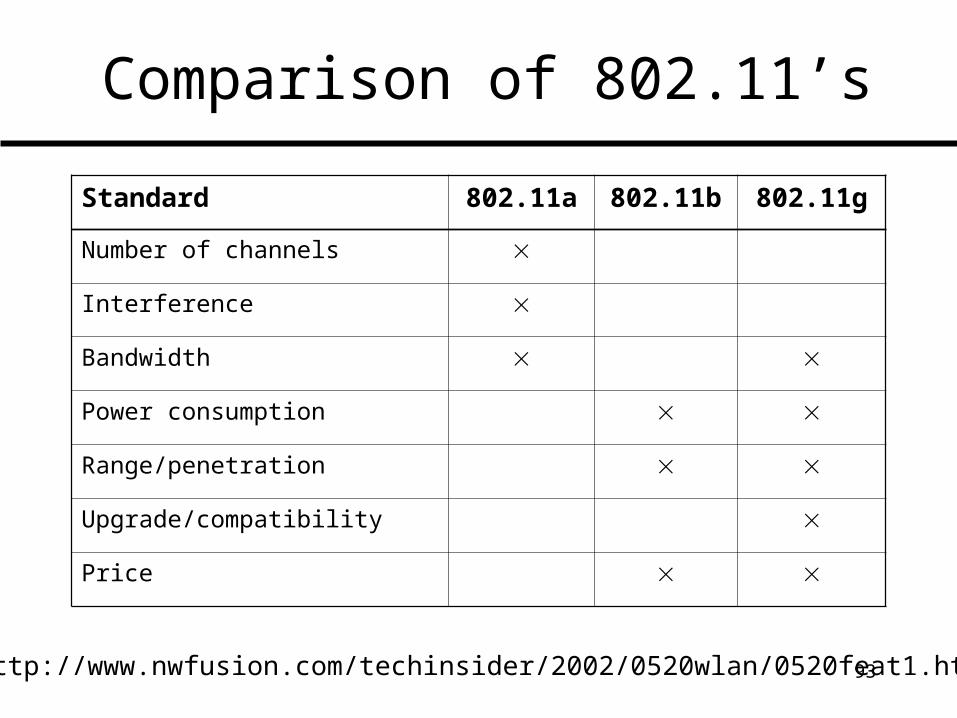
Comparison of 802.11’s
Standard 802.11a 802.11b 802.11g
Number of channels
Interference
Bandwidth
Power consumption
Range/penetration
Upgrade/compatibility
Price
http://www.nwfusion.com/techinsider/2002/0520wlan/0520feat1.html
94
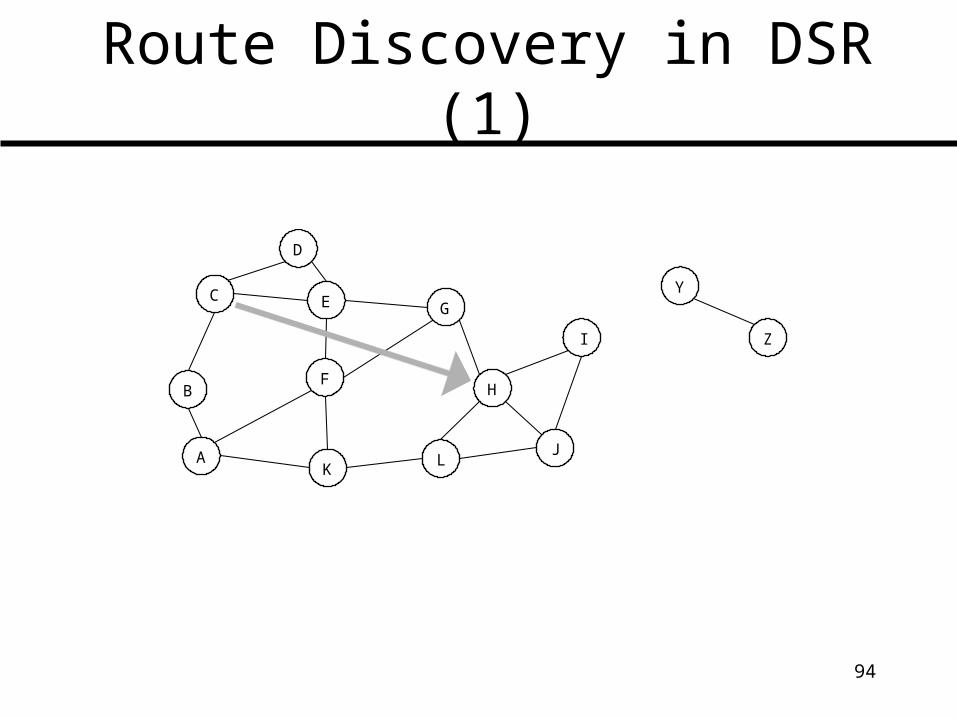
Route Discovery in DSR (1)
FB
D
E G
H
KJ
I
Y
Z
LA
C
95
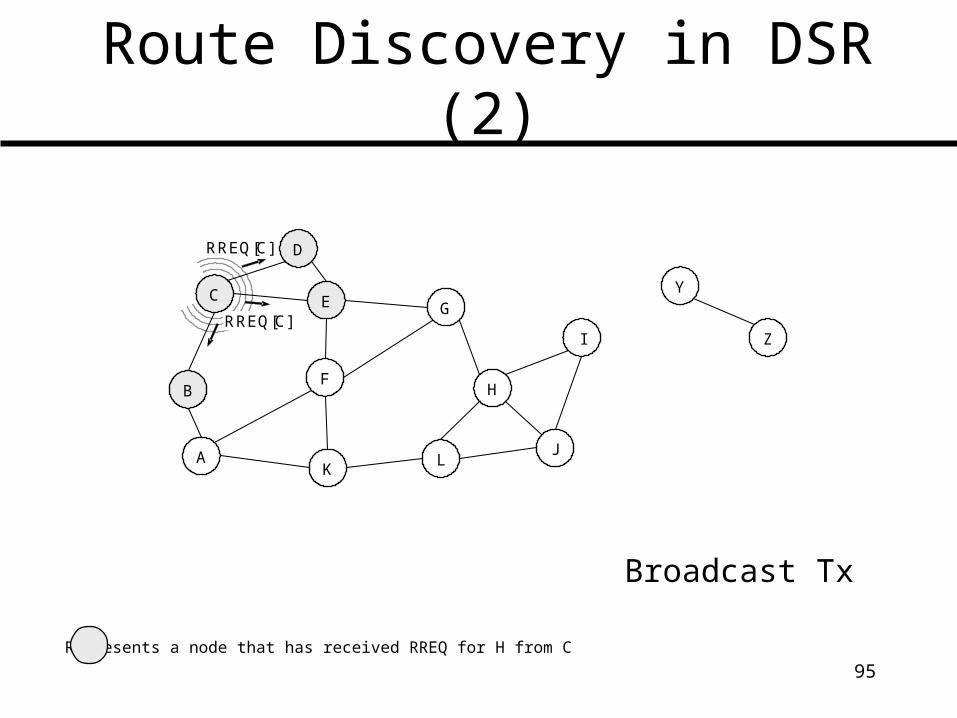
Route Discovery in DSR (2)
Broadcast Tx
Represents a node that has received RREQ for H from C
F
C
B
D
E G
H
KJ
I
Y
Z
LA
RREQ[C]
RREQ[C]
96
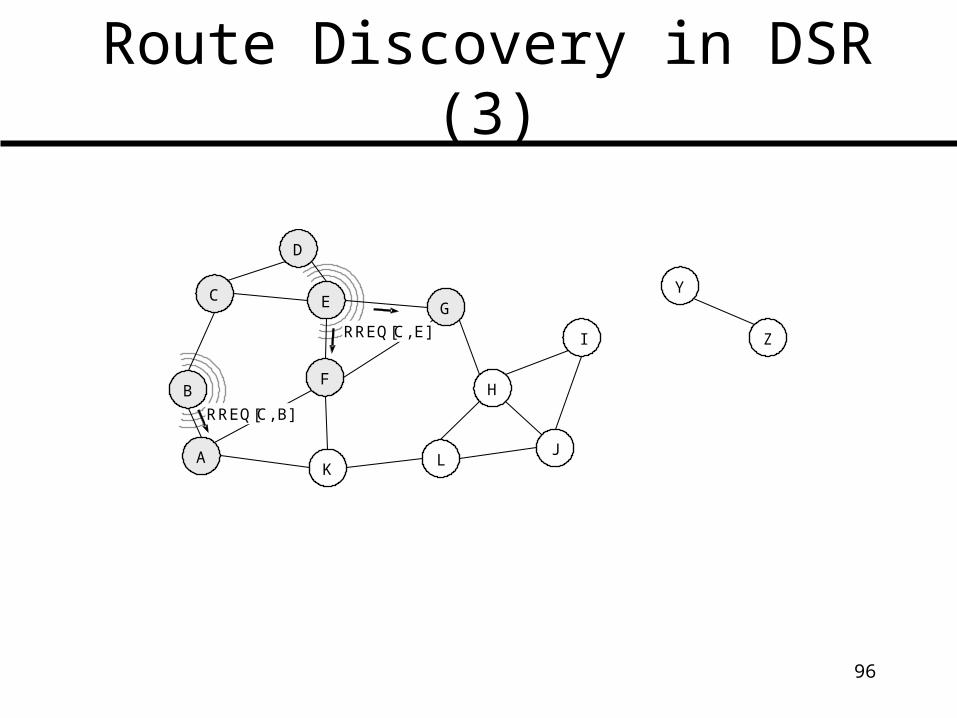
Route Discovery in DSR (3)
F
C
B
D
E G
H
KJ
I
Y
Z
LA
RREQ[C, E]
RREQ[C, B]
97
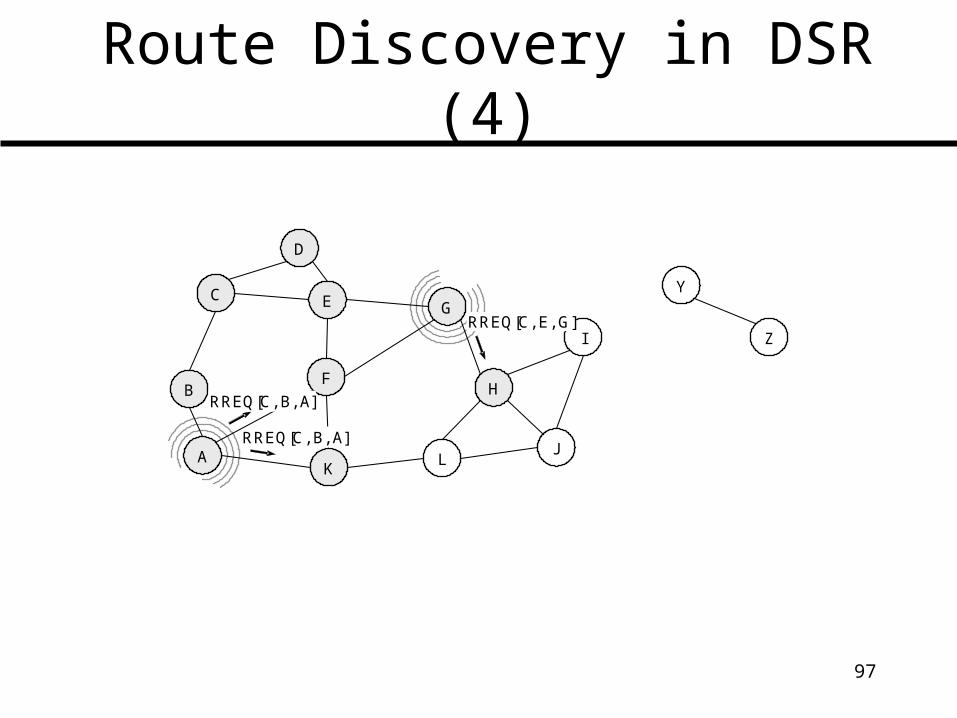
Route Discovery in DSR (4)
F
C
B
D
E G
H
KJ
I
Y
Z
LA
RREQ[C, E, G]
RREQ[C, B, A]
RREQ[C, B, A]
98
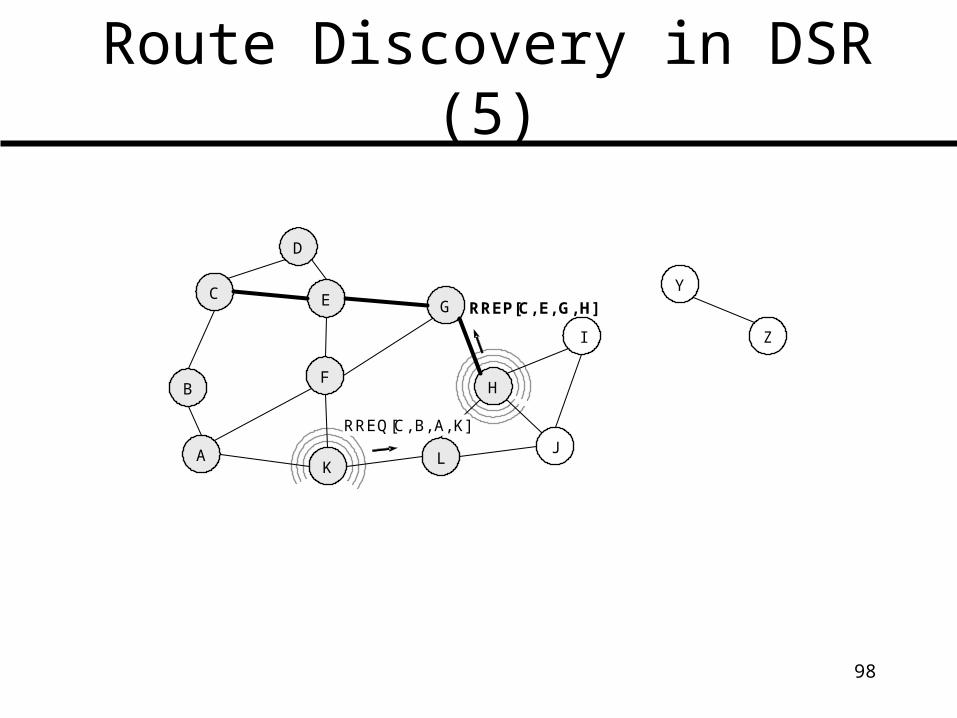
Route Discovery in DSR (5)
F
C
B
D
E G
H
KJ
I
Y
Z
LA
RREP[C, E, G, H]
RREQ[C, B, A, K]
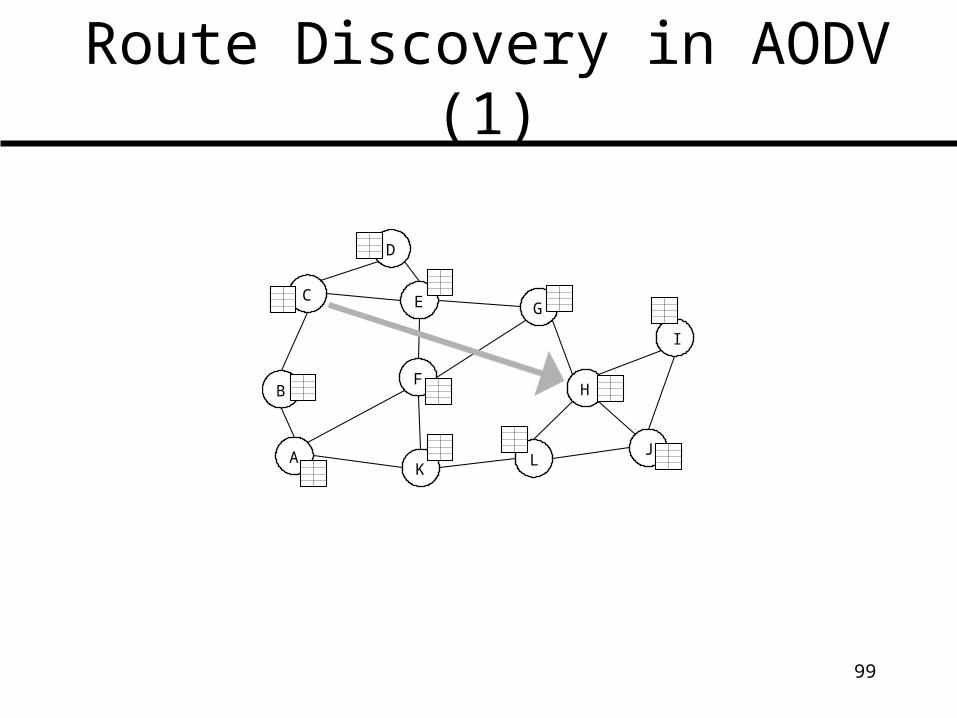
99
Route Discovery in AODV (1)
F
C
B
D
E G
H
KJ
I
LA
100
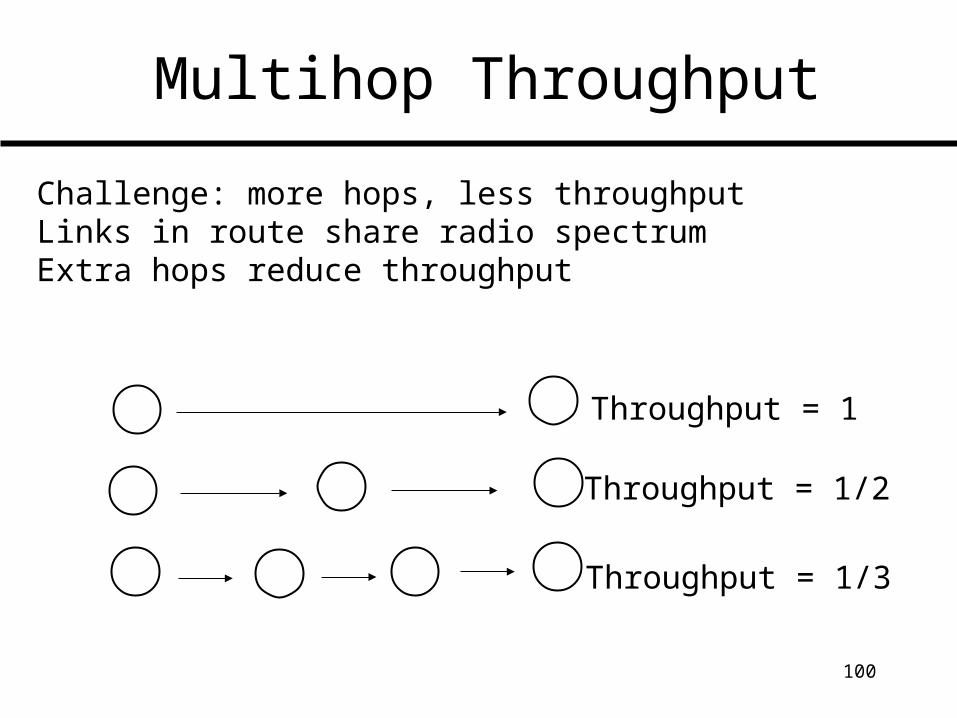
Multihop Throughput
Challenge: more hops, less throughputLinks in route share radio spectrumExtra hops reduce throughput
Throughput = 1
Throughput = 1/2
Throughput = 1/3
101
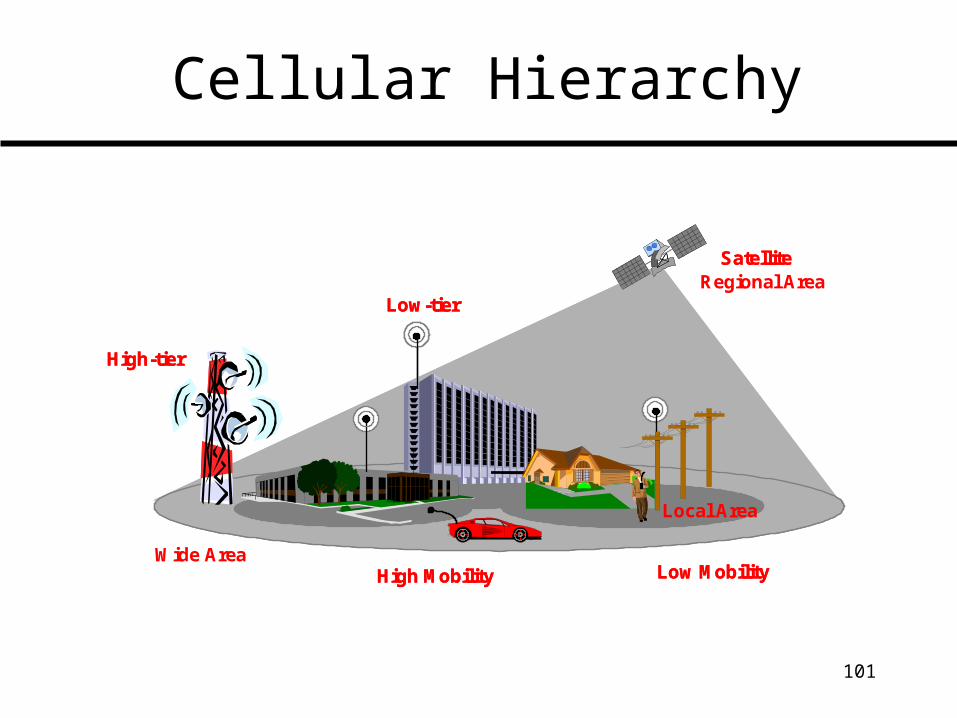
Cellular Hierarchy
High-tier
Low-tier
Satellite
High Mobility Low MobilityWide Area
Regional Area
Local Area
High-tier
Low-tier
Satellite
High Mobility Low MobilityWide Area
Regional Area
Local Area
102
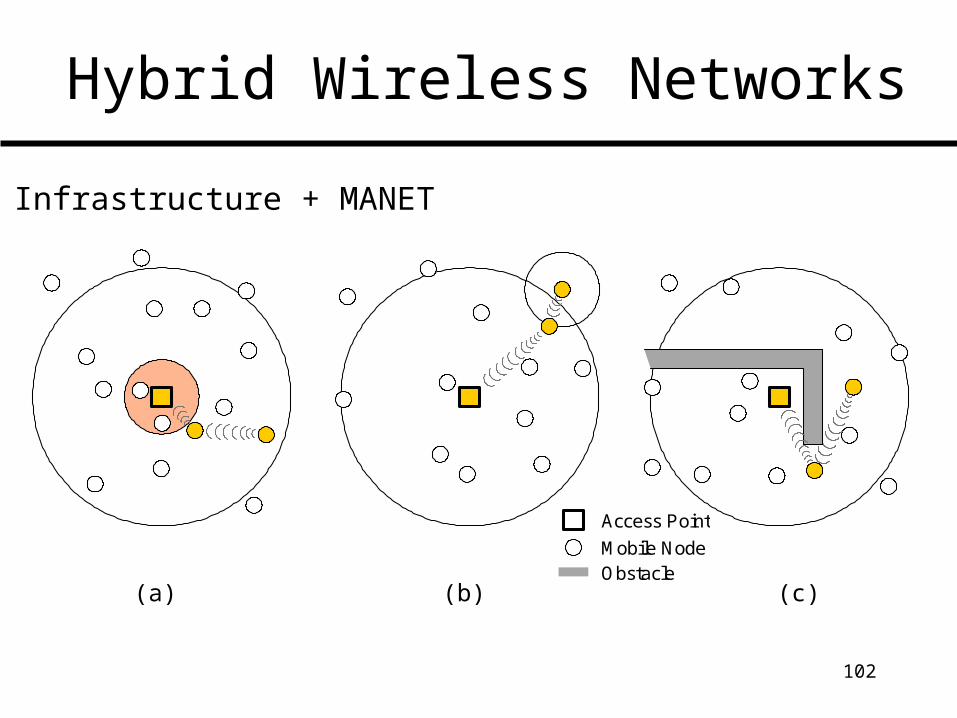
Hybrid Wireless Networks
Infrastructure + MANET
(a) (b) (c)
Access Point
Mobile NodeObstacle
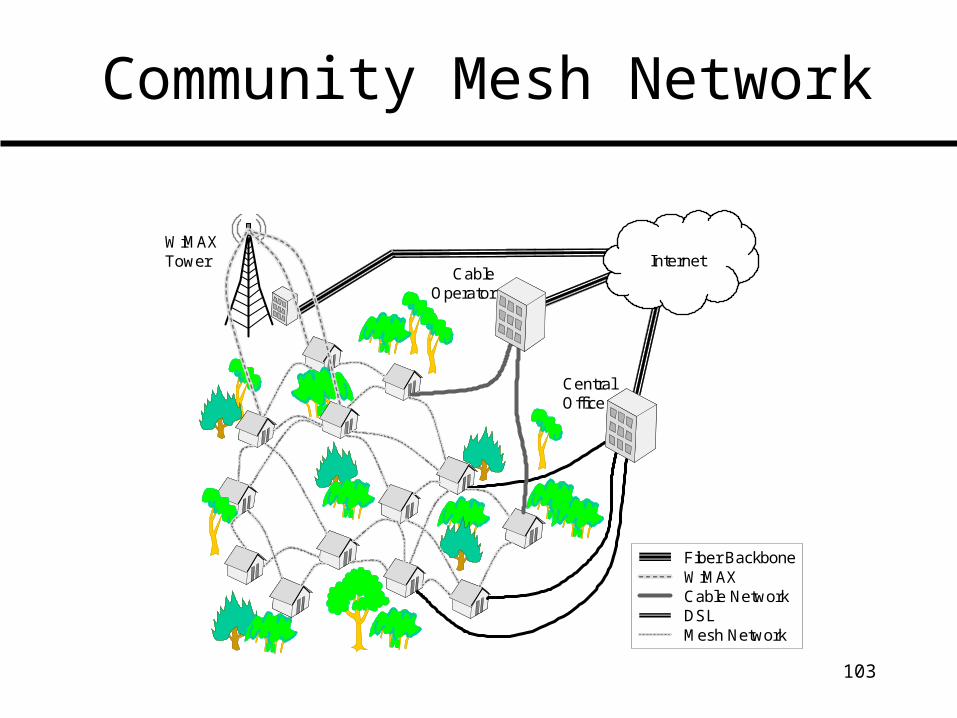
103
Community Mesh Network
WiMAXTower
Mesh NetworkDSLCable NetworkWiMAXFiber Backbone
CableOperator
CentralOffice
Internet