1 virginiaworkshop feb. 28 – mar. 3, 2006 introduction to sites for water resource site analysis
TRANSCRIPT
1
VIRGINIAVIRGINIAWORKSHOPWORKSHOP
Feb. 28 – Mar. 3, 2006Feb. 28 – Mar. 3, 2006
INTRODUCTION to SITESINTRODUCTION to SITESfor
WATER RESOURCE SITE ANALYSIS

2
OBJECTIVEOBJECTIVEDescribe general
range of SITES model application

3
HISTORYHISTORY• Program Developed Over Time by
NRCS
• Spillway Erosion Technology Developed Jointly by ARS and NRCS
• Interface, developed to provide a user-
friendly environment

4
SITES ? ? ?SITES ? ? ?• Watershed Rainfall-Runoff
• Reservoir Routing– Principal spillway rating– Auxiliary spillway rating– NRCS dam design features
• Earth Spillway Analysis
• Complex Watersheds– Upstream sites and subwatersheds– Reach routing

5
TYPICAL DAM TYPICAL DAM XSECTIONXSECTION
OUTLET STRUCTIRE
PSH
SDH

6
SITES Model Spwy stability/Composed of sub models integrity
&Precipitation rain Loss runoff Transformation inflow Reservoir routingModel Model Model Modelsinput: input: input: input: -rainfall amount -CN as a -DA -given/proposed Outflow -rainfall distribution function of soils -Tc S-S-D and land use -UH -Spwy parameters
Reach routingModelinput: -x-sec data
SITES ModelSITES Model

7
HISTORYHISTORY• Program Developed Over Time by NRCS
• Spillway Erosion Technology Developed
• Jointly by ARS and NRCS
• Interface, developed to provide a • user-friendly environment

8
ERODED SPILLWAYERODED SPILLWAY

9
LABORATORY SPILLWAY MODELLABORATORY SPILLWAY MODEL

10
Auxiliary Spillway ProfileAuxiliary Spillway Profile
InletNaturalGround
ConstructedInlet Channel Constructed
Exit Channel
Exit Natural Ground
Tie
Sta
.
Flow

11
SITES STABILITY SITES STABILITY ANALYSISANALYSIS
•TECHNOLOGY OPTIONSTECHNOLOGY OPTIONS• PERMISSIBLE VELOCITYPERMISSIBLE VELOCITY• ALLOWABLE STRESSALLOWABLE STRESS

12
Old TR-60 Table 7-1 had corrections for Old TR-60 Table 7-1 had corrections for Permissible Velocities.Permissible Velocities.
10% for not more than once in 50 years 10% for not more than once in 50 years andand
25% for not more than once in 100 years.25% for not more than once in 100 years.
To make stress on an equal footing as To make stress on an equal footing as velocity the same type of correction velocity the same type of correction needs to be made. Stress is proportional needs to be made. Stress is proportional to the square of the velocity.to the square of the velocity.
1 in 50 (1.10)1 in 50 (1.10)2 2 = 1.21 say a 20% increase= 1.21 say a 20% increase
1 in 100 (1.25)1 in 100 (1.25)22 = 1.5625 say a 50% = 1.5625 say a 50% increaseincrease

13
The new TR-60 p 7-3 (2005) The new TR-60 p 7-3 (2005) stability requirements for stability requirements for vegetated spillways has been vegetated spillways has been revised. The allowable velocity revised. The allowable velocity table has been removed and table has been removed and allowable stress is now required. allowable stress is now required. The stress is to be determined by The stress is to be determined by the use of AH-667 with the the use of AH-667 with the following adjustments:following adjustments:
Once in 50 years 20% increase in Once in 50 years 20% increase in stressstress
Once in 100 years 50% increase in Once in 100 years 50% increase in stressstress

14
• BARE EARTH e=ds
EFFECTIVE STRESSEFFECTIVE STRESS

15
EFFECTIVE STRESSEFFECTIVE STRESS
• VEGETATIONVEGETATION
e= ds (1-Cf) (ns/n)2

16
Note:If Cf = 0.9 then (1-Cf) = 0.1andif Cf = 0.8 then (1-Cf) = 0.2 ===> this is a 100% increase in effective stress.From soil grain roughnessif ns = 0.0156 & n = 0.040 D75 = 0.05”(ns/n)2 = 0.1514A 100% increase from a change in soil roughness requires a D75 = 0.40”

17
MAINTENANCE CODEMAINTENANCE CODE
1 - UNIFORM COVER OR 1 - UNIFORM COVER OR SURFACESURFACE
2 - MINOR DISCONTINUITIES2 - MINOR DISCONTINUITIES
3 - MAJOR DISCONTINUITIES3 - MAJOR DISCONTINUITIES

18
SITES AUXILIARY SITES AUXILIARY SPILLWAYSPILLWAY
STABILITY ANALYSISSTABILITY ANALYSIS
• BASED ON PEAK OF SDHBASED ON PEAK OF SDH• APPLIED TO EXIT CHANNELAPPLIED TO EXIT CHANNEL• VELOCITY OR STRESS calculationsVELOCITY OR STRESS calculations

19
MASS MOVEMENTMASS MOVEMENT

20
SPILLWAY EROSION SPILLWAY EROSION PHASESPHASES
INTEGRITY ANALYSISINTEGRITY ANALYSIS
1. SURFACE EROSION 1. SURFACE EROSION (Cover Destruction)
2. CONCENTRATED FLOW EROSION2. CONCENTRATED FLOW EROSION
3. HEADCUT ADVANCE3. HEADCUT ADVANCE

21
COVER FAILURE INITIATIONCOVER FAILURE INITIATION

22
HEADCUTHEADCUT

23
EXPANDING HEADCUTEXPANDING HEADCUT

24
SPILLWAY GEOLOGYSPILLWAY GEOLOGY
STATION
EL
EV
AT
ION
, ft
, ft
25
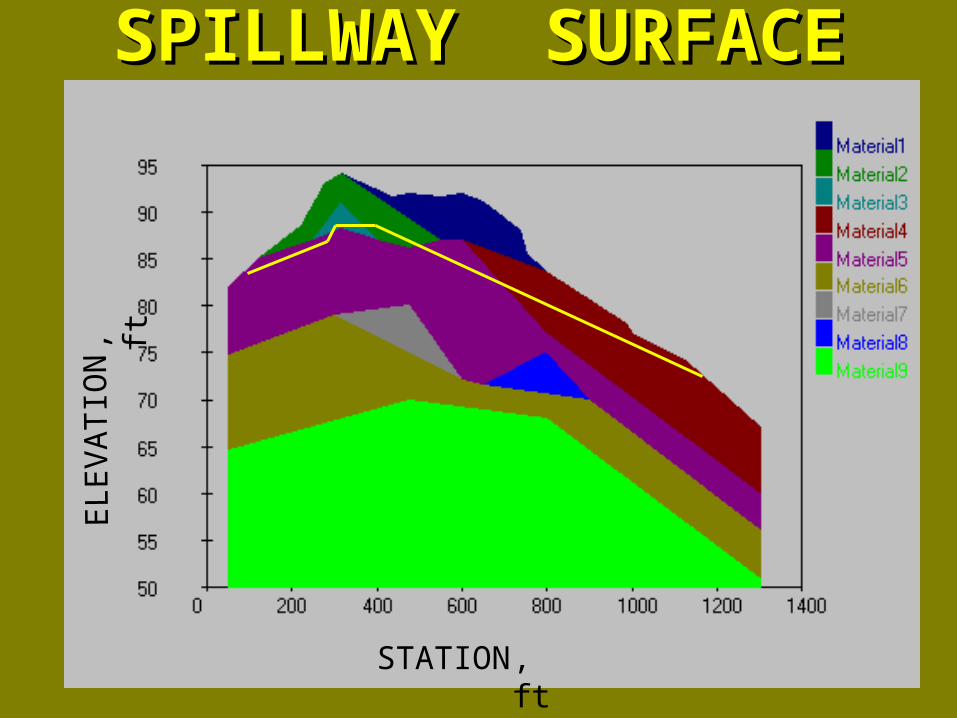
SPILLWAY SURFACESPILLWAY SURFACE
STATION
EL
EV
AT
ION
, ft
, ft

26
ERODED PROFILEERODED PROFILEE
LE
VA
TIO
N
STATION, ft
, ft
ERODED AREA

27
HISTORYHISTORY• Program Developed Over Time by NRCS
• Spillway Erosion Technology Developed • Jointly by ARS and NRCS
• Interface developed to provide a • user-friendly operating
environment

28
How the Program How the Program WorksWorks
29
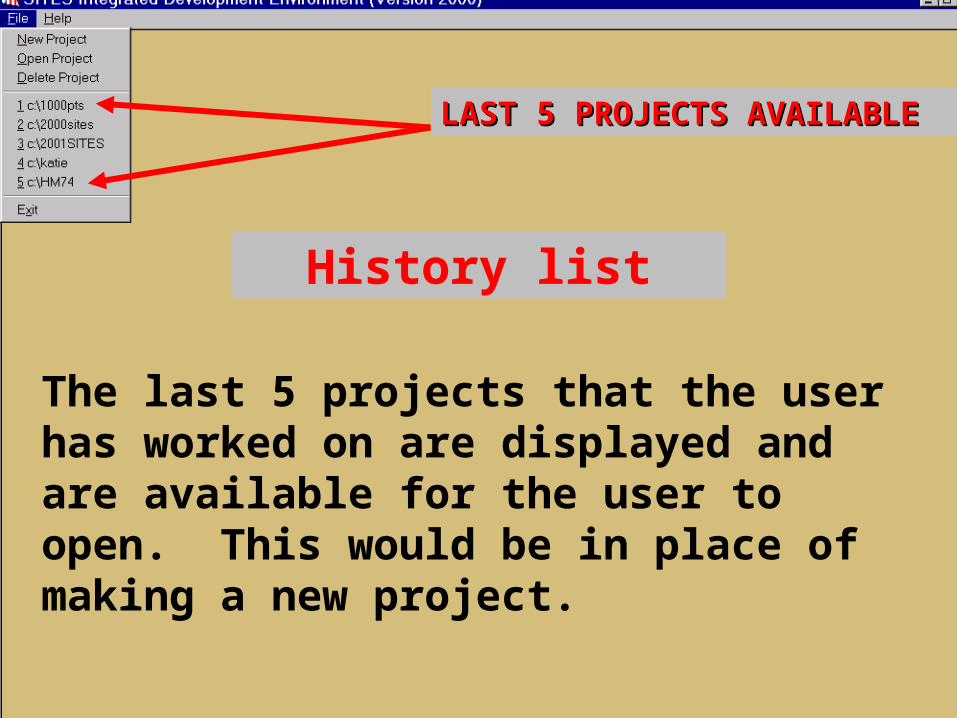
History list
LAST 5 PROJECTS LAST 5 PROJECTS AVAILABLEAVAILABLE
The last 5 projects that the user has worked on are displayed and are available for the user to open. This would be in place of making a new project.

30

31
After you are After you are in your project in your project directory you directory you choose to choose to make a new make a new file, import a file, import a file, or open file, or open an existing an existing file.file.

32
Here we choose the Here we choose the type of site or type of site or hydrologic data hydrologic data options we want to options we want to use to design or use to design or analyze the site. In analyze the site. In this case a 378 site.this case a 378 site.

33
User selects elements to User selects elements to develop a watershed develop a watershed schematic. We will just be schematic. We will just be using a single site.using a single site.

34
In this case just a single structure.
SYMBOL FOR STRUCTURE

35
All of the All of the watershed watershed elements are elements are shown for an shown for an example example series series model.model.

36
Watershed Watershed information screeninformation screen

37
Structure Data Structure Data Table screenTable screen

38
39
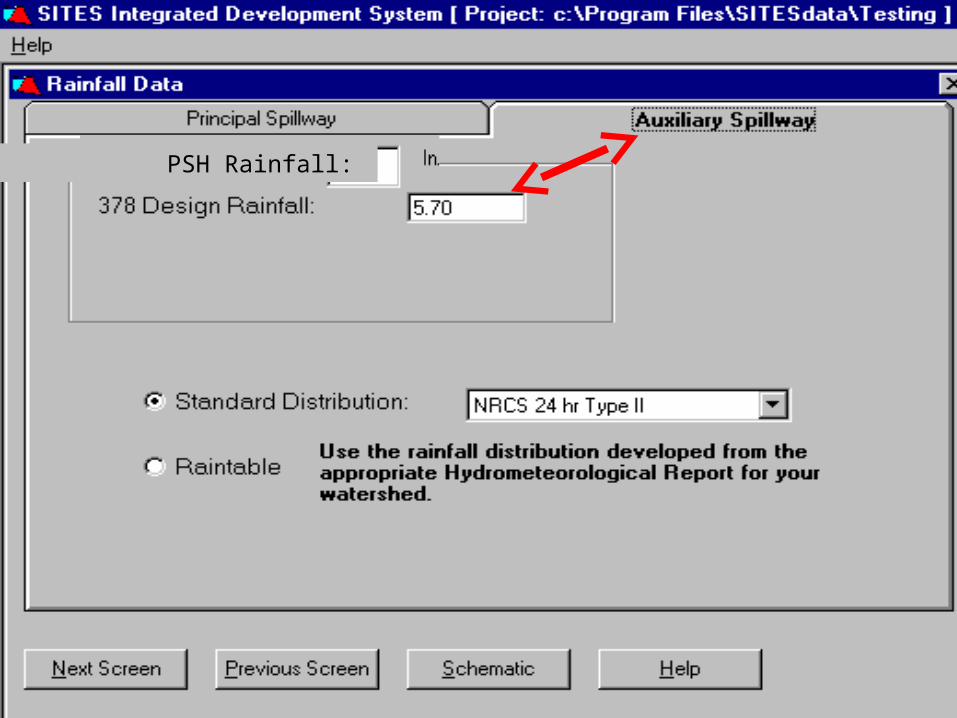
PSH Rainfall:

40

41

42
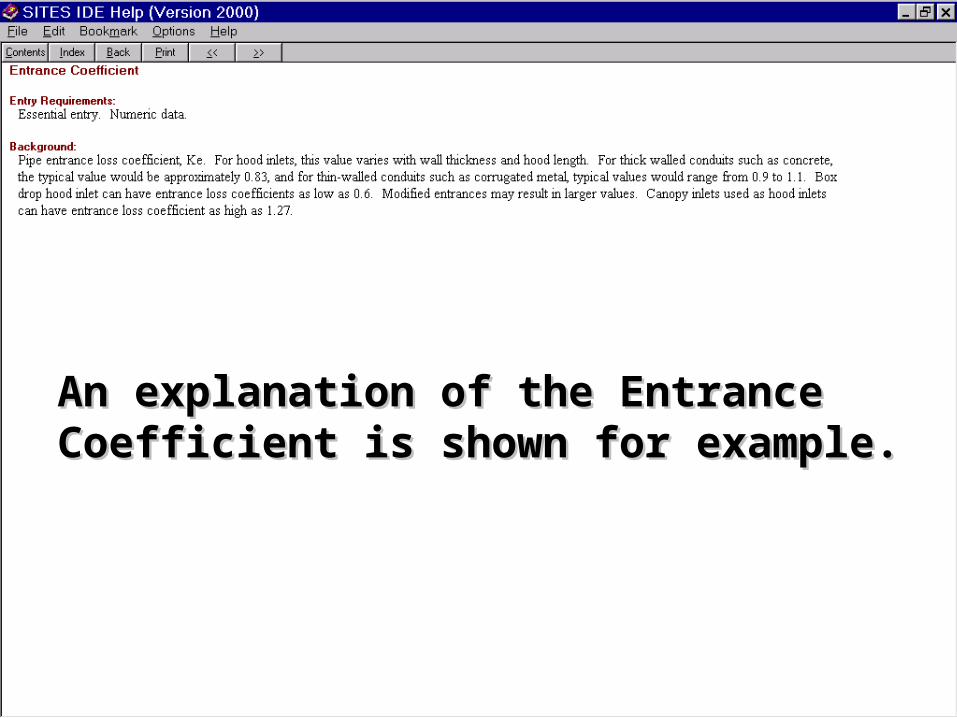
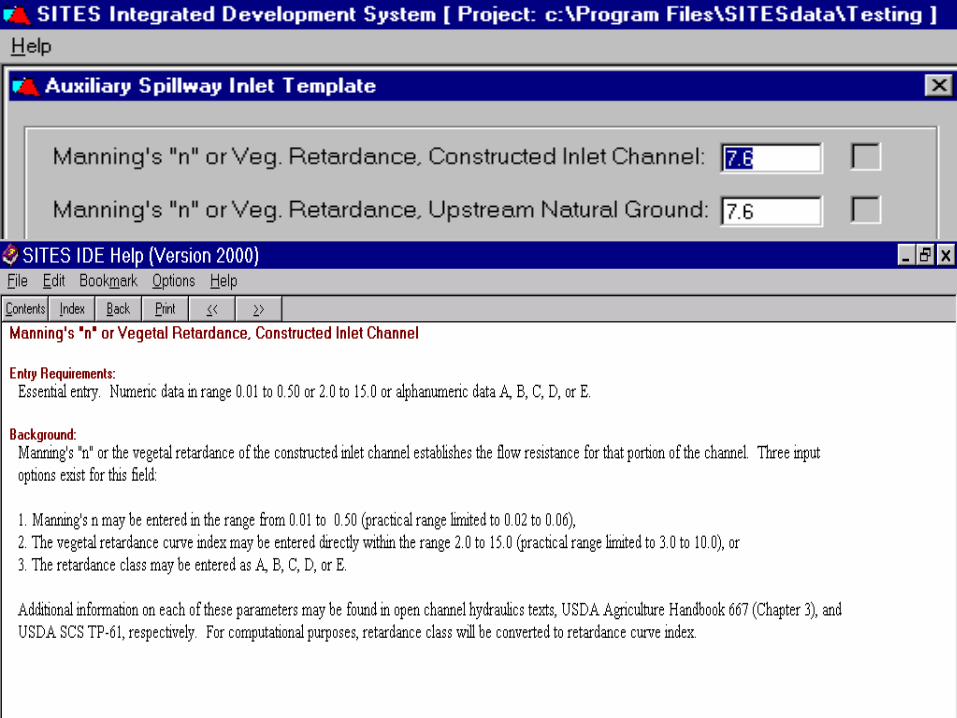
Help is available by screen Help is available by screen for every data fieldfor every data field
43
An explanation of the Entrance An explanation of the Entrance Coefficient is shown for example.Coefficient is shown for example.

44

45

46

47
Auxiliary Spillway ProfileAuxiliary Spillway Profile
InletNaturalGround
ConstructedInlet Channel Constructed
Exit Channel
Exit Natural Ground
Tie
Sta
.
Flow
48

49
130 ft upstm & 2 ft below crest

50

51

52

53
54
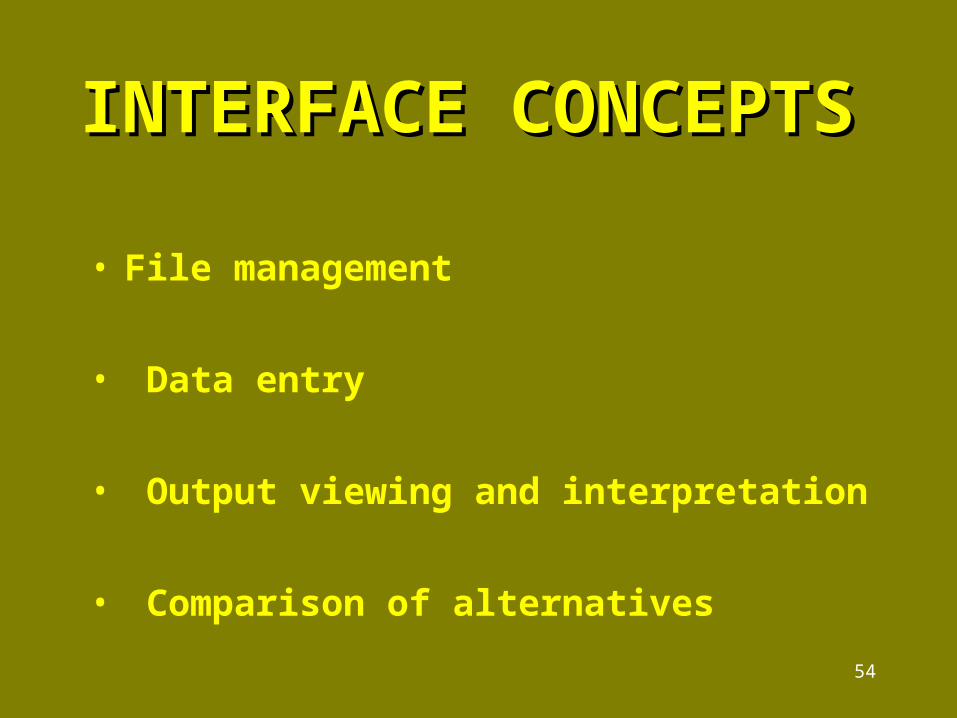
INTERFACE CONCEPTSINTERFACE CONCEPTS
• File management
• Data entry
• Output viewing and interpretation
• Comparison of alternatives
55
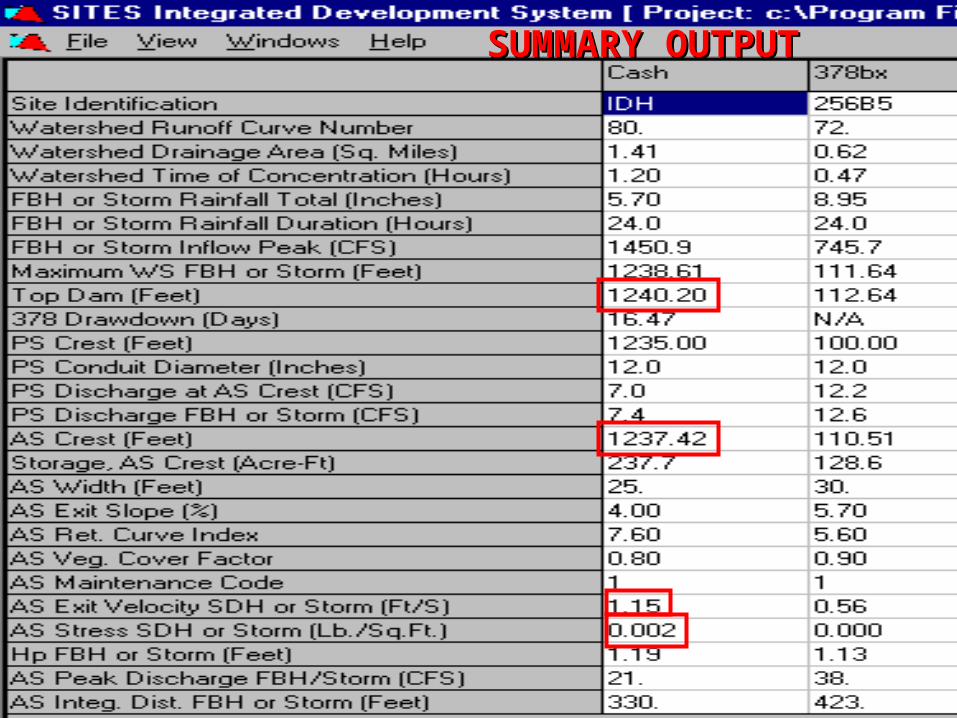
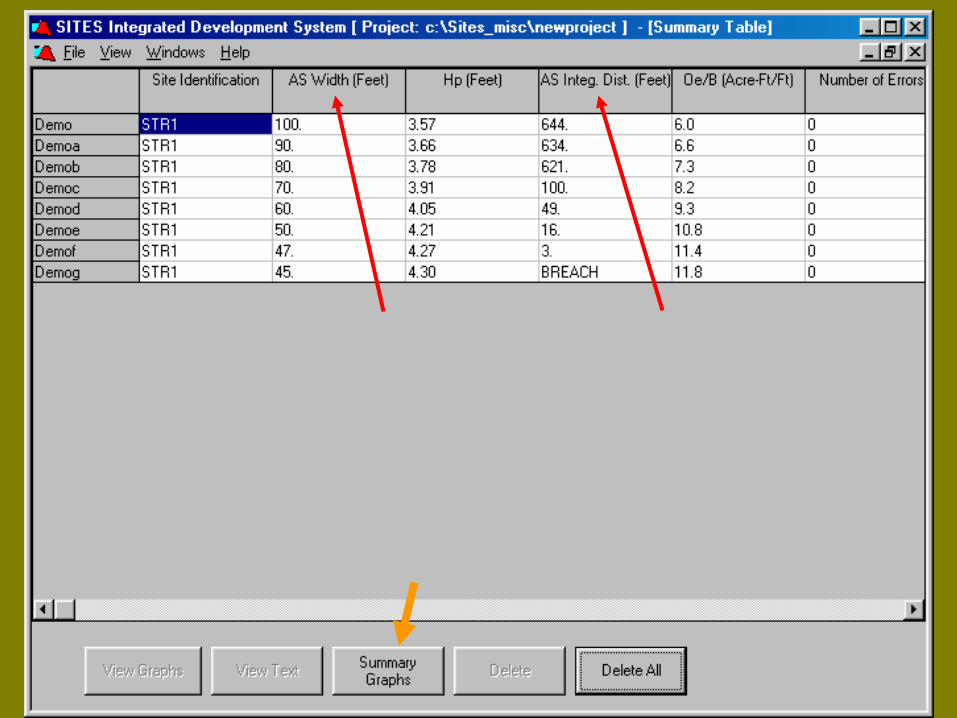
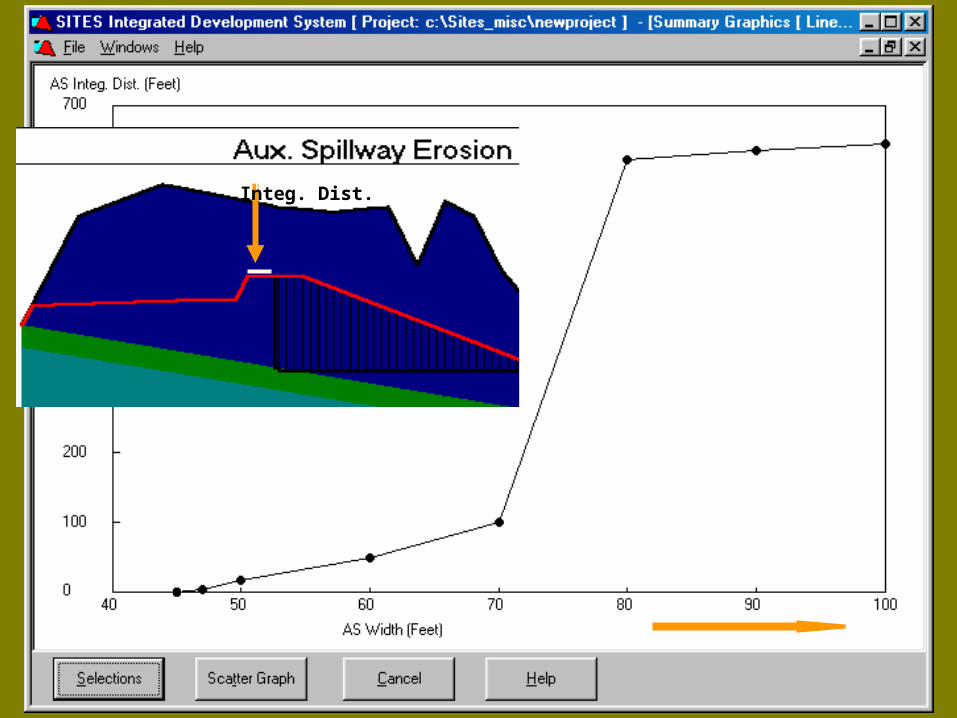
SUMMARY OUTPUTSUMMARY OUTPUT

56

57

58
59
60
Integrity DistanceInteg. Dist.

61
Checks IncludeChecks Include• Completeness - Is the data
there?• Consistency - Is the data
reasonable?

62
ADDITIONAL CHECKSADDITIONAL CHECKS• Is the output reasonable?• Do the results make sense?
Sites is a
great
program
63
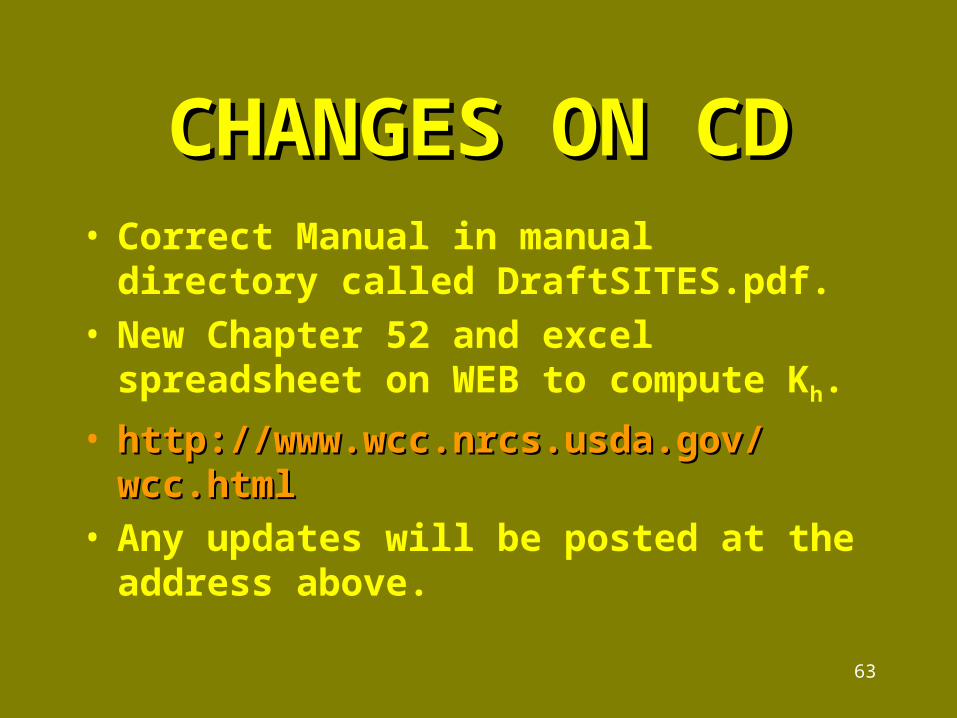
CHANGES ON CDCHANGES ON CD• Correct Manual in manual directory
called DraftSITES.pdf.• New Chapter 52 and excel
spreadsheet on WEB to compute Kh.
• http://www.wcc.nrcs.usda.gov/http://www.wcc.nrcs.usda.gov/wcc.htmlwcc.html
• Any updates will be posted at the address above.

64
The Water Resource Site The Water Resource Site Analysis (SITES) software is an Analysis (SITES) software is an
engineering tool.engineering tool.
Not a replacement for sound engineering.

65
END OF PRESENTATION END OF PRESENTATION