1 use of standard medication charts ... - bmj quality & safety · web viewthe safety and...
TRANSCRIPT
Development and evaluationof a new chart for subcutaneous insulin administration inacute care settings
April 2017
Contents
Published by the Australian Commission on Safety and Quality in Health CareLevel 5, 255 Elizabeth Street, Sydney NSW 2001
Phone: (02) 9126 3600Fax: (02) 9126 3613
Email: [email protected] Website: www.safetyandquality.gov.au
ISBN: 978-1-925224-89-4
© Australian Commission on Safety and Quality in Health Care 2017
All material and work produced by the Australian Commission on Safety and Quality in Health Care is protected by copyright. The Commission reserves the right to set out the terms and conditions for the use of such material.
As far as practicable, material for which the copyright is owned by a third party will be clearly labelled. The Australian Commission on Safety and Quality in Health Care has made all reasonable efforts to ensure that this material has been reproduced in this publication with the full consent of the copyright owners.
With the exception of any material protected by a trademark, any content provided by third parties, and where otherwise noted, all material presented in this publication is licensed under a Creative Commons Attribution-NonCommercial-NoDerivatives 4.0 International Licence.
Enquiries regarding the licence and any use of this publication are welcome and can be sent to [email protected].
The Commission’s preference is that you attribute this publication (and any material sourced from it) using the following citation:
Australian Commission on Safety and Quality in Health Care. Development and evaluation of a new chart for subcutaneous insulin administration in acute care settings. Sydney: ACSQHC; 2017
Disclaimer
The content of this document is published in good faith by Australian Commission on Safety and Quality in Health Care (the Commission) for information purposes. The document is not intended to provide guidance on particular health care choices. You should contact your health care provider on particular health care choices.
The Commission does not accept any legal liability for any injury, loss or damage incurred by the use of, or reliance on, this document.
Development and evaluation of a new chart for subcutaneous insulin administration in acute care settings 1

1 Use of standard medication charts in hospitals 2
2 Method 52.1 Design 6
2.2 National Insulin Form Project Advisory Group 7
2.3 Heuristic analysis 7
2.4 Consultation 7
2.5 Piloting 7
2.6 Evaluation 7
3 Results 83.1 Combined hospital data 9
Changes associated with use of the chart 9
Patient identification and blood glucose level documentation 9
Routine insulin prescriptions 10
Supplemental insulin prescriptions 10
Stat/phone insulin prescriptions 10
Subcutaneous sliding scale insulin prescriptions 10
Use of charts in hospitals 10
Blood glucose control 11
Insulin prescribing and administration 12
3.2 Individual hospitals 12
Blood glucose control 12
Insulin prescribing and administration 13
4 Rationale and conclusion 144.1 Rationale for the adoption of the chart 15
4.2 Conclusions 15
5 Recommendations 16
6 Appendices 18Appendix 1 NIFPAG members 19
Appendix 2 Participating hospitals 20

Use of standard medication charts in hospitals
Development and evaluation of a new chart for subcutaneous insulin administration in acute care settings 2

Key points
The Australian Commission on Safety and Quality in Health Care (the Commission), through its clinical safety networks, identified the need for a national standard insulin chart.
The Commission was approached by several states and territories, and individual public and private hospitals, suggesting that blood glucose level (BGL) control in hospitals is a national safety and quality issue.
The Commission piloted a series of insulin charts over the course of the project to develop a national subcutaneous insulin chart.
Standard medication charts are known to reduce error and harm associated with medication errors, including errors and harm involving the use of insulin, which is classified as a high-risk medicine.
The Commission was approached by several states and territories, and individual public and private hospitals, suggesting that BGL control in hospitals is a national safety and quality issue. Poor glycaemic control, inadequate glucose monitoring and hypoglycaemia occur commonly and can compromise the outcome of a patient’s illness or procedure. A well designed national insulin and BGL monitoring chart should reduce the risk of error when prescribing insulin, and improve patient outcomes and professional practice.
The Commission, through its clinical safety networks, identified the need for a national standard insulin chart as part of the medication safety program.
Optimal use of insulin requires careful recording of BGLs. Patients in acute care hospitals are subject to unstable BGLs. This can be caused by changes to dietary intake or access to food, periods of fasting, stress due to infection or surgery and treatment with medicines like corticosteroids. Control of BGLs may require insulin, or increase a patient’s need for insulin.
Since 2008, the Commission has received requests to develop a national, standardised insulin chart that:
Reduces the risk of harm to people with insulin needs in hospitals
Assists junior and inexperienced prescribers and other clinicians.
A standard national subcutaneous insulin chart could reduce the opportunity for error associated with the prescribing and administering of insulin. This would be achieved through:
Improved BGL recording The ability to readily access and review recorded
BGL or insulin data Improved accuracy and legibility of this data The provision of safety alerts and
management guidelines.
The Commission’s work in medication standardisation has developed, in part, from its responsibility for maintaining the National Inpatient Medication Chart (NIMC). When the Australian Health Ministers’ Advisory Council (AHMAC) recommended the NIMC for national use in late 2007, it was acknowledged that specialist charts would be required to supplement the NIMC. This is reflected on the front page of the NIMC, where an ‘additional chart’ section indicates to prescribers that patients may require additional charts.
The Commission piloted a series of insulin charts over the course of the national subcutaneous insulin chart project. The project was overseen by the National Insulin Form Pilot Advisory Group (Appendix 1).
3 Australian Commission on Safety and Quality in Health Care

1 Use of standard medication charts in hospitals
This report highlights the work that has been done as part of the insulin chart project. Results from the initial pilot of the national insulin chart in 2015 suggested that design work and further piloting were required to improve the utility of the chart.
Section 2 of this report describes how the chart was developed.
Section 3 of this report focuses on the outcomes of a second phase of piloting in acute care hospitals in 2016 of the redesigned national subcutaneous insulin chart.
Section 4 describes the conclusions and rationale for the national chart, and Section 5 recommends associated work for optimal implementation of the chart.
Development and evaluation of a new chart for subcutaneous insulin administration in acute care settings 4

2 Method
Method
5 Australian Commission on Safety and Quality in Health Care

Key points
Development of a national insulin chart was based on the Queensland Department of Health hospital subcutaneous insulin chart.
The national subcutaneous insulin chart brings together the essential information required to manage the glycaemic treatment of hospitalised patients, including people with diabetes.
An expert group provided technical advice and oversight to the chart project. An updated insulin chart was piloted in six hospitals in Queensland, Victoria and the Australian Capital Territory. Data were collected at the hospitals at two points in time – before the introduction of the subcutaneous insulin chart (pre-audit), and on completion of the pilot phase (post-audit).
Two phases of piloting informed the development of the national subcutaneous insulin chart, in 2015 and 2016. Results from piloting of an earlier version of the chart in 2015 led to redesign of some areas of the chart. This report describes results for the second pilot.
The national subcutaneous chart was based on the chart developed by the Queensland Department of Health. The chart was modified and improved through several iterations using expert group advice and review, heuristic analysis, consultation and hospital piloting.
The hospital pilot study hypothesised that the use of a standardised chart for recording BGLs, prescribing and administering subcutaneous insulin, when combined with planned education and implementation:
Reduces opportunities for error in subcutaneous insulin prescribing and administration
Does not result in inferior blood glucose control.
2.1 DesignThe Queensland Health chart was the basis for the development of a national insulin chart.
In October 2014, the Commission appointed human factors experts at the School of Psychology, University of Queensland, to develop a subcutaneous insulin chart. Development of the chart incorporated best human factors practice, information from the previous pilot, and human factors expertise and experience with hospital medication charts.
The national subcutaneous insulin chart brings together essential patient information to facilitate the improved glycaemic management of hospitalised patients. Specifically, the national subcutaneous insulin chart is designed to:
Link the prescribing of subcutaneous insulin with administration and recorded BGLs
Provide forcing functions to reduce the use of non-standard abbreviations and non-standard dosing regimens
Provide guidelines for action to be taken in the event of BGLs reaching levels that indicate that the medical officer should be alerted and action taken
Prompt daily review and adjustment of insulin doses in response to BGLs.
Development and evaluation of a new chart for subcutaneous insulin administration in acute care settings 6

2 Method
2.2 National Insulin Form Project Advisory Group
An expert group was formed to provide technical advice and oversight to the chart project. The National Insulin Form Project Advisory Group (NIFPAG), met over the course of the project. The group provided advice to the Commission on the design of the chart, the pilot process and the evaluation of the data gathered during the pilot. NIFPAG membership is shown in Appendix 1.
2.3 Heuristic analysisThe University of Queensland developed a heuristic evaluation protocol specifically tailored for insulin forms.
Questions specific to the insulin chart were developed that focused on:
General issues such as:
- page layout
- information layout
- font
- colour scheme
- cognitive load
- language
- other
Actions and alerts such as:
- identification and demographics
- BGL frequency and notification instructions
- additional instructions
- documenting the diet
- documenting BGLs
- responding to suboptimal BGLs
- ordering routine insulin
- ordering supplemental insulin and determining the dose to be administered
- ordering stat/phone insulin
- administering insulin and documentation
- ceasing orders
- general concerns.
2.4 ConsultationStakeholders were asked to review the new insulin chart using the heuristic analysis method developed specifically for insulin charts. The expert group considered the results and comments received. Where appropriate, these were incorporated into the development of a chart for piloting in hospitals.
2.5 PilotingThe chart was piloted in six hospitals in Queensland, Victoria and the Australian Capital Territory (Appendix 2). Pilot sites were selected through a targeted call for expressions of interest. This second pilot concluded in May 2016 with a final version of the acute care chart expected to be available in 2017.
The pilot consisted of the following phases:
A pre-implementation (baseline) audit of insulin prescribing and documentation using the national inpatient medication chart or local hospital insulin form, before education of staff
Education of medical, nursing and pharmacy staff on the pilot subcutaneous insulin chart using educational materials provided by the Commission
Introduction of the subcutaneous insulin chart in each facility
Audit of the subcutaneous insulin chart four months after implementation.
The objectives of the pilot were to evaluate the impact of the chart on:
The safety and quality of prescribing and administration of subcutaneous insulin in the adult inpatient setting of an acute care hospital
Blood glucose control.
2.6 EvaluationData were collected at the hospitals at two points in time:
Before the introduction of the subcutaneous insulin chart (pre-audit)
After the chart was in use for four months (post-audit).
The evaluation measured the impact of introducing the pilot subcutaneous insulin chart on the safety and quality of insulin prescribing and administration, and on the documentation and management of BGLs in adult inpatients.
The pilot also included an online survey of the hospital’s implementation experience and an issues register.
7 Australian Commission on Safety and Quality in Health Care

Results
Development and evaluation of a new chart for subcutaneous insulin administration in acute care settings 8

Key points
Thirty-five improvements in the prescribing of insulin and the management of people with diabetes were associated with using the new chart.
The chart improved blood glucose control and had direct patient benefit overall, although there were hospital-to-hospital variations.
Patients were less likely to experience hyperglycaemia and hypoglycaemia when the new chart was used, compared to before the pilot began.
The pilot hospitals showed improvements in the clarity of insulin prescriptions written for routine, stat/phone and supplemental insulin.
Six areas of focus were identified after implementation of the new chart, and classified as administrative issues that did not affect patient safety.
The data from all pilot hospitals were combined in the analysis; data from individual hospitals were also reviewed for differences among healthcare settings. The charts of 379 patients prescribed insulin were audited; 201 inpatients during the pre-audit (n=413 charts) and 178 inpatients during the post-audit (n=213 charts).
3.1 Combined hospital dataChanges associated with use of the chartThe Commission analysed the data from the acute care hospital pilot of the new national subcutaneous insulin form. To help interpret the data, all baseline to post-audit changes that were statistically significant (p < 0.05) and could be categorised as either ‘improvements’ or ‘areas of focus’ were identified. The introduction of the new chart was associated with 35 improvements and six areas of focus.
A data point which showed generally positive changes after introduction of the chart was considered an improvement. Areas of focus are the data points where negative changes were observed. The measurements were grouped into five categories: patient identification and blood glucose level (BGL) documentation, routine insulin orders, supplemental insulin orders, stat/phone insulin orders, and sliding scale insulin orders.
Patient identification and blood glucose level documentation The following improvements in the following areas of insulin prescribing were observed: The average number of charts per patient
was reduced The number of times insulin forms were
cross-referenced in the regular medications section of the NIMC increased
The recording of BGLs on the same chart where insulin is prescribed increased
More prescribers documented their required frequency and timing of BGL monitoring for the patients in their care
The number of days that BGLs are recorded as requested increased
The number of BGLs recorded as accurate data points on the BGL line graph increased
The documentation of the number of times the medical officer was notified of hypoglycaemia increased
The number of BGLs in the range of 4 to 12mmol/L range increased
The prescribing of insulin on the NIMC decreased The prescribing of insulin on hospital-specific insulin
forms decreased The number of supplemental insulin orders charted
appropriately increased.
9 Australian Commission on Safety and Quality in Health Care

The pilot did not highlight issues with the patient identification and BGL documentation.
Routine insulin prescriptionsThe following improvements were observed in routine insulin ordering:
The proportion of orders where route of administration was clear increased
The proportion of orders where route of administration was unclear decreased
The proportion of orders where frequency of administration was clear increased
The proportion of orders where frequency of administration was unclear decreased
The proportion of orders where prescriber name was clear increased
The proportion of doses prescribed that were clear increased
The proportion of doses prescribed that used unapproved abbreviations decreased
The proportion of doses that were missing decreased.
The pilot highlighted the following areas that will require focus for future implementations of the chart:
The proportion of orders where the prescriber had signed decreased
The proportion of doses initialled as having been administered decreased
The proportion of doses with administration time documented decreased.
Supplemental insulin prescriptionsThe following improvements were observed in supplemental insulin ordering:
The proportion of orders where route of administration was clear increased
The proportion of orders where route of administration was unclear decreased
The proportion of orders where frequency of administration was clear increased
The proportion of orders where frequency of administration was unclear decreased
The proportion of orders where prescriber name is clear increased
The proportion of doses prescribed that use unapproved abbreviations decreased
The proportion of doses with administration time documented increased.
The pilot highlighted the following areas that will require focus for future implementations of the chart:
The proportion of doses initialled as having been administered decreased.
Stat/phone insulin prescriptionsThe following improvements were observed in stat/phone insulin prescriptions:
The proportion of orders where route of administration was clear increased
The proportion of orders where route of administration was unclear decreased
The proportion of orders where prescriber name was clear increased
The proportion of doses prescribed that use unapproved abbreviations decreased.
The pilot highlighted the following areas that will require focus for future implementations of the chart:
The proportion of doses initialled as having been administered decreased
The proportion of doses with administration time documented decreased.
Subcutaneous sliding scale insulin prescriptionsThe following improvements were observed in sliding scale insulin orders:
The proportion of orders where route of administration is clear increased
The proportion of orders where route of administration is unclear decreased
The proportion of doses prescribed clearly increased The proportion of doses prescribed that use
unapproved abbreviations decreased The proportion of doses initialled as having been
administered increased The proportion of doses with administration time
documented increased.
Prescribers were discouraged from using subcutaneous sliding scale insulin in a written alert on the pilot chart. However, the audit did not identify significant use of subcutaneous sliding scale insulin prescriptions during the pilot. This may reflect prescriber adherence to the alert.
Use of charts in hospitalsFigure 1 shows uptake of the subcutaneous insulin chart once introduced to hospitals. Hospitals made the transition from using the NIMC and hospital-specific insulin charts to record and monitor insulin administration and BGLs. The insulin chart also requests that healthcare provider staff cross-reference the NIMC.
Development and evaluation of a new chart for subcutaneous insulin administration in acute care settings 10
3 Results
Figure 1 Changesa in the use of charts, all hospitals combined
NIMC = national inpatient medication charta All changes were statistically significant, p < 0.01.
Blood glucose controlFigure 2 outlines the improvements in glycaemia management before and after the chart was introduced.
Figure 2 Hypoglycaemia and hyperglycaemia management, all hospitals combined
* = statistically significant, p < 0.01; BGL = blood glucose level
11 Australian Commission on Safety and Quality in Health Care
These improvements were likely to result in direct patient benefit – more readings were seen in the recommended range and fewer readings outside of this range. That is, following introduction of the new chart, patients were less likely to experience hyperglycaemia and hypoglycaemia.
The decrease in the number of BGLs recorded which were greater than 20 mmol/L did not reach statistical significance (p = 0.05). This could be because of low statistical power, where the magnitude of the improvement documented could still be clinically important (4.2% to 3.3%). It is worth noting that the magnitude of some of the positive changes were substantial. For example, the percentage of days on which BGLs were recorded as requested increased from 35% to 86% following introduction of the new chart (Figure 2).
Insulin prescribing and administrationOverall, the pilot hospitals showed improvements in the prescribing of insulin for several prescription types: routine insulin prescriptions, supplemental insulin prescriptions and subcutaneous sliding scale insulin prescriptions. Stat and phone insulin orders, however, performed less well when compared with baseline performance. Potential reasons for this are discussed in the next section.
There were six areas of focus in which post-pilot results showed lower compliance than at baseline. For example, in some cases, prescribers wrote insulin orders but did not add their signature as required to authorise the order.
Of these, the main issue that could adversely affect the safety of people with diabetes is the decrease in the ‘total insulin doses prescribed that are clear’ for stat/phone orders. It is possible this occurred because the section is reduced in size on the new chart, and permits fewer such orders to be recorded compared with some other charts. It is important to note that some of the hospitals in the pilot typically used phone orders for most or all their routine insulin prescriptions. The structure of the national subcutaneous insulin chart supports daily prescribing of insulin while minimising the phone/stat orders section.
A strategy was devised to help hospitals manage situations where the phone/stat order section was used more frequently than the chart allows. An update was provided to pilot hospitals in the form of a frequently asked question (FAQ) document.
When possible, the phone order should be written directly into the routine insulin orders section on the new chart. In circumstances where there was already a dose written in the relevant cell of the routine insulin orders section, the FAQs recommended crossing out the dose, and cross-referencing to the stat/phone orders section.
These recommendations were designed to:
Prevent clinicians from running out of room in the stat/phone orders section
Take advantage of the alignment of the routine insulin orders section with the BGL monitoring and administration record sections.
It is possible that this advice was not followed in every case, which could account for some of the unclear stat/phone prescriptions. It is worth noting that the number of ‘total insulin doses prescribed which are clear’ for routine insulin orders significantly improved after the introduction of the new chart (from 93.8% to 97.8%, p < 0.01; data not shown).
Another area that showed lower compliance following introduction of the new chart was ‘total insulin doses that are missing’. This measure indicates that a signature to confirm administration of a dose has not been added to the chart; it does not necessarily mean that a dose has not been administered. If doses were not being administered, an increase in episodes of hyperglycaemia would have been observed in pilot hospitals.
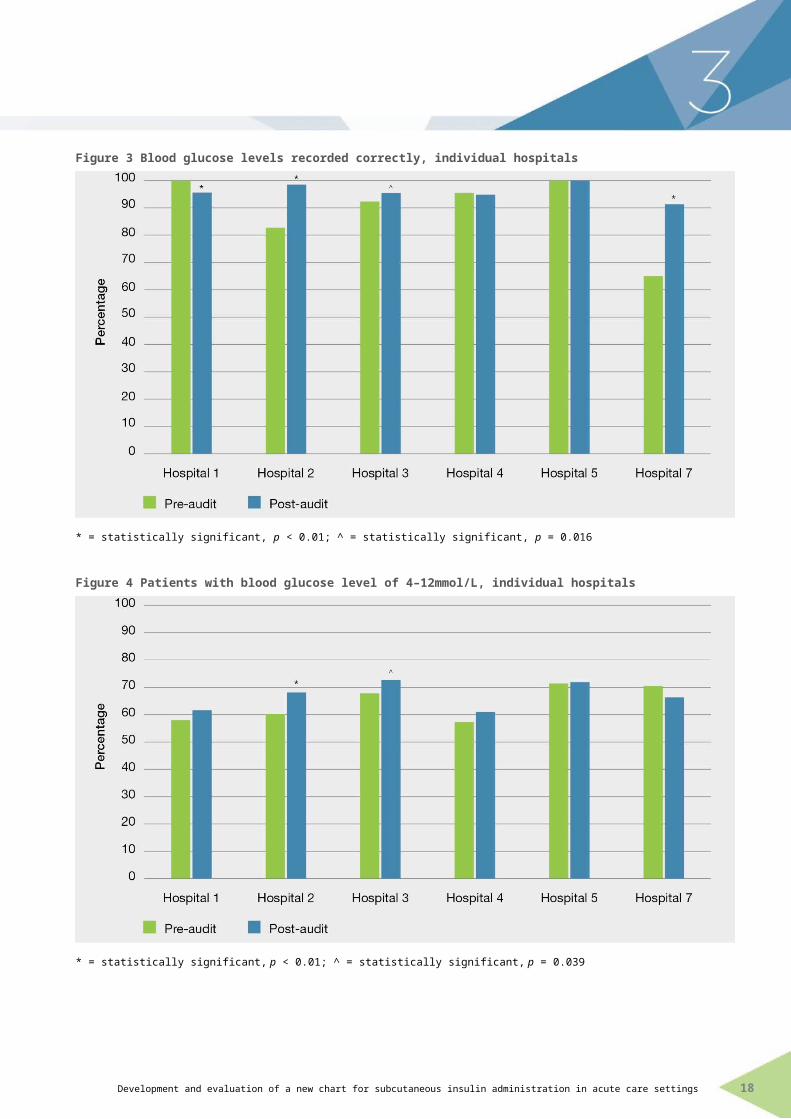
3.2 Individual hospitalsBlood glucose controlOverall, improvements in blood glucose control were seen when hospital data was analysed. However, there was variation across hospitals with BGL control not improving in some (Figures 3 and 4). Possible reasons for these results include the small sample sizes in some of the pilot hospitals and incomplete implementation of the chart in some of the pilot hospitals.
Development and evaluation of a new chart for subcutaneous insulin administration in acute care settings 12
3 Results
Figure 3 Blood glucose levels recorded correctly, individual hospitals
* = statistically significant, p < 0.01; ^ = statistically significant, p = 0.016
Figure 4 Patients with blood glucose level of 4–12mmol/L, individual hospitals
* = statistically significant, p < 0.01; ^ = statistically significant, p = 0.039
Insulin prescribing and administrationGenerally, the proportion of ‘insulin orders that are clear’ improved for most types of prescriptions. One hospital improved the clarity of their sliding scale insulin orders from 55.5% to 100.0% (p < 0.01; data not shown).
13 Australian Commission on Safety and Quality in Health Care

Rationale and conclusion
Development and evaluation of a new chart for subcutaneous insulin administration in acute care settings 14
Key points
The chart is beneficial for people with diabetes in an acute care hospital.
Training will help to reverse administrative errors identified in the pilot.
The results support the hypothesis that using a standardised chart for prescribing and administering subcutaneous insulin and recording blood glucose levels, combined with planned implementation and education, reduces errors in subcutaneous insulin prescribing and administration and does not result in inferior blood glucose control.
An extensive evaluation of chart structure and composition concluded that further changes to chart design would not result in significant safety improvements relating to insulin use.
4.1 Rationale for the adoptionof the chart
The pilot project showed that the new national subcutaneous insulin chart is beneficial to patients that need their diabetes monitored and controlled in an acute care hospital.
Most of the improvements identified are associated with direct patient benefit. Better BGL control and clearer subcutaneous insulin prescribing were observed.
Administrative errors were observed during both phases of the pilot, and must be addressed when the chart is introduced to a hospital. Errors of this type are common when new tools are introduced, such as the national subcutaneous insulin chart. Their resolution requires systematic monitoring of the chart’s performance, continued education and positive reinforcement of practice change among clinicians.
4.2 ConclusionsThe national subcutaneous insulin chart yields better outcomes than alternative charts with which it was compared. The results support the hypotheses that using a standardised chart for prescribing and administering subcutaneous insulin and recording BGLs, when combined with planned implementation and education:
Reduces errors in subcutaneous insulin prescribing and administration
Does not result in inferior blood glucose control.
Further design work would not be beneficial at this stage. Rather than modifying the design of the chart, those issues that remain should be addressed through effective change management processes and training. These include providing more explicit training to all chart users on the phone order procedures that are currently outlined only in the frequently asked questions document.
It is expected that the negative changes seen will decrease as the new chart becomes more commonplace and familiar to staff.
Because of space constraints on the printed chart, many instructions are not included and will thus require user training. The expert group felt that regardless of the improvements to the chart, user training is essential.
15 Australian Commission on Safety and Quality in Health Care
Recommendations
Development and evaluation of a new chart for subcutaneous insulin administration in acute care settings 16

Based on the outcomes of the pilot and evaluation of the national subcutaneous insulin chart:
1. The national subcutaneous insulin chart is recommended for use in all hospitals unless the existing chart or charts can be demonstrated to be as effective.
2. Jurisdictions and private hospitals considering implementation of the national subcutaneous insulin chart should
a) confirm the expected benefits of implementation against local workflows and requirements in lead sites
b) establish a plan to monitor the performance of the national subcutaneous insulin chart as part of the organisation’s clinical governance processes.
3. The national subcutaneous insulin chart should be implemented as part of an education program that explains how the chart should be used. Local variation should be minimal because the chart was extensively tested, meaning any changes could reduce the positive impact on prescribing. Permitted variations should be specified clearly in the accompanying support materials.
4. Support materials should be developed by the Commission to assist hospitals that wish to implement the national insulin subcutaneous chart.
5. Hospitals should support effective local implementation of the national subcutaneous insulin chart by
c) developing an implementation plan with key stakeholders in the institution
d) undertaking a risk assessment of the new chart and associated workflow changes
e) using the national subcutaneous insulin chart implementation material developed by the Commission for their communication and training.
6. The Commission should initiate a stewardship and governance program to support the national implementation of the national subcutaneous insulin chart.
7. An evaluation of the national subcutaneous insulin chart and national implementation should be conducted 18 months after it has been authorised, to assess its ongoing safety performance and utility.
17 Australian Commission on Safety and Quality in Health Care

Appendices
Development and evaluation of a new chart for subcutaneous insulin administration in acute care settings 18
Appendix 1 NIFPAG membersThe National Insulin Form Pilot Advisory group members:
Dr Merryn Thomae, Mater Health Services (Chair) Professor Trisha Dunning, Barwon Health Dr Peter Donovan, Queensland Health Ms Glenda Gorrie, Victorian Department of Health and Human Services Ms Fiona McIver, Medication Services Queensland, Queensland Department of Health Prof Charles Mitchell, University of Queensland Dr Kerry Newlin, Agency for Clinical Innovation NSW A/Professor Glynis Ross, Royal Prince Alfred Hospital and Bankstown-Lidcombe Hospital.
19 Australian Commission on Safety and Quality in Health Care
Appendix 2 Participating hospitalsThe following hospitals participated in the phase two (2016) insulin chart pilots:
Mater Private Hospital, Brisbane, Queensland Warringal Private Hospital, Melbourne, Victoria Canberra Hospital, Australian Capital Territory Mercy Public Hospital Werribee, Victoria Canossa Private Hospital, Brisbane, Queensland Mater Adult Hospital, Brisbane, Queensland.
The following hospitals participated in phase one (2015) of the insulin chart pilot:
Northeast Health Wangaratta, Victoria Peter MacCallum Cancer Centre, Melbourne, Victoria Sunshine Coast Private Hospital, Sunshine Coast, Queensland Monash Health, Melbourne, Victoria Fremantle Hospital, Western Australia Mater Misericordiae Hospital Mackay, Queensland Rockingham Hospital, Perth, Western Australia.
Development and evaluation of a new chart for subcutaneous insulin administration in acute care settings 20

6 Appendices
21 Australian Commission on Safety and Quality in Health Care
Australian Commission on Safety and Quality in Health Care
Level 5, 255 Elizabeth Street, Sydney NSW 2000GPO Box 5480, Sydney NSW 2001
Phone: (02) 9126 3600 (international +61 2 9126 3600)Fax: (02) 9126 3613 (international +61 2 9126 3613)
Email: [email protected]
Development and evaluation of a new chart for subcutaneous insulin administration in acute care settings 22