1 use of microorganism as a biofertilizer on bean
TRANSCRIPT

Use of microorganism as
a biofertilizer on bean
PREPARED BY:LARA BDIER, AMER ADAWI, LAMA OMAR
SUPERVISED BY: DR HIBA AL FARIS
1

Aim of study
The objectives of this study are:
1-To estimate the effect of bacteria as a biofertilize on bean .
2-To understand the relationship between bacteria and bean .
2

Introduction
Legumes (Leguminosae) are economically important crop, Legumes are a high
quality, protein-rich animal feed and whole some source of nutrition for people;
moreover, they are a valuable crop in different crop rotation systems.
Legumes are able to fix atmospheric nitrogen up to 250 kg ha-1, thus reducing the
load on the agro fertilizer.
For example plant associated micro-organisms nitrogen-fixing Rhizobium .
one of the most important ways to take advantage of useful interaction of
microorganisms and to maintain diversity in agricultural ecosystems is to use useful
soil microorganisms which are living in rhizosphere environment and are capable of
improving plant nutrition and soil fertility through biological fixation of nitrogen,
phosphate solubilization, and generally enhancement of plant growth.
3

Most cultivated soils contain large populations of such micro-organisms.
Use of biofertilizers is one of the important components of integrated nutrient
management.
Several microorganisms and their association with crop plants are being
exploited in the production of biofertilizers.
They can be grouped in different ways based on their nature and function,
such as Bacillus megaterium var, phosphaticum, Bacillus subtilis,Bacillus
circulans, Pseudomonas striata and Em1.
In order to develop sustainable farming systems with reduced inputs of
manufactured fertilizers, more attention should be given to the use of
microorganisms that could have beneficial effects on crop production .
4

Material and method
Soil (sand : clay) 1:1
90 pots .
Two type seed of bean (قرطاسي وبلدي) .
Two type of bacteria 1)Em1 2) Bacillus megaterium .
Chlorophyll meter (SPAD) .
Meter .
Balance .
Water sources .
5

Method
Soil was a mixture sand : clay (1:1) .
90 pots were filled with soil mixture .
Two type of bean seeds (قرطاسي و بلدي) was planting in pots at 22/12/2016 .
Inoculation both type of bacteria Em1, Bacillus megaterium in plant bean twice with one month interval between the two inoculation.
The first inoculation was do after one month from planting.
Irrigation was carried out 3 times per week, each plant takes about 3 liters of water per week.
Bean started flowering at 22/Feb. As a result ,we reduced the number of irrigation times per week.
The pods stated formation at 13/March
6

The length of the plant and the length of the pod were measured and the number of branches, leaves and pod was calculated for each pot at 11/4/2017.
We use chlorophyll meter (SPAD) to determine the chlorophyll content in the leaves .
Harvested of plant at 16/4/2017, after that we take weight of pods and seed in pods then measure the number of seeds for each plant .
After we harvested, the plant root was washed to get rid of the soil mixture and get roots .
The weight of roots in each pot was measured .
After that, we determine the number of nodules in random samples of five plants from each variety and treatments.
Measure the weight of nodules .
The experimental design was CRBD
SAS V8 to conduct analysis of variance and mean separation.
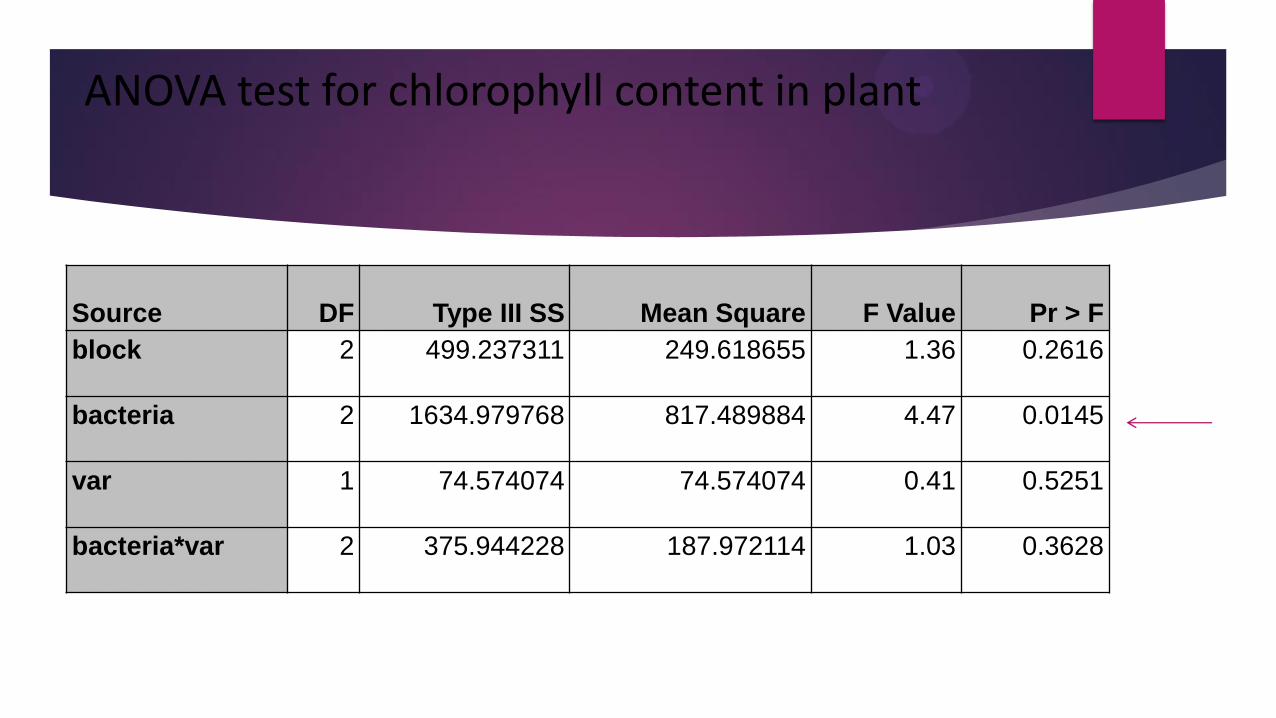
Source DF Type III SS Mean Square F Value Pr > F
block 2 499.237311 249.618655 1.36 0.2616
bacteria 2 1634.979768 817.489884 4.47 0.0145
var 1 74.574074 74.574074 0.41 0.5251
bacteria*var 2 375.944228 187.972114 1.03 0.3628
ANOVA test for chlorophyll content in plant
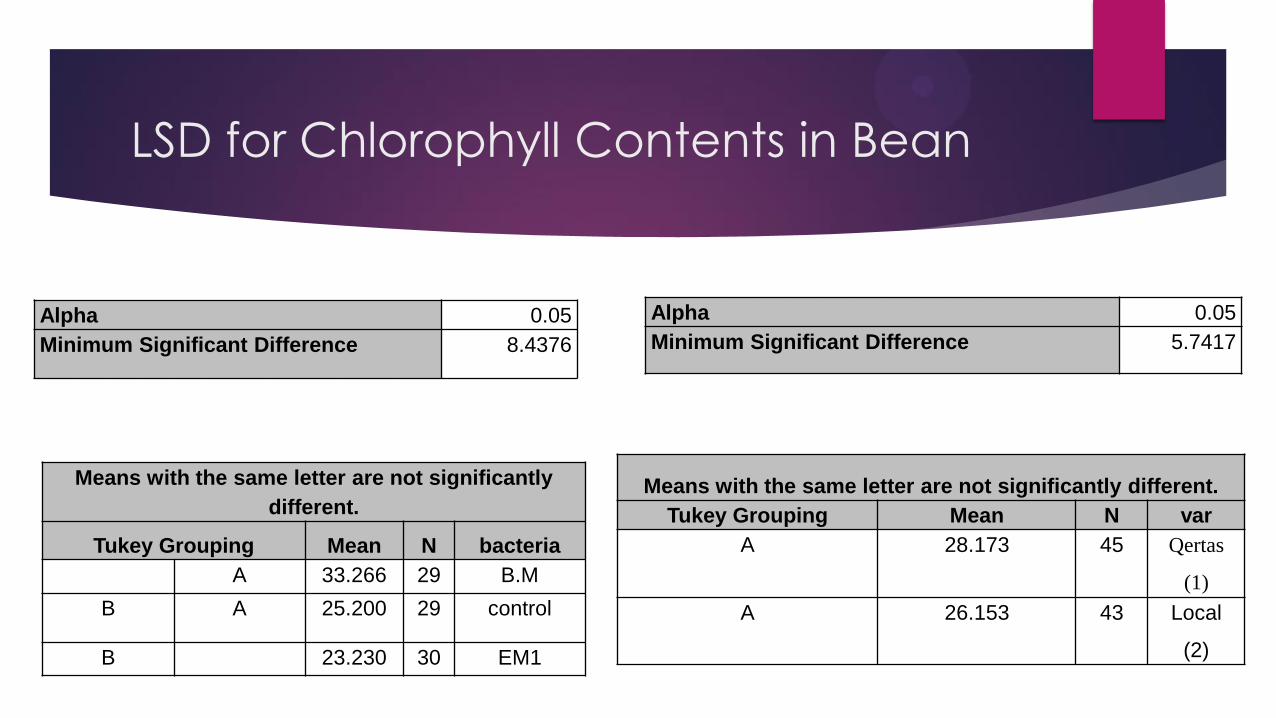
LSD for Chlorophyll Contents in Bean
Alpha 0.05
Minimum Significant Difference 8.4376
Means with the same letter are not significantly
different.
Tukey Grouping Mean N bacteria
A 33.266 29 B.M
B A 25.200 29 control
B 23.230 30 EM1
Alpha 0.05
Minimum Significant Difference 5.7417
Means with the same letter are not significantly different.
Tukey Grouping Mean N var
A 28.173 45 Qertas
(1)
A 26.153 43 Local
(2)

ANOVA test for Number of leaves in
Bean
Source DF Type III SS Mean Square F Value Pr > F
block 2 372.558943 186.279472 3.74 0.0278
bacteria 2 2588.749419 1294.374710 26.02 <.0001
var 1 1081.891875 1081.891875 21.75 <.0001
bacteria*var 2 402.287515 201.143757 4.04 0.0212

Alpha 0.05
Minimum Significant Difference 4.3732
Means wit
h the same letter are not significantly different.
Tukey Grouping Mean N bacteria
A 31.633 30 1
B 21.483 29 0
B 19.267 30 2
LSD test for Number of leaves in Plant
Alpha 0.05
Minimum Significant Difference 2.9755
Means with the same letter are not significantly different.
Tukey Grouping Mean N var
A 27.727 44 2
B 20.667 45 1

0
5
10
15
20
25
30
35
1(0) 2(0) 1(1) 2(1) 1(2) 2(2)
noleaves LSMEAN
noleaves LSMEAN
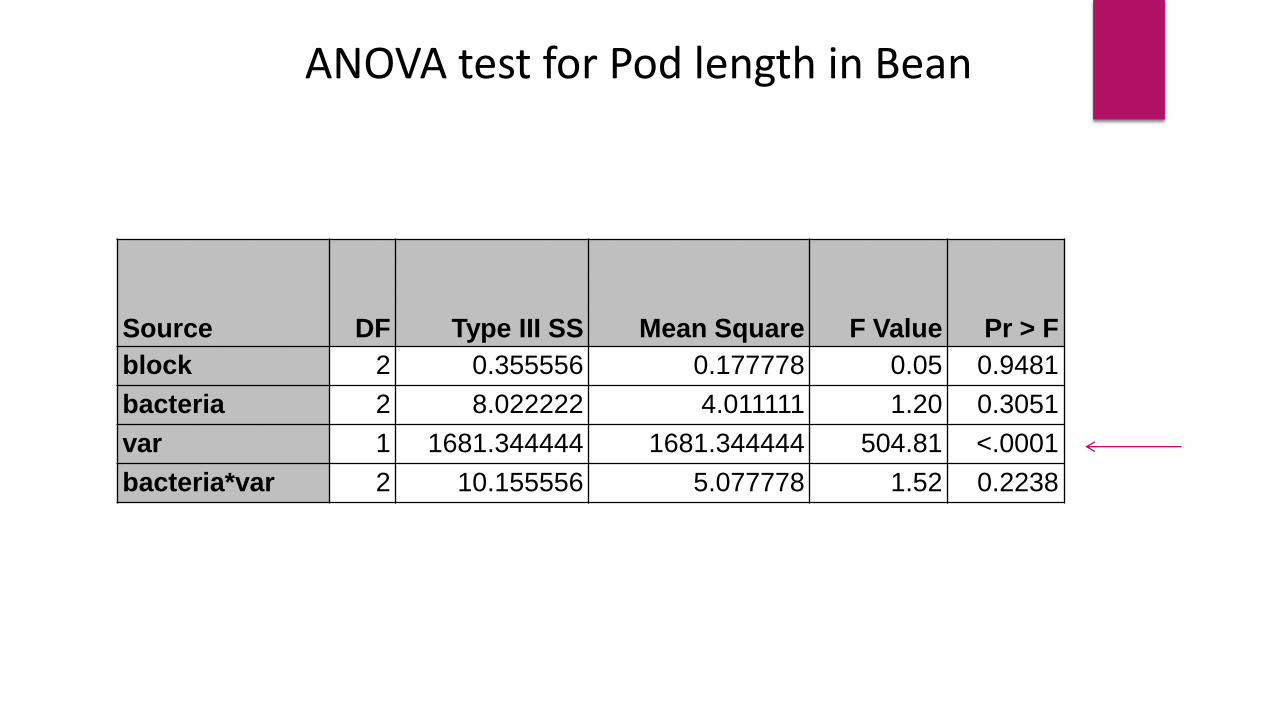
Source DF Type III SS Mean Square F Value Pr > F
block 2 0.355556 0.177778 0.05 0.9481
bacteria 2 8.022222 4.011111 1.20 0.3051
var 1 1681.344444 1681.344444 504.81 <.0001
bacteria*var 2 10.155556 5.077778 1.52 0.2238
ANOVA test for Pod length in Bean

Alpha 0.05
Minimum Significant Difference 1.1248
Means with the same letter are not significantly
different.
Tukey Grouping Mean N bacteria
A 10.6333 30 1
A 10.0000 30 0
A 10.0000 30 2
LSD test for Pod Length in Bean
Alpha 0.05
Minimum Significant Difference 0.7654
Means with the same letter are not significantly different.
Tukey Grouping Mean N var
A 14.5333 45 1
B 5.8889 45 2

Source DF Type III SS Mean Square F Value Pr > F
block 2 8.415447 4.207724 0.30 0.7393
bacteria 2 60.377352 30.188676 2.17 0.1202
var 1 1069.738473 1069.738473 77.07 <.0001
bacteria*var 2 23.935553 11.967776 0.86 0.4261
ANOVA test for Number of Pods in Bean

Alpha 0.05
Minimum Significant Difference 2.3099
Means with the same letter are not significantly
different.
Tukey Grouping Mean N bacteria
A 9.1333 30 1
A 8.1379 29 0
A 7.1333 30 2
LSD test for Number of Pods in Bean
Alpha 0.05
Minimum Significant Difference 1.5716
Means with the same letter are not significantly different.
Tukey Grouping Mean N var
A 11.6364 44 2
B 4.7111 45 1

Source DF Type III SS Mean Square F Value Pr > F
block 2 2.37950058 1.18975029 1.24 0.2936
bacteria 2 0.82235772 0.41117886 0.43 0.6519
var 1 0.01124661 0.01124661 0.01 0.9139
bacteria*var 2 0.41389212 0.20694606 0.22 0.8058
ANOVA test for Number of Branches in Bean

Alpha 0.05
Minimum Significant Difference 0.6062
Means with the same letter are not significantly
different.
Tukey Grouping Mean N bacteria
A 3.3667 30 1
A 3.2759 29 0
A 3.1333 30 2
LSD test for Number of Branches in Bean
Alpha 0.05
Minimum Significant Difference 0.4125
Means with the same letter are not significantly different.
Tukey Grouping Mean N var
A 3.2727 44 2
A 3.2444 45 1
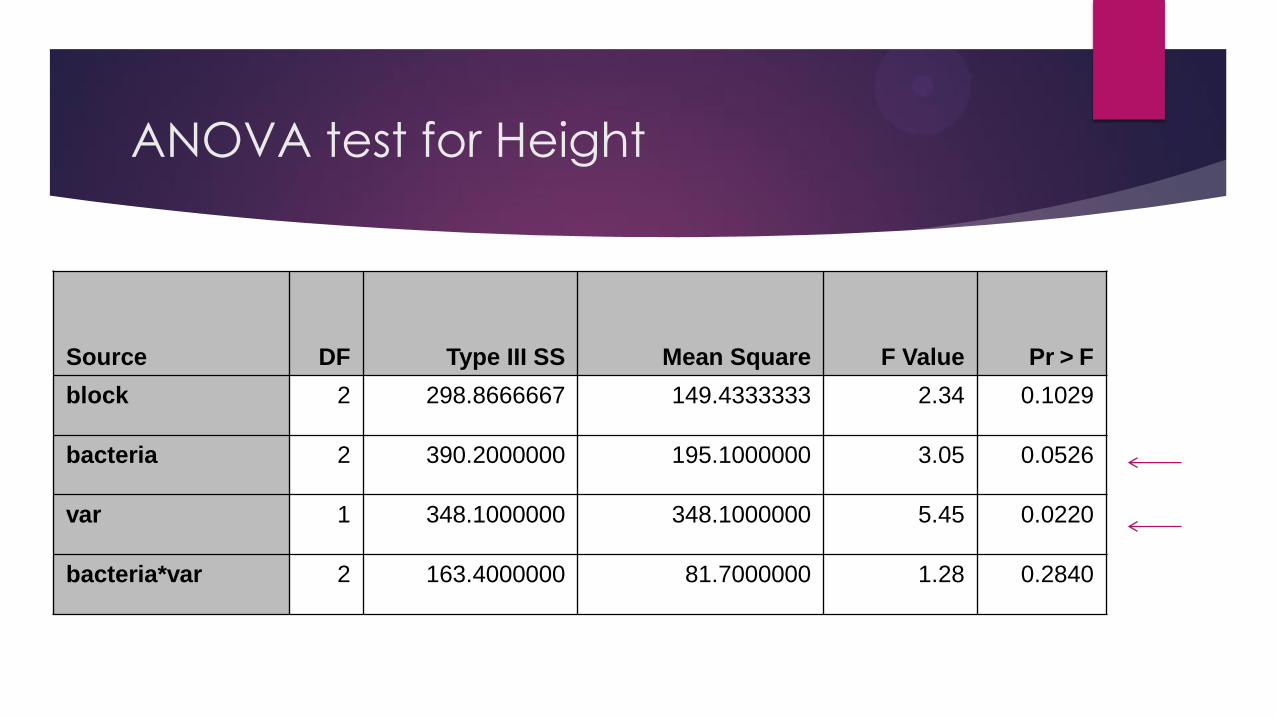
ANOVA test for Height
Source DF Type III SS Mean Square F Value Pr > F
block 2 298.8666667 149.4333333 2.34 0.1029
bacteria 2 390.2000000 195.1000000 3.05 0.0526
var 1 348.1000000 348.1000000 5.45 0.0220
bacteria*var 2 163.4000000 81.7000000 1.28 0.2840

Alpha 0.05
Minimum Significant Difference 4.927
Means with the same letter are not significantly different.
Tukey Grouping Mean N
bacteri
a
A 63.533 30 0
B A 60.933 30 1
B 58.433 30 2
LSD test for Height
Alpha 0.05
Minimum Significant Difference 3.3526
Means with the same letter are not significantly
different.
Tukey Grouping Mean N var
A 62.933 45 2
B 59.000 45 1
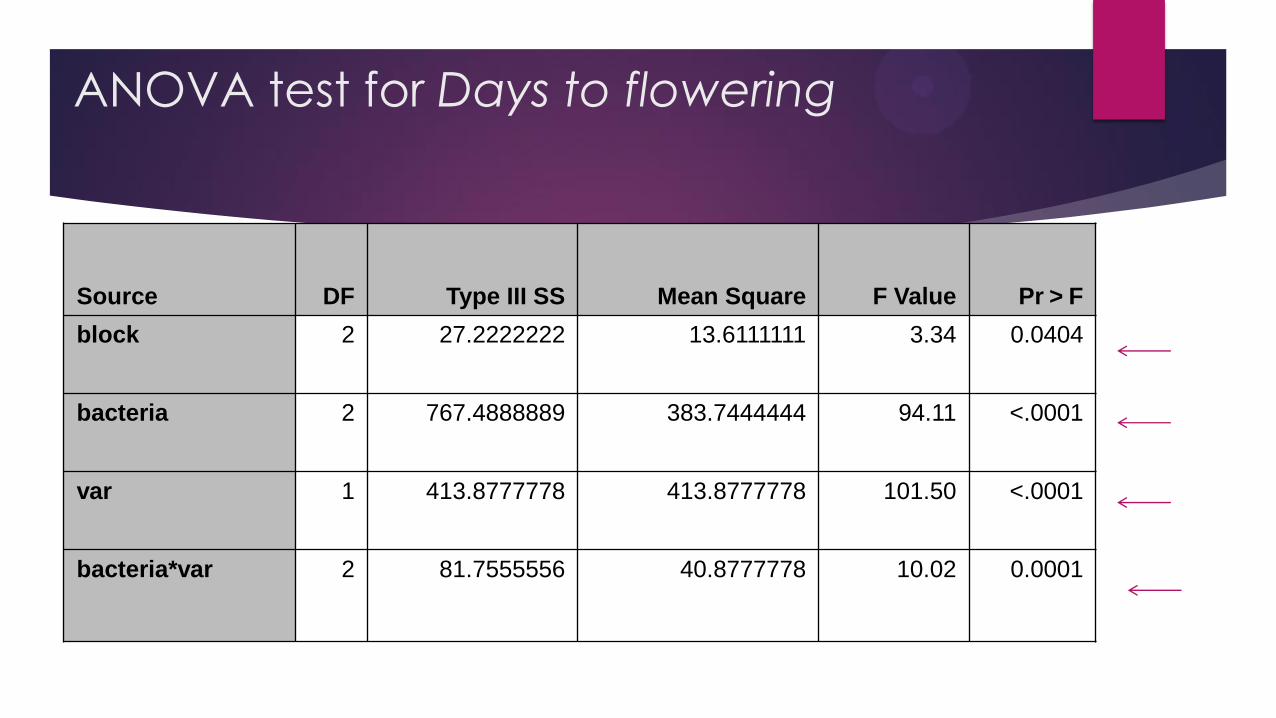
ANOVA test for Days to flowering
Source DF Type III SS Mean Square F Value Pr > F
block 2 27.2222222 13.6111111 3.34 0.0404
bacteria 2 767.4888889 383.7444444 94.11 <.0001
var 1 413.8777778 413.8777778 101.50 <.0001
bacteria*var 2 81.7555556 40.8777778 10.02 0.0001

LSD test for Days to flower
Alpha 0.05
Minimum Significant Difference 1.2446
Means with the same letter are not significantly
different.
Tukey Grouping Mean N bacteria
A 67.3333 30 0
A 66.9000 30 1
B 60.9333 30 2
Alpha 0.05
Minimum Significant Difference 0.8469
Means with the same letter are not significantly
different.
Tukey Grouping Mean N var
A 67.2000 45 1
B 62.9111 45 2
54
56
58
60
62
64
66
68
70
72
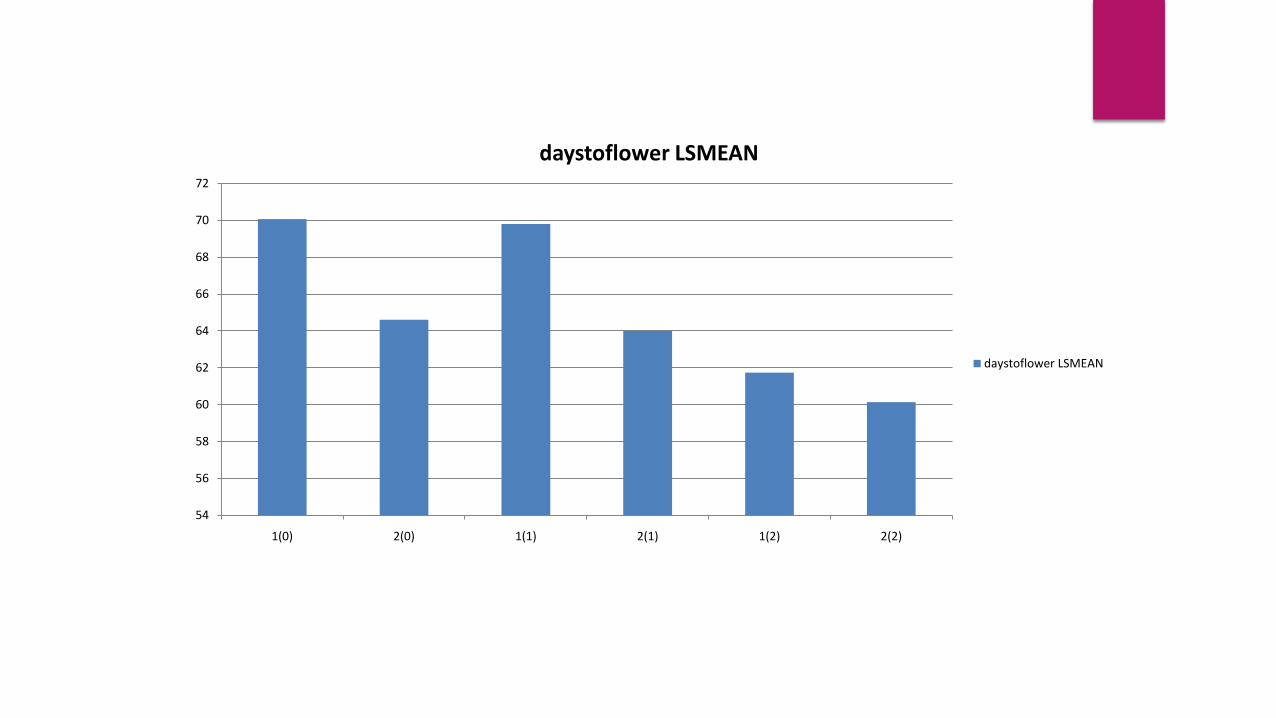
1(0) 2(0) 1(1) 2(1) 1(2) 2(2)
daystoflower LSMEAN
daystoflower LSMEAN

ANOVA test for period for Pod
initiation
Source DF Type III SS Mean Square F Value Pr > F
block 2 2.066667 1.033333 0.21 0.8086
bacteria 2 1690.466667 845.233333 174.23 <.0001
var 1 11.377778 11.377778 2.35 0.1295
bacteria*var 2 96.288889 48.144444 9.92 0.0001
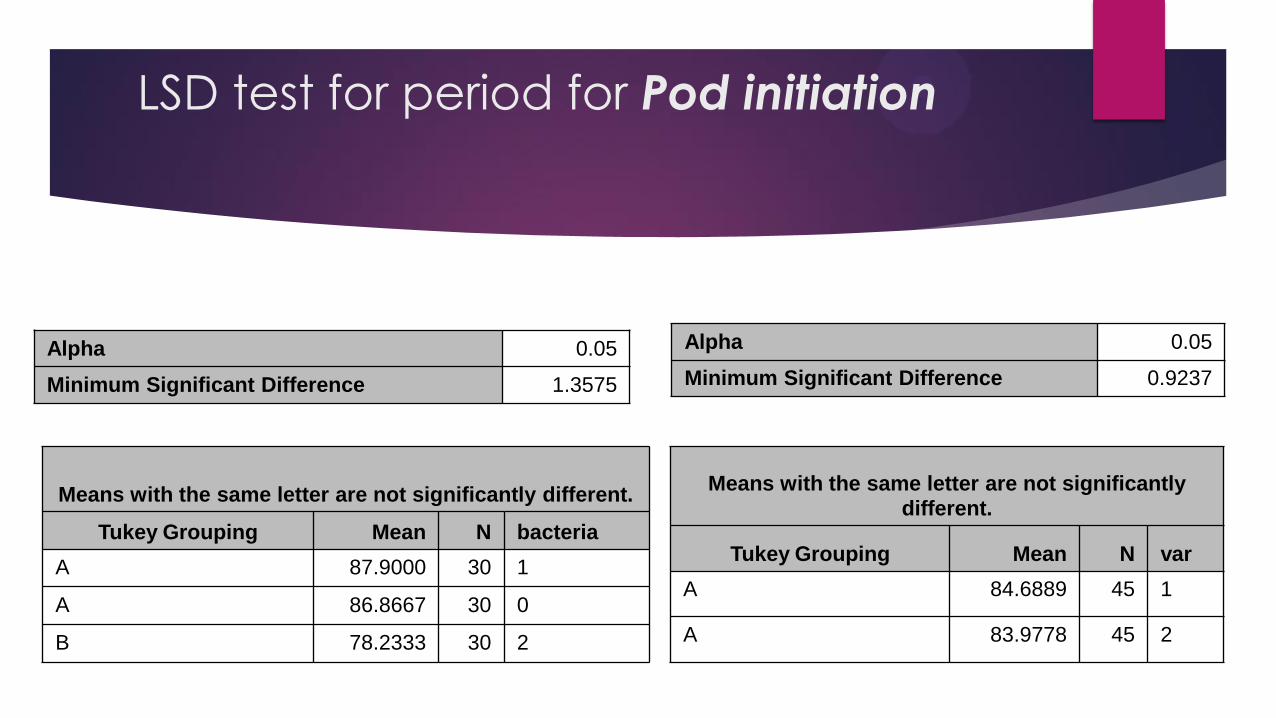
LSD test for period for Pod initiation
Alpha 0.05
Minimum Significant Difference 1.3575
Means with the same letter are not significantly different.
Tukey Grouping Mean N bacteria
A 87.9000 30 1
A 86.8667 30 0
B 78.2333 30 2
Alpha 0.05
Minimum Significant Difference 0.9237
Means with the same letter are not significantly different.
Tukey Grouping Mean N var
A 84.6889 45 1
A 83.9778 45 2

70
72
74
76
78
80
82
84
86
88
90
1(0) 2(0) 1(1) 2(1) 1(2) 2(2)
podinitiation LSMEAN
podinitiation LSMEAN

ANOVA test for Interval between Flowering and
Pod initiation
Source DF Type III SS Mean Square F Value Pr > F
block 2 2.066667 1.033333 0.21 0.8086
bacteria 2 1690.466667 845.233333 174.23 <.0001
var 1 11.377778 11.377778 2.35 0.1295
bacteria*var 2 96.288889 48.144444 9.92 0.0001

LSD test for IntervalFloweringToPod
Alpha 0.05
Minimum Significant Difference 1.5918
Means with the same letter are not significantly different.
Tukey Grouping Mean N bacteria
A 21.0000 30 1
A 19.5333 30 0
B 17.3000 30 2
Alpha 0.05
Minimum Significant Difference 1.0832
Means with the same letter are not significantly
different.
Tukey Grouping Mean N var
A 21.0667 45 2
B 17.4889 45 1
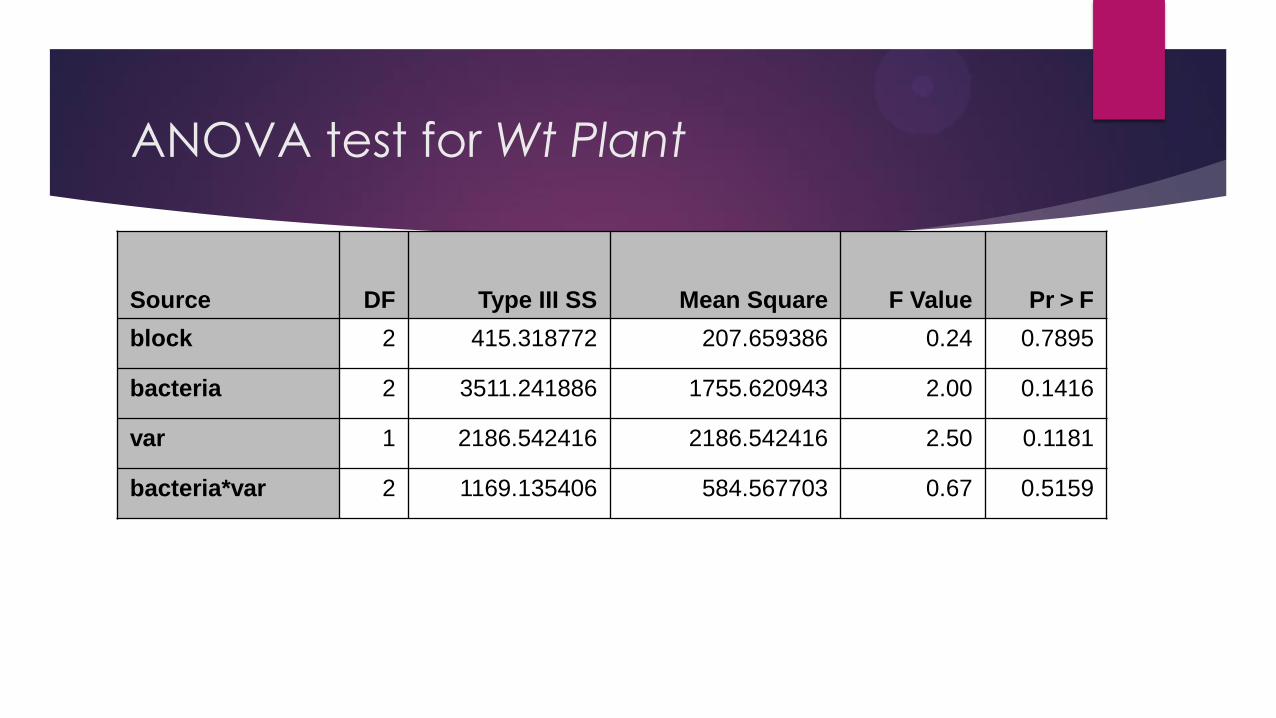
ANOVA test for Wt Plant
Source DF Type III SS Mean Square F Value Pr > F
block 2 415.318772 207.659386 0.24 0.7895
bacteria 2 3511.241886 1755.620943 2.00 0.1416
var 1 2186.542416 2186.542416 2.50 0.1181
bacteria*var 2 1169.135406 584.567703 0.67 0.5159
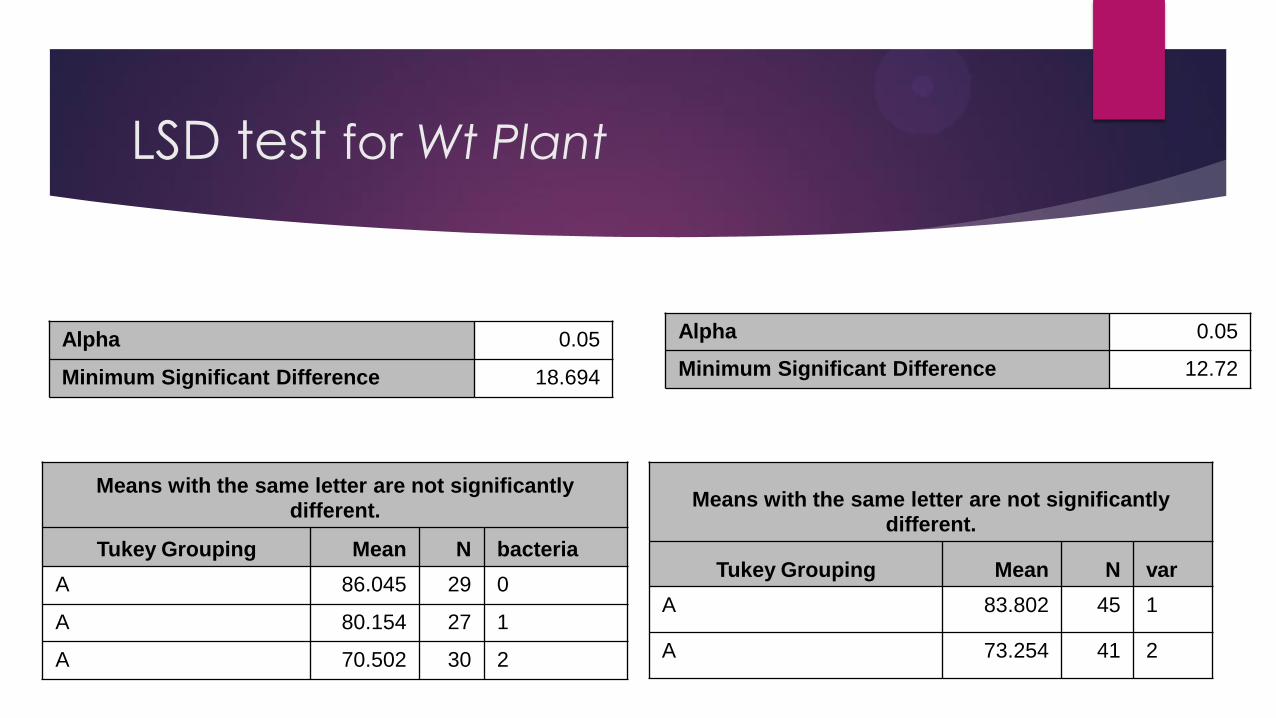
LSD test for Wt Plant
Alpha 0.05
Minimum Significant Difference 18.694
Means with the same letter are not significantly
different.
Tukey Grouping Mean N bacteria
A 86.045 29 0
A 80.154 27 1
A 70.502 30 2
Alpha 0.05
Minimum Significant Difference 12.72
Means with the same letter are not significantly
different.
Tukey Grouping Mean N var
A 83.802 45 1
A 73.254 41 2

ANOVA test for Wt Pods
Source DF Type III SS Mean Square F Value Pr > F
block 2 748.256692 374.128346 1.17 0.3160
bacteria 2 1385.690050 692.845025 2.17 0.1216
var 1 6265.780618 6265.780618 19.58 <.0001
bacteria*var 2 112.459106 56.229553 0.18 0.8392
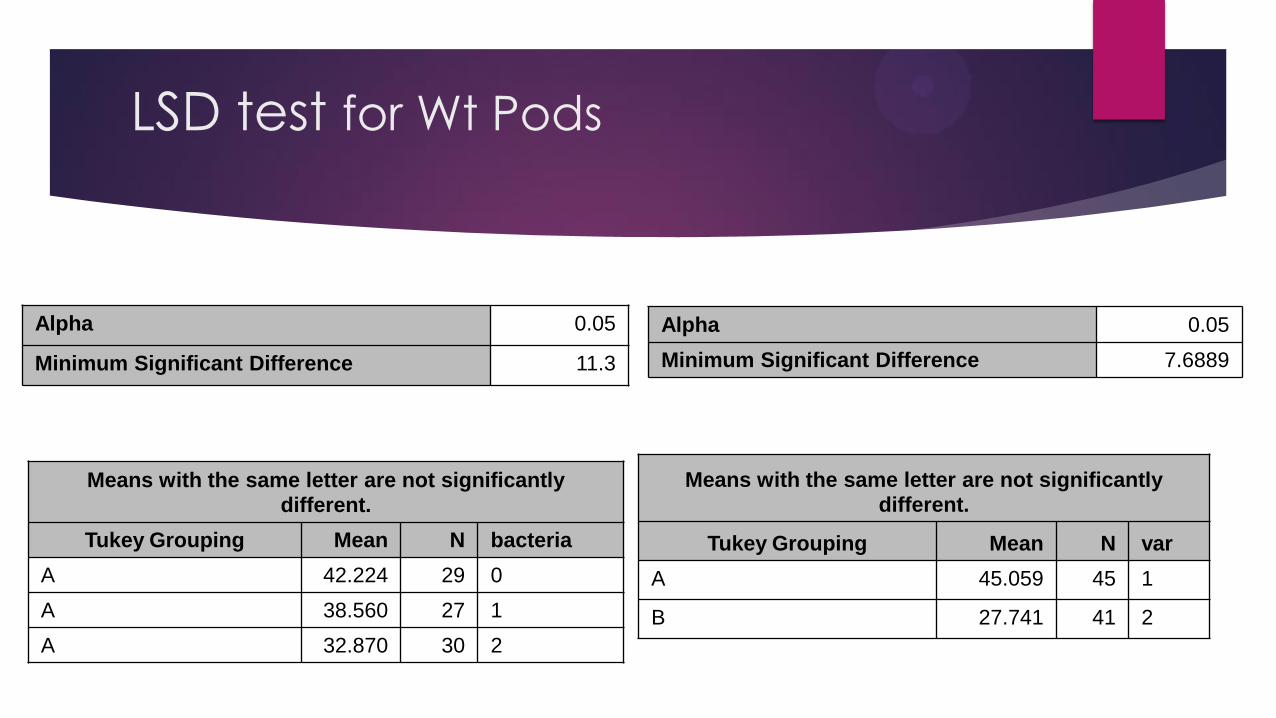
LSD test for Wt Pods
Alpha 0.05
Minimum Significant Difference 11.3
Alpha 0.05
Minimum Significant Difference 7.6889
Means with the same letter are not significantly
different.
Tukey Grouping Mean N var
A 45.059 45 1
B 27.741 41 2
Means with the same letter are not significantly
different.
Tukey Grouping Mean N bacteria
A 42.224 29 0
A 38.560 27 1
A 32.870 30 2
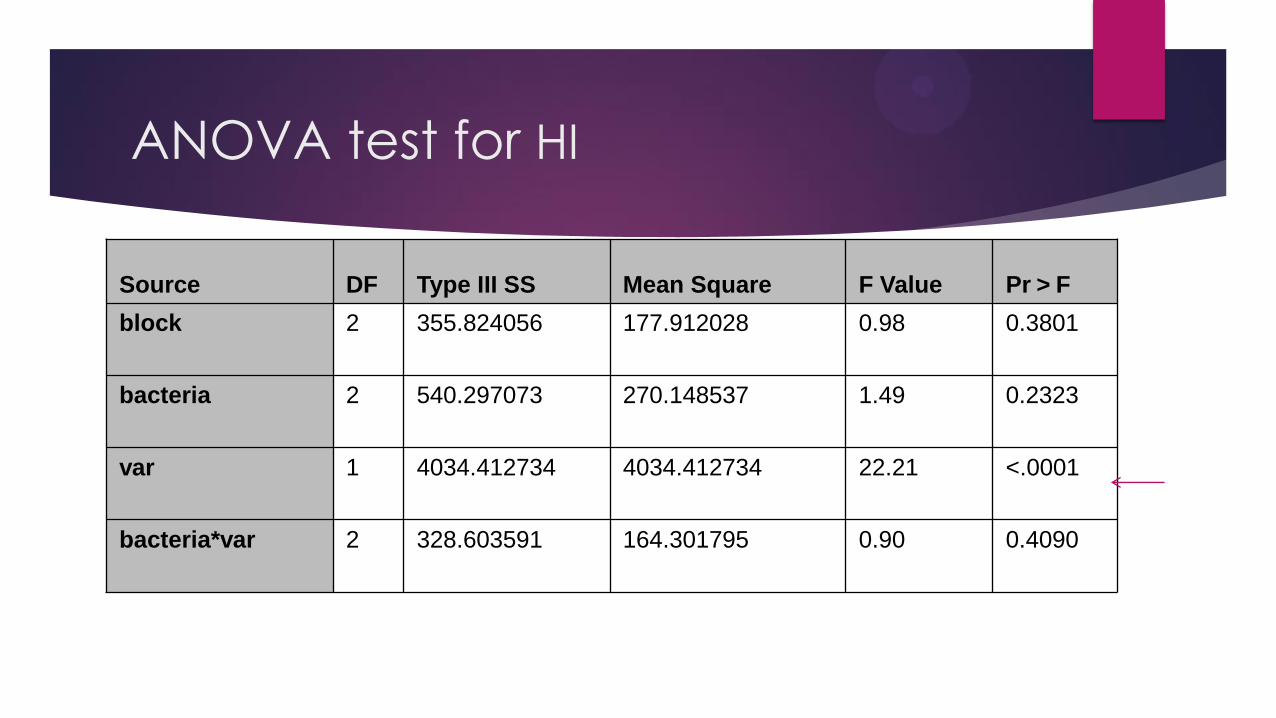
ANOVA test for HI
Source DF Type III SS Mean Square F Value Pr > F
block 2 355.824056 177.912028 0.98 0.3801
bacteria 2 540.297073 270.148537 1.49 0.2323
var 1 4034.412734 4034.412734 22.21 <.0001
bacteria*var 2 328.603591 164.301795 0.90 0.4090

LSD test for HI
Alpha 0.05
Minimum Significant Difference 8.514
Means with the same letter are not significantly different.
Tukey Grouping Mean N bacteria
A 47.800 29 0
A 46.742 30 2
A 42.398 27 1
Alpha 0.05
Minimum Significant Difference 5.7931
Means with the same letter are not significantly
different.
Tukey Grouping Mean N var
A 52.308 45 1
B 38.520 41 2

ANOVA test for Wt Seeds
Source DF Type III SS Mean Square F Value Pr > F
block 2 50.815990 25.407995 0.15 0.8637
bacteria 2 6279.933766 3139.966883 18.15 <.0001
var 1 1020.810877 1020.810877 5.90 0.0174
bacteria*var 2 126.752491 63.376245 0.37 0.6945

LSD test for wt Seeds
Alpha 0.05
Minimum Significant Difference 8.3089
Means with the same letter are not significantly different.
Tukey Grouping Mean N bacteria
A 35.350 27 1
B 22.776 29 0
B 17.700 30 2
Alpha 0.05
Minimum Significant Difference 5.6535
Means with the same letter are not significantly
different.
Tukey Grouping Mean N var
A 29.623 45 1
B 21.941 41 2
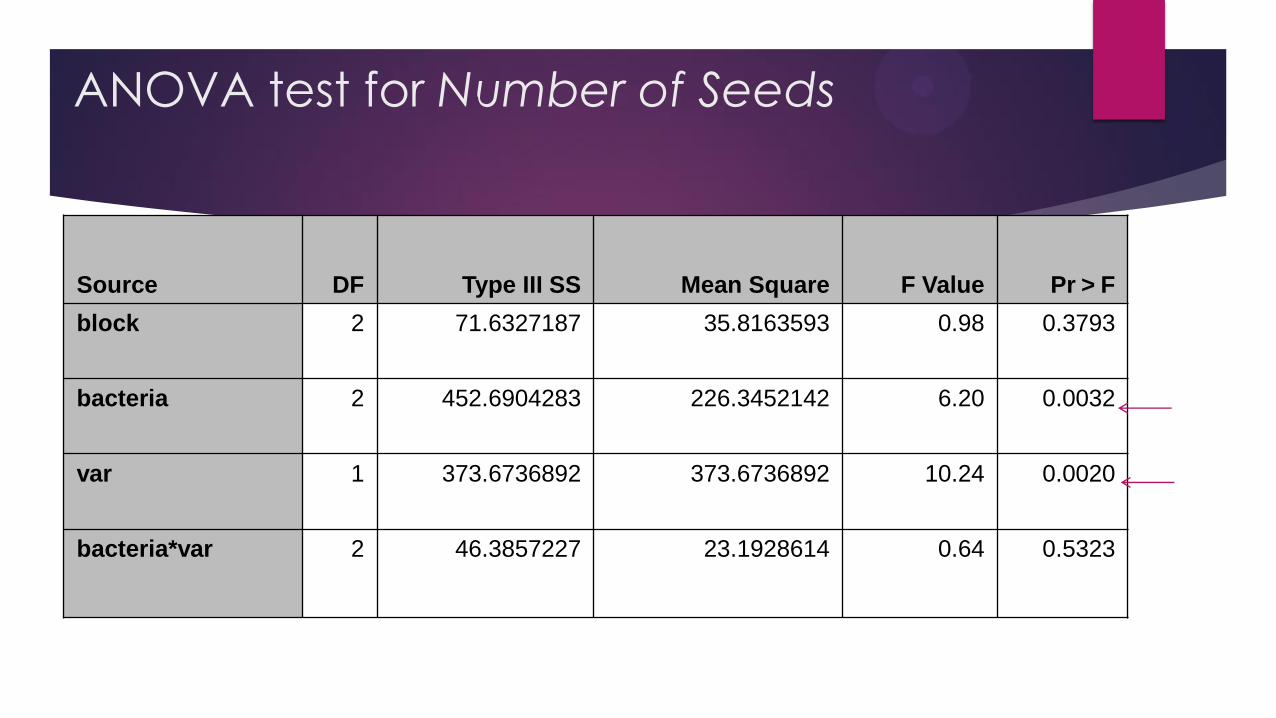
ANOVA test for Number of Seeds
Source DF Type III SS Mean Square F Value Pr > F
block 2 71.6327187 35.8163593 0.98 0.3793
bacteria 2 452.6904283 226.3452142 6.20 0.0032
var 1 373.6736892 373.6736892 10.24 0.0020
bacteria*var 2 46.3857227 23.1928614 0.64 0.5323

LSD test for Number of Seeds
Alpha 0.05
Minimum Significant Difference 3.8421
Means with the same letter are not significantly
different.
Tukey Grouping Mean N bacteria
A 17.186 29 0
B A 14.615 26 1
B 11.767 30 2
Alpha 0.05
Minimum Significant Difference 2.6106
Means with the same letter are not significantly different.
Tukey Grouping Mean N var
A 16.583 41 2
B 12.534 44 1
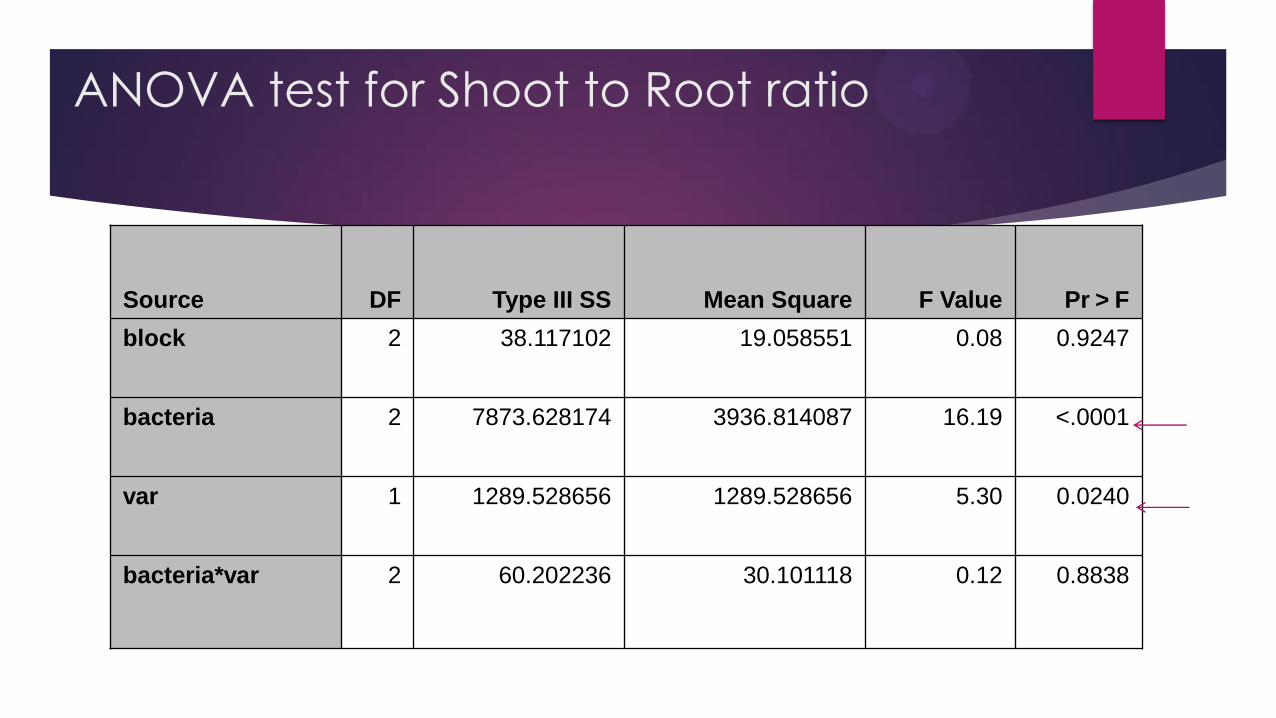
ANOVA test for Shoot to Root ratio
Source DF Type III SS Mean Square F Value Pr > F
block 2 38.117102 19.058551 0.08 0.9247
bacteria 2 7873.628174 3936.814087 16.19 <.0001
var 1 1289.528656 1289.528656 5.30 0.0240
bacteria*var 2 60.202236 30.101118 0.12 0.8838

LSD test for Shoot to Root ratio
Alpha 0.05
Minimum Significant Difference 9.9203
Means with the same letter are not significantly different.
Tukey Grouping Mean N bacteria
A 47.573 30 2
B 37.207 29 0
C 23.994 26 1
Alpha 0.05
Minimum Significant Difference 6.7405
Means with the same letter are not significantly
different.
Tukey Grouping Mean N var
A 40.340 44 1
B 33.050 41 2
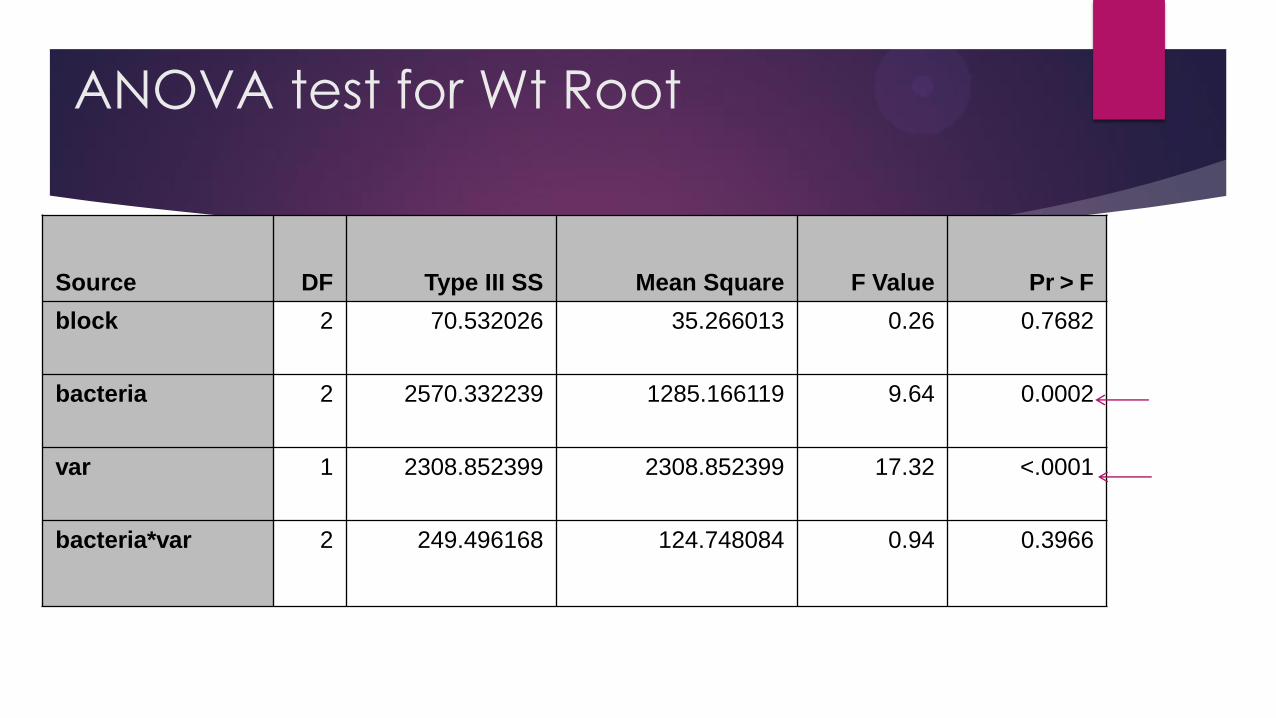
ANOVA test for Wt Root
Source DF Type III SS Mean Square F Value Pr > F
block 2 70.532026 35.266013 0.26 0.7682
bacteria 2 2570.332239 1285.166119 9.64 0.0002
var 1 2308.852399 2308.852399 17.32 <.0001
bacteria*var 2 249.496168 124.748084 0.94 0.3966

LSD test for Wt Root
Alpha 0.05
Minimum Significant Difference 7.3023
Means with the same letter are not significantly
different.
Tukey Grouping Mean N bacteria
A 31.643 30 2
A 31.004 30 0
B 19.742 26 1
Alpha 0.05
Minimum Significant Difference 4.9581
Means with the same letter are not significantly different.
Tukey Grouping Mean N var
A 32.771 44 1
B 22.638 42 2
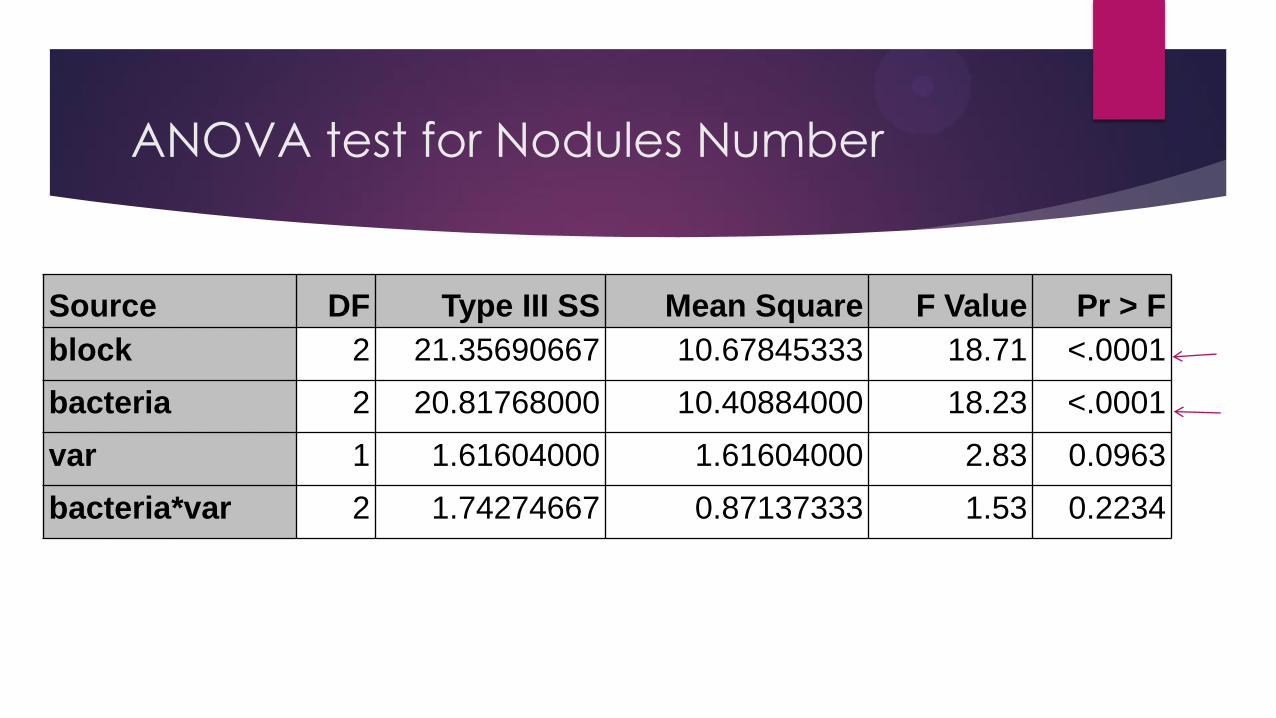
ANOVA test for Nodules Number
Source DF Type III SS Mean Square F Value Pr > F
block 2 21.35690667 10.67845333 18.71 <.0001
bacteria 2 20.81768000 10.40884000 18.23 <.0001
var 1 1.61604000 1.61604000 2.83 0.0963
bacteria*var 2 1.74274667 0.87137333 1.53 0.2234
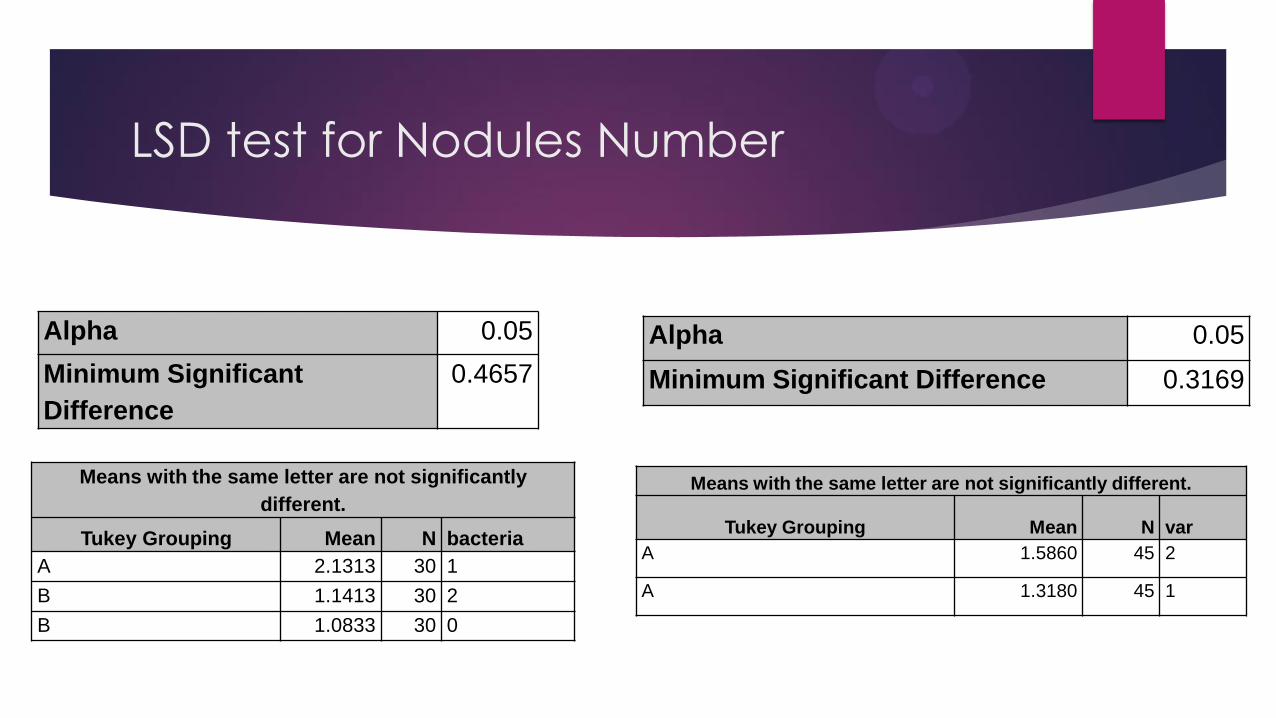
LSD test for Nodules Number
Alpha 0.05
Minimum Significant
Difference
0.4657
Means with the same letter are not significantly
different.
Tukey Grouping Mean N bacteria
A 2.1313 30 1
B 1.1413 30 2
B 1.0833 30 0
Alpha 0.05
Minimum Significant Difference 0.3169
Means with the same letter are not significantly different.
Tukey Grouping Mean N var
A 1.5860 45 2
A 1.3180 45 1

0
0.5
1
1.5
2
2.5
1(0) 2(0) 1(1) 2(1) 1(2) 2(2)
nodNo LSMEAN
nodNo LSMEAN

46
BM EM1
V1 and V2 Chl
V1 highest seed weight.
Nodules Number
Short days to flowering
Days to Pod initiation
Shortest interval to initiation of
pod
Highest shoot to root ratio
Weight of root
Length pod.
Lower Height.
Weight of pods
Highest harvest index
Height
V2 No.leaves
Number of seeds
Nodules Number
Shortest days to flowering
Days to Pod initiation
No.pod
Higher Height
Number of seeds

47