1 unit 2, chapter 4 ecology, ecosystems, and food webs
TRANSCRIPT

1
Unit 2, Chapter 4
Ecology, Ecosystems, and Food Webs

2
Chapter 4Ecology, Ecosystems, and Food Webs
4-1 The Nature of Ecology 4-2 Earth’s Life-Support Systems 4-3 Ecosystem Components 4-4 Energy Flow in Ecosystems 4-5 Primary Productivity of Ecosystems 4-7 Matter Cycling in Ecosystems 4-8 How Do Ecologists Learn about
Ecosystems
3 Slide 1Slide 1Slide 1
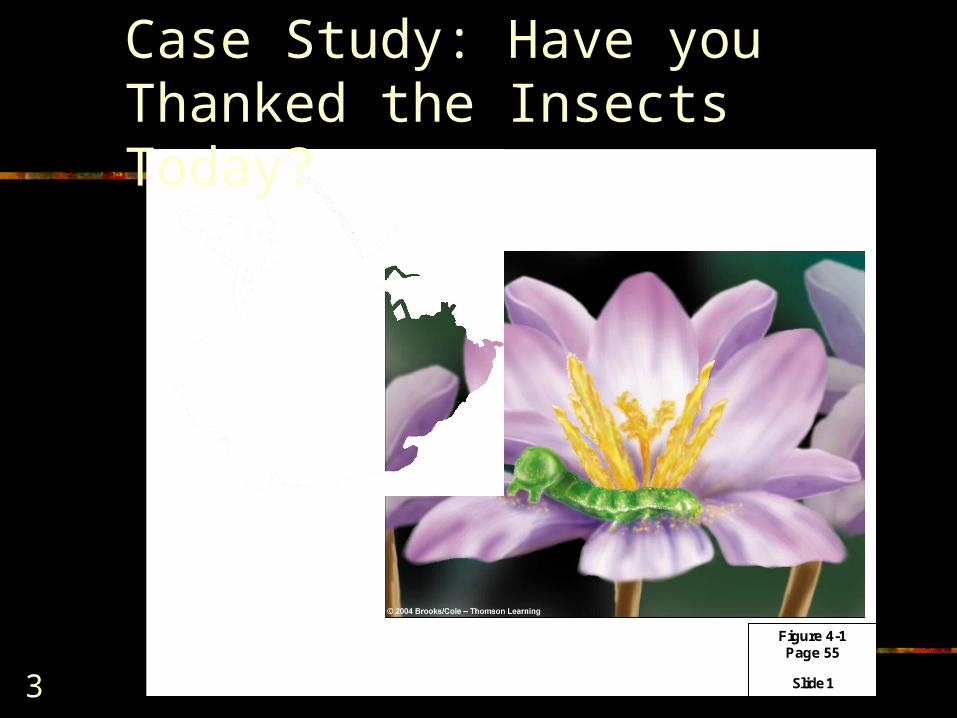
Figure 4-1Page 55
Case Study: Have you Thanked the Insects Today?
4
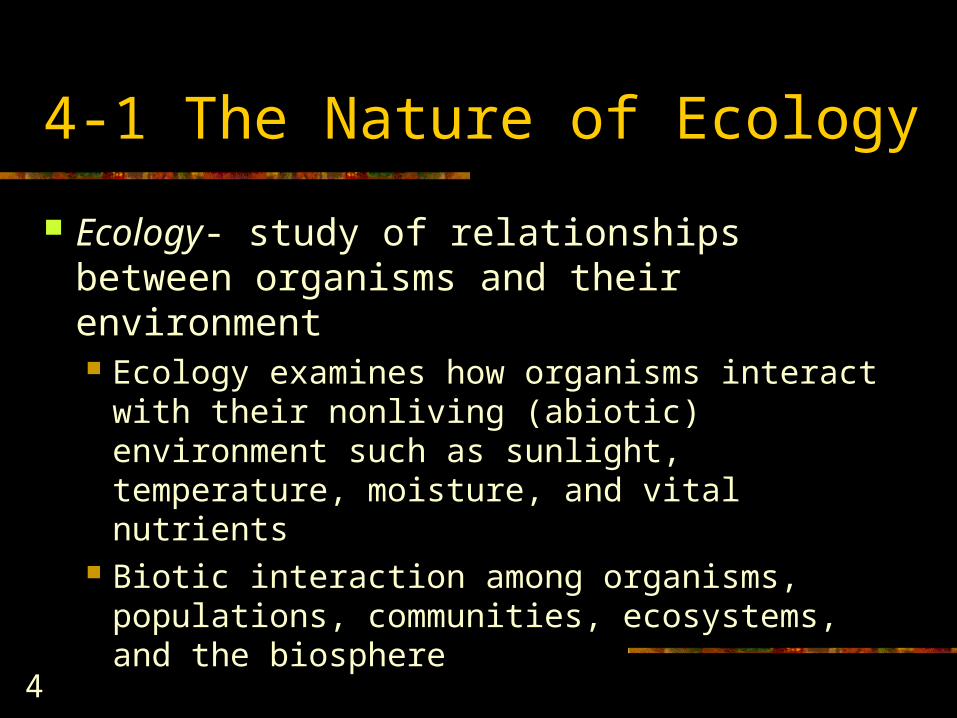
4-1 The Nature of Ecology
Ecology- study of relationships between organisms and their environment Ecology examines how organisms interact
with their nonliving (abiotic) environment such as sunlight, temperature, moisture, and vital nutrients
Biotic interaction among organisms, populations, communities, ecosystems, and the biosphere

5
Animation
Click to view animation.
Levels of organization interaction.

6
Prokaryotic Cells
• Bacteria cells
• Surrounded by a membrane but have no distinct nucleus or other internal parts enclosed by membranes.

7
Eukaryotic Cells
Cells surrounded by a membrane with a nucleus and several other internal parts.
Nucleus-membrane-bounded structure containing genetic material in the form of DNA.
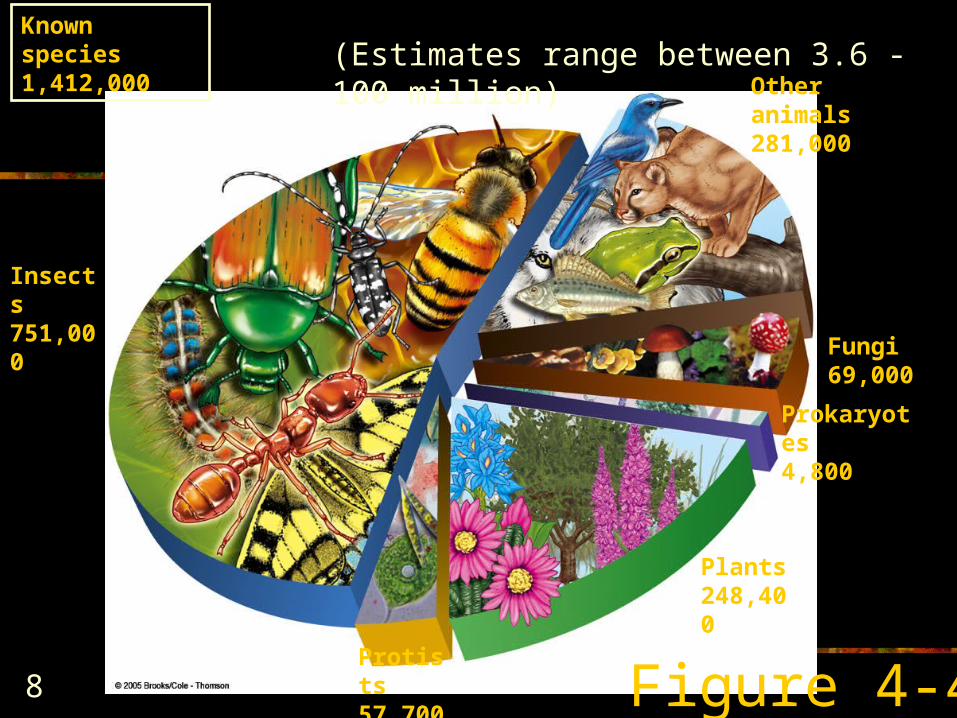
8 Figure 4-4
Insects751,000
Protists57,700
Plants248,400
Prokaryotes4,800
Fungi69,000
Other animals281,000
Known species1,412,000 (Estimates range between 3.6 - 100 million)
9
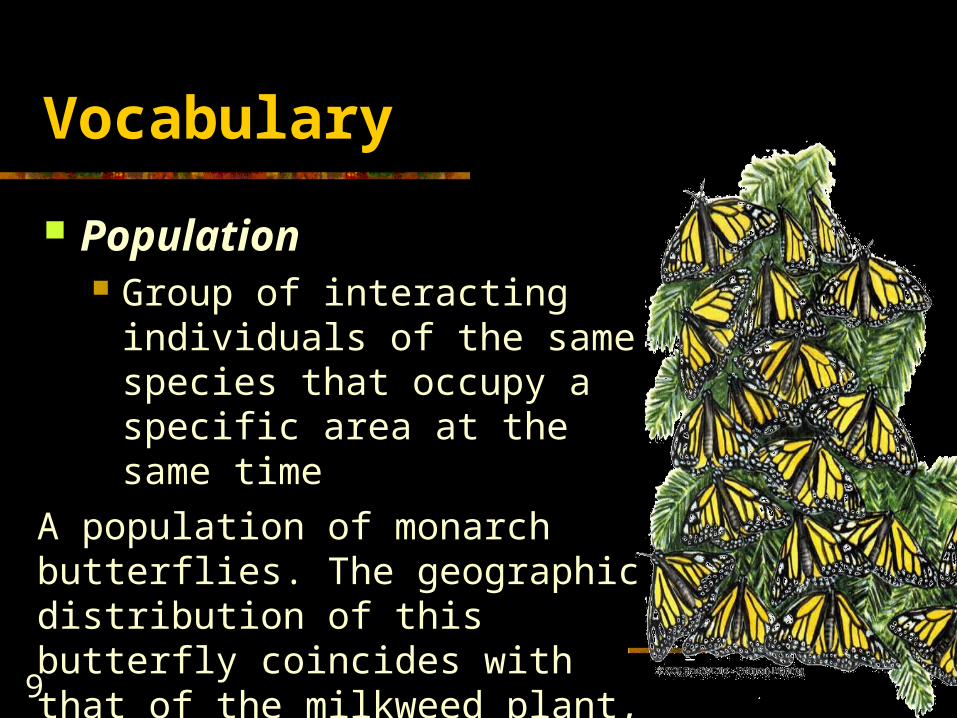
Vocabulary
Population Group of interacting individuals
of the same species that occupy a specific area at the same time
A population of monarch butterflies. The geographic distribution of this butterfly coincides with that of the milkweed plant, on which monarch larvae and caterpillar feed
10
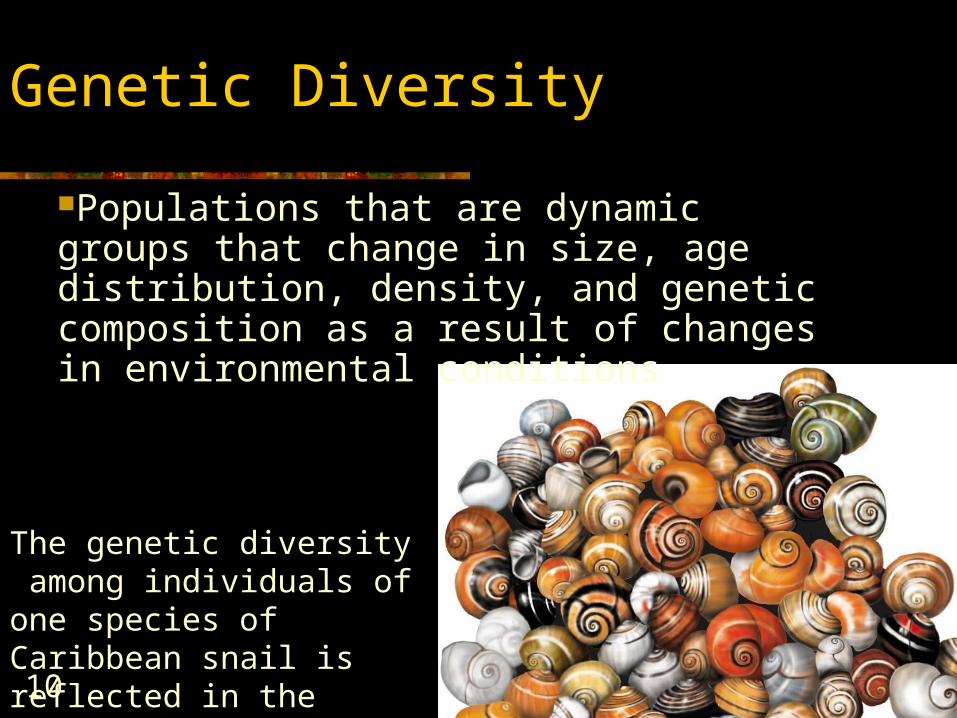
Genetic Diversity
The genetic diversity among individuals of one species of Caribbean snail is reflected in the variations in shell color and banding patterns.
Populations that are dynamic groups that change in size, age distribution, density, and genetic composition as a result of changes in environmental conditions

11
Habitat Place where a population or individual
organism naturally lives Community
Complex interacting network of plants, animals, and microorganisms
Ecosystem Community of different species interacting
with one another and with their nonliving environment of matter and energy
Ecosphere or Biosphere All earth's ecosystems


Thin envelope of air around the planet Troposphere
extends about 17 kilometers above sea level, contains nitrogen (78%), oxygen(21%), and is where weather occurs
Stratosphere 17-48 kilometers above
sea level, lower portions contains enough ozone (O3) to filter out most of the sun’s ultraviolet radiation
4-2 Atmosphere

14
Consists of the earth’s liquid water, ice, and water vapor in the atmosphere
4-2 Hydrosphere

15
4-2 Geosphere
Lithosphere Crust and upper mantle
Crust Outermost, thin silicate zone, eight
elements make up 98.5% of the weight of the earth’s crust
The Earth contains several layers or concentric spheres

16
4-2 Geosphere Mantle
Surrounded by a thick, solid zone, largest zone, rich with iron, silicon, oxygen, and magnesium, very hot
Core Innermost zone, mostly iron, solid
inner part, surrounded by a liquid core of molten material
Inner Core is hotter than surface of the Sun
17
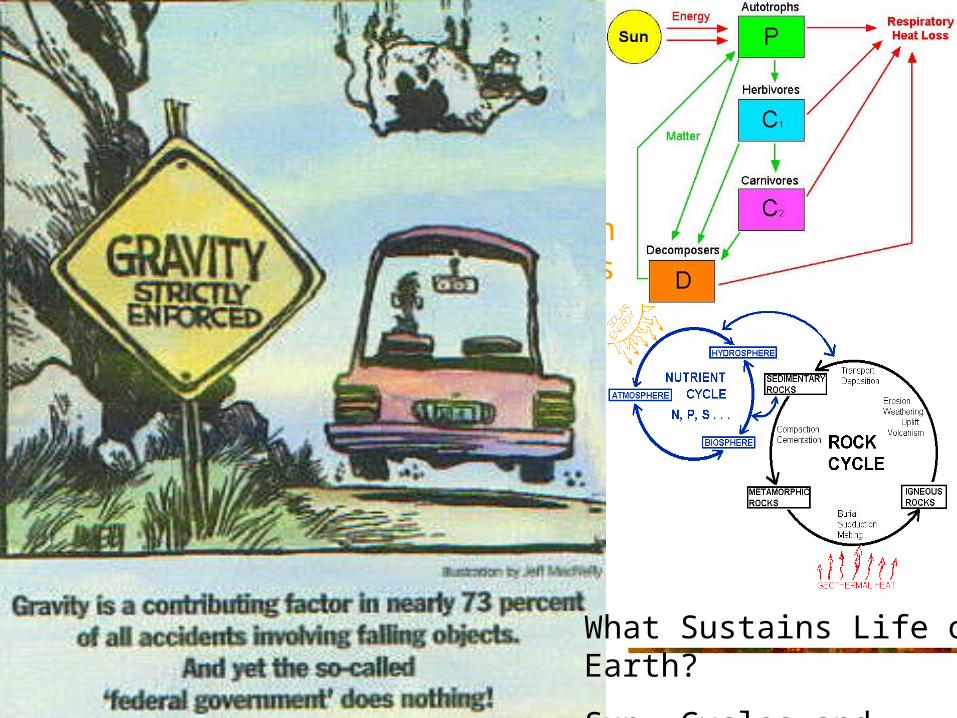
What Sustains Life on Earth?
Life on the earth depends on three interconnected factors One-way flow of high-quality
energy from the sun Cycling of matter or nutrients (all
atoms, ions, or molecules needed for survival by living organisms), through all parts of the ecosphere
Gravity, which allows the planet to hold onto its atmosphere and causes the downward movement of chemicals in the matter cycles
What Sustains Life on Earth?
Sun, Cycles and Gravity

18
Sun
Fireball of hydrogen (72%) and helium (28%)
Nuclear fusion Sun has existed for 6 billion years Sun will stay for another 6.5 billion years Visible light that reaches troposphere is the
ultraviolet ray which is not absorbed in ozone

19
Solar Energy
72% of solar energy warms the lands 0.023% of solar energy is captured by
green plants and bacteria Powers the cycling of matter and
weather system Distributes heat and fresh water

20
Click to view animation.
Animation
Sun to earth animation.

www.bom.gov.au/lam/climate/levelthree/ climch/clichgr1.htm

22
Type of Nutrients
Nutrient Any atom, ion, or molecule an organism needs to live
grow or reproduce Ex: carbon, oxygen, hydrogen, nitrogen… etc
Macronutrient nutrient that organisms need in large amount Ex: phosphorus, sulfur, calcium, iron … etc
Micronutrient nutrient that organism need in small amount Ex: zinc, sodium, copper… etc

23
Carboncycle
Phosphoruscycle
Nitrogencycle
Watercycle
Oxygencycle
Heat in the environment
Heat Heat Heat
24
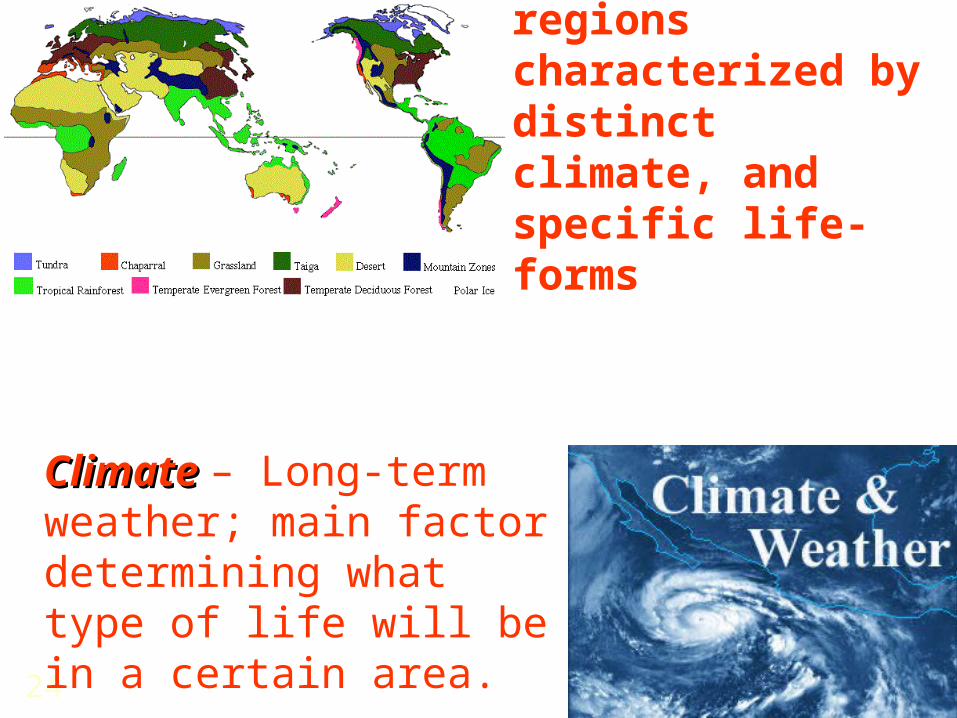
Biomes – Large regions characterized by distinct climate, and specific life-forms
ClimateClimate – Long-term weather; main factor determining what type of life will be in a certain area.
25
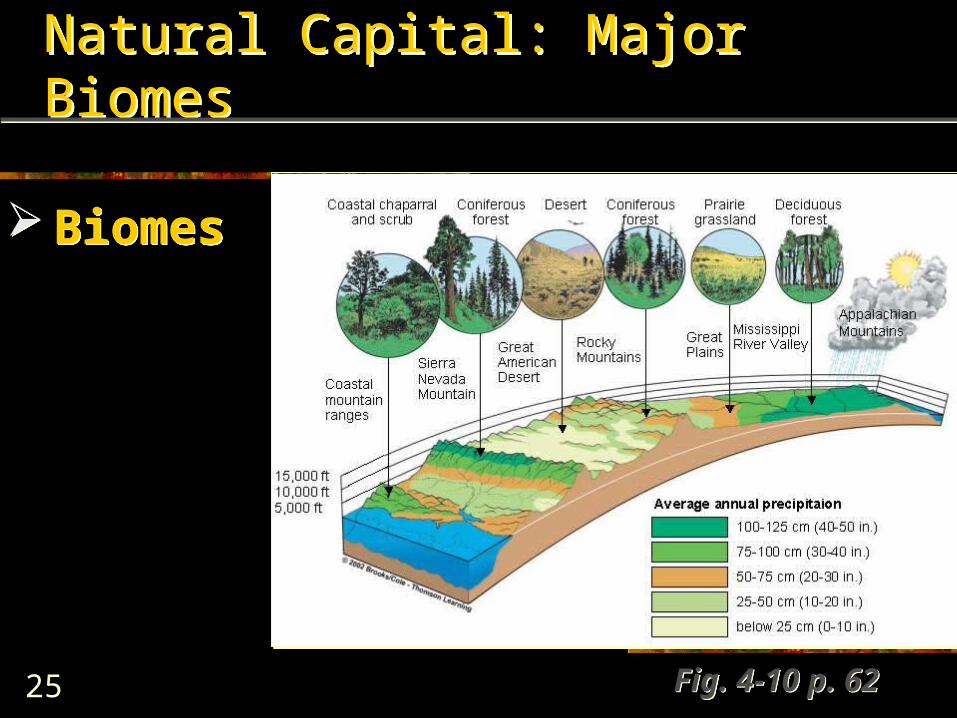
Natural Capital: Major BiomesNatural Capital: Major Biomes
Biomes Biomes
Fig. 4-10 p. 62Fig. 4-10 p. 62

26
Ecosphere Separation
The Ecosphere and it’s ecosystem can be separated into two parts Abiotic- nonliving, components
Ex: air, water, solar energy Physical and chemical factors that influence living
organisms Biotic- living, components
Ex: plants and animals

27
Click to view animation.
Animation
The role of organisms in an ecosystem
28
Range of Tolerance
Variations in it’s physical and chemical environment Differences in genetic makeup, health,
and age. Ex: trout has to live in colder water than
bass

29
Ecosystem Factors
Range of toleranceRange of tolerance
Fig. 4-13 p. 64Fig. 4-13 p. 64

30
Limiting Factor
More important than others in regulating population growth Ex: water light, and soil Lacking water in the desert can limit the
growth of plants

31
Limiting Factor Principle
Too much or too little of any abiotic factor can limit growth of population, even if all the other factors are at optimum (favorable) range of tolerance. Ex: If a farmer plants corn in phosphorus-poor
soil, even if water, nitrogen are in a optimum levels, corn will stop growing, after it uses up available phosphorus.

32
Figure 4-14Sugar Maple distribution
Sugar Maple
The physical conditions of the environment can limit the distribution of a species.

33
Dissolved Oxygen (DO) Content
Amount of oxygen gas dissolved in a given volume of water at a particular temperature and pressure. Limiting factor of
aquatic ecosystem
34
Living Organisms in Ecosystem
Producers or autotrophs- makes their own food from compound obtained from environment.
Ex: plant gets energy from sun to make its own food

35
Click to view animation.
Animation
Matter recycling and energy flow animation.

Living Organisms in Ecosystem
Photosynthesis- ability of producer to Photosynthesis- ability of producer to convert sunlight, abiotic nutrients to sugars convert sunlight, abiotic nutrients to sugars and other complex organic compoundsand other complex organic compounds
Chlorophyll- traps solar energy and converts Chlorophyll- traps solar energy and converts into chemical energyinto chemical energy
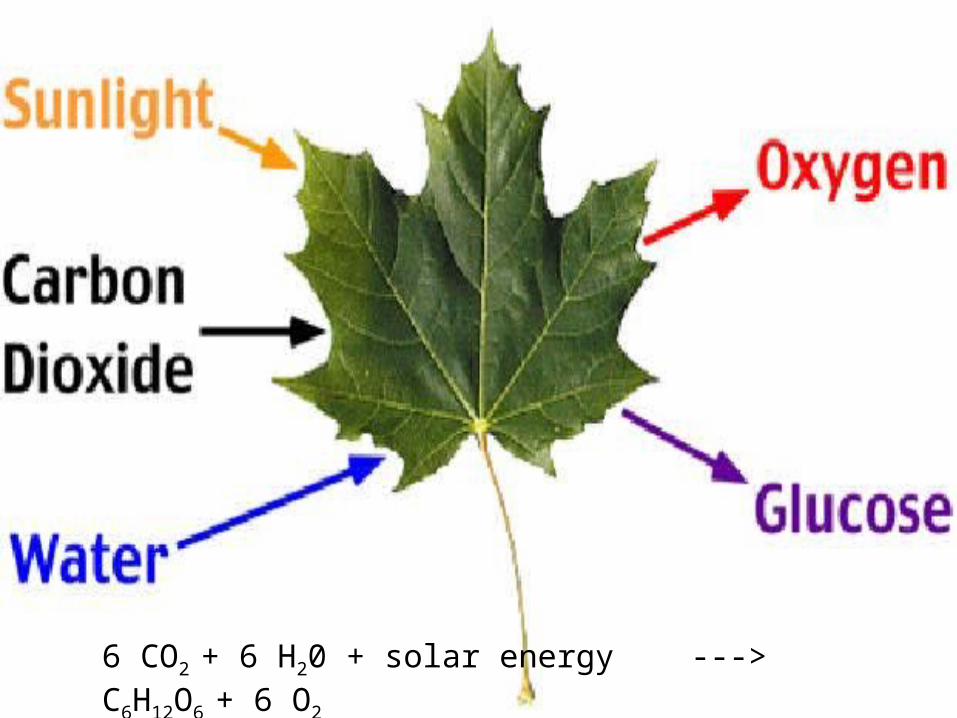
6 CO2 + 6 H20 + solar energy ---> C6H12O6 + 6 O2

38
Producer transmit 1-5% of absorbed energy into chemical energy, which is stored in complex carbohydrates, lipids, proteins and nucleic acid in plant tissue
39
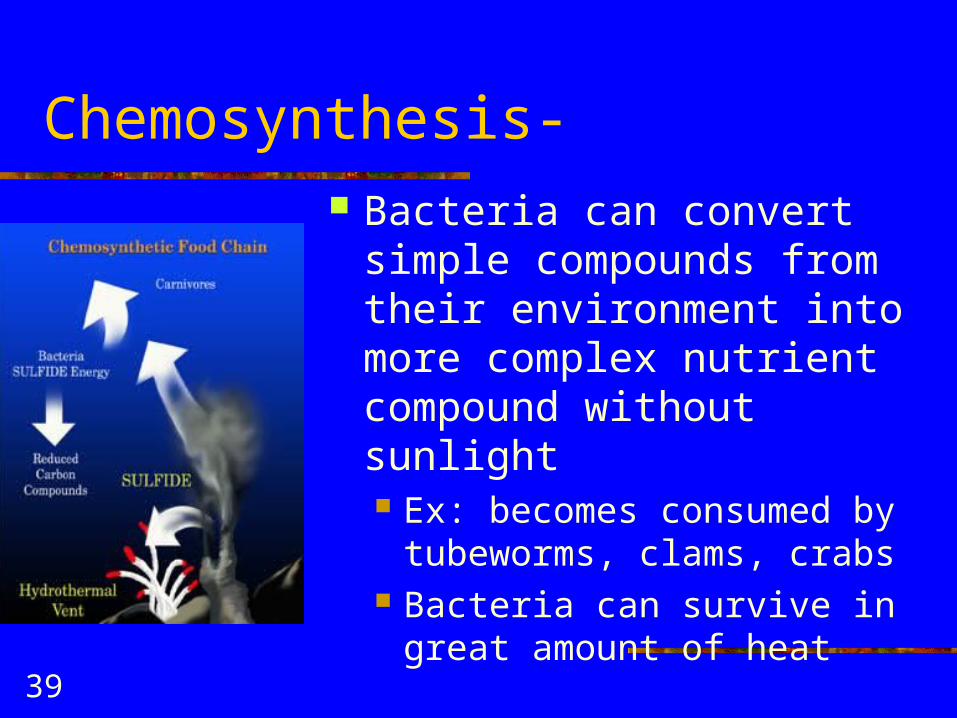
Chemosynthesis- Bacteria can convert simple
compounds from their environment into more complex nutrient compound without sunlight Ex: becomes consumed by
tubeworms, clams, crabs Bacteria can survive in great
amount of heat

40
Consumers or Heterotrophs
Obtain energy and nutrients by feeding on other organisms or their remains

41
Consumers
Herbivores (plant-eaters) or primary consumers
Feed directly on producers Deer, goats, rabbits
http://www.holidays.net/easter/bunny1.htm

42
Consumers
Carnivores (meat eater) or secondary consumers
Feed only on primary consumer Lion, Tiger

43
Consumers
Tertiary (higher-level) consumer
Feed only on other carnivores Wolf

44
Consumers
Omnivores- consumers that eat both plants and animals Ex: pigs, humans,
bears
45
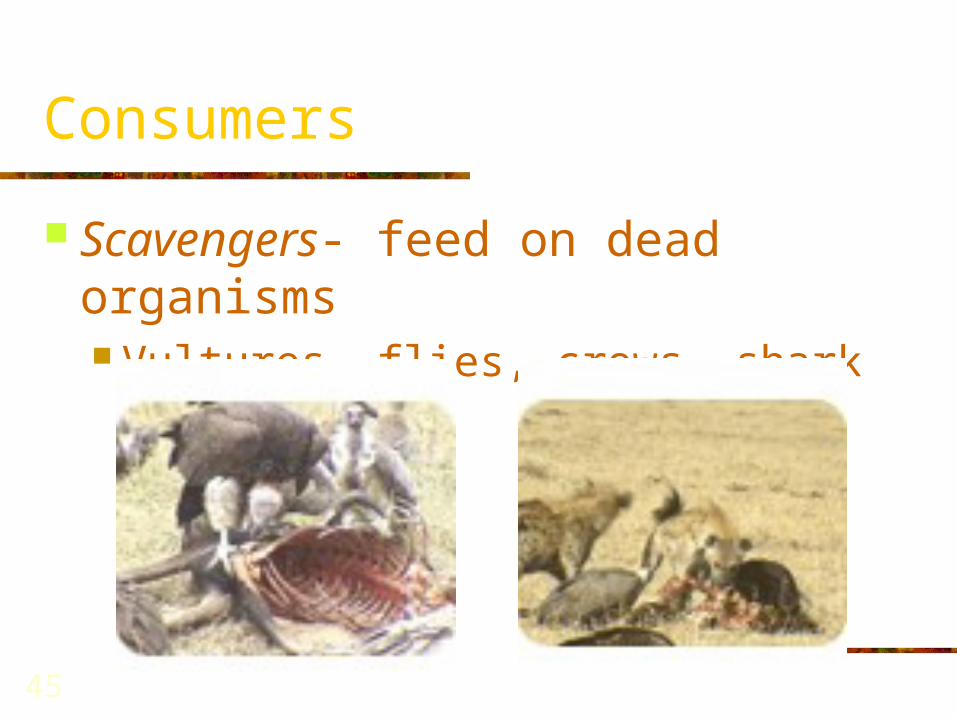
Consumers
Scavengers- feed on dead organisms Vultures, flies, crows, shark

46
Consumers
Detritivores- live off detritus Detritus parts of dead
organisms and wastes of living organisms.
Detritus feeders- extract nutrients from partly decomposed organic matter plant debris, and animal dung.

47
Consumers
Decomposers - Fungi and bacteria break down and recycle organic materials from organisms’ wastes and from dead organisms Food sources for worms
and insects Biodegradable - can be
broken down by decomposers
48
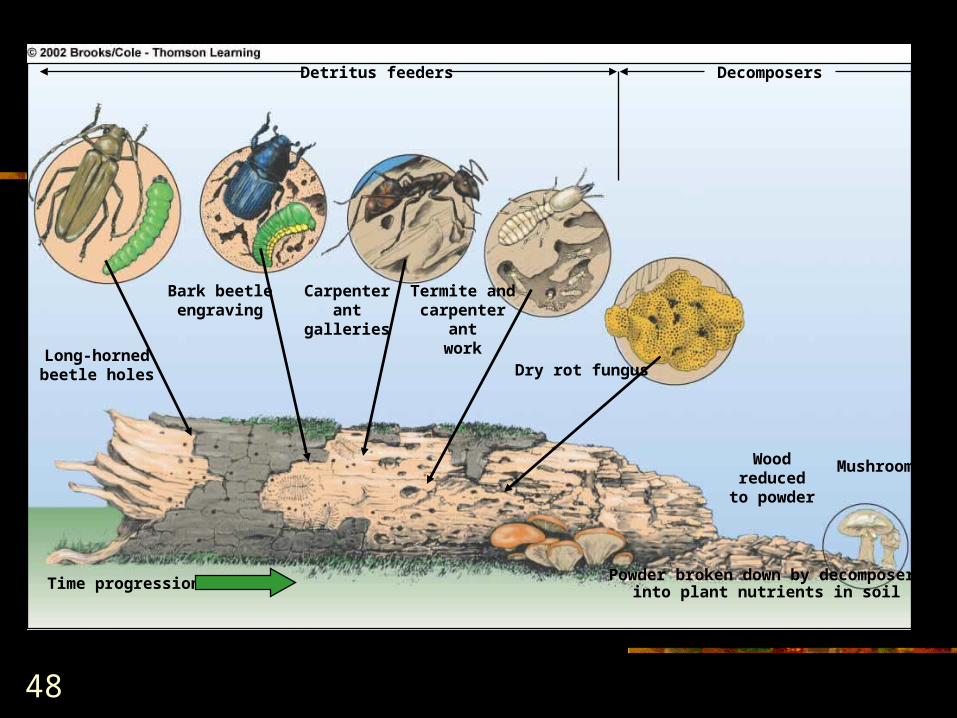
MushroomWoodreduced
to powder
Long-hornedbeetle holes
Bark beetleengraving
Carpenterant
galleries
Termite andcarpenter
antwork
Dry rot fungus
Detritus feeders Decomposers
Time progression Powder broken down by decomposersinto plant nutrients in soil

49
Respiration
Aerobic Respiration Uses oxygen to convert organic nutrients
back into carbon dioxide and water Glucose + oxygen Carbon dioxide + water
+ energy Anaerobic Respiration or Fermentation
Breakdown of glucose in absence of oxygen Methane gas is a product

50
Biodiversity
Genetic diversity- the variety of genetic material within a species or population
Genetic diversity- the variety of genetic material within a species or population
Species diversity- the number of species presented in different habitats
Species diversity- the number of species presented in different habitats
Ecological diversity- the variety of
terrestrial and aquatic ecosystems found in an area or on the earth
Ecological diversity- the variety of
terrestrial and aquatic ecosystems found in an area or on the earth
Functional diversity- the biological and chemical processes needed for the survival of species,communities, and ecosystems
Functional diversity- the biological and chemical processes needed for the survival of species,communities, and ecosystems
51
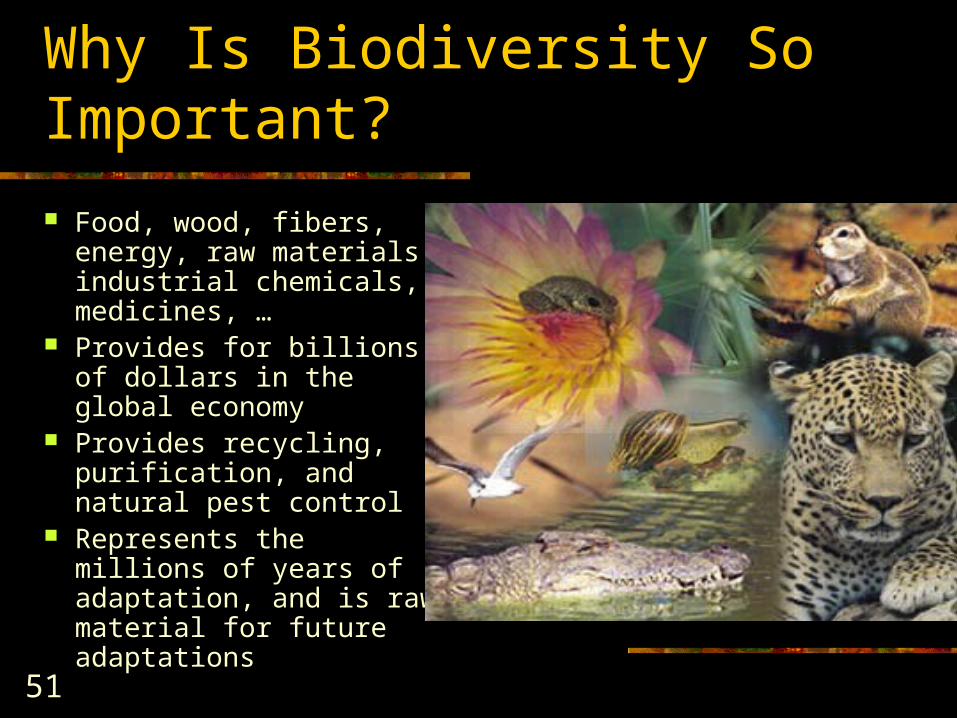
Why Is Biodiversity So Important?
Food, wood, fibers, energy, raw materials, industrial chemicals, medicines, …
Provides for billions of dollars in the global economy
Provides recycling, purification, and natural pest control
Represents the millions of years of adaptation, and is raw material for future adaptations

52
Food Chain Food Chain-Series of organisms
in which each eats or decomposes the preceding one Decomposers complete the cycle of
matter by breaking down organic waste, dead animal. Plant litter and garbage.
Whether dead or alive organisms are potential (standard) sources of food for other organisms.

53
Heat Heat Heat Heat
Heat
Heat
Heat
First TrophicLevel
Second TrophicLevel
Third TrophicLevel
Fourth TrophicLevel
Solarenergy
Producers(plants)
Primaryconsumers(herbivores)
Tertiaryconsumers
(top carnivores)
Secondaryconsumers(carnivores)
Detritivores(decomposers and detritus feeders)
Heat Heat
Figure 4-18 Model of a food chain

54
Second Law of Energy
Organisms need high quality chemical energy to move, grow and reproduce, and this energy is converted into low-quality heat that flows into environment Trophic levels or feeding levels- Producer is a first
trophic level, primary consumer is second trophic level, secondary consumer is third.
Decomposers process detritus from all trophic levels.

Food WebFood Web Complex
network of interconnected food chains
Food web and chains One-way flow of
energy Cycling of
nutrients through ecosystem
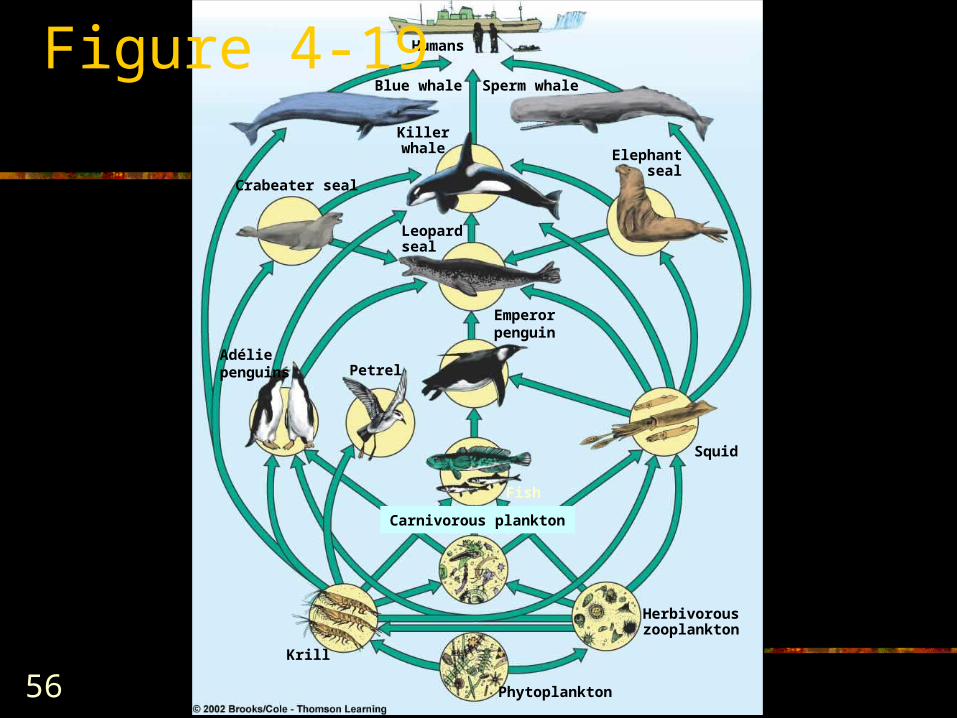
56
Humans
Blue whale Sperm whale
Crabeater seal
Killerwhale Elephant
seal
Leopardseal
Adéliepenguins Petrel
Fish
Squid
Carnivorous plankton
Krill
Phytoplankton
Herbivorouszooplankton
Emperorpenguin
Figure 4-19

57
What do the arrows indicate in a food web?
They indicate the flow of energy from producers to consumers.
If a worm is eaten by a robin, does the arrow point to the worm or the robin?
The robin!

58
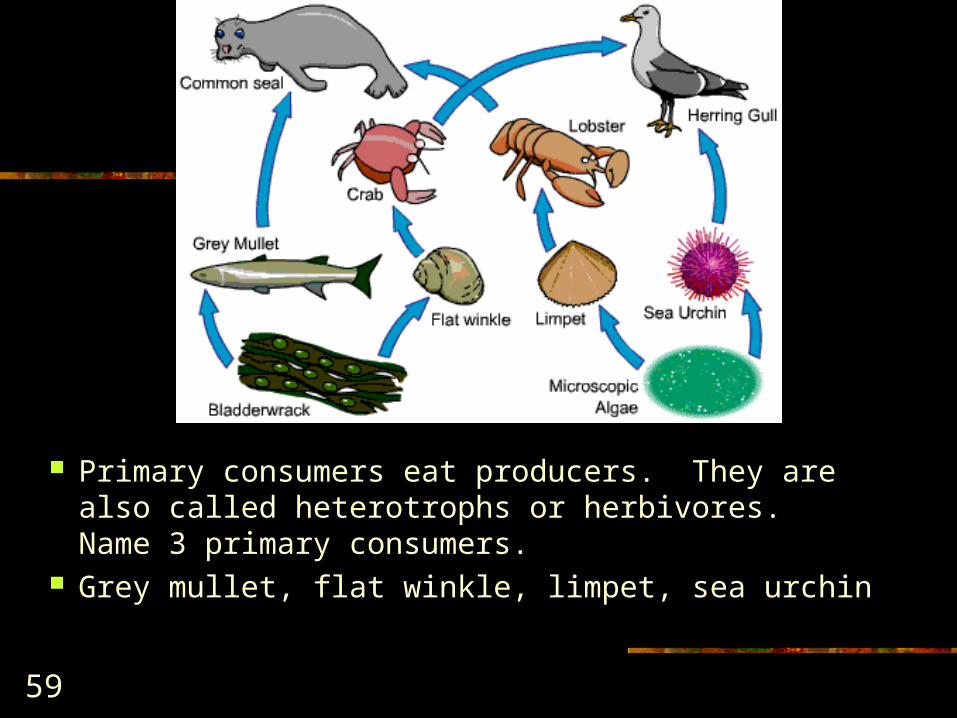
Producers make their food from the sun’s energy. They are also called autotrophs. Name 2 producers
Algae, bladderwrack
59
Primary consumers eat producers. They are also called heterotrophs or herbivores. Name 3 primary consumers.
Grey mullet, flat winkle, limpet, sea urchin

60
Secondary consumers eat primary consumers. They are also called carnivores. Name 3 secondary consumers.
Crab, seal, lobster, herring gull

61
Tertiary consumers eat secondary consumers. Are there any?
Yes…….seal, herring gull

62
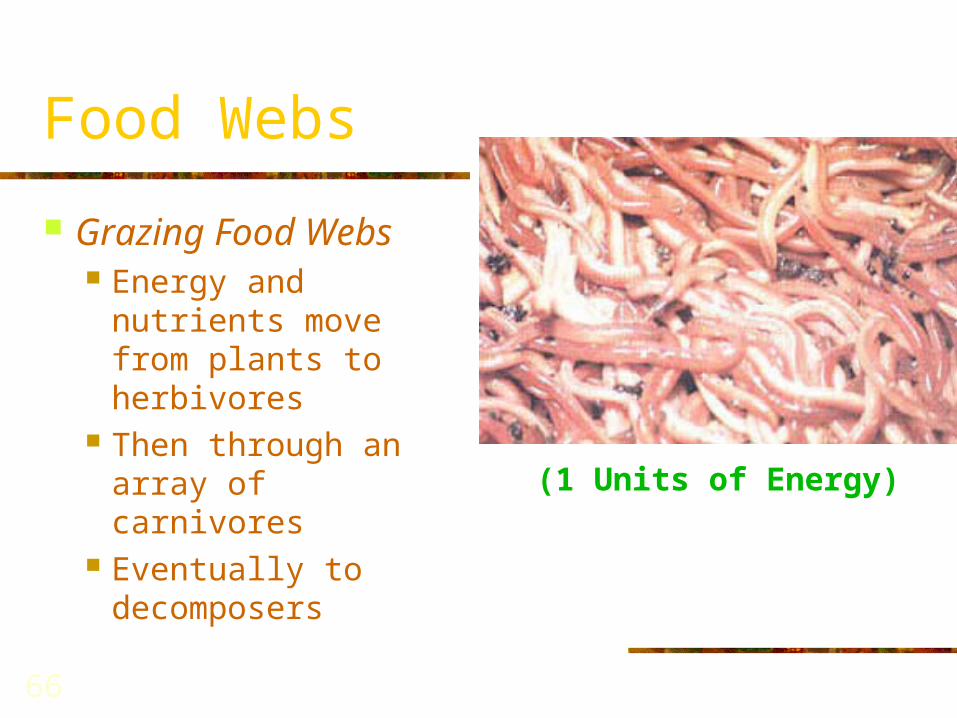
Food Webs
Grazing Food Webs Energy and nutrients
move from plants to herbivores
Then through an array of carnivores
Eventually to decomposers
(100,000 Units of Energy)

63
Food Webs
Grazing Food Webs Energy and nutrients
move from plants to herbivores
Then through an array of carnivores
Eventually to decomposers
(1,000 Units of Energy)

64
Food Webs
Grazing Food Webs Energy and nutrients
move from plants to herbivores
Then through an array of carnivores
Eventually to decomposers
(100 Units of Energy)

65
Food Webs
Grazing Food Webs Energy and nutrients
move from plants to herbivores
Then through an array of carnivores
Eventually to decomposers
(10 Units of Energy)
66
Food Webs
Grazing Food Webs Energy and nutrients
move from plants to herbivores
Then through an array of carnivores
Eventually to decomposers
(1 Units of Energy)

67
Food Webs
Detrital Food Webs Organic waste
material or detritus is the major food source
Energy flows mainly from producers (plants) to decomposers and detritivores.

Pyramid of Energy Flow Loss of usable energy as energy flows
through trophic levels of food chains and webs
Rarely have more than 4 steps

69
Biomass
Dry weight of all organic matter contained in organisms. Biomass is measured in dry weight
Water is not source of energy or nutrient Biomass of first trophic levels is dry mass of
all producers Useable energy transferred as biomass varies
from 5%-20% (10% standard)

Pyramid of BiomassStorage of biomass at various trophic levels
of ecosystem
71
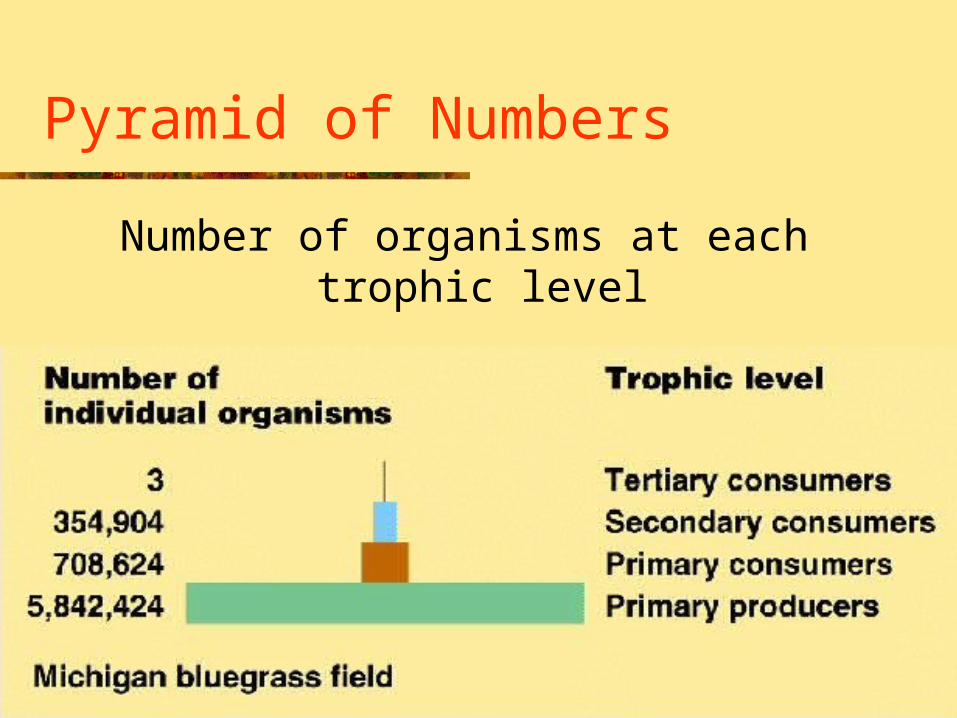
Pyramid of Numbers
Number of organisms at each trophic level

72
Primary Productivity of Ecosystems
1) The amount of life an ecosystem can support is determined by the energy captured by the producers and converted to biomass during photosynthesis
2) Gross primary productivity (GPP) = RATE at which biomass (all plant material) is made by producers during photosynthesis in an ecosystem
3) Net primary productivity (NPP) = RATE at which biomass is made by producers minus RATE at which the producers use what they produce for respiration.
NPP is the biomass available on which heterotrophs are able to feed

73
Primary Productivity Equations
GPP and NPP is measured in kilocalories (kcal) of energy or grams (g) of biomass
Units: kilocalories/square meter/yr (kcal/m2/yr) Grams/square meter/yr (g/m2/yr)
Equations for calculating productivity:* NPP = GPP – R (respiration loss)
* % Efficiency of Photosynthesis = NPP/insolation energy X 100
74
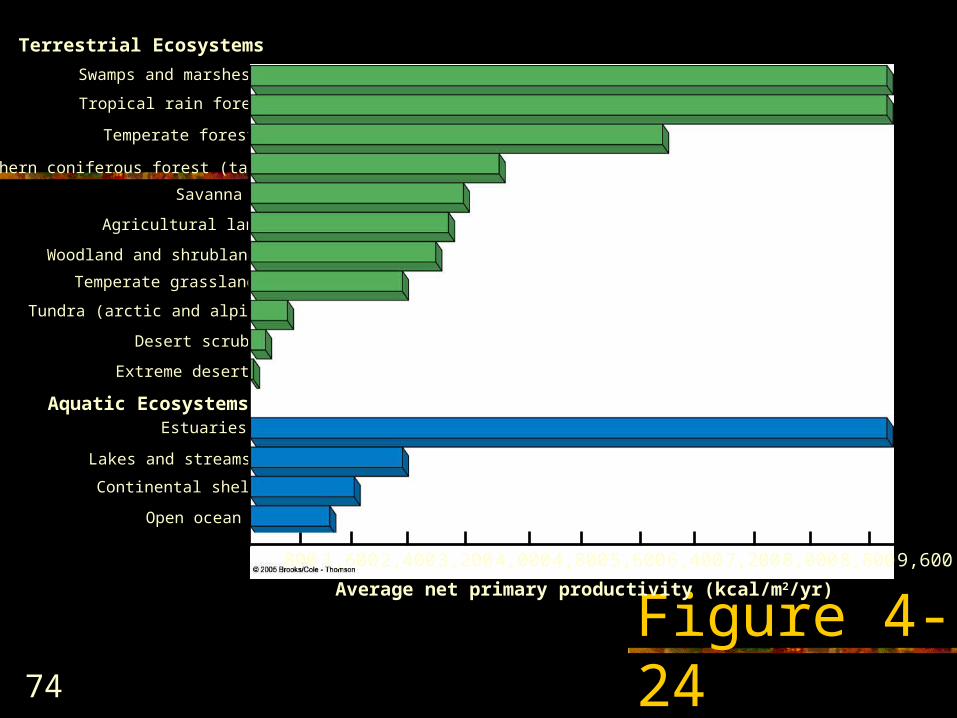
Swamps and marshes
Tropical rain forest
Temperate forest
Northern coniferous forest (taiga)
Savanna
Agricultural land
Woodland and shrubland
Temperate grassland
Tundra (arctic and alpine)
Desert scrub
Extreme desert
Estuaries
Lakes and streams
Continental shelf
Figure 4-24
Terrestrial Ecosystems
Open ocean
Aquatic Ecosystems
800 1,600 2,400 3,200 4,000 4,800 5,600 6,400 7,200 8,000 8,800 9,600
Average net primary productivity (kcal/m2/yr)
75
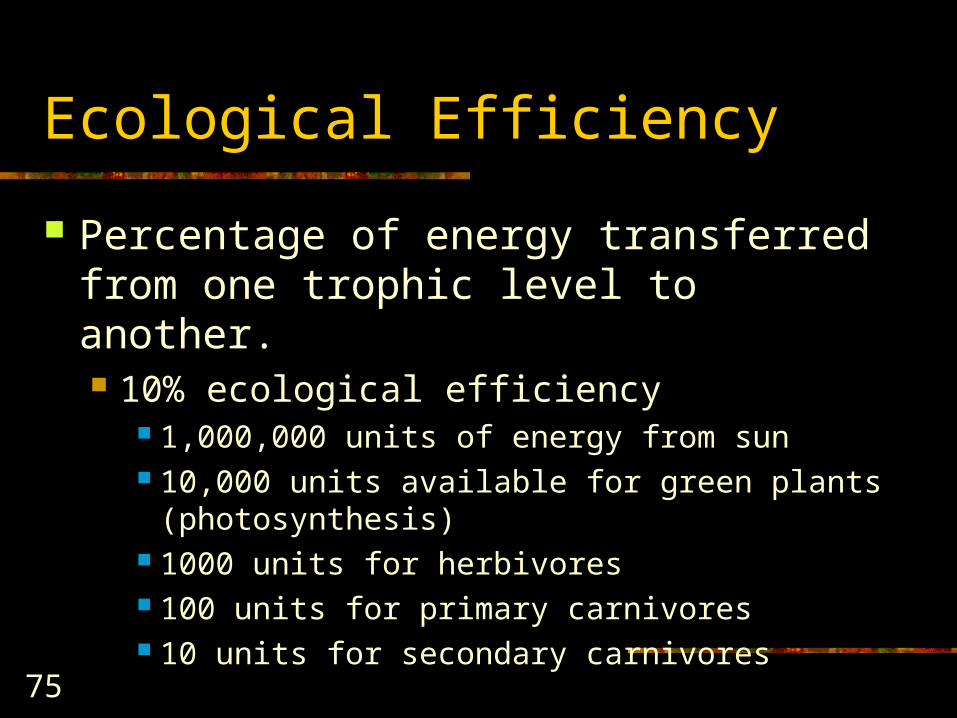
Ecological Efficiency
Percentage of energy transferred from one trophic level to another. 10% ecological efficiency
1,000,000 units of energy from sun 10,000 units available for green plants
(photosynthesis) 1000 units for herbivores 100 units for primary carnivores 10 units for secondary carnivores

76
Matter Cycling in Ecosystems
Nutrient or Biogeochemical Cycles Natural processes that recycle
nutrients in various chemical forms in a cyclic manner from the nonliving environment to living organisms and back again
77
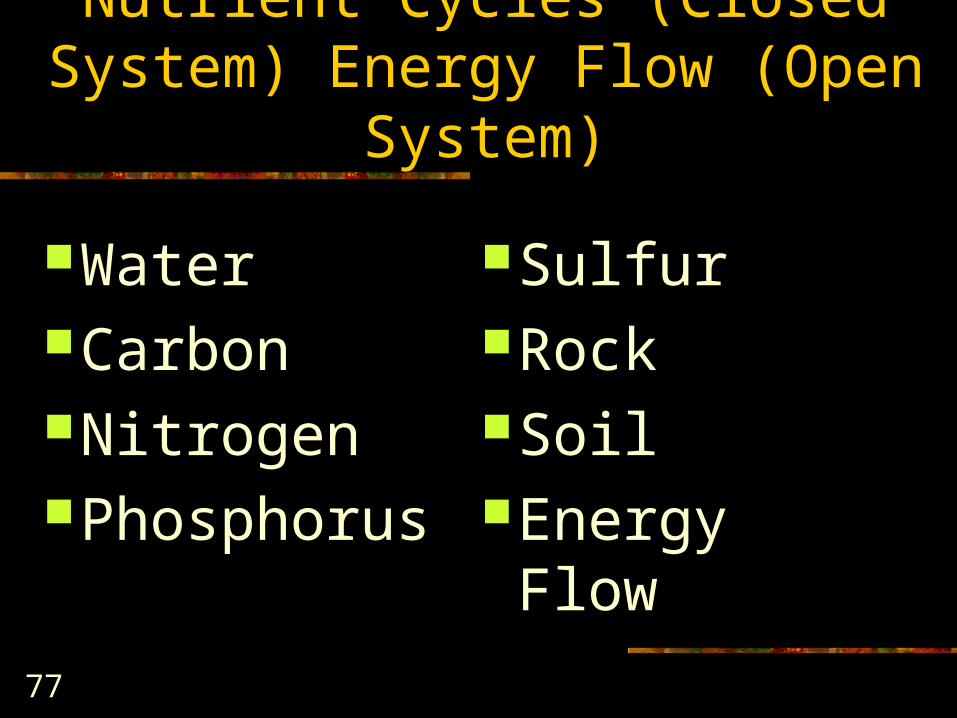
Nutrient Cycles (Closed System) Energy Flow (Open System)
WaterCarbonNitrogenPhosphorus
SulfurRockSoilEnergy Flow

78
Figure 4-28Page 76
Precipitation toland
Transpirationfrom plants
RunoffSurface runoff(rapid)
Evaporationfrom land Evaporation
from ocean Precipitation toocean
Ocean storage
Surfacerunoff(rapid)
Groundwater movement (slow)
Rain cloudsCondensation
Transpiration
Evaporation
PrecipitationPrecipitation
Infiltration andPercolation
Hydrologic (Water) Cycle

79
Click to view animation.
Water cycle interaction.
Animation

80
The Carbon Cycle (Marine)
Fig. 4-29, p. 78Fig. 4-29, p. 78

81
The Carbon Cycle (Terrestrial)
Fig. 4-29, p. 79Fig. 4-29, p. 79

82
Figure 4-30Page 79Year
1850 1900 1950 2000 20300
2
3
4
5
6
7
8
9
10
11
12
13
14
CO
2 em
issi
on
s fr
om
fo
ssil
fuel
(b
illio
n m
etri
c to
ns
of
carb
on
eq
uiv
alen
t)
1
Highprojection
Lowprojection

83
The Nitrogen CycleFig. 4-31 p. 80Fig. 4-31 p. 80

84
Click to view animation.
Nitrogen cycle interaction.
Animation
85
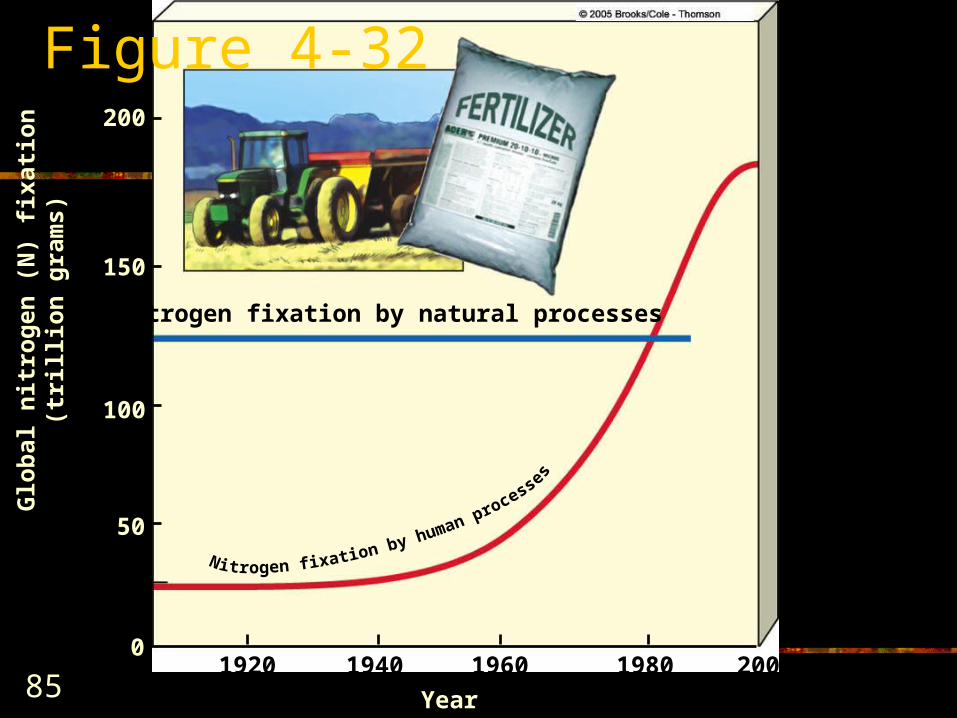
Figure 4-32
1920 1940 1960 1980 2000
Glo
bal
nit
rog
en (
N)
fixa
tio
n(t
rill
ion
gra
ms)
0
50
100
150
200
Year
Nitrogen fixation by natural processes

86
Nitrogen fixation: The assimilation of atmospheric nitrogen into ammonia, most commonly through metabolic processes of soil microorganisms. Other agents of nitrogen fixation include lightning,forest fires, and the industrial process used to manufacture synthetic fertilizers.
Nitrification -ammonia (NH4+) is converted to nitrite
ions (NO2-), then to nitrate ions (NO3
-). Assimilation is where plant roots absorb ammonium,
ions, and nitrate ions for use in making molecules such as DNA, amino acids, and proteins.
Ammonification- The conversion of organic nitrogen to ammonia or ammonium ion by bacteria involved in the decomposition of organic matter
Denitrification- Nitrate ions and nitrite ions are converted into nitrous oxide gas and nitrogen gas(N2)
87
Click to view animation.
Animation
Phosphorus cycle animation.

88
Click to view animation.
Animation
Phosphorus cycle interaction.

89
The Phosphorus Cycle
Fig. 4-33 p. 82Fig. 4-33 p. 82

90
The Sulfur Cycle
Fig. 4-34 p. 83Fig. 4-34 p. 83

91
Click to view animation.
Animation
Sulfur cycle animation.

92
Biogeochemical Cycle Locations
Hydrosphere Water in the form of ice, liquid, and vapor Operates local, regional, and global levels
Atmospheric Large portion of a given element (i.e. Nitrogen gas) exists in
gaseous form in the atmosphere Operates local, regional, and global levels
Sedimentary The element does not have a gaseous phase or its gaseous
compounds don’t make up a significant portion of its supply
Operates local and regional basis

93
Nutrient Cycling & Ecosystem Sustainability
Natural ecosystems tend to balance Nutrients are recycled with reasonable efficiency
Humans are accelerating rates of flow of mater Nutrient loss from soils Doubling of normal flow of nitrogen in the
nitrogen cycle is a contributes to global warming, ozone depletion, air pollution, and loss of biodiversity
Isolated ecosystems are being influenced by human activities

94
Studying Ecosystems
FIELD RESEARCH Going into nature and observing/measuring the structure of ecosystems Majority of what we know now comes from this type Disadvantage is that it is expensive, time-consuming, and difficult to
carry out experiments due to many variables LABORATORY RESEARCH
Set up, observation, and measurement of model ecosystems under laboratory conditions
Conditions can easily be controlled and are quick and cheap Disadvantage is that it is never certain whether or not result in a
laboratory will be the same as a result in a complex, natural ecosystem SYSTEMS ANALYSIS
Simulation of ecosystem rather than study real ecosystem Helps understand large and very complicated systems

95
Geographic Information System (GIS)
Fig. 4-35 p. 84Fig. 4-35 p. 84

96
Systems Analysis Major stages of system analysis
---->Define objectives
---->Identify and inventory variables
---->Obtain baseline data on variables
---->Make statistical analysis of relationships among variables
---->Determine significant interactions
---->Construct mathematical model describing interactions among variables
----> Run the model on a computer, with values entered for different variables
----> Evaluate best ways to achieve objectives

97
Ecosystem Importance
Ecosystem services are the natural services or natural capital that support life on the earth
Essential to the quality of human life and to the functioning of the world’s economies

98
Ecosystem Importance
Ecosystem services include: Controlling and moderating climate Providing and renewing air, water, soil Recycling vital nutrients through chemical
cycling Providing renewable and nonrenewable
energy sources and nonrenewable minerals Furnishing people with food, fiber, medicines,
timber, and paper

99
Ecosystem Importance
Ecosystem services include Pollinating crops and other plant species Absorbing, diluting, and detoxifying many
pollutants and toxic chemicals Helping control populations of pests and
disease organisms Slowing erosion and preventing flooding Providing biodiversity of genes and species
100
Two Principles of Ecosystem Sustainability
Use renewable solar energy as energy source
Efficiently recycle nutrients organisms need for survival, growth, and reproduction

101
Click to view animation.
Hubbard Brook experiment animation.
Animation

102
All things come from earth, and to earth they all return. MENANDER (342 –290 B.C.)