1 the the metrics and of hospitalizations right readmissions landscape: getting the metrics and...
TRANSCRIPT
The Readmissions Landscape: Getting the Metrics and
Management of Preventable Hospitalizations Right
Stephen F. Jencks, M.D., M.P.H.Consultant in Healthcare Safety and Quality
410‐708‐1134 443‐801‐[email protected]
1

Aim of this presentation
• Provide a practical approach to reducing readmissions by improving transitions at the
hospital and community level.• Provide a guide to dealing with the
measurement issues that this improvement demands.
• I will not deal either with payment policy or with measurement to support payment policy.
2

Improving Care Transitions
3

Science Base• The human and financial costs of preventable
readmissions are unacceptable: 1‐2 million preventable readmissions and $10‐20 billion
each year.• Intervention trials have shown that
readmission within weeks of hospital discharge is often preventable by better
transitions from hospital to post‐hospital care.
4

Readmissions and Care Transitions
• The evidence that readmissions are preventable comes largely from trials of
interventions to improve the transition from hospital to post‐hospital care.
• There is some evidence that interventions in the emergency room can support return
home for patients who would otherwise need admission, but these reports are just
emerging.
5

Improvement Science Base• Preventing most readmissions requires
changing systems for hospital discharge and post‐hospital care. Exhortation is insufficient.
• Recent work (e.g.: Pronovost and Gawande) has shown that far more adverse events are preventable than was generally thought just a
few years ago.• For improvement and policy, we will assume
that, with a few exceptions, all readmissions are potentially preventable.
6
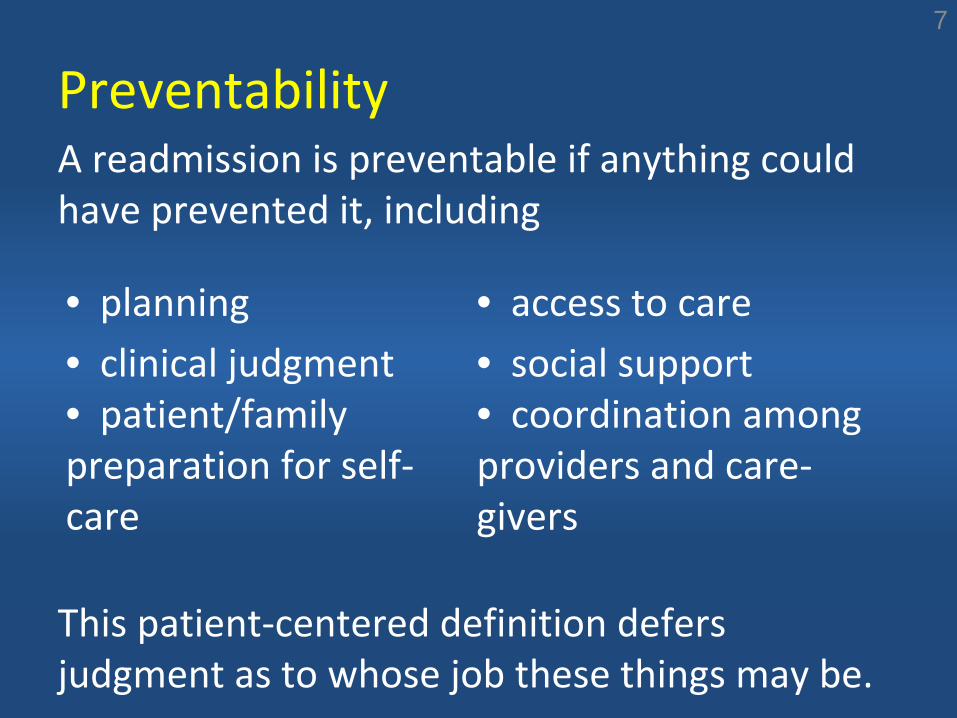
PreventabilityA readmission is preventable if anything could
have prevented it, including
This patient‐centered definition defers judgment as to whose job these things may be.
7
• planning • access to care• clinical judgment• patient/family
preparation for self‐ care
• social support• coordination among
providers and care‐ givers

Preventability: A Simple Approach
• Focus on medical (includes psychiatric) reasons for readmission, which are almost all
emergencies.• Be comfortable weeding out planned
readmissions for procedures• Readmissions for procedures may involve
“usual practices”
that benefit providers and practitioners more than patients, but
improved transitions will not prevent them.
8

Interventions• Clinical trials of prevention strategies give us
evidence as to how many rehospitalizations might be prevented (coaching, transitional
nursing, process redesign, etc.) but little clarity as to which methods would work best for
which patients.• Understanding how a particular readmission
might have been prevented usually requires talking to patient/family.
9

Common factors in intervention
• A protocol for the discharge process• A checklist for the elements of the protocol• Data collection on which elements of the
protocol were delivered• Attention to medication plan, availability, and
patient knowledge.• Attention to follow‐up appointments and
calls.• Contact point so patient has someone to call.
10
Measurement
11

Why measure?
• Our chance of getting a revised approach to readmission just right the first time is almost nil.
• We will need to adjust the plan quickly.• Waiting for changes in claims‐based
rehospitalization rates before making these adjustments will produce paralysis.
• Therefore, local real‐time measurement is essential.
12

The Problem:
1.
Measuring progress on reducing readmissions presents special practical
challenges for hospitals and communities.2.
Changes measured using available tools can
be seriously misleading.
∴Front‐line clinicians and managers need tools that use readily available data and require
only simple calculations.
13

Obstacles1. Lack of consensus on what readmissions are
preventable.2. Difficulty tracking process improvement.3.
Difficulty getting timely basic information.
4.
Uncertainty about using a 30‐day window.5.
Disagreement on risk adjustment.
6.
Difficulty in learning about readmissions to hospitals other than the discharging hospital.
7.
Difficulty interpreting changes in readmission rates.
14

2. Data for process measures• Transition processes are poorly documented
in the medical record.• Checklists should provide data.• Patients and families are invaluable.
– If a family can report the danger signs and who to call, the process worked.
– The CTM is a valuable tool for exploring the patient experience.
• Downstream providers are also invaluable.
– If a practitioner reports not getting the needed information then the process did not work.
15

3. Basic information
• Absence of simple statistics on numbers of readmissions and rates based on discharges or
population.• Trouble identifying readmitted individuals in a
timely fashion.• Inability to replace speculation on causes with
simple evidence from representative cases.
16

An approach to information
• Almost every hospital has an automated billing system with a unique personal
identifier. Almost all of these systems can be coaxed into producing counts of readmissions.
• A simple daily list of patients readmitted in the past 24 hours is a starting point both for
counting readmissions and asking questions.• Readmissions to the same hospital are only
part of picture but very valuable.
17

4. The 30‐day window• There is little science to show that 30 days is
either too short or too long a window for counting readmissions.
• At least some interventions reduce readmissions well beyond 30 days.
• Readmissions within 15 days may have greater face validity as hospital‐related.
• Approach: Establish routine monitoring at 15, 30, 60, and 90 days.
18

5. Risk adjustment• When assessing your own progress, it does
not much matter whether you have a higher or lower risk‐adjusted readmission rate than your competitor.
• Preventing readmissions:
– Reduces the number of patients who will respond to your successful strategies (they already have)
– Reduces overall volume for conditions such as heart failure that are quite sensitive to
prevention. • Approach: Do not waste improvement
resources
on
case
mix
adjustment
19

6. Readmissions elsewhereCentral data bases (e.g.: state, Medicare)• can usually give you the number of your
patients who are readmitted elsewhere.• can usually give you the names of hospitals
receiving the largest number of readmissions whom you discharged.
• cannot give you the names of individual patients readmitted elsewhere.
20
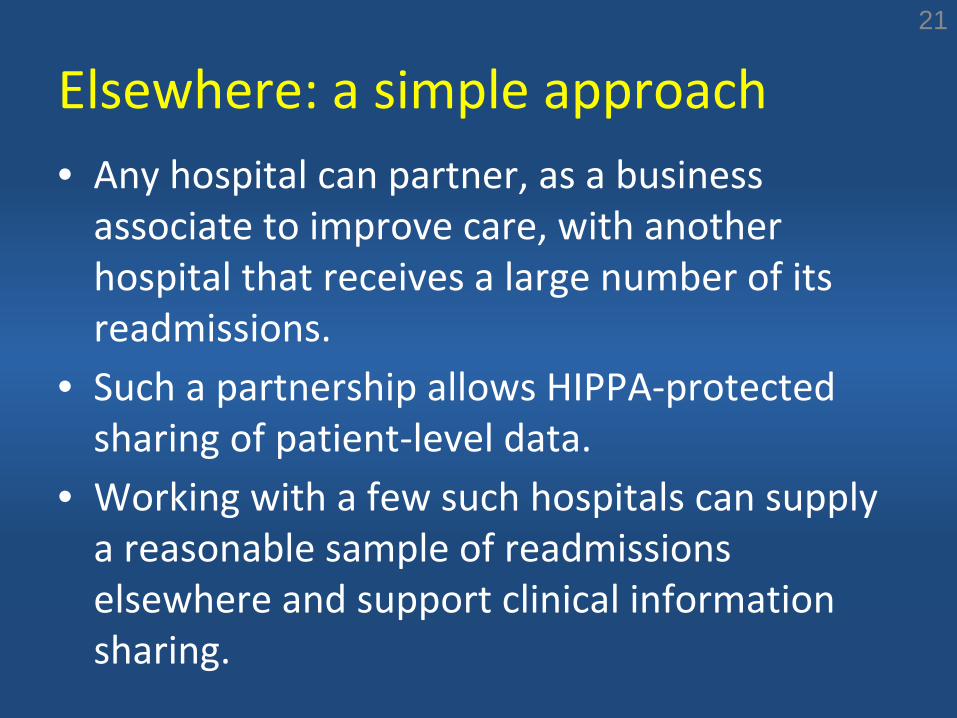
Elsewhere: a simple approach• Any hospital can partner, as a business
associate to improve care, with another hospital that receives a large number of its
readmissions.• Such a partnership allows HIPPA‐protected
sharing of patient‐level data.• Working with a few such hospitals can supply
a reasonable sample of readmissions elsewhere and support clinical information
sharing.
21

22
DISCHARGESRISKATNSREADMISSIODAY30RATENREADMISSIO
−−
=

7. Rate changes over time• Decreasing readmission rates decreases the
number of readmissions, and thus the number of discharges.
• The decrease in admissions (and discharges) may be greater than the decrease in 30‐day readmissions because the preventive effect often extends beyond 30 days.
• The result is that the rate
of readmission may decrease, remain unchanged, or even increase as the number of readmissions decreases.
23

Rate changes: A simple approach
• Count readmissions, not the rate.• Count by discharging service or other
informative categories rather than diagnosis.• Be aware that changes in the population
served can confound this approach.
24

Summary
• In many ways this is familiar process improvement, which means you need quick,
local data. That requires some simplifying assumptions.
• Measurement should include outcomes and processes as well as unintended results.
• Count rehospitalizations instead of rates.• Ask patients/families and downstream
providers to whether you are succeeding in transitions.
25