1 the impacts of ict development on the digitizing economy of taiwan by chou ji peng su-ling adviser...
Post on 21-Dec-2015
214 views
TRANSCRIPT

1
The Impacts of ICT Development on the Digitizing Economy of Taiwan
by
Chou JiPeng Su-Ling
Adviser : Prof. L.Klein
May 2006

2
Contents
Chapter 1 IntroductionChapter 2 Literature ReviewChapter 3 The Contribution of ICT to the APEC EconomiesChapter 4 Empirical Results and AnalysisChapter 5 Policies for ICT DevelopmentChapter 6 Conclusions

3
Chapter 1. The Research Purposes and Framework
1. Research Purposes
(1)Compare the development of ICT and related
policies
(2)Capture the revolution and impacts of ICT

4
2. Research Framework
1. Review related studies
2. Set up theoretical framework
3. Collect and mine ICT data in APEC
Empirical Models
1. to discuss the relationship between the ICT development and economic growth (productivity)
2. to evaluate the side effects from the development of ICT
3. to compare the differences in various APEC empirical studies
4. to analyze the possible reasons and policies

5
Chapter 2. Literature Review -- ICT development and Productivity
• Information Productivity Paradox (IPP)
R. Solow(1987) “You can see computer age everywhere these days, except in the productivity statistics.”
• Kraemer and Dedrick(1994) offered the explanations as:
(1) measurement errors; (2) time lag for diffusion;
(3) management of IT; (4) redistribution

6
Chapter 2. Literature Review -- ICT development and Productivity
Kraemer and Dedricks (1994)
Jorgenson and Stiroh (1999)
Klein, Duggal and Saltzman(2000)
Klein and Yuzo Kumasaka(2000)
Miyagawa, Ito and Harada (2002)
Peng, et. al.(2002)
7
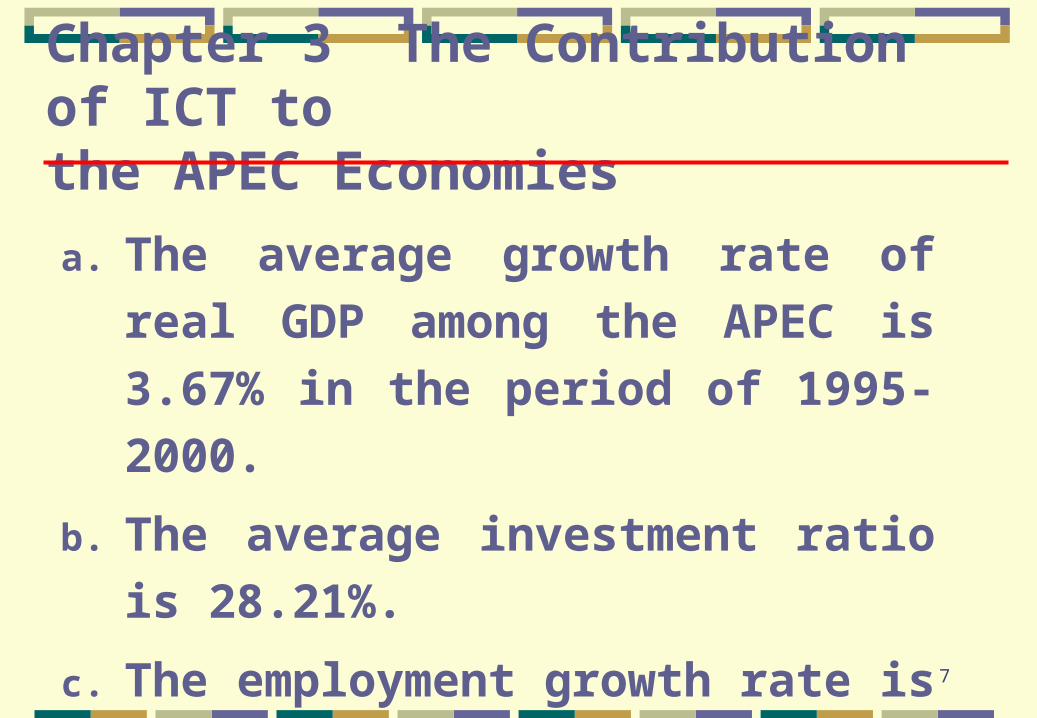
Chapter 3 The Contribution of ICT to the APEC Economies
a. The average growth rate of real GDP
among the APEC is 3.67% in the
period of 1995-2000.
b. The average investment ratio is
28.21%.
c. The employment growth rate is
1.74%

8
Chapter 3 The Contribution of ICT to the APEC Economies
Although most economies with high investment-output ratio and the high labor growth rate enjoyed high economic growth rate in APEC environment,
some less than 25% of their GDP on investment
Canada (20.7%), New Zealand (21.1%), Peru (24%), Taiwan (22.76%), United States (19.5%), Russia (22.8%), Papua New Guinea (21.1%)

9
Table 3.1 The real GDP growth, Investment output ratio, and employment growth rate of APEC Economies,
1995-2000
Real GDP growth rate, %
Investment /GDP, % Employment growth rate, %
Australia 4.00 23.60 1.79 Brunei 2.86 .. 3.34 Canada 3.66 20.70 1.75 Chile 4.54 27.20 0.61 China 8.24 38.20 0.96 Hong Kong, China 3.40 34.50 2.07 Indonesia 0.68 31.80 2.00 Japan 1.45 28.70 0.04 Korea, Rep. 4.77 34.20 1.40 Malaysia 4.67 42.80 3.13 Mexico 5.51 25.90 3.49 New Zealand 2.29 21.10 1.33 Papua New Guinea 0.61 21.10 2.62 Peru 2.53 24.00 2.62 Philippines 3.55 24.80 2.19 Singapore 6.35 38.90 1.87 Taiwan 5.76 22.76 1.00 Thailand 0.24 33.30 0.93 United States 4.19 19.50 1.84 Vietnam 6.70 28.30 1.73 Russian Federation 1.14 22.80 -0.24 AVERAGE 3.67 28.21 1.74 Sources: World bank, World Development Indicator, 2002; and Chinese Taipei data is from Directoral General of
Budget, Accounting, and Statistics (DGBAS).
10
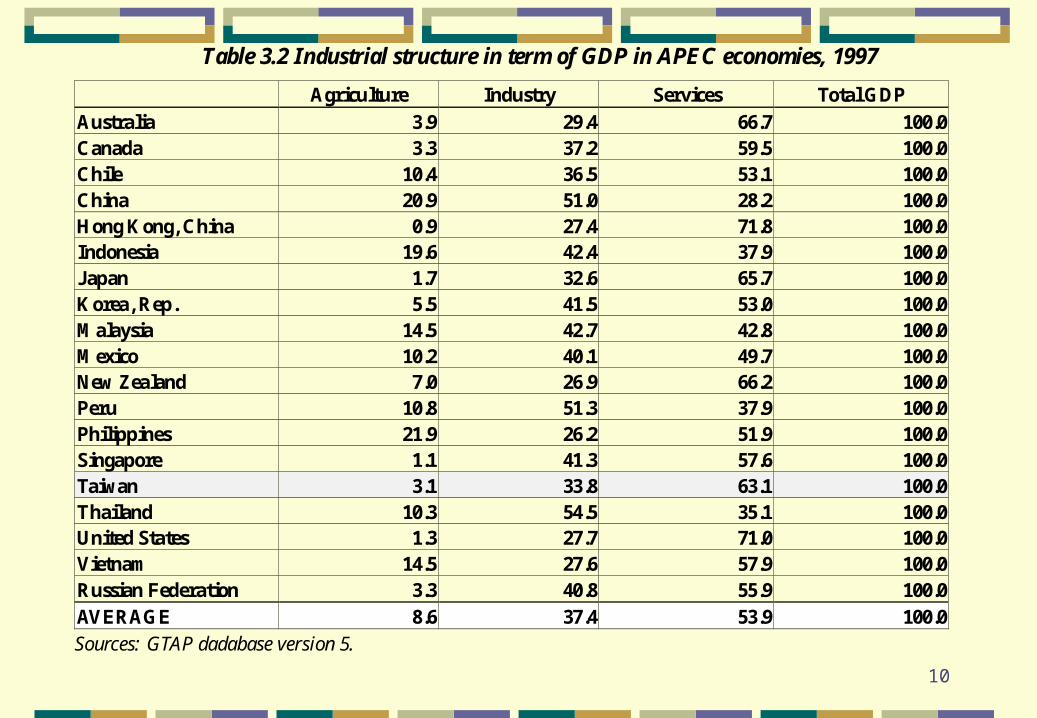
Table 3.2 Industrial structure in term of GDP in APEC economies, 1997
Agriculture Industry Services Total GDP
Australia 3.9 29.4 66.7 100.0 Canada 3.3 37.2 59.5 100.0 Chile 10.4 36.5 53.1 100.0 China 20.9 51.0 28.2 100.0 Hong Kong, China 0.9 27.4 71.8 100.0 Indonesia 19.6 42.4 37.9 100.0 Japan 1.7 32.6 65.7 100.0 Korea, Rep. 5.5 41.5 53.0 100.0 Malaysia 14.5 42.7 42.8 100.0 Mexico 10.2 40.1 49.7 100.0 New Zealand 7.0 26.9 66.2 100.0 Peru 10.8 51.3 37.9 100.0 Philippines 21.9 26.2 51.9 100.0 Singapore 1.1 41.3 57.6 100.0 Taiwan 3.1 33.8 63.1 100.0 Thailand 10.3 54.5 35.1 100.0 United States 1.3 27.7 71.0 100.0 Vietnam 14.5 27.6 57.9 100.0 Russian Federation 3.3 40.8 55.9 100.0 AVERAGE 8.6 37.4 53.9 100.0 Sources: GTAP dadabase version 5.

11
Table 3.3 The share of ICT in GDP
Electronic equipment Communication ICT
Australia 0.33 2.85 3.18
Canada 0.67 2.33 3.00
Chile 0.14 2.47 2.61
China 1.87 1.66 3.54
Hong Kong, China 1.14 2.14 3.28
Indonesia 2.73 1.27 4.00
Japan 3.62 2.05 5.67
Korea, Rep. 2.21 2.47 4.68
Malaysia 6.41 0.58 6.99
Mexico 1.44 2.57 4.01
New Zealand 0.34 2.62 2.96
Peru 0.92 2.48 3.40
Philippines 1.01 1.06 2.08
Singapore 6.95 1.70 8.65
Taiwan 5.32 2.01 7.33
Thailand 9.40 0.91 10.31
United States 1.44 1.97 3.41
Vietnam 0.50 0.42 0.92
Russian Federation 0.63 3.25 3.88
Average 2.48 1.94 4.42

12
Table 3.4 The growth of ICT production in 1990-99
1995-99 1990-99
Australia 2.30 3.00 Canada 1.40 4.00 China 20.10 19.80 Hong Kong, China -4.80 -0.40 Indonesia 6.50 19.40 Japan -4.00 2.30 Korea, Rep. 4.20 10.80 Malaysia 9.00 20.10 Philippines 22.00 18.40 Singapore 0.70 11.90 Taiwan 9.00 12.70 Thailand 6.90 17.00 United States 4.40 5.80 AVERAGE 5.98 11.14 Source: OECD Information and Communication Technology Outlook, 2002.

13
Chapter 4 Empirical Results and Analysis
1. Growth Accounting
2. Inter-Sector Externality Test
3. Principle Component Analysis

14
4.1 Growth AccountingTable4-1 Source of aggregate GDO growth
Unit: %
Items Sample
Period
Real
GDO
Imported
Intermedi
ate
Inputs
Labor
Inputs
Capital
Inputs
Total Factor
Productivity
1981-91 8.82 11.77 1.24 8.45 2.71
1991-99 6.08 6.69 0.91 8.67 1.48 Rate of Change
1981-99 7.52 9.36 1.08 8.56 2.13
1981-91 100.00 25.68 44.29 30.03 -
1991-99 100.00 24.56 46.14 29.30 - Share
1981-99 100.00 25.16 45.09 29.75 -
1981-91 100.00 34.29 6.23 28.78 30.70
1991-99 100.00 27.02 6.91 41.79 24.28 Contribution
1981-99 100.00 31.33 6.50 33.85 28.33
Notes: 1. Labor inputs used the number of hours worked during a year. Capital inputs used capital stocks deflated by capacity utilization
rate. 2. The rate of change is treated as the average growth rate; the share is calculated from the percentage of inputs to GDO; the
contribution is estimated by means of the rate of change multiplied by the share, as the rate of change in real GDO.
Source: Calculated by the author.

15
Table4- 2 Source of GDO growth, by industry Unit: %
Intermediate Inputs
Items Sample Period
Real GDO
Labor Inputs
Capital inputs Imported
Domestically produced
Total Factor
Productivity
1. ICT Manufacturing Industries
1981-91 14.55 3.22 16.17 16.48 15.74 3.23
1991-99 11.52 2.24 12.32 11.15 10.10 3.46 Rate of Change
1981-99 13.11 2.76 14.35 13.96 13.07 3.30
1981-91 100.00 37.45 10.32 30.29 21.94 -
1991-99 100.00 34.11 10.62 38.73 16.54 - Share 1981-99 100.00 35.82 10.56 34.23 19.40 -
1981-91 100.00 8.29 11.46 34.33 23.74 22.18
1991-99 100.00 6.64 11.36 37.49 14.51 30.01 Contribution 1981-99 100.00 7.53 11.55 36.43 19.33 25.15
2. ICT Servicing Industries
1981-91 13.53 4.07 12.71 24.66 15.82 0.42
1991-99 10.83 3.85 11.52 5.57 9.34 2.29 Rate of Change
1981-99 12.25 3.97 12.15 15.62 12.75 1.14
1981-91 100.00 18.95 34.60 6.73 39.72 -
1991-99 100.00 19.09 30.76 11.16 39.00 - Share 1981-99 100.00 19.09 33.03 8.43 39.44 -
1981-91 100.00 5.70 32.50 12.26 46.44 3.09
1991-99 100.00 6.78 32.71 5.74 33.62 21.14 Contribution 1981-99 100.00 6.18 32.75 10.75 41.04 9.28
3. Non-ICT Industries
1981-91 8.52 1.09 8.19 11.04 9.06 1.28
1991-99 5.58 0.79 8.21 5.77 6.40 0.52 Rate of
Change 1981-99 7.13 0.95 8.20 8.54 7.80 0.95
1981-91 100.00 24.49 16.11 13.33 46.07 -
1991-99 100.00 28.10 17.35 12.43 42.12 - Share
1981-99 100.00 25.99 16.72 12.94 44.36 -
1981-91 100.00 3.14 15.49 17.28 49.01 15.09
1991-99 100.00 3.98 25.50 12.84 48.29 9.39 Contribution
1981-99 100.00 3.46 19.22 15.51 48.54 13.26

16
Table 4.3 Aggregate and industrial TFP linkages Unit: %
Total Factor Productivity (TFP)
Resource Reallocation Effect
Intermediate inputs Sample Period Items
Aggregate GDO
Growth rate (1)=(2)+(3)
Contribution of all inputs
(2)
Aggregate TFP
(3)=(4)+(5)
Intra-industry technical change
(4)
Inter-industry technical change
(5)
Labor Inputs
Capital Inputs Imported
Domestically- produced
Rate of Change 8.82 6.11 2.71 2.64 0.06 0.00 0.03 0.02 0.02
100.00 69.30 30.70
100.00 97.63 2.37 1981-91
Contribution
100.00 -6.70 43.27 34.37 29.06
Rate of Change 6.72 5.53 1.19 1.09 0.10 -0.01 0.02 0.10 -0.02
100.00 82.27 17.73
100.00 91.74 8.26 1991-96
Contribution
100.00 -9.26 20.61 103.88 -15.23
Rate of Change 5.28 3.44 1.85 1.69 0.16 0.00 0.07 0.09 0.00
100.00 65.00 35.00
100.00 91.52 8.48 1996-99
Contribution
100.00 -0.88 43.17 57.20 0.51
Rate of Change 6.08 4.61 1.48 1.35 0.13 -0.01 0.02 0.12 -0.01
100.00 75.72 24.28 24.28
100.00 91.21 8.79 1991-99
Contribution
100.00 -5.30 16.02 93.28 -4.01
Rate of Change 7.52 5.39 2.13 2.05 0.08 0.00 0.03 0.05 0.00
100.00 71.67 28.33 28.33
100.00 96.39 3.61 1981-99
Contribution
100.00 -3.82 33.96 65.57 4.29 Source: Calculated by the authors.

17
The results show that the contribution accounts for almost 30 per cent of the economic growth rate. The TFP contribution to productivity in the ICT industries was significantly greater in the 1990s than in the 1980s.The greater part of the contribution made by TFP is derived from the intra-industry technological progress effect. The ICT industry has not stimulated any real technological progress in other industries.The contribution from the effects of input reallocation has also been very limited.

18
4.2 Inter-Sector Externa1ity Test
Y
Q
Q
Q
L
L
Y
I
Y
Y e
e
e
)1
(
..
,
Feder (1983)

19
4.2 Inter-Sector Externa1ity Test
,
Table 4.4 Regression results of externality effects of ICT with APEC
L L.
/
)/)(/(.
YQQQ eee
2R
Explanatory Variables Coefficients t-Statistics
Constant -0.016 -0.536
I/Y 0.167 1.756
0.728 0.954
0.213 0.131
= 0.226
No. of observations = 15
Note: The dependent variable is: Y Y.
/

20
4.2 Inter-Sector Externa1ity Test
Table 4.5 Regression results of externality effects of ICT with 8 additional countries
L L.
/
)/)(/(.
YQQQ eee
2R
Explanatory Variables Coefficients t-Statistics
Constant -0.014 -1.038
I/Y 0.156 2.548
0.805 2.026
0.289 0.262
= 0.522;
No. of observations = 23

21Figure 4.1 Comparison of 2000 investment intelecommunications and 2002 per capita GDP
0
5,000
10,000
15,000
20,000
25,000
30,000
35,000
40,000
0.0 0.5 1.0 1.5 2.0 2.5
ICT (% of GDP)
Per C
apita G
DP
Australia
Canada
Hong Kong
South Korea
US
Singapore
New Zealand
Taiwan
Japan
Mexico
ChileRussia
Thailand
PhilippinesIndonesia
Malaysia
China
4.3 Principle Component Analysis

22
4.3 Principle Component
Table 4.6 Principal components analysis results
Components Prin1 Prin2 Prin3 Prin4 Prin5
Eigenvalue 17.90 7.072 3.215 2.578 1.690
Proportion 0.484 0.191 0.107 0.080 0.056
Cumulative 0.484 0.675 0.782 0.862 0.917

23
Table 4.7 Principal components analysis for APEC economies
Economies General ICT Development
R&D Inputs R&D Spirit ICT
Infrastructure
ICT Development
Incentives US 9.133 5.294 -3.566 0.313 1.471 Japan 4.607 4.739 2.604 -0.273 -1.613 Canada 4.249 -3.334 1.942 2.929 0.310 Singapore 3.622 -2.055 0.799 -0.910 -0.024 Australia 2.803 -2.561 0.690 -2.487 0.592 Chinese Taipei 2.104 -0.974 0.804 0.732 -1.026 Hong Kong 1.528 -2.893 -0.472 -0.223 -1.191 South Korea 1.071 -2.162 -0.403 -2.391 0.450 New Zealand 0.438 0.649 0.277 0.147 -2.321 Malaysia -0.493 -2.431 -0.811 2.174 1.470 Chile -1.735 -1.487 -1.168 -0.686 -0.344 Russia -3.474 -0.881 -1.892 0.678 1.308 China -3.825 0.032 -1.544 0.071 -0.116 Philippines -4.164 2.547 3.404 -2.092 2.553 Thailand -4.171 2.400 1.760 2.736 0.756 Mexico -4.956 1.134 -1.620 -1.185 -0.948 Indonesia -6.736 1.984 -0.804 0.467 -1.327

24
Figure4.2 The principal components analysis results of selected economiesGeneral ICT Development
Input of R&D
Spirit of R&DInfrastructure of ICT
Incentives for ICT
Taiwan Australia Canada Japan US

25
If we ranking the APEC economies by the first component, we can find the USA is in the No.1 and Taiwan ranks No.6. Taiwan 's score is positive in component 1, 3, 5 and is negative in component 2, 4.
We may conclude that the Taiwan is wealthful in general ICT development, and the treatment of science, but can be improved on the spirit of R&D and incentives for information and technology.

26
Chapter 5 Policies for ICT development
ICT development involved not only innovation in
computer-related products,but also a historic
transformation of society.
ICT development requires considerable backup
in terms of infrastructure and regulations.
The strategies and frameworks may differ
significantly in different economics.

27
Chapter 5 Policies for ICT development
For the ICT development policies, we reviewed the ICT related policies in United States, Canada, Australia, Japan, and Taiwan.
Although the United States and Canada are both liberal states distinct from others, Canada puts some weights on universal accessing to information facilities, and is unavoidably transformed into a bureaucratic problem to be managed.

28
Chapter 5 Policies for ICT development
Australian realizes the importance of ICT industries, and will not only be the user of ICT but also the producer of ICT. The second phase for e-Japan strategy is expected to establish “vibrant, safe, impressive and convenient” society, and to utilize IT infrastructure for aggressive transformation of Japanese socio-economic systems. Taiwan’s knowledge based plan is expected to incorporate with the social justice and the sustainable environment to transform Taiwan into a “Green Silicon Island”.

29
1993 1994 1995 1996 1997 1998 1999 2000
US ▲ NII ★EC
Working Group
▲ Global
EC Frame-work
★1st Report ▲ 2nd Report eGovernment
eSociety
★01 3rd
Report
UK ▲ Infor- mation Society
▲ Building the Knowledge
Driven Economy
▲e-commerce@it
s.best.uk ★Modern
Government ★eGov
Services for the 21st Century
▲ 00 UK
Online
Australia ▲ A Strategic
Framework for the I.E.
▲ E-Commerce beyond 2000
▲ Online Australia
Japan ▲ The
S&T Basic Law
▲ Millennium Program
▲ 01 e-Japan
Singapore ▲ Singa- pore One
★IT in Education
▲ Electronic Transactions
Act
▲ 00 Infocom
m 21
South Korea ▲ KII ★
MIC ▲ BAPI ▲ Cyber Korea 21
▲ 01 e-Korea
Taiwan ▲ NII ▲ NII Mid- term project
▲e-Government ▲ 01
NICI
Figure 5.1 ICT Policies and Programs

30
Chapter 6 Conclusions (1/3)
It is clear that within the APEC economies, there are patterns of industrial specialization and national idiosyncrasies and that both the developments and influences of ICT are multi-dimensional. As we review the reference about the influence of ICT development to the productivity or competitiveness and the e-readiness ranking provided by several organizations. We find that stories of individual economies are compelling.

31
Chapter 6 Conclusions (2/3)
When we use growth accounting in order to estimate the impact of the ICT sector on productivity, the results show that the increase in TFP has contributed significantly to economic growth in Taiwan, but the greater part of the contribution made by TFP is, however, derived from the intra-industry technological progress effect. There is no significant spillover effect from inter-industry technological progress. Thus, the ICT industry has not stimulated any real technological progress in other industries. The test of the inter-sector externality also support this finding, i.e., the externality from ICT shows a positive sign but not statistical significance.

32
Chapter 6 Conclusions (3/3)
The policy implications from our empirical findings are that APEC
economies might be too emphasized on the ICT development per
se, the use of information and communication technology is still
lagged behind.
Therefore, how to utilize the ICT in the universal sense, and how to
implement the digital dividend issues not only domestically for the
rural areas, low income household, and disable people, but also
internationally for the less developed economies.

33
END