1 the household position of the elderly during the 18-19 th centuries in the carpathian basin: pilot...
TRANSCRIPT

1
The household position of the elderly during the 18-19th centuries in the
Carpathian Basin: Pilot studies from
Hungarian micro-databases
Tamás Faragó (BCE),
Peter Őri and Levente Pakot (DRI)
2
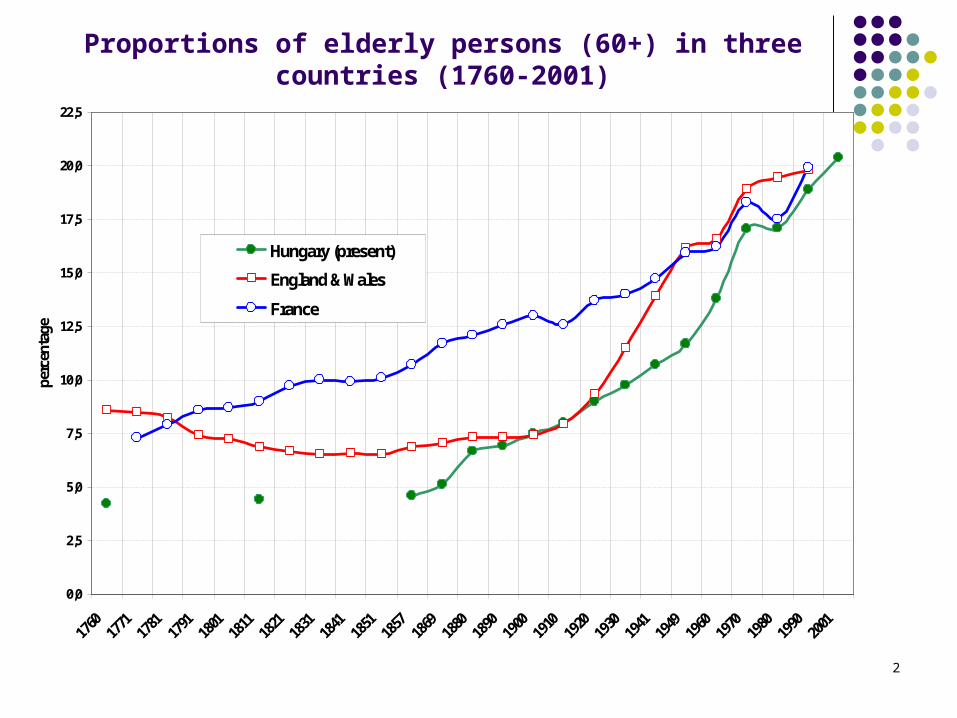
Proportions of elderly persons (60+) in three countries (1760-2001)
0,0
2,5
5,0
7,5
10,0
12,5
15,0
17,5
20,0
22,5
1760
1771
1781
1791
1801
1811
1821
1831
1841
1851
1857
1869
1880
1890
1900
1910
1920
1930
1941
1949
1960
1970
1980
1990
2001
perc
enta
ge
Hungary (present)
England & Wales
France

3
Regional differences in the proportion of elderly persons in the Hungarian Kingdom (1880)

4
Basic data of the „Hungary 1760” sample (Preliminary version)
Sex ratio Proportion of elderly
persons in the population (%)
Proportion of year 0-4
Whipple index
Number of elderly
persons
Total population
Ethno-cultural groups
Number of settlements
Total population
Elderly persons
Male Female Total Percentage (60+) Head
Croats 4 969 644 4,8 3,2 4,0 16,9 263 97 2 400 Slovaks 6 940 695 4,7 3,5 4,1 16,8 325 100 2 442 Germans 7 938 1019 3,1 3,4 3,3 17,5 248 105 3 214
Protestant Hungarians
10 1004 750 4,8 3,6 4,2 14,6 336 140 3 322
Catholics in Pest county
6 969 660 5,8 3,9 4,9 17,6 362 156 3 211
Catholics in West-Transdanubia
7 963 722 4,5 3,3 3,9 16,1 285 93 2 379
Hungarians together 23 980 706 5,1 3,7 4,4 16,1 334 389 8 912 Settlement types Village population 40 965 736 4,6 3,5 4,1 16,6 310 691 16 968 Market towns 2 1002 1163 4,2 4,9 4,6 16,5 299 173 3 803 Gipsy population a) 4 regions 900 615 3,7 2,6 3,2 18,7 468 63 1 985
Total sample 42+4 reg. 965 793 4,5 3,7 4,1 16,8 318 927 22 756 a) sedentary population

5
Marital status of the elderly persons in Hungary (1760)
Non married
Married Widowed Un- known
Total N Proportion of ever married
Male % Village population 0,8 78,6 20,3 0,3 100,0 398 99,0 Market towns 85,0 15,0 100,0 80 100,0 Gipsy population a) 89,7 10,3 100,0 39 100,0
Total 0,6 80,5 18,7 0,2 100,0 517 99,2 N 3 416 97 1 517
Female % Village population 0,7 34,8 62,5 2,0 100,0 293 97,3 Market towns 1,1 25,8 72,0 1,1 100,0 93 97,8 Gipsy population a) 62,5 37,5 100,0 24 100,0
Total 0,7 34,4 63,2 1,7 100,0 410 97,6 N 3 141 259 7 410

6
Household position by sex of elderly persons (1760)
Household heads a) Other household
members
Alone With
spouse
Nuclear family (III.)
Extended family (IV-V.)
Other (II.& VI.)
Heads
Wife Relative Other
b)
Non heads
Total N
Male % Villages 3,0 9,8 33,2 43,0 1,8 90,7 8,3 1,0 9,3 100,0 398 Market towns 1,2 21,3 48,8 18,8 1,2 91,3 7,5 1,2 8,7 100,0 81 Gipsy population
17,9 66,7 10,3 94,9 5,1 5,1 100,0 39
Total 2,5 12,2 38,1 36,8 1,5 91,1 7,9 1,0 8,9 100,0 518 N 13 63 197 190 8 471 41 5 46 517
Female % Villages 16,1 7,5 7,5 1,0 32,1 32,8 30,3 4,8 67,9 100,0 293 Market towns 15,0 3,2 1,1 1,1 20,4 25,8 51,6 2,2 79,6 100,0 93 Gipsy population
16,7 20,8 37,5 54,2 8,3 62,5 100,0 24
Total 15,9 0,0 7,3 5,6 1,0 29,8 32,4 33,9 3,9 70,2 100,0 410 N 65 30 23 4 122 133 139 16 288 410
a) Roman figures are referring to the Laslett-Hammel household categories b) Servants, solitary lodgers, and undeterminable
7
Conclusion and summary (I.)
The regional picture of elderly indicates several factors influencing the level, the pace, and the character of ageing;
The detailed analysis of a sample from the 18th century Hungary suggest remarkable differences between the village and town population, as well as among the cultural groups, and between the ancient and newly settled inhabitants;
The position of the elderly in pre-industrial Hungary is much nearer to the traditional view on the ageing than to the picture of early modern North-Western European populations formed about.

Outline
1. Data (collection supported by MPIDR in the framework of MOSAIC project)
2. Descriptive statistics
3. Multivariate analysis
4. Conclusions
KÖZPONTI STATISZTIKAI HIVATALNÉPESSÉGTUDOMÁNYI KUTATÓINTÉZET
1149 Budapest, Angol u. 77.Tel.: (36 1) 251 0288, (36 1) 384 3167 Fax: (36 1) 383 3111
CENTRAL STATISTICAL OFFICEDEMOGRAPHIC RESEARCH INSTITUTE
N KI
NÉ
PE
SS
ÉG
TU
DO
MÁ
NY
I K U T A T Ó I N T É Z E T
RE
SE
AR
CH
IN
ST
ITU
TE
D E M O G R A P H I C
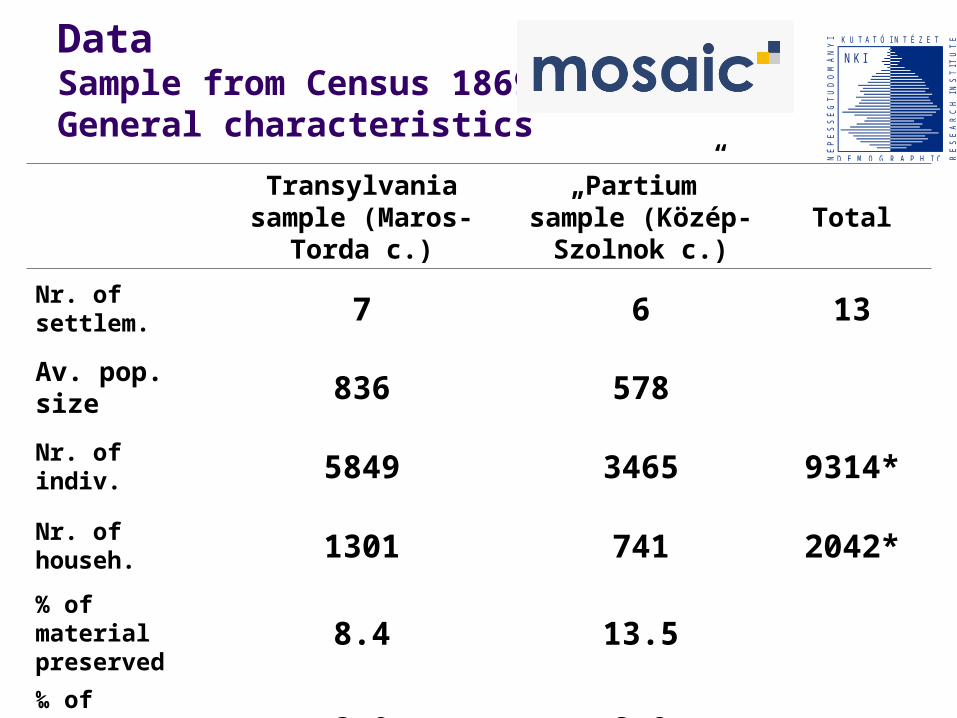
Data Sample from Census 1869: General characteristics
Transylvania sample (Maros-Torda c.)
„Partium” sample (Közép-Szolnok c.)
Total
Nr. of settlem. 7 6 13
Av. pop. size 836 578
Nr. of indiv. 5849 3465 9314*
Nr. of househ. 1301 741 2042*
% of material preserved 8.4 13.5
‰ of regional pop. size 3.0 2.9
KÖZPONTI STATISZTIKAI HIVATALNÉPESSÉGTUDOMÁNYI KUTATÓINTÉZET
1149 Budapest, Angol u. 77.Tel.: (36 1) 251 0288, (36 1) 384 3167 Fax: (36 1) 383 3111
CENTRAL STATISTICAL OFFICEDEMOGRAPHIC RESEARCH INSTITUTE
N KI
NÉ
PE
SS
ÉG
TU
DO
MÁ
NY
I K U T A T Ó I N T É Z E T
RE
SE
AR
CH
IN
ST
ITU
TE
D E M O G R A P H I C

DataSample from Census 1869: Denominational Distribution (%)
R. cath.
Gr. cath.
Arm. cath.
Orth. Luth. Calv. Unit. Jew.
Trans. sample 11.2 24.4 0.4 32.9 0.1 25.0 0.8 5.1
„Partium” sample 2.1 66.5 0.2 0.0 0.0 27.8 0.0 3.5
KÖZPONTI STATISZTIKAI HIVATALNÉPESSÉGTUDOMÁNYI KUTATÓINTÉZET
1149 Budapest, Angol u. 77.Tel.: (36 1) 251 0288, (36 1) 384 3167 Fax: (36 1) 383 3111
CENTRAL STATISTICAL OFFICEDEMOGRAPHIC RESEARCH INSTITUTE
N KI
NÉ
PE
SS
ÉG
TU
DO
MÁ
NY
I K U T A T Ó I N T É Z E T
RE
SE
AR
CH
IN
ST
ITU
TE
D E M O G R A P H I C

Data Sample from Census 1869: Occupational Distribution (%)
Freeholders/smallholders
Landless/day lab.
Artis. Intell. Merch.Others/
unkown
Trans. sample 63.7 22.5 7.4 2.5 2.0 1.9
„Partium” sample 70.4 17.0 2.8 2.4 2.1 5.2
KÖZPONTI STATISZTIKAI HIVATALNÉPESSÉGTUDOMÁNYI KUTATÓINTÉZET
1149 Budapest, Angol u. 77.Tel.: (36 1) 251 0288, (36 1) 384 3167 Fax: (36 1) 383 3111
CENTRAL STATISTICAL OFFICEDEMOGRAPHIC RESEARCH INSTITUTE
N KI
NÉ
PE
SS
ÉG
TU
DO
MÁ
NY
I K U T A T Ó I N T É Z E T
RE
SE
AR
CH
IN
ST
ITU
TE
D E M O G R A P H I C

Data Sample from Census 1869:Household Structure (L.-H. typ.) (%)
Solitaire No familySimple family
Extended family
Multiple family
Aver.
hh. size
Trans. sample
2.0 2.3 81.9 10.2 3.6 4.5
„Partium” sample
5.1 2.6 72.6 11.9 7.8 5.7
KÖZPONTI STATISZTIKAI HIVATALNÉPESSÉGTUDOMÁNYI KUTATÓINTÉZET
1149 Budapest, Angol u. 77.Tel.: (36 1) 251 0288, (36 1) 384 3167 Fax: (36 1) 383 3111
CENTRAL STATISTICAL OFFICEDEMOGRAPHIC RESEARCH INSTITUTE
N KI
NÉ
PE
SS
ÉG
TU
DO
MÁ
NY
I K U T A T Ó I N T É Z E T
RE
SE
AR
CH
IN
ST
ITU
TE
D E M O G R A P H I C

Descriptive resultsEstimates of the Older Pop. (%)
Percent Sex ratio
Age 50+ Age 65+ Age 50+ Age 65+
Trans. sample 10.7 2.6 134 175
Maros c. 12.0 3.0 113 119
Trans. region 13.6 3.9 113 111
„Partium” sample 10.4 3.4 109 123
Közép-Szolnok c. 11.6 3.4 118 122
„Partium” region 12.7 4.7 119 120
KÖZPONTI STATISZTIKAI HIVATALNÉPESSÉGTUDOMÁNYI KUTATÓINTÉZET
1149 Budapest, Angol u. 77.Tel.: (36 1) 251 0288, (36 1) 384 3167 Fax: (36 1) 383 3111
CENTRAL STATISTICAL OFFICEDEMOGRAPHIC RESEARCH INSTITUTE
N KI
NÉ
PE
SS
ÉG
TU
DO
MÁ
NY
I K U T A T Ó I N T É Z E T
RE
SE
AR
CH
IN
ST
ITU
TE
D E M O G R A P H I C

Descriptive resultsLiving Arrang. of the Pop. Aged 50+
Married Widowed Single
Women Men Women Men Women Men
Trans.
sample
Nr. of cases 173 291 84 61 7 2
Unmarried children 49.1 62.2 26.2 26.2 0.0 0.0
No children 27.8 22.0 5.6 11.5 14.3 0.0
Married children 17.3 12.4 56.0 54.1 0.0 0.0
Other kin 2.3 1.4 3.6 1.7 57.1 100.0
Nonkin 3.4 2.1 8.3 6.6 28.6 0.0
Part.
sample
Nr. of cases 85 140 82 41 5 5
Unmarried children 29.4 49.3 19.5 17.1 0.0 0.0
No children 15.3 10.7 11.0 9.8 20.0 20.0
Married children 45.9 32.9 52.4 53.7 20.0 20.0
Other kin 4.7 3.6 3.7 2.4 60.0 40.0
Nonkin 4.7 3.6 13.4 17.0 0.0 20.0
KÖZPONTI STATISZTIKAI HIVATALNÉPESSÉGTUDOMÁNYI KUTATÓINTÉZET
1149 Budapest, Angol u. 77.Tel.: (36 1) 251 0288, (36 1) 384 3167 Fax: (36 1) 383 3111
CENTRAL STATISTICAL OFFICEDEMOGRAPHIC RESEARCH INSTITUTE
N KI
NÉ
PE
SS
ÉG
TU
DO
MÁ
NY
I K U T A T Ó I N T É Z E T
RE
SE
AR
CH
IN
ST
ITU
TE
D E M O G R A P H I C

Descriptive results% of the Older Pop. Living in Various Resid. Arrangements (married women/men)
Married women Married men
50-54 55-59 60-64 65+ 50-54 55-59 60-64 65+
Trans.
Nr. of cases 66 60 26 21 97 85 48 61
Unmar. child. 59.1 53.3 30.8 28.6 80.4 60.0 58.3 39.3
No children 19.7 20.0 46.2 52.4 12.4 20.0 25.0 37.7
Mar. child. 16.7 23.3 11.5 9.5 5.2 17.6 12.5 16.4
Other kin 3.0 1.7 3.8 0.0 0.0 2.4 2.1 1.6
Nonkin 1.5 1.7 7.7 9.5 2.1 0.0 2.1 4.9
Part.
Nr. of cases 21 30 15 19 38 36 24 41
Unmar. child. 52.4 30.0 26.7 5.3 78.9 52.8 41.7 22.0
No children 9.5 20.0 13.3 15.8 5.3 11.1 12.5 14.6
Mar. child. 23.8 40.0 53.3 73.7 13.2 27.8 37.5 53.7
Other kin 9.5 0.0 6.7 5.3 2.6 0.0 4.2 7.3
Nonkin 4.8 10.0 0.0 0.0 0.0 8.3 4.2 2.4
KÖZPONTI STATISZTIKAI HIVATALNÉPESSÉGTUDOMÁNYI KUTATÓINTÉZET
1149 Budapest, Angol u. 77.Tel.: (36 1) 251 0288, (36 1) 384 3167 Fax: (36 1) 383 3111
CENTRAL STATISTICAL OFFICEDEMOGRAPHIC RESEARCH INSTITUTE
N KI
NÉ
PE
SS
ÉG
TU
DO
MÁ
NY
I K U T A T Ó I N T É Z E T
RE
SE
AR
CH
IN
ST
ITU
TE
D E M O G R A P H I C

Descriptive results% of the Older Pop. Living in Various Resid. Arrangements (widowed women/men)
Widowed women Widowed men
50-54 55-59 60-64 65+ 50-54 55-59 60-64 65+
Trans.
Nr. of cases 17 23 13 31 10 11 8 32
Unmar. child. 58.8 26.1 38.5 3.2 90.0 18.2 37.5 6.3
No children 11.8 13.0 0.0 0.0 0.0 9.1 12.5 15.6
Mar. child. 23.5 47.8 61.5 77.4 10.0 54.5 50.0 68.8
Other kin 5.9 0.0 0.0 6.5 0.0 0.0 0.0 3.1
Nonkin 0.0 13.0 0.0 12.9 0.0 18.2 0.0 6.3
Part.
Nr. of cases 11 23 16 32 7 5 6 23
Unmar. child. 36.4 30.4 12.5 9.4 28.6 20.0 66.7 0.0
No children 9.1 8.7 6.3 15.6 28.6 0.0 0.0 8.7
Mar. child. 36.4 47.8 56.3 59.4 28.6 60.0 16.7 69.6
Other kin 9.1 4.3 6.3 0.0 0.0 0.0 0.0 4.3
Nonkin 9.1 8.7 18.8 15.6 14.3 20.0 16.7 17.4
KÖZPONTI STATISZTIKAI HIVATALNÉPESSÉGTUDOMÁNYI KUTATÓINTÉZET
1149 Budapest, Angol u. 77.Tel.: (36 1) 251 0288, (36 1) 384 3167 Fax: (36 1) 383 3111
CENTRAL STATISTICAL OFFICEDEMOGRAPHIC RESEARCH INSTITUTE
N KI
NÉ
PE
SS
ÉG
TU
DO
MÁ
NY
I K U T A T Ó I N T É Z E T
RE
SE
AR
CH
IN
ST
ITU
TE
D E M O G R A P H I C

Multivariate approach: results of MLREffects of Age, Sex and Marital Status
Living with Unmarried Children versus
Living with Married Children
Living without Children
versus
Living with Married Children
Odds ratio p Odds ratio p
Age group
50-54 ref. 1.00 ref. 1.00
55-59 0.33 0.00 0.69 0.25
60-64 0.29 0.00 0.90 0.77
65+ 0.07 0.00 0.68 0.77
Sex and Mar. Status
Married males ref. 1.00 ref. 1.00
Married females 0.41 0.00 0.89 0.66
Widowed males 0.19 0.00 0.17 0.00
Widowed females 0.15 0.00 0.14 0.00
KÖZPONTI STATISZTIKAI HIVATALNÉPESSÉGTUDOMÁNYI KUTATÓINTÉZET
1149 Budapest, Angol u. 77.Tel.: (36 1) 251 0288, (36 1) 384 3167 Fax: (36 1) 383 3111
CENTRAL STATISTICAL OFFICEDEMOGRAPHIC RESEARCH INSTITUTE
N KI
NÉ
PE
SS
ÉG
TU
DO
MÁ
NY
I K U T A T Ó I N T É Z E T
RE
SE
AR
CH
IN
ST
ITU
TE
D E M O G R A P H I C
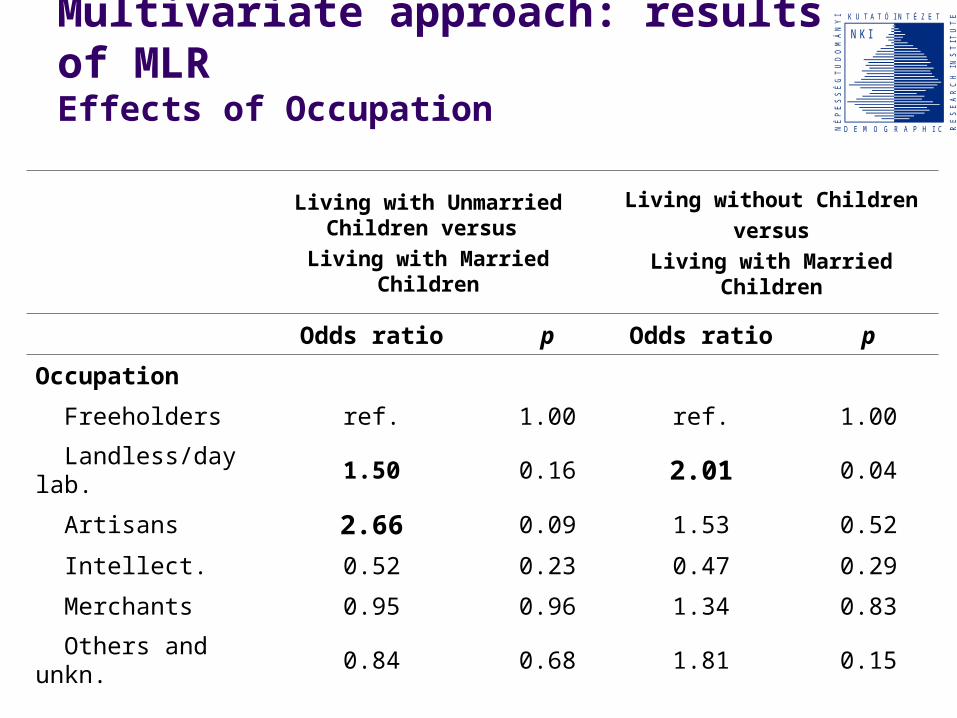
Multivariate approach: results of MLREffects of Occupation
Living with Unmarried Children versus
Living with Married Children
Living without Children
versus
Living with Married Children
Odds ratio p Odds ratio p
Occupation
Freeholders ref. 1.00 ref. 1.00
Landless/day lab. 1.50 0.16 2.01 0.04
Artisans 2.66 0.09 1.53 0.52
Intellect. 0.52 0.23 0.47 0.29
Merchants 0.95 0.96 1.34 0.83
Others and unkn. 0.84 0.68 1.81 0.15
KÖZPONTI STATISZTIKAI HIVATALNÉPESSÉGTUDOMÁNYI KUTATÓINTÉZET
1149 Budapest, Angol u. 77.Tel.: (36 1) 251 0288, (36 1) 384 3167 Fax: (36 1) 383 3111
CENTRAL STATISTICAL OFFICEDEMOGRAPHIC RESEARCH INSTITUTE
N KI
NÉ
PE
SS
ÉG
TU
DO
MÁ
NY
I K U T A T Ó I N T É Z E T
RE
SE
AR
CH
IN
ST
ITU
TE
D E M O G R A P H I C
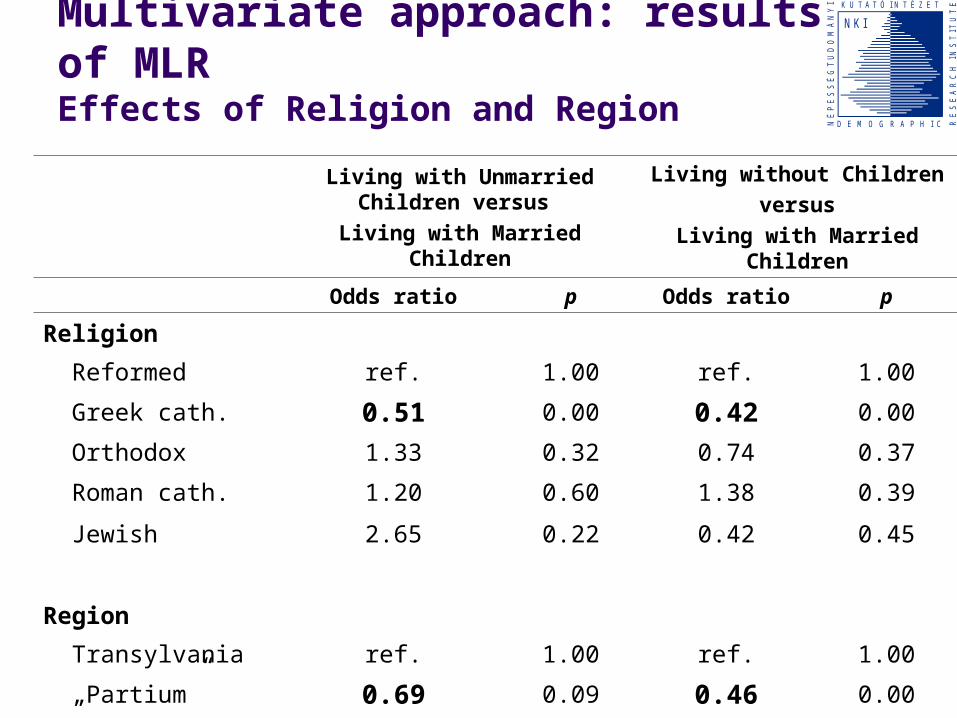
Multivariate approach: results of MLREffects of Religion and Region
Living with Unmarried Children versus
Living with Married Children
Living without Children
versus
Living with Married Children
Odds ratio p Odds ratio p
Religion
Reformed ref. 1.00 ref. 1.00
Greek cath. 0.51 0.00 0.42 0.00
Orthodox 1.33 0.32 0.74 0.37
Roman cath. 1.20 0.60 1.38 0.39
Jewish 2.65 0.22 0.42 0.45
Region
Transylvania ref. 1.00 ref. 1.00
„Partium” 0.69 0.09 0.46 0.00
KÖZPONTI STATISZTIKAI HIVATALNÉPESSÉGTUDOMÁNYI KUTATÓINTÉZET
1149 Budapest, Angol u. 77.Tel.: (36 1) 251 0288, (36 1) 384 3167 Fax: (36 1) 383 3111
CENTRAL STATISTICAL OFFICEDEMOGRAPHIC RESEARCH INSTITUTE
N KI
NÉ
PE
SS
ÉG
TU
DO
MÁ
NY
I K U T A T Ó I N T É Z E T
RE
SE
AR
CH
IN
ST
ITU
TE
D E M O G R A P H I C
Conclusions (questions and future developments)
The sample proved to be suitable for the analysis of residential arrangements of the elderly
Significant effects of age, sex and marital status and occupation
The interpretation of the effects of religion and region need further analysis: the consequence of different economic conditions or different value system?
The need for enlarging the actual sample for inter- and intra-regional comparative analysis
KÖZPONTI STATISZTIKAI HIVATALNÉPESSÉGTUDOMÁNYI KUTATÓINTÉZET
1149 Budapest, Angol u. 77.Tel.: (36 1) 251 0288, (36 1) 384 3167 Fax: (36 1) 383 3111
CENTRAL STATISTICAL OFFICEDEMOGRAPHIC RESEARCH INSTITUTE
N KI
NÉ
PE
SS
ÉG
TU
DO
MÁ
NY
I K U T A T Ó I N T É Z E T
RE
SE
AR
CH
IN
ST
ITU
TE
D E M O G R A P H I C

21
Thank you for your attention !